Embed Size (px)
Citation preview

1 | Program Name or Ancillary Text eere.energy.gov
Water Power Peer Review
Hydropower Advancement Project
CH 3.1.1.1
Brennan T. Smith
Oak Ridge National [email protected] 3, 2011

2 | Wind and Water Power Program eere.energy.gov
Purpose, Objectives, & Integration
• HAP Vision– Accelerated Improvement of U.S. Hydropower Asset
Performance and Value
• Prioritized DOE Objectives for the HAP1. Improved Estimate of Increased Energy Availability from US
Hydropower Assets
2. Identification of barriers to increased energy availability
3. Identification of DOE Hydropower Technology Research Priorities for Improved Asset Performance and Value
4. Development and Dissemination of Best Practices, Assessment, and Analysis Tools to Maximize US Hydropower Asset Performance and Value

3 | Wind and Water Power Program eere.energy.gov
Technical Approach
• High-Level Requirements for the HAP– Metrics and Targets for Hydropower Asset Condition and
Performance– Standardized Assessment Methodology and Tools used by
experienced hydropower professionals– Analyses and Trending of sampled facility results to
characterize the state of the U.S. hydropower inventory– Stakeholder Acceptance of Targets, Metrics, and Methods
• Key Concepts– Asset owners/operators are primary sources of quantitative and
qualitative information used in the assessments.– Anonymous Aggregated Reporting enables individual facilities to
compare their results to the collection of assessed facilities– No ranking of hydropower facilities!

4 | Wind and Water Power Program eere.energy.gov
Technical Approach – Roles
Request for Information to Hydropower Industry & StakeholdersSolicitation/Awards for Hydropower Facility AssessmentsContract & Deliverable Management for Awardees
HAP Team
DOE HQ - Overall Leadership & OutreachRajesh Dham, Project Leader
Michael Spray, Project Tracking
ORNL - Process Development & Technical Support
Brennan Smith, Technical Leader
Qin Fen Zhang, Process Development Lead
Postdoctoral Mechanical Engineer TBD - Efficiency & Reliability Analysis
Suresh Santhanvannan, Condition and Performance Database, NHAAP Linkages
Mesa & Associates - Condition Assessment Support
Hydro Performance Processes Inc. - Performance Assessment Support
Sentech/SRA-Oak Ridge - Web Support, Technical Editing, Workshop Support
Golden Field Office - Solicitations and Procurement
Best Practices Catalog Drafts (Components)Assessment Manual DraftComponent Condition Rating WorkbooksDemonstration Assessments (Condition)
Best Practices Catalog Drafts (Special)Performance Assessment Process DraftPlant UC/Load Allocation CalculatorDemonstration Assessments (Performance)

5 | Wind and Water Power Program eere.energy.gov
Technical Approach - Products
Phase I of the HAP will produce online documentation and tools to support the assessment process . . .
Best Practices Catalog
Assessment Manual•Process Guidance•Component Rating Workbooks•Performance Calculator
Hydropower Technology Taxonomy
Phase I Demonstration Assessment Reports•Center Hill•Rhodhiss•Flaming Gorge
. . . Phase II will produce reports that provide insight into the state of existing U.S.
hydropower assets Public Report of more than 50 Nationwide Assessments•Project configuration and assessment summaries •Overall and component-level trends in condition across many projects•Trends in water-use efficiency, constraints across many projects•Correlations between efficiency, condition, and production•Summary of opportunities for and barriers to upgrade/improvement
Underrevision
Non-Public Business-Sensitive Assessment Report Archive•Controlled by Non-Disclosure Agreements•Individual Project Performance and Condition Ratings•Project and Component Condition Database•Project Performance Database•Flow and Generation Data

6 | Wind and Water Power Program eere.energy.gov
Technical Approach
Hydropower Facility
1. Headwater/Reservoir
1.1 Siltation and Dredging Devices
1.2 Line Diffusers
1.3 Surface Water Pumps
2. Dam/Weir
2.1 Spillways/Weirs
2.2 Sluiceways/Low level Outlets
2.3 Non-Overflow Dams
2.4 Fish Passage
3. Water Conveyance
3.1 Intakes
3.2 Trash Racks
3.3 Penstocks/Tunnels
3.4 Flumes/Open Channels
3.5 Emergency Closure Gates/Valves
3.6 Draft Tube Gates
4. Powerhouse
4.1 Power Train Equipment
4.1.1 Turbine
4.1.1(a) Francis Turbine
4.1.1(b) Propeller/Kaplan Turbine
4.1.1(c) Pelton Turbine
4.1.2 Governor
Speed Sensing Devices
Control Devices
Power Amplification element (Servomotor)
4.1.3 Generator
Stator
Rotor
Generator Shaft
Thrust Bearing
Guide Bearings
Ventilation & Cooling system
Brakes and Jacks
4.1.4 Exciter
4.1.5 Transformer
4.1.6 Circuit Breakers
4.2 Balance of Plant/Auxiliary Components
4.3 Powerhouse Structures
5. Tail water6. Switch Yard 7. Navigation Locks
Hydropower Technology TaxonomyHydropower Facility
1. Headwater/Reservoir
1.1 Siltation and Dredging Devices
1.2 Line Diffusers
1.3 Surface Water Pumps
2. Dam/Weir
2.1 Spillways/Weirs
2.2 Sluiceways/Low level Outlets
2.3 Non-Overflow Dams
2.4 Fish Passage
3. Water Conveyance
3.1 Intakes
3.2 Trash Racks
3.3 Penstocks/Tunnels
3.4 Flumes/Open Channels
3.5 Emergency Closure Gates/Valves
3.6 Draft Tube Gates
4. Powerhouse
4.1 Power Train Equipment
4.1.1 Turbine
4.1.1(a) Francis Turbine
4.1.1(b) Propeller/Kaplan Turbine
Spiral Case
Stay Vanes
Stay ring
Wicket Gates
Runner Blades
Runner Hub without/with Blade Trunnion
Runner Cone
Discharge/Throat Ring
Draft Tube
Main Shaft
Head Cover
Guide Bearing
Mechanical Sealing
4.1.1(c) Pelton Turbine
4.1.2 Governor
Speed Sensing Devices
Control Devices
Power Amplification element (Servomotor)
4.1.3 Generator
Stator
Rotor
Generator Shaft
Thrust Bearing
Guide Bearings
Ventilation & Cooling system
Brakes and Jacks
4.1.4 Exciter
4.1.5 Transformer
4.1.6 Circuit Breakers
4.2 Balance of Plant/Auxiliary Components
4.2.1 Instruments & Controls
4.2.2 Powerhouse Crane
4.2.3 Station Power System
4.2.4 Compressed Air System4.2.5 Raw Water (Cooling) System4.2.6 Lubrication System 4.2.7 Drainage & Dewatering System
4.2.8 Fire Protection
4.2.9 Potable Water System
4.2.10 Drainage and Dewatering System
4.2.11 HVAC
4.3 Powerhouse Structures 5. Tail water6. Switch Yard7. Navigation Locks• Provides physical and functional
hierarchy for Best Practices, Ratings, and Component Condition Database
• Standardization of scoring is key to meaningful analyses and trending
• Provides consistent nomenclature for facility characterization, reporting and team/assessor communication
• Color-coded to indicate HAP coverage and Corps/Reclamation HydroAMP alignment
Hydropower Facility
1. Headwater/Reservoir
1.1 Siltation and Dredging Devices
1.2 Line Diffusers
1.3 Surface Water Pumps
2. Dam/Weir
2.1 Spillways/Weirs
2.2 Sluiceways/Low level Outlets
2.3 Non-Overflow Dams
2.4 Fish Passage
3. Water Conveyance
3.1 Intakes
3.2 Trash Racks
3.3 Penstocks/Tunnels
3.4 Flumes/Open Channels
3.5 Emergency Closure Gates/Valves
3.6 Draft Tube Gates
4. Powerhouse
4.1 Power Train Equipment
4.1.1 Turbine
4.1.1(a) Francis Turbine
4.1.1(b) Propeller/Kaplan Turbine
Spiral Case
Stay Vanes
Stay ring
Wicket Gates
Runner Blades
Runner Hub without/with Blade Trunnion
Runner Cone
Discharge/Throat Ring
Draft Tube
Main Shaft
Head Cover
Guide Bearing
Mechanical Sealing
4.1.1(c) Pelton Turbine
4.1.2 Governor
Speed Sensing Devices
Control Devices
Power Amplification element (Servomotor)
4.1.3 Generator
Stator
Rotor
Generator Shaft
Thrust Bearing
Guide Bearings
Ventilation & Cooling system
Brakes and Jacks
4.1.4 Exciter
4.1.5 Transformer
4.1.6 Circuit Breakers
4.2 Balance of Plant/Auxiliary Components
4.2.1 Instruments & Controls
4.2.2 Powerhouse Crane
4.2.3 Station Power System
4.2.4 Compressed Air System4.2.5 Raw Water (Cooling) System
4.2.6 Lubrication System4.2.7 Drainage & Dewatering System4.2.8 Fire Protection4.2.9 Potable Water System4.2.10 Drainage and Dewatering System4.2.11 HVAC
4.3 Powerhouse Structures
5. Tail w ater
6. Switc h Yard
7. Navig ation Locks

7 | Wind and Water Power Program eere.energy.gov
Technical Approach
Best Practices Catalog (BPC)•Concepts
Functional requirements Typical configurations for components Efficiency role of components Reliability role of components Concise history of technological evolution State-of-the-art for components Brief summary of component material and
manufacturing constraints Typical O&M requirements References to testing protocols
•Components covered Turbines (Francis, Propeller, Pelton) Generators Conveyances Main Transformers Trash Racks Instrumentation and controls for condition
monitoring Instrumentation and controls for automation
•Special Topics Uncontrolled water leakage Flow releases Operational impacts of environmental
mitigation systems
Condition Rating Workbooks•Excel Workbook files
User (assessor) fields to enter component scoring
Predefined rating scales for ease of use and consistency among different assessors
Automated roll-up with weighting factors from partscomponentsunitsfacility aggregate scores
Help files and field provide additional guidance
•Components covered Turbines (Francis, Propeller, Pelton) Generators Conveyances Main Transformers Trash Racks Instrumentation and controls (condition
monitoring and Automation)
•Rating structure Component specific weighting factors for
parts (e.g. wicket gates, head cover, shaft, …)
Weighted scores for Age, Physical Condition, Technology Level, Operating Impact, and Maintenance Demands

8 | Wind and Water Power Program eere.energy.gov
Technical Approach
HAP Performance Levels & Assessment
1940’s Francis Technology
Retrofit withhub baffle aeration
Computationally engineered auto-aerating turbine
80% < < 88%
75% < < 85%
85% < < 92%
Wear & TearWQ Mitigation
Upgrade
Installed Performance Level (IPL)
Current Performance Level (CPL)
Potential Performance Level (PPL)
Turbine Component Example from Plant X Unit Y
What about performance in terms of reliability?

9 | Wind and Water Power Program eere.energy.gov
Technical Approach
Plant Performance CalculatorUsed to establish long-term (M>>8760) production potential baseline under assumption of flexible unit commitment, perfect dispatch, and scenarios of (installed, current, potential) unit efficiencies
Currently Excel-based solver implementation, but will leverage Optimization Toolbox solver in the future.
Performance Assessment

10 | Wind and Water Power Program eere.energy.gov
Plan, Schedule, & Budget
Schedule• Initiation date: March 2010• Planned completion dates:
– Phase I – Process Development – Dec 2011– Phase II – Nationwide Assessments – Dec 2012– Phase III – Upgrade Feasibility Studies – TBD, contingent on funding
• Milestones:– Draft BPC and Assessment Manual – Sep 2011 (delayed, but near complete)– Demo Assessments at Center Hill and Rhodhiss - Field Reports Complete
Sep 2011– Flaming Gorge Demo Assessment delayed pending Reclamation approvals– Request for Info to Industry with BPC & Manual Publication – November 2011– Assessment Team solicitation issued – February 2012 – Assessment Awards – April 2012– Training Workshop – May 2012– Assessments Completed – Sep 2012– Analysis and Reporting – Dec 2012

11 | Wind and Water Power Program eere.energy.gov
Plan, Schedule, & Budget
Phase I Phase I Phase IIFY10-11 FY12 FY12
Expenditures Estimate Estimate
ORNL $820K $125K $960K--Mesa $450K $500K* $220K--HPPi $125K $50K $130K--Sentech $404K $50K $50K
Assessment Awards $2,500KTOTALS $1,799K $725K $3,860K
TOTAL PHASE I & II FY10-FY12 $6,384KBudget History
FY2009 FY2010 FY2011
DOE Cost-share DOE Cost-share DOE Cost-share
0 0 $3,285,000 0 $1,915,000 0**
*includes Flaming Gorge Demo Estimate
**USACE-Nashville and Duke Energy provided in-kind support to host Center Hill and Rhodhiss demos, respectively, and provided historical operations data.
12 | Wind and Water Power Program eere.energy.gov
Accomplishments and Results
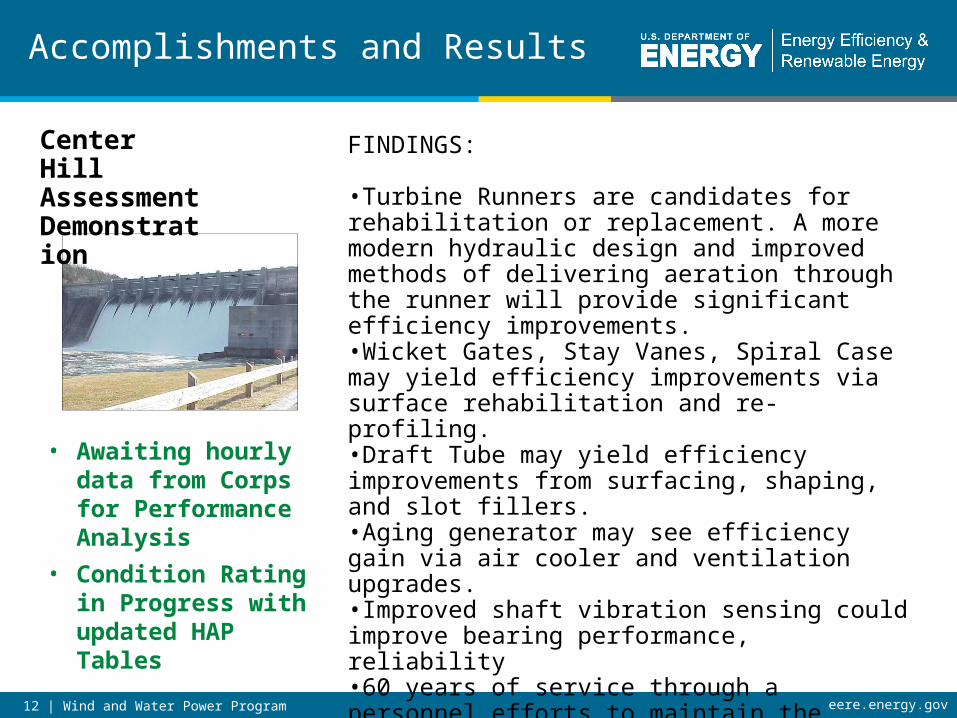
FINDINGS:
•Turbine Runners are candidates for rehabilitation or replacement. A more modern hydraulic design and improved methods of delivering aeration through the runner will provide significant efficiency improvements.•Wicket Gates, Stay Vanes, Spiral Case may yield efficiency improvements via surface rehabilitation and re-profiling.•Draft Tube may yield efficiency improvements from surfacing, shaping, and slot fillers.•Aging generator may see efficiency gain via air cooler and ventilation upgrades.•Improved shaft vibration sensing could improve bearing performance, reliability•60 years of service through a personnel efforts to maintain the plant. 1950’s technology in general could be improved for better efficiency and reliability.
Center Hill Assessment Demonstration
• Awaiting hourly data from Corps for Performance Analysis
• Condition Rating in Progress with updated HAP Tables

13 | Wind and Water Power Program eere.energy.gov
Accomplishments and Results
FINDINGS:
•Improved hydraulic design and aeration through the turbine runner may provide significant efficiency improvements. •86 year-old cast iron runners (Units 1 and 3) are expected to be at the end of their service life, and are candidates for replacement. •Stay vanes may see efficiency improvement via surface rehabilitation and re-profiling.•Some efficiency improvements from draft tube modifications, but slot fillers are not applicable (no gates)•1920’s technology (e.g. cast iron runners) still in use--opportunities at Rhodhiss to use updated technology to not only improve unit efficiency and performance but also reliability.
Rhodhiss Assessment Demonstration
• Performance Analysis in progress
• Condition Rating in Progress with updated HAP Tables

14 | Wind and Water Power Program eere.energy.gov
Challenges to Date
• Industry Priorities:– Asset managers are focused on reliability. Separating efficiency
from reliability is not credible. What is appropriate DOE role?– Industry focuses on licensing challenges—upgrades are always
controlled by licensing risk management more than efficiency cost-benefit
– Capital allocation—incremental hydropower does not compete well with large chunks of baseload capacity expansion or quick-payback flexible gas-fired generation.
• Lessons learned– HAP will need to address absence of monitoring data and estimate
value of monitoring– Asset management and operations staff are aware of conditions and
upgrade opportunities—HAP focus should allow for interview/cataloging as much as direct inspection.
– Hydropower operations data for performance assessment may have longer lead time than anticipated

15 | Wind and Water Power Program eere.energy.gov
Next Steps
FY12 Next Steps• RFI issue Nov 2011 to gather feedback on proposed assessment—
consider alternative procurement methods• Technical Expert Review of BPC and Manuals
– Enhanced collaboration of Corps and Reclamation to leverage HydroAMP and HMI experience for non-federal assets
• Resolve process for performance assessment on many assets—individual assessments or core team assessments?
Additional Opportunities• Apply performance and condition assessment to FY10 ARRA-funded
upgrade projects• Apply performance and condition assessment to multiple projects in
Optimization Toolset Demos• Interface with industry initiatives for operational excellence• Long-term program for collaborative benchmarking based on HAP
database