Embed Size (px)
Citation preview

1
No Child Left BehindCritical Research Findings
For School Boards
Ronald Dietel
UCLA Graduate School of Education & Information Studies
National Center for Research on Evaluation, Standards, and Student Testing (CRESST)
December 2, 2005 California School Boards
AssociationSan Diego, CA

2
NCLB Overview-Part 1
Annual state testing in language arts and mathematics, grades 3-8 plus one grade in high school. By 2007-08, science must be tested in one grade each in elementary, middle, and high school.
95% participation rates of each subgroup
Mandatory state NAEP participation (every two years in math and reading)
Adequate Yearly Progress, includes subgroups meeting minimum group size by race, disadvantaged, English language learners, and special education students
State flexibility, may use their own standards and tests, flexible minimum subgroup size, many different AYP variations have been approved

3
NCLB Overview-Part 2
Sanctions
Failure to meet AYP for two years requires supplemental educational services such as tutoring or transfer to other district school
Failure a third year requires stronger corrective action such as removing staff, implementing new curriculum, outside experts, restructuring
A School is removed from a “needs improvement list” if it makes AYP for two consecutive years
Only Title 1 schools subject to sanctions
Political Atmosphere
States had responded slowly to earlier ESEA laws
NCLB had strong bipartisan support, Senate approved 87-10; House 381-41
Virtually no research conducted to determine feasibility of NCLB goals

4
California’s NCLB Overview
AYP Criteria defined in August 2005 CDE NCLB Workbook
A school or LEA may need to meet 46 different criteria in order to make AYP.
Primary performance measure is the California Standards Test; API is an additional measure as well as the high school graduation rate.
California selected a path designed to identify the fewest number of schools and districts in need of improvement while minimizing changes to the current STAR accountability system.

5
California’s Backloaded AYP Trajectory English-Language Arts
Source-CDE 2005 Accountability Progress Report
6
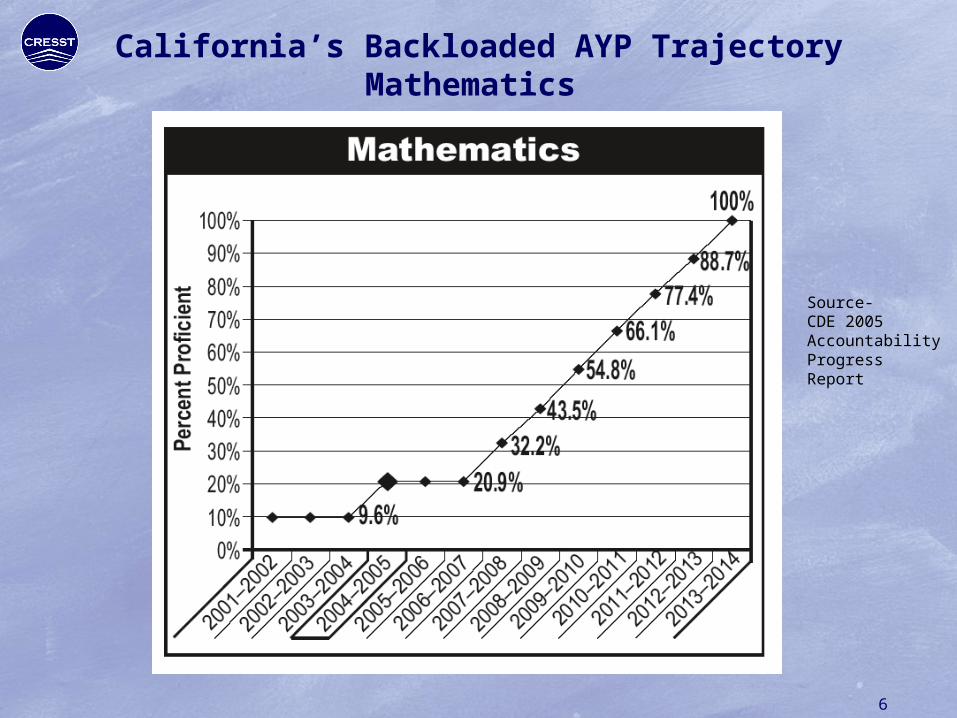
California’s Backloaded AYP TrajectoryMathematics
Source-CDE 2005 Accountability Progress Report

7
California’s Backloaded AYP TrajectoryGraduation Rate
Source-CDE 2005 Accountability Progress Report

8
California Makes Decisions to Minimize Schools in Need of Improvement
Minimum of 100 valid test scores for subgroups
Backloaded trajectory
Confidence Intervals (applies a 75% confidence interval to safe harbor provision).

9
Critical Research Findings
State standards, tests, and achievement levels are not comparable
Teachers adjust their approach according to what is assessed
Scores are usually low on new state tests. As districts and teachers adjust instruction, scores improve, but eventually level off
Schools usually focus on the test more so than on the standards
What is not tested becomes less visible, social studies, the arts, etc.
Tests are not perfect and are oftentimes used improperly
Reliability decreases with fewer numbers of students
Classroom assessment and grading practices are uneven and often of low quality

10
Tests Drive Teaching…
Source-Herman and Golan
CRESST Report 334
Effects of Standardized Testing on Teachersand Learning—Another Look

11
Tests Drive Instruction…
Source-Herman and Golan
CRESST Report 334
Effects of Standardized Testing on Teachersand Learning—Another Look

12
But, Tests Do Not Necessarily Increase Learning
California Performance on the
2005 National Assessment of Educational Progress
Source-Education Trust-West
Grade & Subject California ranking-All 50 states+DC
4th Grade Math 44
8th Grade Math 44
4th Grade Reading 48
8th Grade Reading 49

13
Despite 8 years of STAR & 4 Years of NCLB Long Term California NAEP Performance is Flat
NAEP MathematicsPercent Proficient or Advanced
1998 2002 2003 2005
Grade 4 Nation 28 30 30 30
Grade 4 California 20 21 21 21
Grade 8 Nation 30 31 30 29
Grade 8 California 21 20 22 21

14
100% Proficiency is Unrealistic Goal
2005 California Standards TestPercent Students Proficient or Above
Student Type
6th grade Reading
6th grade math
7th grade reading
7th grade math
Lower All students
22 25 28 26
Performing
School
ELL 5 13 6 13
Special needs
4 2 4 4
Very High
Performing
School
All students
83 87 91 89
ELL 46 85 25 42
Special needs
42 44 47 41

15
Other Measures Support NAEP Results
California's CAT/6 Results 2003-2005All Students, Reading
39 39 40
45 45 46
0
10
20
30
40
50
60
70
80
90
2003 2004 2005
Year
Percentile Rank
3rd Grade
7th Grade

16
Small or No Improvement
California's CAT/6 Results 2003-2005All Students, Math
55 56 57
45 4648
0
10
20
30
40
50
60
70
80
90
2003 2004 2005
Year
Percentile Rank
3rd Grade
7th Grade

17
ELL Performance is Flat in Reading
California's CAT/6 Results 2003-2005English Language Learners, Reading
22 2224
18 17 17
0
10
20
30
40
50
60
70
80
90
2003 2004 2005
Year
Percentile Rank
3rd Grade
7th Grade

18
ELL Performance in Math is Flat or Declining
California's CAT/6 Results 2003-2005 English Language Learners, Math
40 40
26
21 21 21
0
10
20
30
40
50
60
70
80
90
2003 2004 2005
Year
Percentile Rank
3rd Grade
7th Grade

19
Special Needs Reading Performance
California's CAT/6 Results 2003-2005 Special Needs Students, Reading
21 20 20
15 15 16
0
10
20
30
40
50
60
70
80
90
2003 2004 2005
Year
Percentile Rank
3rd Grade
7th Grade

20
Special Needs Mathematics Performance
California's CAT/6 Results 2003-2005 Special Needs Students, Math
29 2931
14 15 16
0
10
20
30
40
50
60
70
80
90
2003 2004 2005
Year
Percentile Rank
3rd Grade
7th Grade

21
Other States and Districts Are Not on Target to Reach 100% Proficiency
Massachusetts Comprehensive Assessment System, 10th Grade Language Arts

22
Other Important Things to Know
States are working with the U.S. Department of Education to delay NCLB consequences to schools
ESEA is scheduled for reauthorization in 2007

23
What Your School District and Board Can Do
Focus On Teachers and Teaching

24
What Else Your School District and Board Can Do
Be realistic about test scores gains and the feasibility of all schools and all subgroups making AYP
Develop quality district assessments
Improve student assignments and grading practices
Make improved data use a key goal, provide resources to make it happen
Work cooperatively as a board, superintendent, and district

25
Resources
Your Own District Staff
EdSource -- www.edsource.org
CRESST.org -- National Center for Research on Evaluation, Standards, and Student Testing
WestEd.org -- Regional laboratory and future home of the new “Accountability and Assessment Comprehensive Center”