Embed Size (px)
Citation preview

1
Lesson 6.2.5Lesson 6.2.5
Venn DiagramsVenn Diagrams

2
Lesson
6.2.5Venn DiagramsVenn Diagrams
California Standard:Statistics, Data Analysis and Probability 3.1Represent all possible outcomes for compound events in an organized way (e.g., tables, grids, tree diagrams) and express the theoretical probability of each outcome.
What it means for you:You’ll learn about Venn diagrams, which are useful in helping you to understand how different events relate to each other.
Key words:• Venn Diagram• outcome• event
3
Venn DiagramsVenn DiagramsLesson
6.2.5
It’s often tricky to figure out in your head how different events and outcomes are related.
A Venn diagram is a way to show how different events are related, and they can make probabilities easier to visualize.

4
Event A
Event B
Venn DiagramsVenn Diagrams
A Venn Diagram is a Way to Represent Events
Lesson
6.2.5
One outcome will often match more than one event.
You can show situations where one or more outcomes match more than one event using a Venn diagram.
The next example should make the usefulness of a Venn diagram clearer.
The area where two circles overlap contains
all the outcomes that match both events.
All the possible outcomes are inside the rectangle.
The circles represent events. All the outcomes that match an event are inside that event’s circle.
5
Venn DiagramsVenn Diagrams
Example 1
Lesson
6.2.5
Solution
Solution follows…
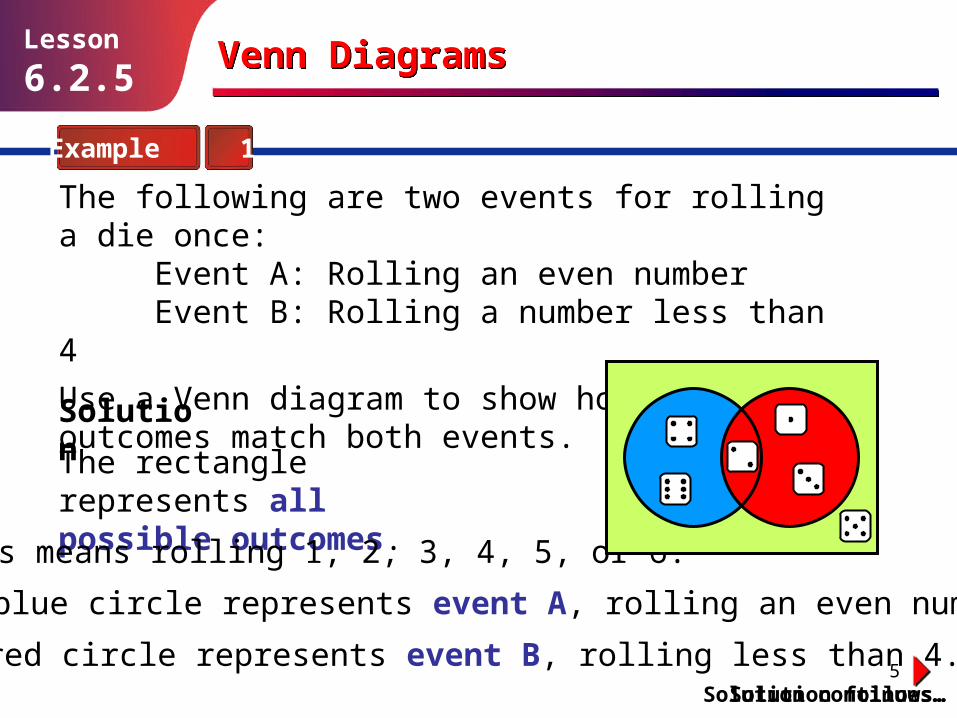
The following are two events for rolling a die once:Event A: Rolling an even numberEvent B: Rolling a number less than 4
Use a Venn diagram to show how many outcomes match both events.
The rectangle represents all possible outcomes.
This means rolling 1, 2, 3, 4, 5, or 6.
The blue circle represents event A, rolling an even number.
The red circle represents event B, rolling less than 4.Solution continues…

6
Venn DiagramsVenn Diagrams
Example 1
Lesson
6.2.5
Solution (continued)
The following are two events for rolling a die once:Event A: Rolling an even numberEvent B: Rolling a number less than 4
Use a Venn diagram to show how many outcomes match both events.
The outcome “rolling a 2” is in both circles. The circles have to overlap, so that 2 is in both at the same time.
There is 1 outcome that matches both event A and event B.
There is also 1 outcome (5) that matches neither event A nor event B.

7
Venn DiagramsVenn Diagrams
Guided Practice
Solution follows…
Lesson
6.2.5
Andres picks a card from a standard pack.Event A is “picking a spade.” Event B is “picking an ace.”
In which section of this Venn diagram do the following outcomes belong?
1. Ace of clubs
2. King of hearts
3. Ace of spades
4. Three of spades
1 2 3 4
A B4 – matches event B
1 – doesn’t match A or B
3 – matches A and B
2 – matches event A
8
Venn DiagramsVenn Diagrams
Guided Practice
Solution follows…
Lesson
6.2.5
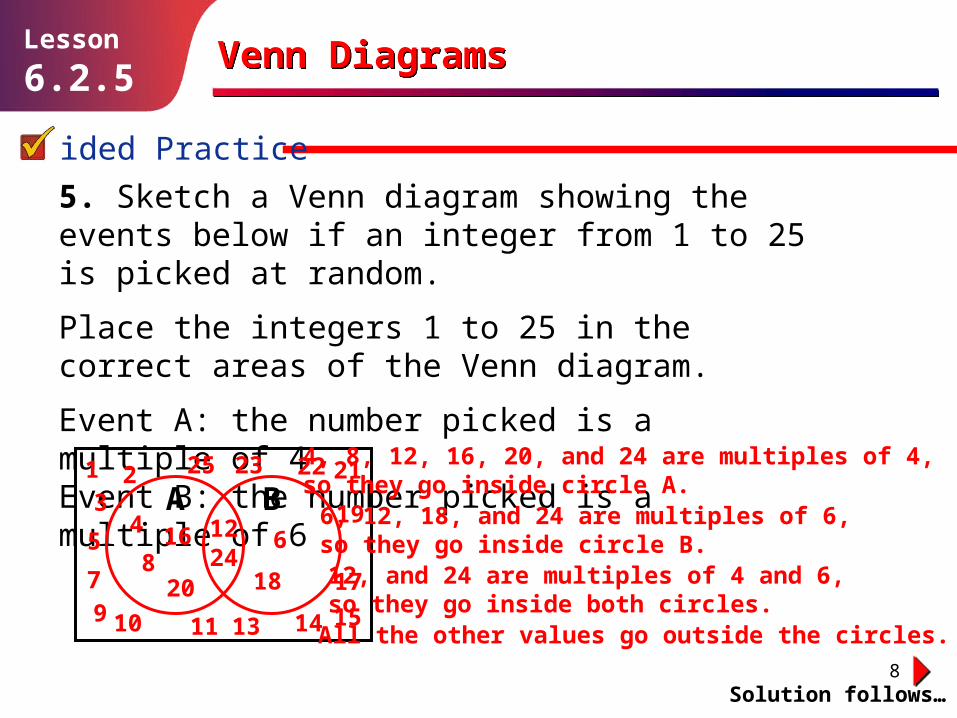
5. Sketch a Venn diagram showing the events below if an integer from 1 to 25 is picked at random.
Place the integers 1 to 25 in the correct areas of the Venn diagram.
Event A: the number picked is a multiple of 4Event B: the number picked is a multiple of 6
A B6
18
4
8
1216
2024
19
1 23
5
79 11 13 14 15
17
21222325
10
4, 8, 12, 16, 20, and 24 are multiples of 4, so they go inside circle A. 6, 12, 18, and 24 are multiples of 6, so they go inside circle B. 12, and 24 are multiples of 4 and 6, so they go inside both circles. All the other values go outside the circles.

9
Venn DiagramsVenn Diagrams
The Circles on a Venn Diagram Don’t Always Overlap
Lesson
6.2.5
Venn diagrams can show some other situations.
A B
AB
Some outcomes match A, but not B.
The circles don’t overlap at all if no outcomes match both event A and event B.
In this diagram, all the outcomes matching event B
also match event A.

10
Venn DiagramsVenn Diagrams
Example 2
Lesson
6.2.5
Solution
Solution follows…
Draw a Venn diagram showing the following events for rolling one die:
Event A: Rolling an even numberEvent B: Rolling an odd number
Outcomes 2, 4, and 6 match event A.
Outcomes 1, 3, and 5 match event B.
No outcomes match both events, so the circles don’t overlap.
A B

11
B
Venn DiagramsVenn Diagrams
Example 3
Lesson
6.2.5
Solution
Solution follows…
Draw a Venn diagram showing the following events for rolling one die:
Event A: Rolling an odd numberEvent B: Rolling less than 6
Outcomes 1, 3, and 5 match event A.
Outcomes 1, 2, 3, 4, and 5 match event B.
All the outcomes matching event A also match event B. The circle representing event A is completely inside the one for event B.
A
Outcome 6 does not match either event.

12
Venn DiagramsVenn Diagrams
Guided Practice
Solution follows…
Lesson
6.2.5
Use the Venn diagrams below to answer Exercises 6–8
Which diagram could show each of the following pairs of events for picking a number at random from 1 to 100?
6. Event A: odd Event B: even
7. Event A: less than 50 Event B: even
8. Event A: less than 50 Event B: less than 20
2.A B
4.
A
B3.
B
A1.
A B
2 – a number cannot be odd and even
1 – some numbers match only one event and some match both events
3 – all numbers that match event B also match event A
13
Venn DiagramsVenn Diagrams
Guided Practice
Solution follows…
Lesson
6.2.5
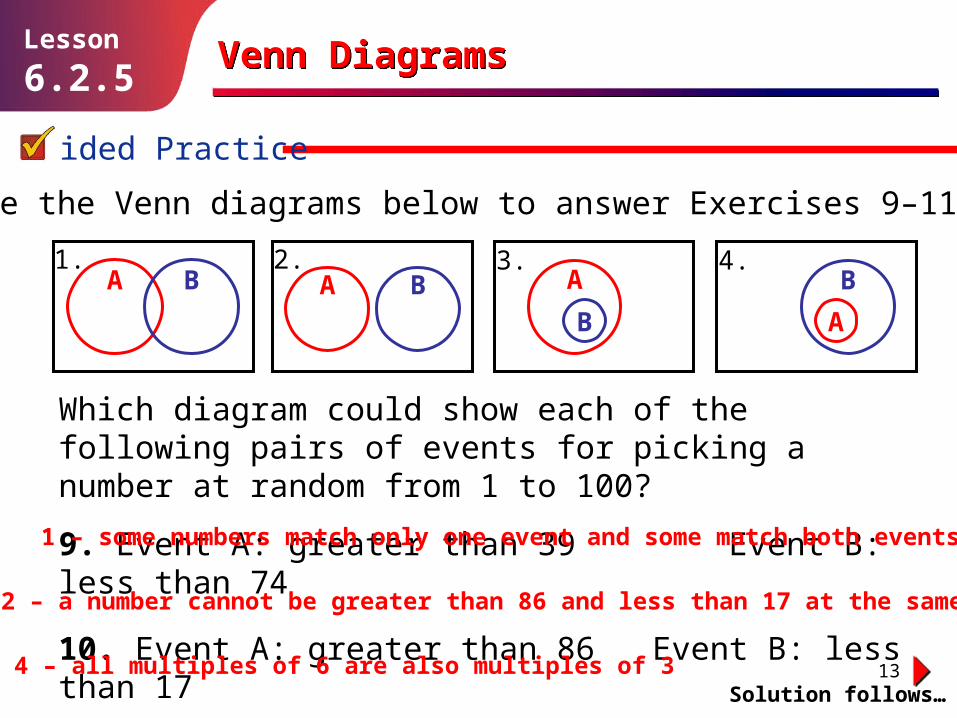
Use the Venn diagrams below to answer Exercises 9–11
Which diagram could show each of the following pairs of events for picking a number at random from 1 to 100?
9. Event A: greater than 39 Event B: less than 74
10. Event A: greater than 86 Event B: less than 17
11. Event A: a multiple of 6 Event B: a multiple of 3
2.A B
4.
A
B3.
B
A1.
A B
1 – some numbers match only one event and some match both events
2 – a number cannot be greater than 86 and less than 17 at the same time
4 – all multiples of 6 are also multiples of 3

14
Venn DiagramsVenn Diagrams
Independent Practice
Solution follows…
Lesson
6.2.5
This Venn diagram shows two events when a number from 1 through 20 is chosen at random. Use it to answer Exercises 1–4.
Find how many outcomes match:
1. event A
2. event B
3. both event A and event B
4. at least one of events A and B
10
6
3
13
1 2 3
4
A B5
6
78
9
11
13
12
14
15
17
16
191820
10

15
Venn DiagramsVenn Diagrams
Independent Practice
Solution follows…
Lesson
6.2.5
This Venn diagram shows two events when a number from 1 through 20 is chosen at random. Use it to answer Exercises 5–6.
5. Which of these could be event A:A. multiple of 4B. number less than 16C. even number
6. Which of these could be event B:A. multiple of 3B. number less than 18C. odd number
1 2 3
4
A B5
6
78
9
11
13
12
14
15
17
16
191820
10

16
Sketch Venn diagrams for the following pairs of events. Place the integers from 1 to 12 in the correct areas of the Venn Diagram.
7. Event A: choosing an odd number Event B: choosing a multiple of 4
8. Event C: choosing a number less than 6 Event D: choosing a prime number
9. Event E: choosing a number greater than 4 Event F: choosing a multiple of 5
123
4
C D
5
6
7
8
9
11
1210
1
2
34
A B5
6
78
9
11
12
10
Venn DiagramsVenn Diagrams
Independent Practice
Solution follows…
Lesson
6.2.5
1
2
3
4
E6 7
8 9
1112
F5 10
7.8.9.

17
Venn DiagramsVenn DiagramsLesson
6.2.5
Round UpRound Up
Venn diagrams often don’t give enough information on their own to figure out probabilities, but they can still be useful.
In the next Lesson, you’ll see that when you combine events, a Venn diagram can help you to understand the situation better.