Embed Size (px)
Citation preview
1
Lecture 20: WSC, Datacenters
• Topics: warehouse-scale computing and datacenters (Sections 6.1-6.7) – the basics
followed by a look at the future
2
Warehouse-Scale Computer (WSC)
• 100K+ servers in one WSC
• ~$150M overall cost
• Requests from millions of users (Google, Facebook, etc.)
• Cloud Computing: a model where users can rent compute and storage within a WSC, there’s an associated service-level agreement (SLA)
• Datacenter: a collection of WSCs in a single building, possibly belonging to different clients and using different hardware/architecture (note some won’t agree with this)
3
Workloads
• Typically, software developed in-house – MapReduce, BigTable, etc.
• MapReduce: embarrassingly parallel operations performed on very large datasets, e.g., search on a keyword, aggregate a count over several documents
• Hadoop is an open-source implementation of the MapReduce framework; makes it easy for users to write MapReduce programs without worrying about low-level task/data management
4
MapReduce
• Application-writer provides Map and Reduce functions that operate on key-value pairs
• Each map function operates on a collection of records; a record is (say) a webpage or a facebook user profile
• The records are in the file system and scattered across several servers; thousands of map functions are spawned to work on all records in parallel • The Reduce function aggregates and sorts the results produced by the Mappers, also performed in parallel
5
MR Framework Duties
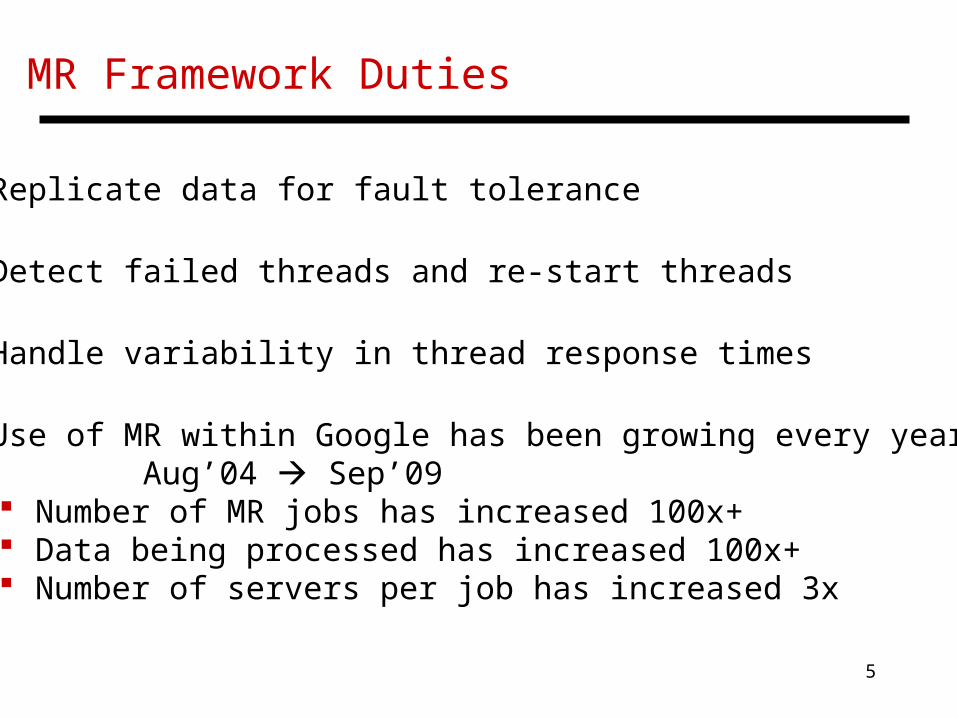
• Replicate data for fault tolerance
• Detect failed threads and re-start threads
• Handle variability in thread response times
• Use of MR within Google has been growing every year: Aug’04 Sep’09
Number of MR jobs has increased 100x+ Data being processed has increased 100x+ Number of servers per job has increased 3x
6
WSC Hierarchy
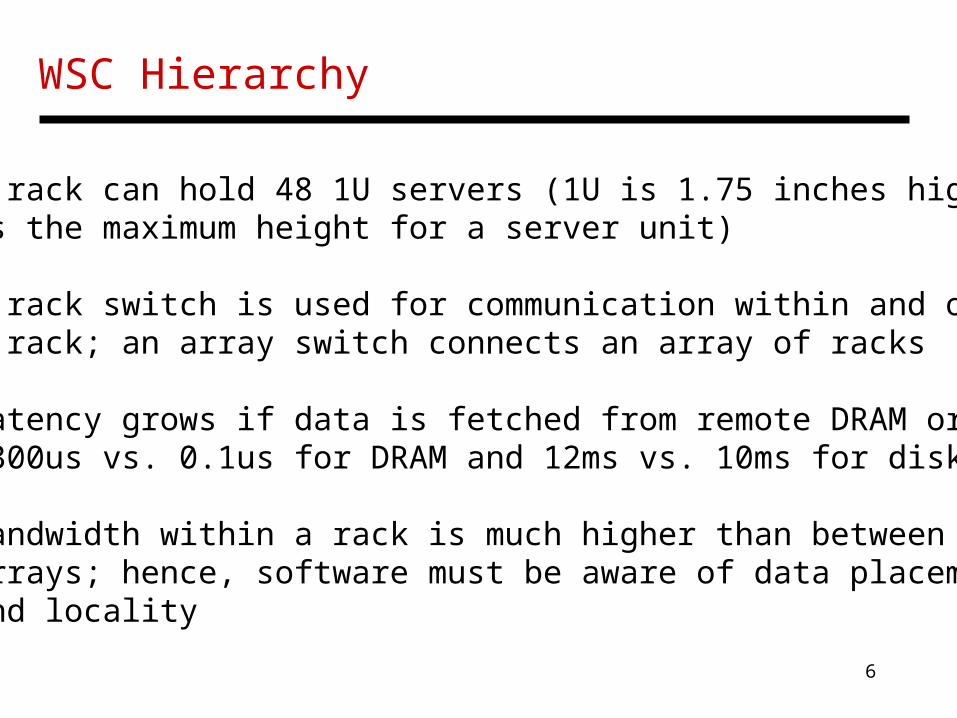
• A rack can hold 48 1U servers (1U is 1.75 inches high and is the maximum height for a server unit)
• A rack switch is used for communication within and out of a rack; an array switch connects an array of racks • Latency grows if data is fetched from remote DRAM or disk (300us vs. 0.1us for DRAM and 12ms vs. 10ms for disk )
• Bandwidth within a rack is much higher than between arrays; hence, software must be aware of data placement and locality
7
Power Delivery and Efficiency
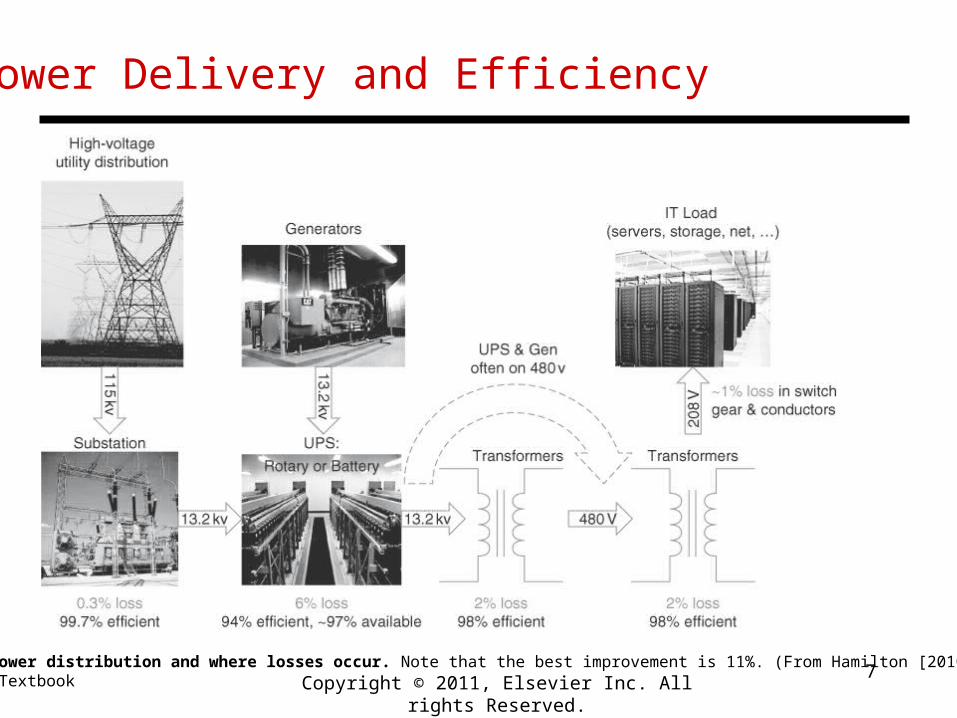
Figure 6.9 Power distribution and where losses occur. Note that the best improvement is 11%. (From Hamilton [2010].)Source: H&P Textbook Copyright © 2011, Elsevier Inc. All rights Reserved.
8
PUE Metric and Power Breakdown
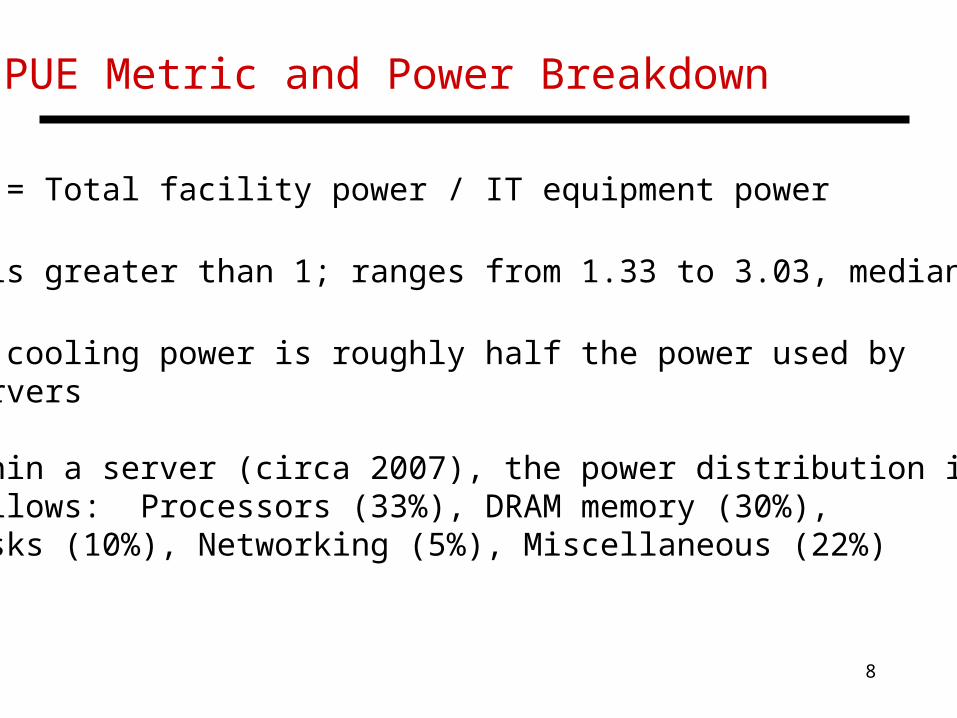
• PUE = Total facility power / IT equipment power
• It is greater than 1; ranges from 1.33 to 3.03, median of 1.69
• The cooling power is roughly half the power used by servers
• Within a server (circa 2007), the power distribution is as follows: Processors (33%), DRAM memory (30%), Disks (10%), Networking (5%), Miscellaneous (22%)
9
CapEx and OpEx
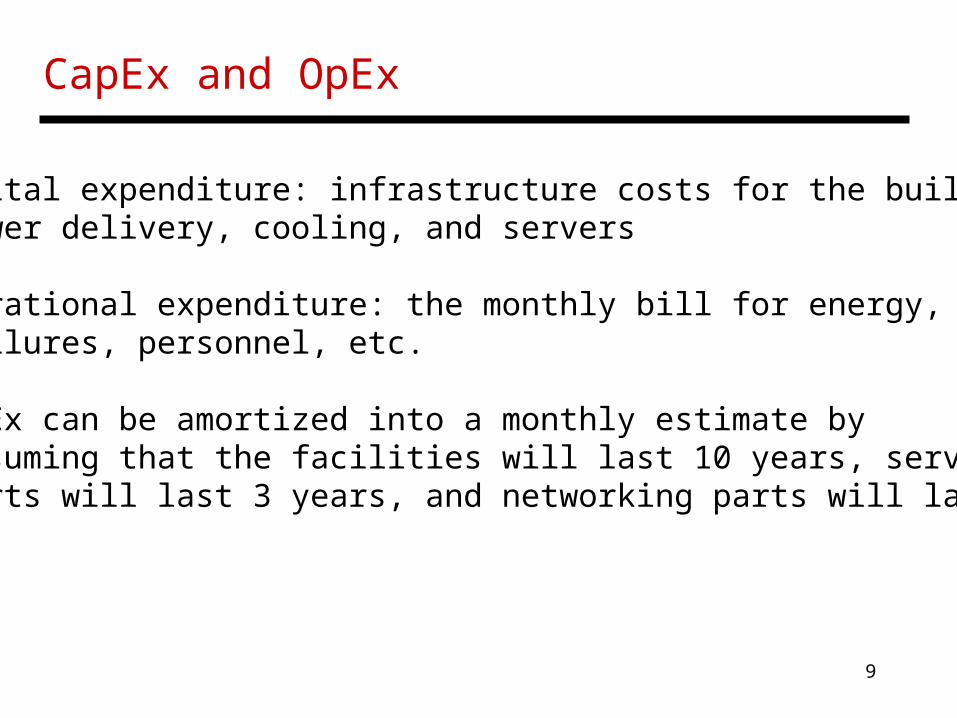
• Capital expenditure: infrastructure costs for the building, power delivery, cooling, and servers
• Operational expenditure: the monthly bill for energy, failures, personnel, etc.
• CapEx can be amortized into a monthly estimate by assuming that the facilities will last 10 years, server parts will last 3 years, and networking parts will last 4
10
CapEx/OpEx Case Study
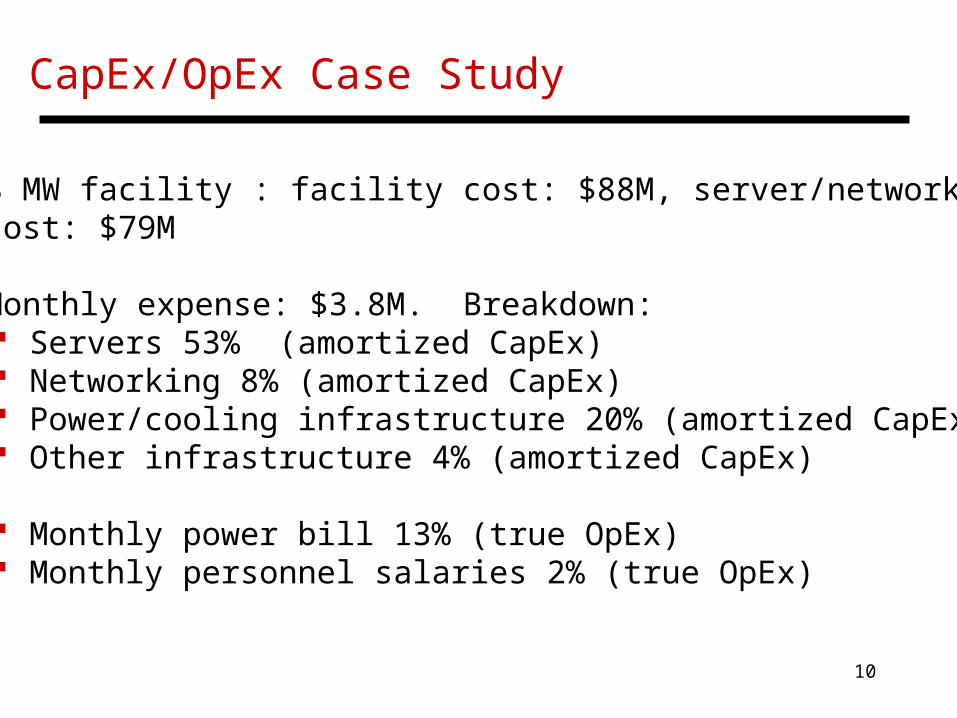
• 8 MW facility : facility cost: $88M, server/networking cost: $79M
• Monthly expense: $3.8M. Breakdown: Servers 53% (amortized CapEx) Networking 8% (amortized CapEx) Power/cooling infrastructure 20% (amortized CapEx) Other infrastructure 4% (amortized CapEx)
Monthly power bill 13% (true OpEx) Monthly personnel salaries 2% (true OpEx)
11
Improving Energy Efficiency
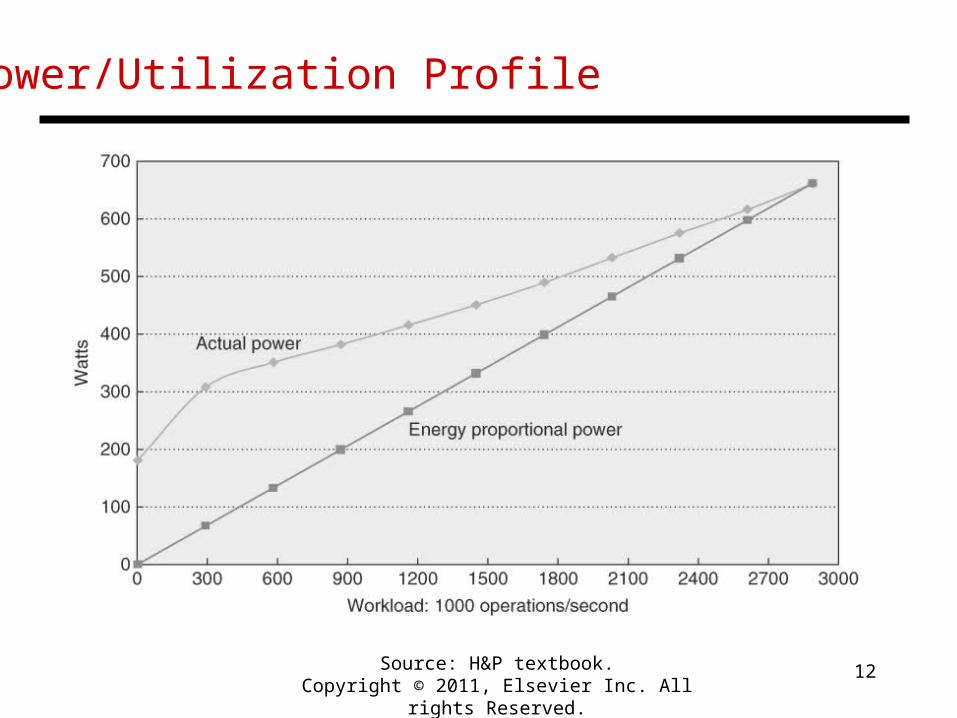
• An unloaded server dissipates a large amount of power
• Ideally, we want energy-proportional computing, but in reality, servers are not energy-proportional
• Can approach energy-proportionality by turning on a few servers that are heavily utilized
• See figures on next two slides for power/utilization profile of a server and a utilization profile of servers in a WSC
12
Power/Utilization Profile
Source: H&P textbook.Copyright © 2011, Elsevier Inc. All rights Reserved.
13
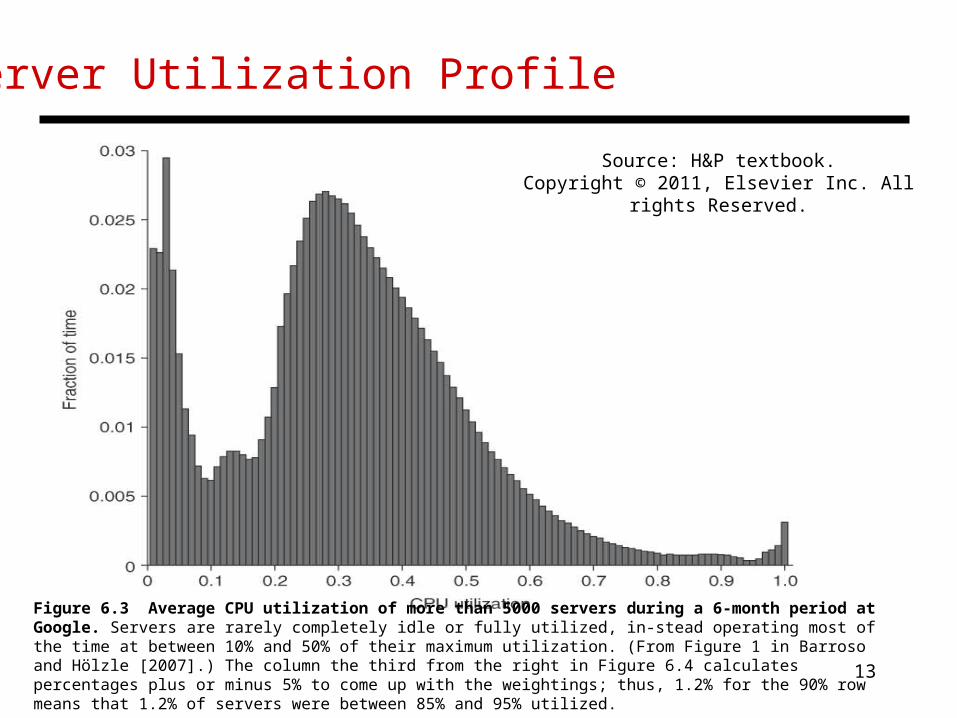
Server Utilization Profile
Figure 6.3 Average CPU utilization of more than 5000 servers during a 6-month period at Google. Servers are rarely completely idle or fully utilized, in-stead operating most of the time at between 10% and 50% of their maximum utilization. (From Figure 1 in Barroso and Hölzle [2007].) The column the third from the right in Figure 6.4 calculates percentages plus or minus 5% to come up with the weightings; thus, 1.2% for the 90% row means that 1.2% of servers were between 85% and 95% utilized.
Source: H&P textbook.Copyright © 2011, Elsevier Inc. All rights Reserved.
14
Other Metrics
• Performance does matter, especially latency
• An analysis of the Bing search engine shows that if a 200ms delay is introduced in the response, the next click by the user is delayed by 500ms; so a poor response time amplifies the user’s non-productivity
• Reliability (MTTF) and Availability (MTTF/MTTF+MTTR) are very important, given the large scale
• A server with MTTF of 25 years (amazing!) : 50K servers would lead to 5 server failures a day; Similarly, annual disk failure rate is 2-10% 1 disk failure every hour

15
Title
• Bullet