Embed Size (px)
Citation preview

1
ICON Plc.
Jefferies 3rd Annual Healthcare Conference
June 2009

2
Certain statements contained herein including, without limitation, statements containing the words “believes,” “anticipates,” “intends,” “expects” and words of similar import, constitute forward-looking statements concerning the Company's operations, performance, financial condition and prospects. Because such statements involve known and unknown risks and uncertainties, actual results may differ materially from those expressed or implied by such forward-looking statements. Given these uncertainties, prospective investors are cautioned not to place undue reliance on such forward-looking statements. The Company undertakes no obligation to publicly update or revise any forward-looking statements, whether as a result of new information, future events or otherwise.
Forward Looking Statements

3
Global Full Service Clinical Development
US 45%
EU 47%
ROW 8%

4
ICON’s Global Footprint

5
ICON plc Staff Growth 1990 - Today
5 18 40 70 100 180 250 340580
8301300
1500
199524182588
3036
4293
5292
69757100

6
Market Environment

7
Market Fundamentals still intact
• Outsourcing Penetration expected to increase
¯ More Strategic approach to outsourcing
¯ Cost containment
¯ Globalisation of clinical research
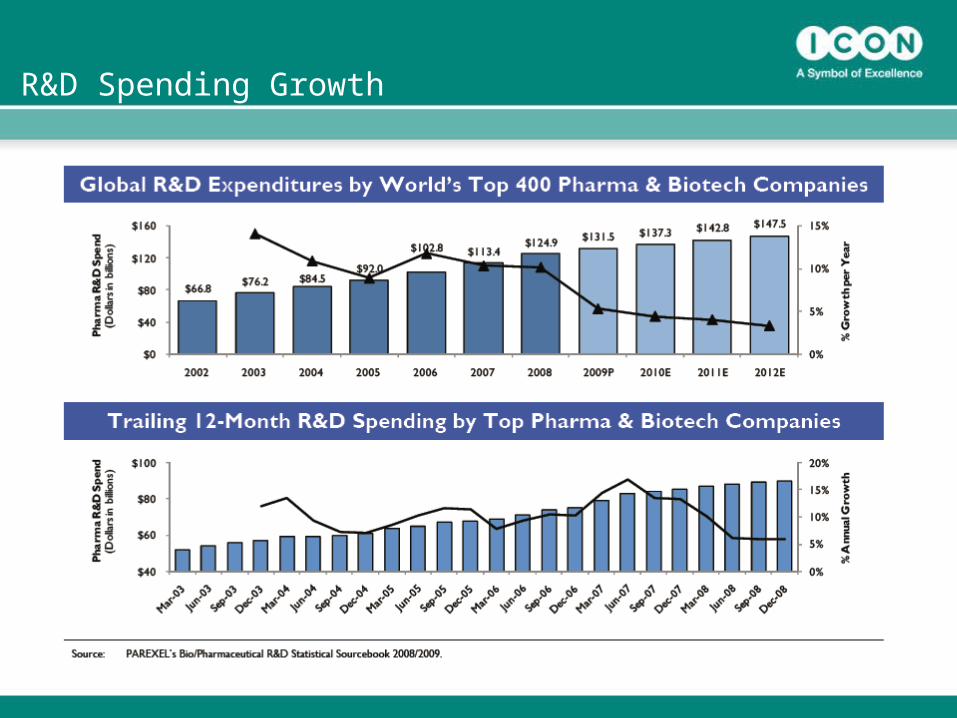
• Continued R&D Spending Growth.
¯ Pipelines remain solid
¯ Scientific innovation continues to expand
• Increasing Regulation
¯ More patients/ more studies
¯ Post marketing surveillance

8
• Clients are increasingly focused on their core competencies of¯ Discovery¯ Strategic Development¯ Marketing
• Clients are engaging CROs at a more strategic level¯ Level of management engagement (Executive to executive)¯ Level of co-operative engagement i.e. sharing drug pipeline intentions¯ Deeper reliance on CRO scientific and therapeutic expertise
• Reduced internal capacity in the companies of strategic partners e.g. staff or asset transfers/reductions
• Clients likely to move their % outsourced from ≈ 30% to >50% over the next 5+ years
Increased Outsourcing

9
Market Fundamentals still intact
• Outsourcing Penetration expected to increase
¯ More Strategic approach to outsourcing
¯ Cost containment
¯ Globalisation of clinical research
• Continued R&D Spending Growth.
¯ Pipelines remain solid
¯ Scientific innovation continues to expand
• Increasing Regulation
¯ More patients/ more studies
¯ Post marketing surveillance

10
Clinical Compounds in Development
11
R&D Spending Growth

12
CRO Market Size (1996-2012E)

13
Total Biotech Funding (In Millions USD$)
Source: Burrill and Company
$9,397
$13,549
$10,332
$11,062
$6,647$6,249
$5,476
$11,754
$9,810
Q1 07 Q2 07 Q3 7 Q4 07 Q1 08 Q2 08 Q3 08 Q4 08 Q1 09

14
Market Fundamentals still intact
• Outsourcing Penetration expected to increase
¯ More Strategic approach to outsourcing
¯ Cost containment
¯ Globalisation of clinical research
• Continued R&D Spending Growth.
¯ Pipelines remain solid
¯ Scientific innovation continues to expand
• Increasing Regulation
¯ More patients/ more studies
¯ Post marketing surveillance

15
Opportunities…. but also Risks

16
ICON in this Market Environment

17
Gross and Net Volume of RFPs
2003 to Q1 2009
Net volume represents only those opportunities which were ultimately outsourced
1818
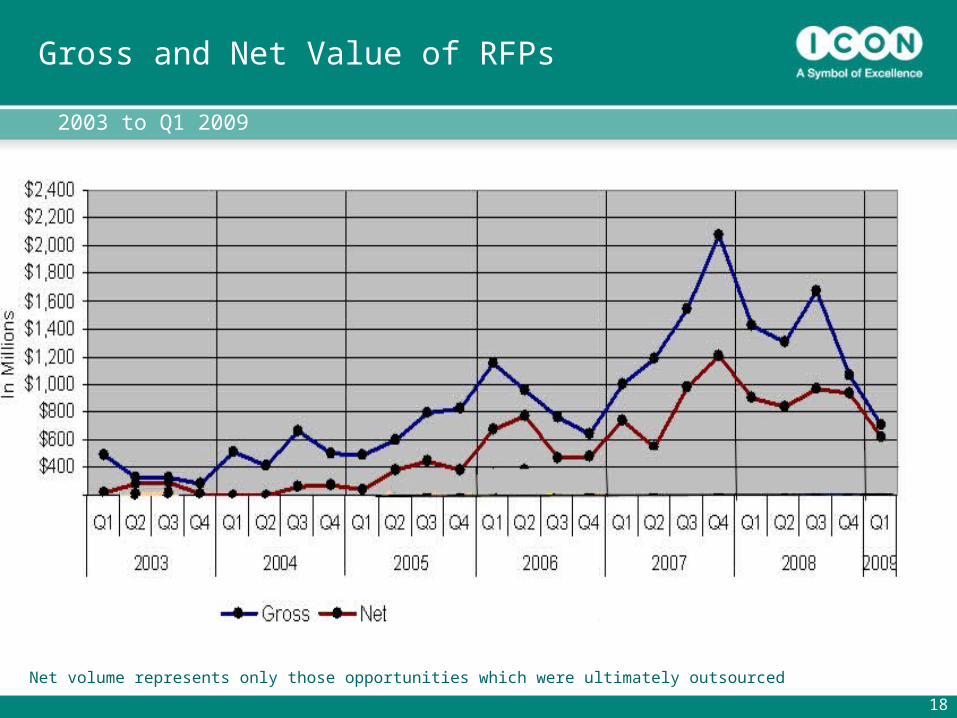
Gross and Net Value of RFPs
2003 to Q1 2009
Net volume represents only those opportunities which were ultimately outsourced

19
Net New Business wins and book to bill ratios
$344
$369
$337$350
$261 $265
Q4 07 Q1 08 Q2 08 Q3 08 Q4 08 Q1 09
1.9
1.6
1.21.2
1.5
1.8
Net Business Wins Book to Bill Ratio

20
Analysis of Business Wins
Q1 09 Net Wins
53% Large
Pharma
2008 Net Wins
Large Pharma
Large Bio
Mid PharmaMid BioSmall Bio and Small Pharma
50%
13%
18%
12%7%
68%7%
18%6%

21
Analysis of Backlog by Client at the end of Q1 09
53% Large
Pharma
Large Pharma
Large Bio
Mid PharmaMid BioSmall Bio and Small Pharma
53%
16%
17%
2% 12%
22
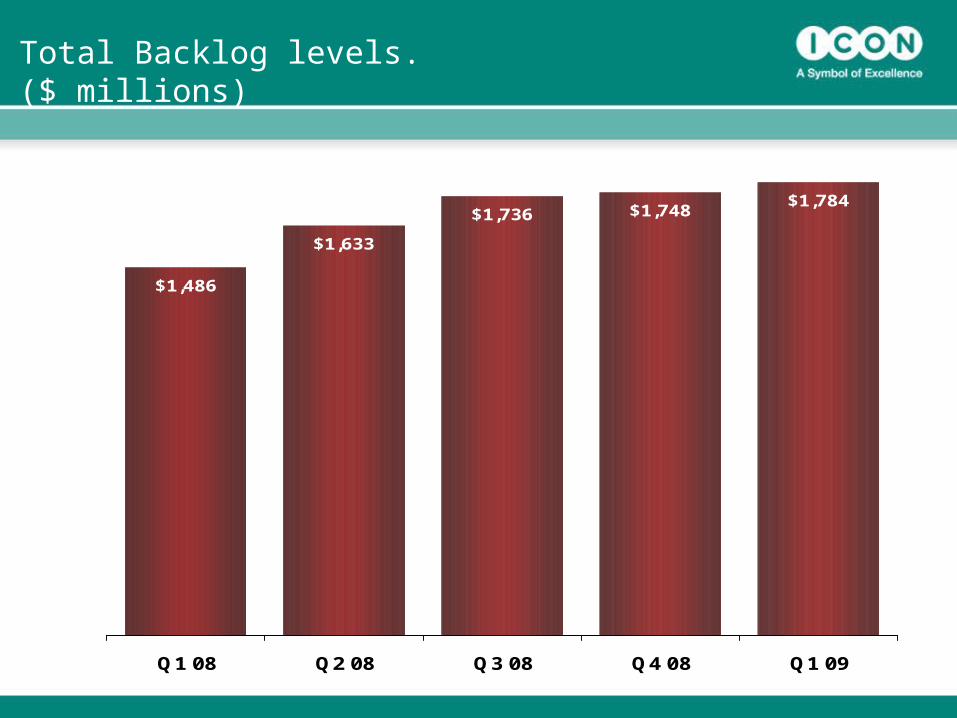
Total Backlog levels. ($ millions)
$1,486
$1,633
$1,736 $1,748$1,784
Q1 08 Q2 08 Q3 08 Q4 08 Q1 09

23
Coverage of next 4 quarters from backlog
$690
$752 $762
$707$673
Q1 08 Q2 08 Q3 08 Q4 08 Q1 09
71%
76% 77% 77%
74%
Value of backlog forecast to be earned in next 4 quarters
% coverage of next 4 quarters forecast revenues

24
Projects of longer duration leads to slower backlog burn
15.5%14.6%
13.8%12.7% 12.6%
Q1 08 Q2 08 Q3 08 Q4 08 Q1 09

25
Strategy

26
Capitalise on market fundamentals to drive organic growth in all business units.
Cross-sell services to grow sales and margin
Build Deep Strategic Relationships
Create Stronger differentiation across our services
Retain a flexible business model to respond to differing client outsourcing strategies
Pursue acquisitions to enhance depth and scale of current operations and to add additional
complementary services e.g.
Phase I
Bioanalytical / Biomarkers
Therapeutic specialists
ICON’s Core Strategy is Organic Growth,with acquisitions made to add new services or scale.
Acquisitions to date - 13
• Revenues acquired $130m
• Staff acquired – 1,200
• => Organic growth >80%
Safety / Late Phase
Imaging
Japan

27
Market Feedback

28
ICON in Recent Survey's
“ICON is one of three CRO’s cited most frequently as sponsor’s favourite CRO vendors”
“Our confidence goes up that ICON is the right name to own in this environment, given their consistent quality”
William Blair fourth survey of Pharma and Biotech Sponsors.
“ ICON is a darling of the industry, the company's stunning growth in 2006 and 2007 surprised its peers. Now, the Dublin-based company is still outpacing just about everybody, but at a less accelerated clip.”
Eric Coldwell Clinpage 2009 Master Providers

29
Financial Performance

30
Net Revenue CAGR of 30% since 2005
$865
$631
$456
$327
$930
$0
$100
$200
$300
$400
$500
$600
$700
$800
$900
$1,000
FY2005 FY2006 FY2007 FY2008 FY2009*
Mil
lio
ns
CAGR 30%
* Lower end of 2009 Guidance
(E)

31
Earnings Per Share Growth
$0.43
$0.68
$0.94
$1.30
$1.40
-$0.10
$0.10
$0.30
$0.50
$0.70
$0.90
$1.10
$1.30
$1.50
FY2005 FY2006 FY2007 FY2008 FY2009*
CAGR 34%(E)
* Lower end of 2009 Guidance

32
Cash flow from Operations/Free Cash Flow
11
26
11
47
70
82
4350
25
100
2005 2006 2007 2008 2009*
Millio
ns
CFFO
FCF
* Estimate assumes DSO of approx 60 days. Historic periods FCF exclude Head-office construction costs
1.17
0.77
0.180.19
0.45
FCF Per Share

33
Return on Equity
6%
13%
14%
17%
2005 2006 2007 2008

34
Recent Financial Performance ($ millions) Quarter 1 09
31 Mar 09 31 Mar 08 % Increase
Net Revenue 220 201 9.2%
Direct Costs 124 113 9.7%
SG & AEBITDA
6135
6028
1.2%25%
D & A 8 6 23%
EBIT 27 22 25%
Net Income 21 17 24%
EPS (Inc SFAS 123R) 35c 28c 25%
Weighted Average no. of Shares (Inc SFAS123R)
59.7m 60.1m (0.7%)

35
Recent Financial Performance ($ millions) FY 08
31 Dec FY 2008
31 Dec FY 2007
% Increase
Net Revenue 865 631 37%
Direct Costs 489 354 38%
SG & AEBITDA
248128
18988
32%45%
D & A 28 19 46%
EBIT 100 69 44%
Net Income 78 56 40%
EPS (Inc SFAS 123R) 130c 94c 38%
Weighted Average no. of Shares (Inc SFAS123R)
60.2m 59.5m 1.2%

36
Summary Balance Sheet and Cash Flow ($ millions)
Qtr endedMar 31, 09
Full Year ended
Dec 31, 08
Full Year ended
Dec 31, 07
Full Year ended
Dec 31, 06
Cash $96.9 $101.1 $118.6 $102.9
Debt $99.2 $105.4 $94.8 $5
Net Cash/Debt ($2.3) ($4.3) $23.8 $97.9
Total assets $850.5 $867.3 $693.1 $476.3
Total Liabilities $376.1 $410.9 $304.9 $173.6
Shareholder’s equity $474.4 $456.4 $388.4 $302.7
Cashflow from operations
$24.7 $81.3 $42.9 $50.4
Capital expenditures $8.1 $67.9 $75.4 $31.5

37
ICON Key Financial Metrics ($ millions)
Qtr endedMar 31, 09
Full Year ended
Dec 31, 08
Full Year ended
Dec 31, 07
Full Year ended
Dec 31, 06
Sales Growth 9.2% 37% 38% 39%
EPS Growth 25% 38% 41% 177%
EBITDA Margin 15.7% 14.7% 14% 13.8%
EBIT Margin 12.2% 11.5% 11.0% 10.5%
ROE 17.7%* 17% 14% 13%
* Annualised on the basis of Q1 net income

38
ICON plc Historic Share Price Performance
ICON
S&P 500
Nasdaq Composite

39
• Top Global Clinical CRO - #4• Deep customer relationships• Quality of staff• Experienced Management team• Excellent Reputation• Solid market fundamentals • Outstanding record of growth • Strong balance sheet
Investment Case Summary