Embed Size (px)
Citation preview
1
Growth Patterns of US Children from 1963 to 2012Xiang Zhong∗, Jingshan Li†, Goutham Rao‡, and KP Unnikrishnan§∗ University of Wisconsin-Madison, Madison, Wisconsin 53706–1539
Email: [email protected]† University of Wisconsin-Madison, Madison, Wisconsin 53706–1539
Email: [email protected]‡ NorthShore University HealthSystem, Evanston, Illinois 60201-3137
Email: [email protected]§NorthShore University HealthSystem, Evanston, Illinois 60201-3137
Email: [email protected]
Abstract
Anthropometric measurements such as weight, stature (height), and body mass index (BMI) provide reliable indicators ofchildren’s growth. The 2000 CDC growth charts are the national standards in the United States for these important measures. Butthese growth charts were generated using data from 1963-1994. To understand the growth patterns of US children since 1994, wegenerate weight-for-age, stature-for-age and BMI-for-age percentile curves for both boys and girls aged 2-20 through the methodsused to generate the 2000 CDC growth charts. Our datasets are from the National Health and Nutrition Examination Survey(NHANES) for years 1999-2010 and and from NorthShore University HealthSystem’s Enterprise Data Warehouse (NS-EDW) foryears 2006-2012. The weight and BMI percentile curves generated from NS-EDW and NHANES data differ substantially fromthe CDC percentile curves, while those for stature do not differ substantially. We conclude that the population weight and BMIvalues of US children in recent years have increased significantly since 2000 and the 2000 CDC growth charts may no longer beapplicable to the current population of US children. Our charts poignantly reveals the increasing obesity of American children.
Keywords: Growth chart, Body-mass-index (BMI), NS-EDW, Obesity
I. INTRODUCTION
Childhood obesity has become a national epidemic in the United States. An estimated 31.7% of all American children ages2-19 are currently either overweight or obese [1]. Childhood obesity is associated with serious medical, psychological andsocial consequences in adult life.
Anthropometric data are valuable objective indicators of physical growth in children [2]. Growth charts generated from itconsist of a series of percentile curves that illustrate the distribution of selected body measurements including weight, statureand the body mass index (BMI) in children. Pediatric growth charts have been used by pediatricians, nurses, and parents totrack the growth of infants, children, and adolescents in the United States since 1977 [3]. A variety of growth reference bothdata based and method oriented were developed and published (see representative studies [4]–[11]). Body mass index (BMI) isa general measure calculated from person’s weight and height. It is defined as the ratio of weight (kg) to squared height (m2)and is popularly used as a measure of overweight and obesity [12]. For children and teenagers, sex- specific BMI follows acharacteristic pattern. It increases rapidly during the first year of life and then declines, reaching a nadir and increasing again[13]. This pattern is observed (with minor differences) in both boys and girls. The inflection point at which BMI begins toincrease again is known as the adiposity rebound (AR) [14]. Adiposity rebound normally occurs at roughly six years of age. Asignificant body of evidence indicates that early adiposity rebound (i.e., before age six) is a significant predictor of overweightand obesity in adolescence and young adulthood [15].
The percentiles of BMI for a specified age is of particular interest in light of public health concerns. Based on the CDCgrowth charts, a BMI percentile ≥ 85 and < 95 is classified as overweight and a BMI percentile ≥ 95 is is classified as obese;the lower percentiles are observed for issues associated with being underweight [16], [17]. However, these standards used toidentify obesity have serious shortcomings including lack of accuracy associated with increased health risk [18]. The CDC hasnot published updated growth charts since 2000, while more recent data has become available from NHANES and in systemswith electronic health records like NorthShore Enterprise Data Warehouse (NS-EDW).
In this paper, our objective is to determine if we could produce growth charts based on a large pool of recently collectedelectronic data (NorthShore Enterprise Data Warehouse (NS-EDW) data from 2006 to 2012 and National Health and NutritionExamination Survey (NHANES) data from 1999 to 2010), and to investigate the newer growth curves’ variation from theestablished CDC curves in terms of shape or patterns of growth. By closely following the methods used to generate the 2000CDC growth charts, growth charts for these two data sets are generated and compared with the CDC charts. We concludethat at the same age of sampling, the population weight and BMI values increased by year of sampling, which indicates anincreasing obesity of American children, and the CDC growth charts may no longer be accurate standards for today’s populationof American children.
arX
iv:1
303.
0686
v1 [
stat
.AP]
4 M
ar 2
013
2
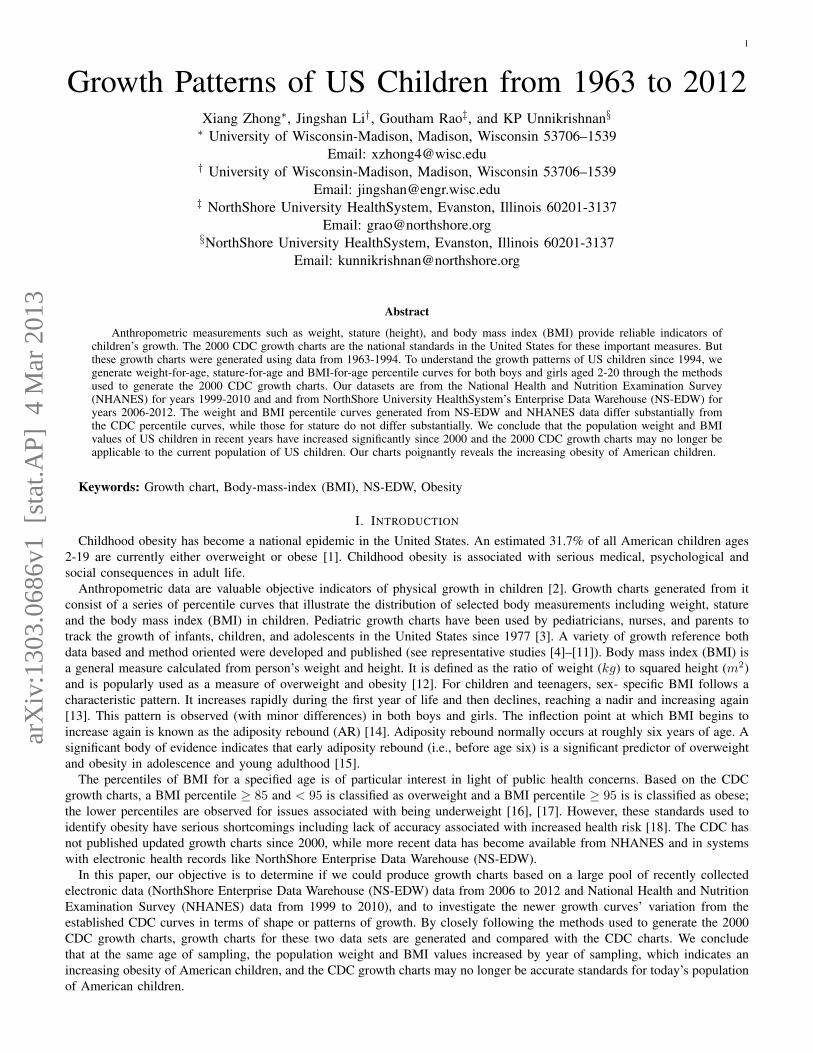
Fig. 1: Time line for data sources
TABLE I: Data characteristics
Data Set Year Subject Sex Chart
NS-EDW Data
NS-EDW 2006-2012 Age:2-20 M,F W,S,BMI
NHANES Data
NHANES 1999-2010 Age:0-26 M,F W,S,BMI
NHANES 1999-2002 Age:0-26 M W
NHANES 2003-2006 Age:0-26 M W
NHANES 2007-2010 Age:0-26 M W
CDC Data
NHES2 1963-1965 Age:6-12 M,F W,S,BMI
NHES3 1966-1970 Age:12-18 M,F W,S,BMI
NHANES1 1971-1974 Age:1-20 M,F W
NHANES1 1971-1974 Age:2-25 M,F S,BMI
NHANES2 1976-1980 Age:1-20 M,F W
NHANES2 1976-1980 Age:2-25 M,F S,BMI
NHANES3 1988-1994 Age:1-6 M,F W
NHANES3 1988-1994 Age:2-25 M,F S
NHANES3 1988-1994 Age:2-6 M,F BMI
The remainder of this paper is structured as follows. The datasets and methods used to generate the growth charts are describedin Section 2. Section 3 summarized the results. Discussions are presented in Section 4 and conclusions are formulated in Section5, respectively.
II. MATERIALS AND METHODS
In this paper, the growth charts were developed using data from the NorthShore Enterprise Data Warehouse (NS-EDW) andNational Health and Nutrition Examination Survey (NHANES). Closely following the methods used to generate the 2000 CDCgrowth charts, selected empirical percentiles were generated and smoothed through a variety of parametric and non-parametricprocedures. For each data set, weight-for-age, stature-for-age and BMI-for-age percentiles for boys and girls of age 2-20 yearswere generated separately and compared with the 2000 CDC growth curves. Further more, to illustrate the variation trend overyears of sampling, the NHANES data were separated into three non-overlapping four-yearly data sets. Five boys weight-for-agegrowth charts generated from the 2000 CDC, NHANES 99-02, NHANES 03-06, NHANES 07-10, and NS-EDW 06-12 dataare compared.
A. Data sources
The general information of each data source and the corresponding charts they generated are summarized in Table I. Thetime line of all the data source (CDC data, NS-EDW and NHANES data) is illustrated in Figure 1. The information stratifiedby sex, and race/ethnicity for the NS-EDW and NHANES data set are described in detail separately. A detailed description ofthe CDC data set is given in [2].
B. NorthShore Enterprise Data Warehouse Data
Children’s weight and stature are routinely measured at annual well-child visits and at other visits to physicians. Instate-of-the-art clinical informatics systems such as the NorthShore University HealthSysetem’s (NS), an Enterprise DataWarehouse (EDW) is in place to capture clinical and administrative data for quality improvement and research. The foundation
3
TABLE II: Demographic information for NS-EDW data
Boys Girls
Encounters 50775 45390
Patients 7592 6878
Race/Ethnicity
African American 5.9% 5.5%
American Indian 0.6% 0.7%
Asian 3.6% 4.5%
Caucasian 57.8% 57.9%
Hispanic/Latino 5.0% 4.8%
Other 27.0% 26.6%
Measurement
Wt(kg) 7.2-180.1 4.2-163.2
St(cm) 60.9-241.3 53.0-221.0
BMI(kg/m2) 6.73-63.11 6.76-56.69
of this system is a comprehensive electronic medical record using the EPIC platform that has been in place since 2003 andextends across 4 hospitals accounting for over 1000 beds and 60,000 annual admissions; 4 emergency departments seeingover 100,000 annual visits; and 80 office practices with over one million encounters per year. All encounters use a commondatabase and are live on the system. A query of the NS-EDW was completed to quantify the number of children in whom weightand stature information are feasible with multiple BMI measurements over time. Data from more than 400,000 encounters,stretching from years 2006 through mid 2012 are collected and all data are available for research in fully de-identified form.
1) Data Exclusion: Several exclusions were made prior to data processing. NS-EDW data missing weight, stature or BMIinformation are excluded. Weight larger than 200 kg and stature larger than 242 cm are excluded, which are outliers dueto inaccurate measurements or recordings. BMI value less than 6 kg/m2 or larger than 100 kg/m2 are excluded. Besides,data with age under two are cut off the data set for missing accurate recordings of stature. In order to get representativelylongitudinal data, children have encounters less than five times are filtered.
2) Data Statistics: The query results after data exclusion were approximately 7592 boys and 6878 girls age 2-20 yearswith a minimum of five BMI measurements separated in time. The BMI value ranges from 6.7 to 63.1 (kg/m2). The detaileddemographic information for the filtered NS-EDW data is summarized in Table II.
C. National Health and Nutrition Examination Survey Data
The National Health and Nutrition Examination Survey (NHANES) is a program of studies designed to assess the healthand nutritional status of adults and children in the United States. The survey combines interviews including demographic,socioeconomic, dietary, and health-related questions and physical examinations consist of medical, dental, and physiologicalmeasurements, as well as laboratory tests administered by highly trained medical personnel. NHANES findings are the basisfor national standards for such measurements as height, weight, and blood pressure. Data from this survey are widely used inepidemiological studies and health sciences research, which help develop sound public health policy, direct and design healthprograms and services, and expand the health knowledge for the Nation [19].
1) Data Exclusion: Data from the six national surveys (09-00, 01-02, 03-04, 05-06, 07-08, 09-10) were pooled to constructgrowth charts. To achieve better precision of the empirical percentiles, pooling is introduced to enhance the number of subjectsat each age, thereby increasing the stability of the outlying percentile estimates.
Similarly, the NHANES data were first filtered by encounters whose age are within the scope of study (0-26 years). Then,data missing weight, stature or BMI information were excluded. Besides, extremely high weight (larger than 300 kg) and BMI(larger 100 kg/m2) are also excluded.
2) Data Statistics: The NHANES data has 62160 encounters in total with around 10,000 encounters for each bi-yearlydata set. After the exclusion of missing value, there were 11820 boys and 11538 girls with complete information about ageat sampling, weight, stature and BMI. The BMI value ranges from 7.99 to 66.32 (kg/m2). The demographic information forthe filtered NHANES data in detail is shown in Table III.
D. Statistical Curve Smoothing Procedures
To generate the CDC-like boys and girls weight-for-age, stature-for-age and BMI-for-age percentiles with NS-EDW andNHANES data, we replicated the statistical procedures described in [2] using custom written computer programs in R [20].These programs were applied to generate empirically selected percentiles. Custom-written curve smoothing methods that closelyfollow those used by CDC [2] were then applied to the major percentiles charts. The procedures for each stage are describedin detail for each growth chart in the following subsections.
4
TABLE III: Demographic information for NHANES data
Boys Girls
Encounters 11820 11538
Ethnicity
Mexican American 31.2% 31.8%
Other Hispanic 6.3% 6.4%
Non-hispanic White 28.5% 27.9%
Non-hispanic Black 29.2% 28.5%
Other multi-racial 4.8% 5.3%
Measurement
Wt(kg) 9.7-239.4 8.9-174.8
St(cm) 79.0-204.4 78.0-187.2
BMI(kg/m2) 11.98-66.32 7.99-62.08
1) Age Groupings and Curve Smoothing Stages: The empirical percentiles with grouped age provide a discrete approximationfor the population percentiles. To generate the initial selected major percentiles, data with age range from two to twenty wereseparated into 36 half-year age groups. Each age group was categorized by the midpoint of an age range. For example, age2.25 years included ages from 2.0 years to 2.5 years of age. This pattern started from 2.25-year-age and continued to the19.75-year-age interval. (Detailed description please refer to [2]) The basic percentile definition n = P/100 ·N + 1/2 (whereN is the data size and P is the desired percentile) and round n to the nearest integer was used to get the correspondingpercentile value.
For each growth chart, the initial smoothing methods were applied to nine empirical percentiles (3rd, 5th, 10th, 25th, 50th,75th, 90th, 95th, and 97th). In addition, the 85th percentile was included in the BMI-for-age charts because the 85th percentileof BMI has been recommended as a cutoff to identify children and adolescents who are overweight [21], [22].
The empirical percentile points at the midpoint of each age group were calculated initially. The irregular plots of empiricalpercentile values were smoothed then to produce clinically useful percentile curves. Followed the methods in the CDC paper,several different approaches were used in the smoothing stage. Stature-for-age was smoothed using a nonlinear model. Theempirical percentiles for weight and BMI were initially smoothed using locally weighted regression (LWR) [23] and thensmoothed using a family of polynomial regression.
2) Weight-for-age 2 to 20 years: In order to compensate the insufficient sample size for age around and above 20 andbelow 2, some empirical data less than 2 years of age and greater than or equal to 20 years were included to make the curvessmooth and consistent. This compound data set was initially smoothed with a locally weighted regression (LWR) procedure[23]. The LWR provides an intermediate smoothed curve for further parametric smoothing. LWR applies a weight function todata in the neighborhood of the value to be estimated. Ages at measurements that are near that of the value to be estimatedreceived larger weights than those farther away from the specific age [2]. The width of the LWR moving window was chosento balance the degree of smoothness and fidelity to the data. Based on the shape of the underlying empirical percentile curves,the smoothed value was estimated by a LWR on 10-15 neighborhood points adjacent accordingly.
For NS-EDW boys and girls, the weight value at year 2 were repeated seven times from age 1.75 down to 1.15 years by0.1-year interval. When smoothing the value at age 20 years, seven data points at ages over 20 years were necessary for movingwindow with width of 15 neighborhood points. The maximum value through age 16.75 to 19.75 were repeated seven timesfrom 20.25 to 23.25 years by 0.5-year interval. For NHANES boys and girls, the weight value at year 1.75 were repeated seventimes from age 1.75 down to 1.15 years by 0.1-year interval. The data for age above 20 is available for NHANES data so theempirical percentiles from 20.25 to 23.25 years by 0.5-year intervals were used as seven additional data points for smoothing.Same methods were applied to the three non-overlapping NHANES data sets. After the LWR procedure, the percentile curveswere fit by a 10-degree polynomial for both boys and girls. The parameters of the polynomial regression for nine percentilesare estimated.
3) Stature-for-age 2 to 20 years: The stature-for-age curves for ages from 2 to 20 years were smoothed with a nonlinearmodel following the format shown in CDC paper:
f(t) =a1
1 + e−b1(t−c1)+
a21 + e−b2(t−c2)
+a3
1 + e−b3(t−c3)
where f(t) is stature in cm, t is age in years (calculated as midpoint of age range) and a1, b1, c1, a2, b2, c2, a3, b3, c3, arespecific for each of nine percentiles being smoothed. This model ensured a monotonic increase in stature. However, some ofthe empirical percentile curves derived from both data sets were irregular due to sampling variations and small number ofsubjects of age 18 to 20. To aid in smoothing the irregular empirical percentile curves, especially the 95th and 97th percentiles,weighted linear regression were applied for those non-smoothing curves before being fit into parametric models.
5
Weight−for−age charts: selected smoothed weight percentiles in kilograms
Stature (cm)
Wei
ght (
kg)
2 to 20 years, Boys
1015
2025
3035
4045
5055
6065
7075
8085
9095
100
105
1015
2025
3035
4045
5055
6065
7075
8085
9095
100
105
2 3 4 5 6 7 8 9 10 11 12 13 14 15 16 17 18 19 20
3rd
5th
10th
25th
50th
75th
90th
95th
97th
Data Source: CDC data
CDC−LMS dataCDC data
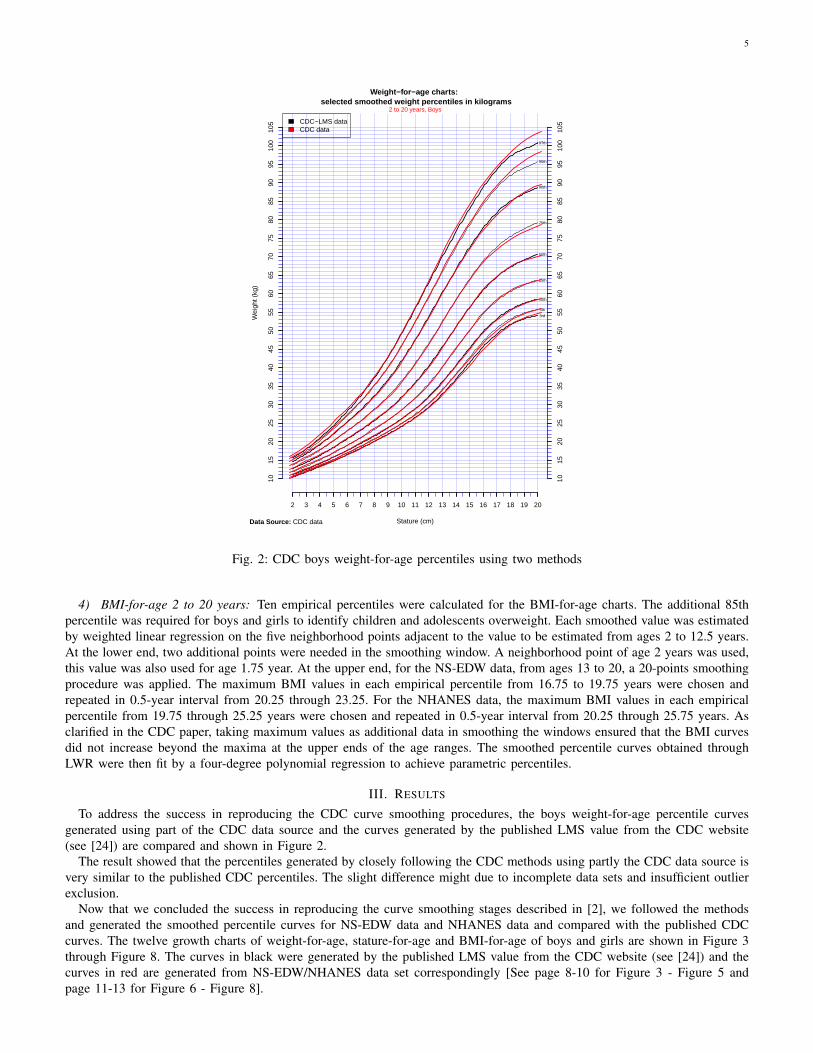
Fig. 2: CDC boys weight-for-age percentiles using two methods
4) BMI-for-age 2 to 20 years: Ten empirical percentiles were calculated for the BMI-for-age charts. The additional 85thpercentile was required for boys and girls to identify children and adolescents overweight. Each smoothed value was estimatedby weighted linear regression on the five neighborhood points adjacent to the value to be estimated from ages 2 to 12.5 years.At the lower end, two additional points were needed in the smoothing window. A neighborhood point of age 2 years was used,this value was also used for age 1.75 year. At the upper end, for the NS-EDW data, from ages 13 to 20, a 20-points smoothingprocedure was applied. The maximum BMI values in each empirical percentile from 16.75 to 19.75 years were chosen andrepeated in 0.5-year interval from 20.25 through 23.25. For the NHANES data, the maximum BMI values in each empiricalpercentile from 19.75 through 25.25 years were chosen and repeated in 0.5-year interval from 20.25 through 25.75 years. Asclarified in the CDC paper, taking maximum values as additional data in smoothing the windows ensured that the BMI curvesdid not increase beyond the maxima at the upper ends of the age ranges. The smoothed percentile curves obtained throughLWR were then fit by a four-degree polynomial regression to achieve parametric percentiles.
III. RESULTS
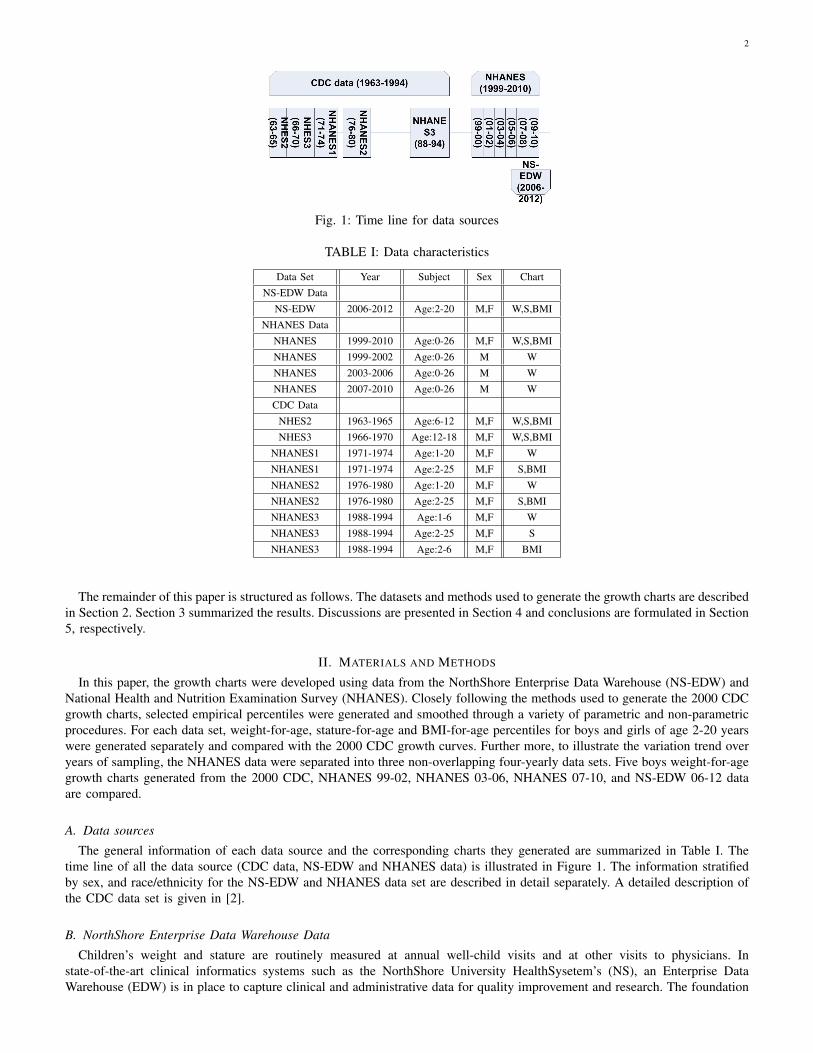
To address the success in reproducing the CDC curve smoothing procedures, the boys weight-for-age percentile curvesgenerated using part of the CDC data source and the curves generated by the published LMS value from the CDC website(see [24]) are compared and shown in Figure 2.
The result showed that the percentiles generated by closely following the CDC methods using partly the CDC data source isvery similar to the published CDC percentiles. The slight difference might due to incomplete data sets and insufficient outlierexclusion.
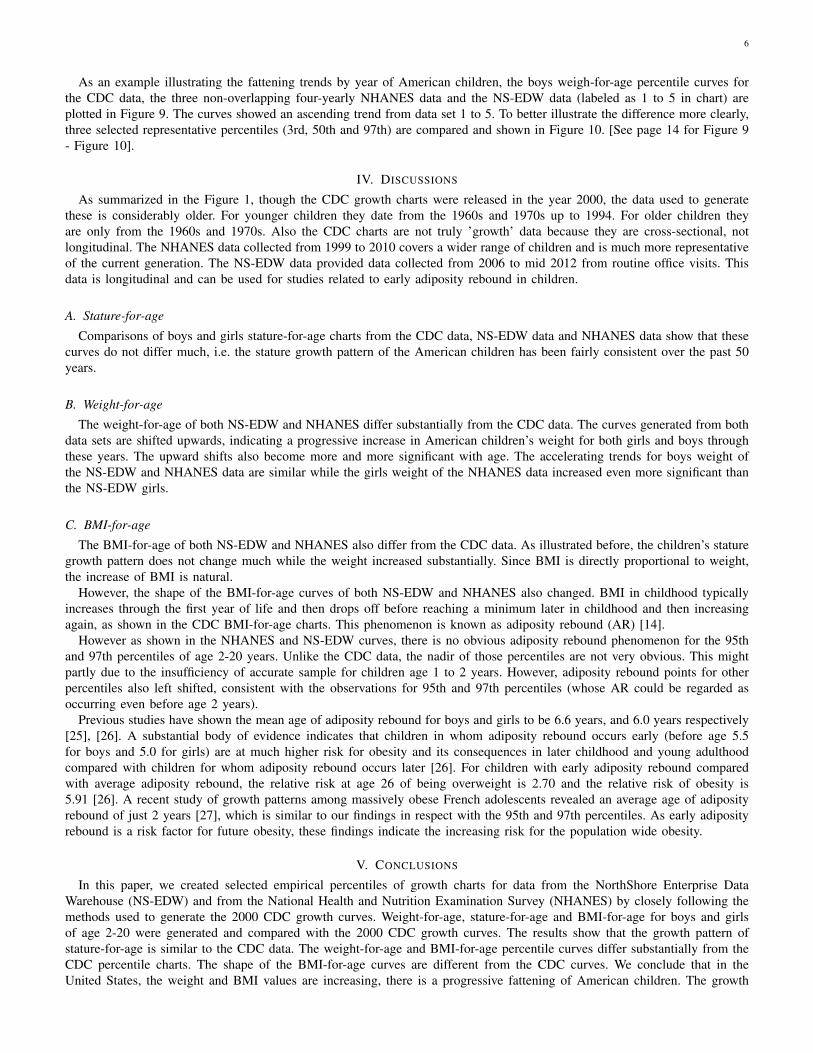
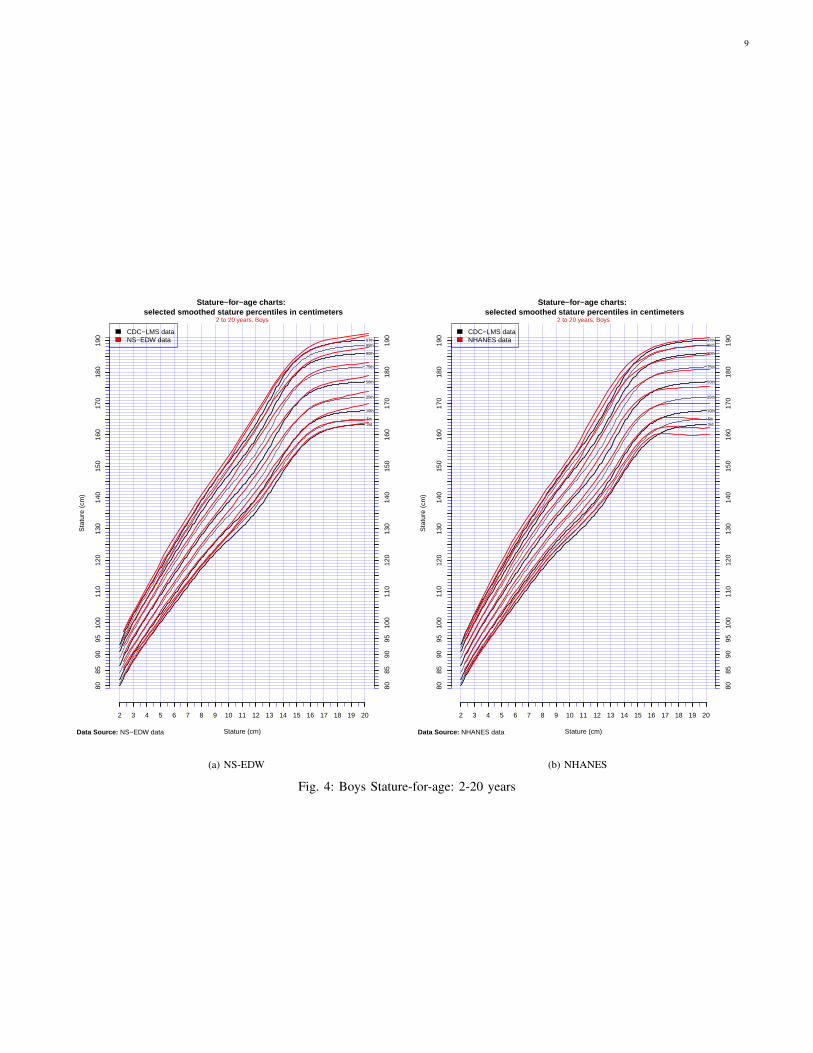
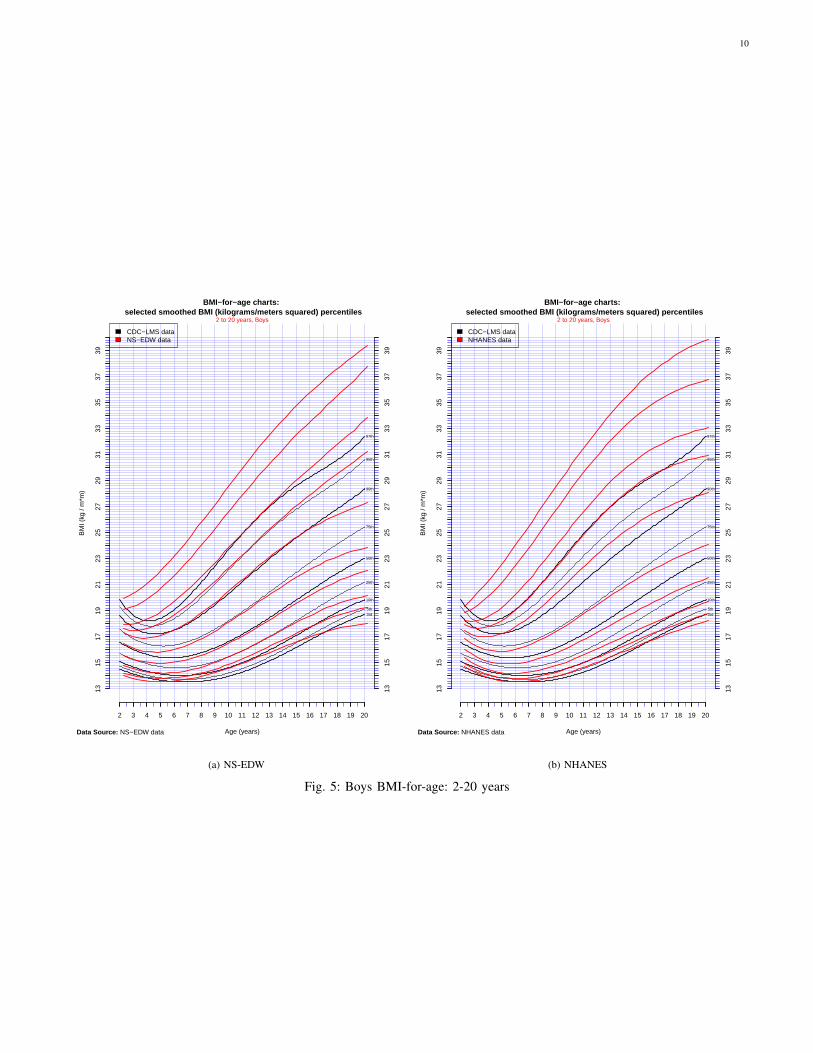
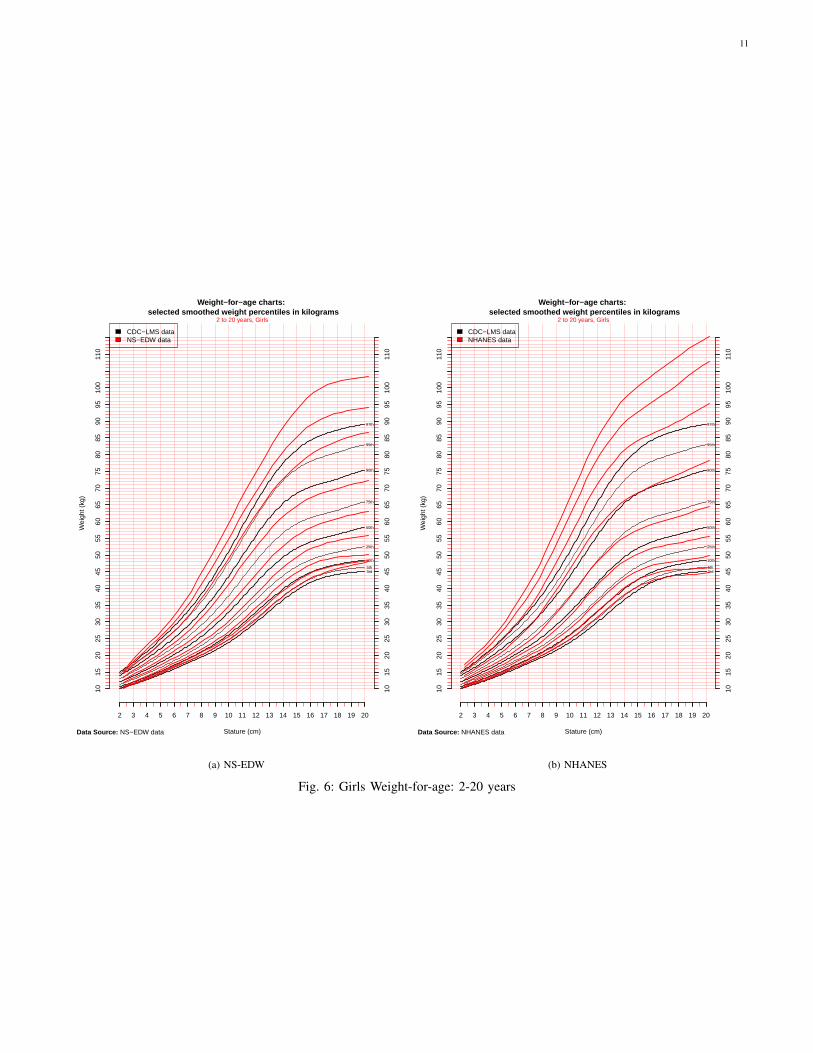
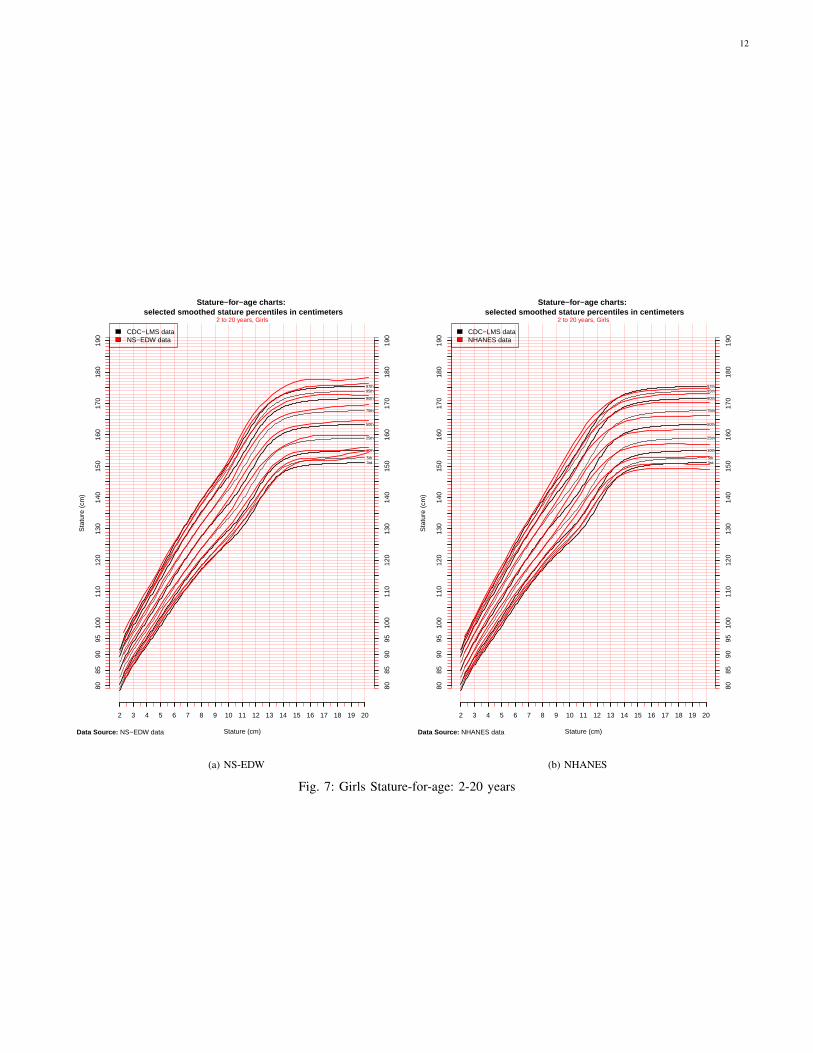
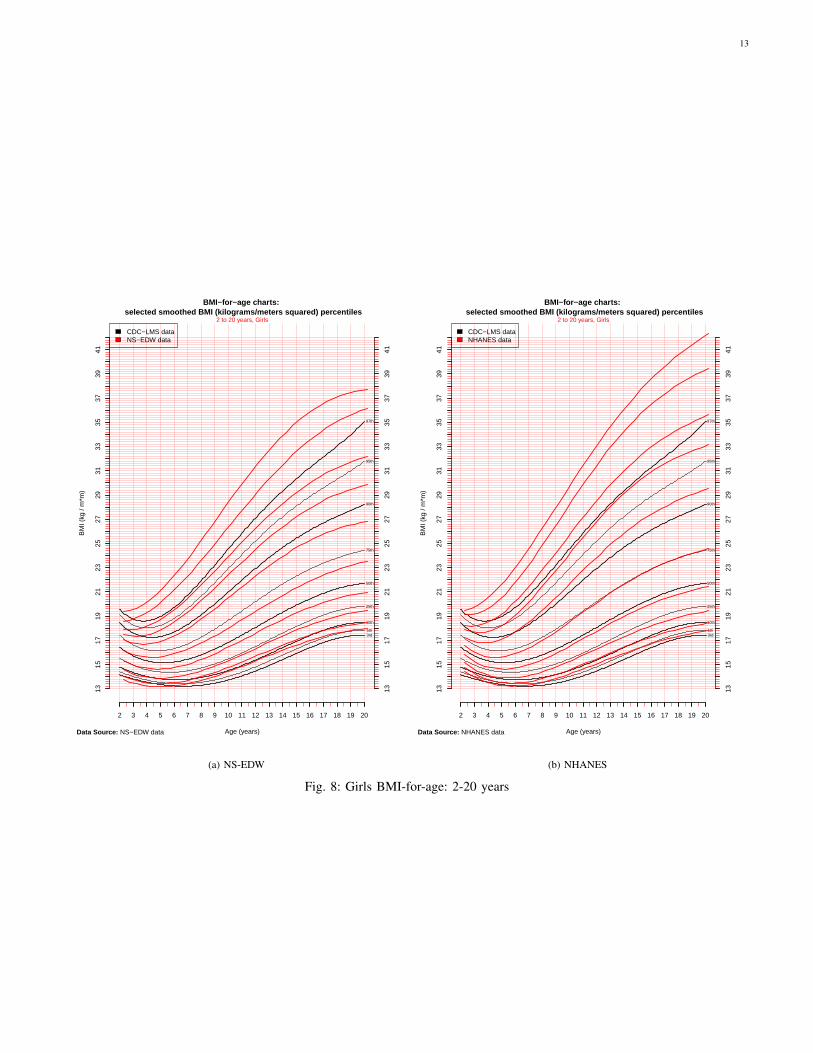
Now that we concluded the success in reproducing the curve smoothing stages described in [2], we followed the methodsand generated the smoothed percentile curves for NS-EDW data and NHANES data and compared with the published CDCcurves. The twelve growth charts of weight-for-age, stature-for-age and BMI-for-age of boys and girls are shown in Figure 3through Figure 8. The curves in black were generated by the published LMS value from the CDC website (see [24]) and thecurves in red are generated from NS-EDW/NHANES data set correspondingly [See page 8-10 for Figure 3 - Figure 5 andpage 11-13 for Figure 6 - Figure 8].
6
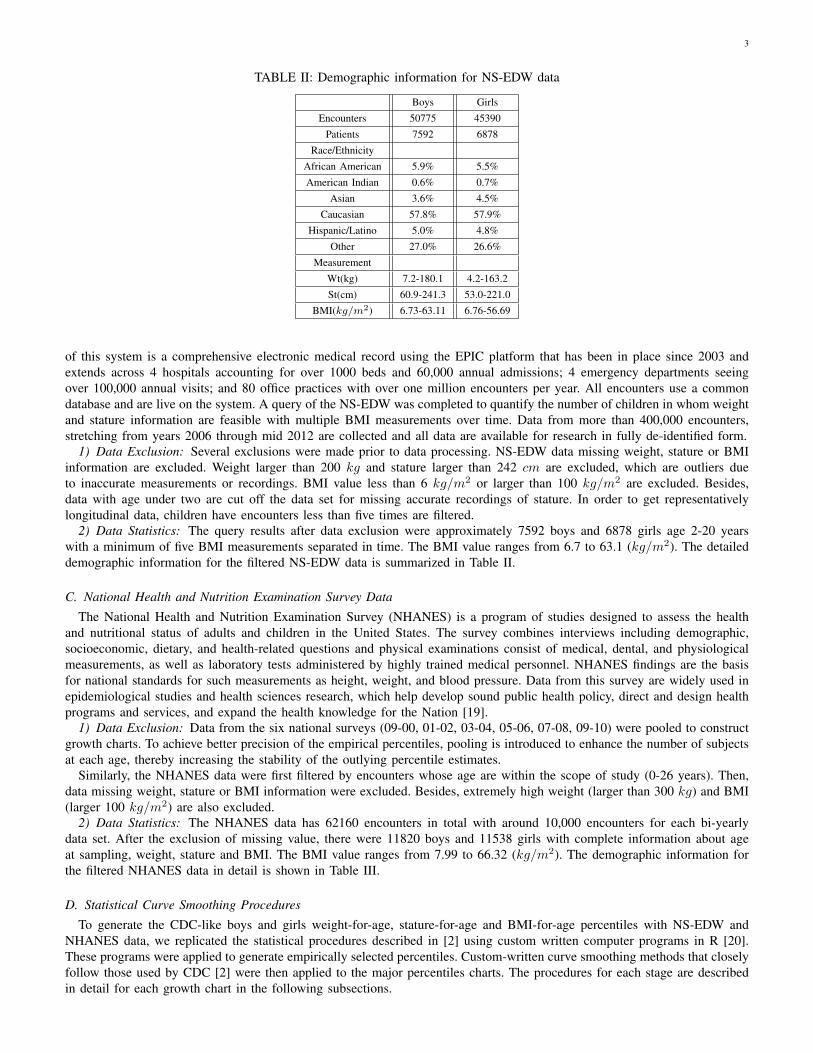
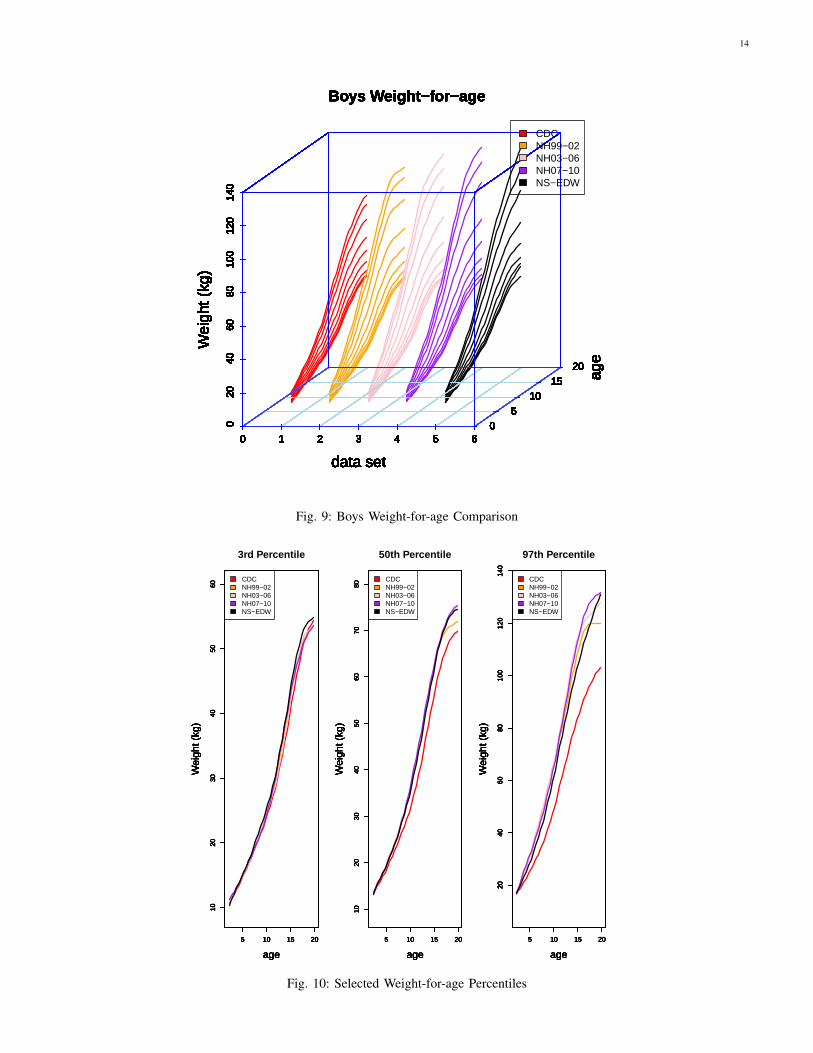
As an example illustrating the fattening trends by year of American children, the boys weigh-for-age percentile curves forthe CDC data, the three non-overlapping four-yearly NHANES data and the NS-EDW data (labeled as 1 to 5 in chart) areplotted in Figure 9. The curves showed an ascending trend from data set 1 to 5. To better illustrate the difference more clearly,three selected representative percentiles (3rd, 50th and 97th) are compared and shown in Figure 10. [See page 14 for Figure 9- Figure 10].
IV. DISCUSSIONS
As summarized in the Figure 1, though the CDC growth charts were released in the year 2000, the data used to generatethese is considerably older. For younger children they date from the 1960s and 1970s up to 1994. For older children theyare only from the 1960s and 1970s. Also the CDC charts are not truly ’growth’ data because they are cross-sectional, notlongitudinal. The NHANES data collected from 1999 to 2010 covers a wider range of children and is much more representativeof the current generation. The NS-EDW data provided data collected from 2006 to mid 2012 from routine office visits. Thisdata is longitudinal and can be used for studies related to early adiposity rebound in children.
A. Stature-for-age
Comparisons of boys and girls stature-for-age charts from the CDC data, NS-EDW data and NHANES data show that thesecurves do not differ much, i.e. the stature growth pattern of the American children has been fairly consistent over the past 50years.
B. Weight-for-age
The weight-for-age of both NS-EDW and NHANES differ substantially from the CDC data. The curves generated from bothdata sets are shifted upwards, indicating a progressive increase in American children’s weight for both girls and boys throughthese years. The upward shifts also become more and more significant with age. The accelerating trends for boys weight ofthe NS-EDW and NHANES data are similar while the girls weight of the NHANES data increased even more significant thanthe NS-EDW girls.
C. BMI-for-age
The BMI-for-age of both NS-EDW and NHANES also differ from the CDC data. As illustrated before, the children’s staturegrowth pattern does not change much while the weight increased substantially. Since BMI is directly proportional to weight,the increase of BMI is natural.
However, the shape of the BMI-for-age curves of both NS-EDW and NHANES also changed. BMI in childhood typicallyincreases through the first year of life and then drops off before reaching a minimum later in childhood and then increasingagain, as shown in the CDC BMI-for-age charts. This phenomenon is known as adiposity rebound (AR) [14].
However as shown in the NHANES and NS-EDW curves, there is no obvious adiposity rebound phenomenon for the 95thand 97th percentiles of age 2-20 years. Unlike the CDC data, the nadir of those percentiles are not very obvious. This mightpartly due to the insufficiency of accurate sample for children age 1 to 2 years. However, adiposity rebound points for otherpercentiles also left shifted, consistent with the observations for 95th and 97th percentiles (whose AR could be regarded asoccurring even before age 2 years).
Previous studies have shown the mean age of adiposity rebound for boys and girls to be 6.6 years, and 6.0 years respectively[25], [26]. A substantial body of evidence indicates that children in whom adiposity rebound occurs early (before age 5.5for boys and 5.0 for girls) are at much higher risk for obesity and its consequences in later childhood and young adulthoodcompared with children for whom adiposity rebound occurs later [26]. For children with early adiposity rebound comparedwith average adiposity rebound, the relative risk at age 26 of being overweight is 2.70 and the relative risk of obesity is5.91 [26]. A recent study of growth patterns among massively obese French adolescents revealed an average age of adiposityrebound of just 2 years [27], which is similar to our findings in respect with the 95th and 97th percentiles. As early adiposityrebound is a risk factor for future obesity, these findings indicate the increasing risk for the population wide obesity.
V. CONCLUSIONS
In this paper, we created selected empirical percentiles of growth charts for data from the NorthShore Enterprise DataWarehouse (NS-EDW) and from the National Health and Nutrition Examination Survey (NHANES) by closely following themethods used to generate the 2000 CDC growth curves. Weight-for-age, stature-for-age and BMI-for-age for boys and girlsof age 2-20 were generated and compared with the 2000 CDC growth curves. The results show that the growth pattern ofstature-for-age is similar to the CDC data. The weight-for-age and BMI-for-age percentile curves differ substantially from theCDC percentile charts. The shape of the BMI-for-age curves are different from the CDC curves. We conclude that in theUnited States, the weight and BMI values are increasing, there is a progressive fattening of American children. The growth
7
charts generated in the early years as standards for measuring growth might no longer be applicable to today’s population ofAmerican children.
In future, we plan to closely study the characteristic patterns of BMI-for-age curves from the longitudinal data availablethrough NS-EDW and discover early predictive factors of obesity, such as adiposity rebound. To date, early adiposity reboundhas been identified exclusively in research studies in which collection of BMI data to identify growth patterns is systematicallyplanned. However, no studies have made use of clinical data collected from typical, ambulatory practices. Identifying earlyadiposity rebound from clinical practice data may be useful, which encourage clinicians to monitor BMI more carefully inchildren with early rebound and to provide additional counseling.
From the Electronic Medical Records in NS-EDW, fully anonymized versions of routinely measured children’s weight andstature are available for research. The longitudinal nature of this data can be used to investigate individual children’s growthcurves and their relationships with population growth characteristics presented in this paper. Through these efforts, we plan toidentify the presence of early adiposity rebound, to estimate the timing of early adiposity rebound, and use these to preventchildhood obesity.
ACKNOWLEDGMENT
We thank Cynthia Ogden for helping access the CDC data, John Komlos for helping access the NHANES data, ChadKonchack and Justin Lakeman for extracting the NS-EDW data. We have benefited from conversations with and commentsfrom Katherine Flgal, Tim Sanborn, Kibaek Kim, Joyce Ho, Sanjay Mehrotra, Tony Solomonides, Yuan Ji, Nigel Parsad, andJonathan Silverstein.
REFERENCES
[1] C. L. Ogden, M. D. Carroll, L. R. Curtin, M. L.Lamb, K. M. Flegal, ”Prevalence of high body mass index in US children and adolescents 2007-2008,”JAMA 2010; 303(3): 242-9.
[2] R. J. Kuczmarski, C. L. Ogden, S. S Guo, et al., ”2000 CDC growth charts for the United States: Methods and development,” National Center for HealthStatistics. Vital Health Stat 2002;11(246).
[3] http : //www.cdc.gov/growthcharts/[4] G. M. Owen, ”The new National Center for Health Statistics growth charts,” South Med J 1978; 71:296C7.[5] WHO Multicentre Growth Reference Study Group. WHO child growth standards based on length/height, weight and age. Acta Paediatr 2006; 76-85.[6] T. J. Cole, J. V. Freeman, M. A. Preece, ”British 1990 growth reference centiles forweight, height, body mass index and head circumference fitted by
maximum penalized likelihood,” Stat Med 1998;17:407-29.[7] T. J. Cole, M. J. Roede, ”Centiles of body mass index for Dutch children aged 0-20 years in 1980ła baseline to assess recent trends in obesity,” Ann
Hum Biol 1999;26:303-8.[8] T. J. Cole, ”Fitting smoothed centile curves to reference data,” J R Stat Soc 1988; 151:385C418.[9] T. J. Cole, P. J. Green, ”Smoothing reference centile curves: The LMS method and penalized likelihood,” Stat Med 1992;11:1305C19.[10] K. M. Flegal, T. J. Cole, ”Construction of LMS parameters for the Centers for disease Control and Prevention 2000 growth charts,” Hational health
statitics reports; no 63. Hyattscille, MD: National Center for Health Statistics. 2013.[11] C. Chen, Growth Charts of Body Mass Index (BMI) with Quantile Regression. SAS Institure Inc. Cary, NC, USA.[12] Z. Mei, L. M. Crummer-Strawn, A. Pietrobelli, A. Coulding, M. I. Goran, W. H. Dietz, ”Validity of body mass index compared with other
body-composition screening indices for the assessment of body fatness in children and adolescents,” AJCN 2002;7597-985.[13] M. F. Rolland-Cachera, M. Deheeger, F. Belisle, et al., ”Adiposity rebound in children: a simple indicator for predicting obesity,” AJCN 1984;39:129-35.[14] M. F. Rolland-Cachera, M. Deheeger, P. Avons, M. Cuilloud-Bataille, E. Patois, M. Sempe, ”Tracking adiposity patterns from 1 month to adulthood,”
Ann Hum Biol 1987;14:219-22.[15] R. W. Taylor, A. M. Grant, A. Goulding, S. M. Williams, ”Early adiposity rebound: review of papers linking this to subsequent obesity in children and
adults,” Curr Opin Clin Nure Metab Care 2005; 8: 607-12.[16] K. M. Flegal, R. Wei, C. L. Ogden, D. S. Freedman, C. L. Johnson, L. R. Curtin, ”Characterizing extreme values of body mass index-for-age by using
the 2000 Centers for Disease Control and Prevention growth charts,” Am J Clin Nutr 2009; 90(5):1314-20.[17] T. J. Cole, K. M. Flegal, D. Nicholls, A. A. Jackson, ”Body mass index cut offs to define thinness in children and adolescents: international survey,”
BMJ 2007;335:194.[18] G. Rao, ”A new tool needed for identifying and characterizing obesity,” Curr Cardiovasc Risk Rep. 2013.[19] http : //www.cdc.gov/nchs/nhanes/about nhanes.htm[20] http : //statistic− on− air.blogspot.com/2011/09/implementation− of − cdc− growth− charts− in.html[21] S. E. Barlow, W. H. Dietz, ”Obesity evaluation and treatment: Expert committee recommendations,” Pediatrics 1998;102(3):e29. URL: http :
//www.pediatrics.org/cgi/content/full/102/3/e29[22] J. H. Himes, W. H. Dietz, ”Guidelines for overweight in adolescent preventive services: Recommendations from an expert committee,” Am J Clin Nutr
1994;59:307-16.[23] W. S. Cleveland ”Robust locally weighted regression and smoothing scatterplots,” JASA 79:829-36.1979.[24] http : //www.cdc.gov/growthcharts/percentile data files.htm[25] S. M. Williams, ”Weight and height growth rate and the timing of adiposity rebound,” Obes Res. 2005:13:1123-1130.[26] D. M. Janicke, B. J. Sallinen, M. G. Perri, L. D. Lutes, J. H. Silverstein, B. Brumback, ”Comparison of program costs for parent-only and family-based
interventions for pediatric obesity in medically underserved settings,” J Rural Health 2009; 79(7):319-25.[27] E. Waters, A. de Silva-Sanigorski, B. J. Hall, T. Brown, K. J. Campbell, Y. Gao, R. Armstrong, L. Prosser, C. D. Summerbell, ”Interventions for
preventing obesity in children,” Cochrane Database Syst Rev 2011;12: CD001871.
8
Weight−for−age charts: selected smoothed weight percentiles in kilograms
Stature (cm)
Wei
ght (
kg)
2 to 20 years, Boys
1015
2025
3035
4045
5055
6065
7075
8085
9095
105
115
125
1015
2025
3035
4045
5055
6065
7075
8085
9095
105
115
125
2 3 4 5 6 7 8 9 10 11 12 13 14 15 16 17 18 19 20
3rd5th
10th
25th
50th
75th
90th
95th
97th
Data Source: NS−EDW data
CDC−LMS dataNS−EDW data
(a) NS-EDW
Weight−for−age charts: selected smoothed weight percentiles in kilograms
Stature (cm)
Wei
ght (
kg)
2 to 20 years, Boys
1015
2025
3035
4045
5055
6065
7075
8085
9095
105
115
125
1015
2025
3035
4045
5055
6065
7075
8085
9095
105
115
125
2 3 4 5 6 7 8 9 10 11 12 13 14 15 16 17 18 19 20
3rd5th
10th
25th
50th
75th
90th
95th
97th
Data Source: NHANES data
CDC−LMS dataNHANES data
(b) NHANES
Fig. 3: Boys Weight-for-age: 2-20 years
9
Stature−for−age charts: selected smoothed stature percentiles in centimeters
Stature (cm)
Sta
ture
(cm
)
2 to 20 years, Boys
8085
9095
100
110
120
130
140
150
160
170
180
190
8085
9095
100
110
120
130
140
150
160
170
180
190
2 3 4 5 6 7 8 9 10 11 12 13 14 15 16 17 18 19 20
3rd5th
10th
25th
50th
75th
90th
95th97th
Data Source: NS−EDW data
CDC−LMS dataNS−EDW data
(a) NS-EDW
Stature−for−age charts: selected smoothed stature percentiles in centimeters
Stature (cm)
Sta
ture
(cm
)
2 to 20 years, Boys
8085
9095
100
110
120
130
140
150
160
170
180
190
8085
9095
100
110
120
130
140
150
160
170
180
190
2 3 4 5 6 7 8 9 10 11 12 13 14 15 16 17 18 19 20
3rd5th
10th
25th
50th
75th
90th
95th97th
Data Source: NHANES data
CDC−LMS dataNHANES data
(b) NHANES
Fig. 4: Boys Stature-for-age: 2-20 years
10
BMI−for−age charts: selected smoothed BMI (kilograms/meters squared) percentiles
Age (years)
BM
I (kg
/ m
*m)
2 to 20 years, Boys
1315
1719
2123
2527
2931
3335
3739
1315
1719
2123
2527
2931
3335
3739
2 3 4 5 6 7 8 9 10 11 12 13 14 15 16 17 18 19 20
3rd5th
10th
25th
50th
75th
90th
95th
97th
Data Source: NS−EDW data
CDC−LMS dataNS−EDW data
(a) NS-EDW
BMI−for−age charts: selected smoothed BMI (kilograms/meters squared) percentiles
Age (years)
BM
I (kg
/ m
*m)
2 to 20 years, Boys
1315
1719
2123
2527
2931
3335
3739
1315
1719
2123
2527
2931
3335
3739
2 3 4 5 6 7 8 9 10 11 12 13 14 15 16 17 18 19 20
3rd5th
10th
25th
50th
75th
90th
95th
97th
Data Source: NHANES data
CDC−LMS dataNHANES data
(b) NHANES
Fig. 5: Boys BMI-for-age: 2-20 years
11
Weight−for−age charts: selected smoothed weight percentiles in kilograms
Stature (cm)
Wei
ght (
kg)
2 to 20 years, Girls
1015
2025
3035
4045
5055
6065
7075
8085
9095
100
110
1015
2025
3035
4045
5055
6065
7075
8085
9095
100
110
2 3 4 5 6 7 8 9 10 11 12 13 14 15 16 17 18 19 20
3rd5th
10th
25th
50th
75th
90th
95th
97th
Data Source: NS−EDW data
CDC−LMS dataNS−EDW data
(a) NS-EDW
Weight−for−age charts: selected smoothed weight percentiles in kilograms
Stature (cm)
Wei
ght (
kg)
2 to 20 years, Girls
1015
2025
3035
4045
5055
6065
7075
8085
9095
100
110
1015
2025
3035
4045
5055
6065
7075
8085
9095
100
110
2 3 4 5 6 7 8 9 10 11 12 13 14 15 16 17 18 19 20
3rd5th
10th
25th
50th
75th
90th
95th
97th
Data Source: NHANES data
CDC−LMS dataNHANES data
(b) NHANES
Fig. 6: Girls Weight-for-age: 2-20 years
12
Stature−for−age charts: selected smoothed stature percentiles in centimeters
Stature (cm)
Sta
ture
(cm
)
2 to 20 years, Girls
8085
9095
100
110
120
130
140
150
160
170
180
190
8085
9095
100
110
120
130
140
150
160
170
180
190
2 3 4 5 6 7 8 9 10 11 12 13 14 15 16 17 18 19 20
3rd5th
10th
25th
50th
75th
90th
95th97th
Data Source: NS−EDW data
CDC−LMS dataNS−EDW data
(a) NS-EDW
Stature−for−age charts: selected smoothed stature percentiles in centimeters
Stature (cm)
Sta
ture
(cm
)
2 to 20 years, Girls
8085
9095
100
110
120
130
140
150
160
170
180
190
8085
9095
100
110
120
130
140
150
160
170
180
190
2 3 4 5 6 7 8 9 10 11 12 13 14 15 16 17 18 19 20
3rd5th
10th
25th
50th
75th
90th
95th97th
Data Source: NHANES data
CDC−LMS dataNHANES data
(b) NHANES
Fig. 7: Girls Stature-for-age: 2-20 years
13
BMI−for−age charts: selected smoothed BMI (kilograms/meters squared) percentiles
Age (years)
BM
I (kg
/ m
*m)
2 to 20 years, Girls
1315
1719
2123
2527
2931
3335
3739
41
1315
1719
2123
2527
2931
3335
3739
41
2 3 4 5 6 7 8 9 10 11 12 13 14 15 16 17 18 19 20
3rd5th
10th
25th
50th
75th
90th
95th
97th
Data Source: NS−EDW data
CDC−LMS dataNS−EDW data
(a) NS-EDW
BMI−for−age charts: selected smoothed BMI (kilograms/meters squared) percentiles
Age (years)
BM
I (kg
/ m
*m)
2 to 20 years, Girls
1315
1719
2123
2527
2931
3335
3739
41
1315
1719
2123
2527
2931
3335
3739
41
2 3 4 5 6 7 8 9 10 11 12 13 14 15 16 17 18 19 20
3rd5th
10th
25th
50th
75th
90th
95th
97th
Data Source: NHANES data
CDC−LMS dataNHANES data
(b) NHANES
Fig. 8: Girls BMI-for-age: 2-20 years
14
Boys Weight−for−age
0 1 2 3 4 5 6
0 2
0 4
0 6
0 8
010
012
014
0
0
5
10
15
20
data set
age
Wei
ght (
kg)
0 1 2 3 4 5 6
0 2
0 4
0 6
0 8
010
012
014
0
0
5
10
15
20
data set
age
Wei
ght (
kg)
0 1 2 3 4 5 6
0 2
0 4
0 6
0 8
010
012
014
0
0
5
10
15
20
data set
age
Wei
ght (
kg)
0 1 2 3 4 5 6
0 2
0 4
0 6
0 8
010
012
014
0
0
5
10
15
20
data set
age
Wei
ght (
kg)
0 1 2 3 4 5 6
0 2
0 4
0 6
0 8
010
012
014
0
0
5
10
15
20
data set
age
Wei
ght (
kg)
CDCNH99−02NH03−06NH07−10NS−EDW
Fig. 9: Boys Weight-for-age Comparison
5 10 15 20
1020
3040
5060
3rd Percentile
age
Wei
ght (
kg)
CDCNH99−02NH03−06NH07−10NS−EDW
5 10 15 20
1020
3040
5060
age
Wei
ght (
kg)
5 10 15 20
1020
3040
5060
age
Wei
ght (
kg)
5 10 15 20
1020
3040
5060
age
Wei
ght (
kg)
5 10 15 20
1020
3040
5060
age
Wei
ght (
kg)
5 10 15 20
1020
3040
5060
7080
50th Percentile
age
Wei
ght (
kg)
CDCNH99−02NH03−06NH07−10NS−EDW
5 10 15 20
1020
3040
5060
7080
age
Wei
ght (
kg)
5 10 15 20
1020
3040
5060
7080
age
Wei
ght (
kg)
5 10 15 20
1020
3040
5060
7080
age
Wei
ght (
kg)
5 10 15 20
1020
3040
5060
7080
age
Wei
ght (
kg)
5 10 15 20
2040
6080
100
120
140
97th Percentile
age
Wei
ght (
kg)
CDCNH99−02NH03−06NH07−10NS−EDW
5 10 15 20
2040
6080
100
120
140
age
Wei
ght (
kg)
5 10 15 20
2040
6080
100
120
140
age
Wei
ght (
kg)
5 10 15 20
2040
6080
100
120
140
age
Wei
ght (
kg)
5 10 15 20
2040
6080
100
120
140
age
Wei
ght (
kg)
Fig. 10: Selected Weight-for-age Percentiles


![N A P C O Growth 1923 1963[1]](https://img.dokumen.tips/doc/110x75/55d7697dbb61ebdf238b469d/n-a-p-c-o-growth-1923-19631.jpg)