Embed Size (px)
Citation preview

1
Geomatics Synthesis ProjectFinal presentationNovember 24th 2010
Supervisors: Edward Verbree, Cristiaan Tiberius, Ben Gorte, Sisi ZlatanovaGroup members: Ye, Daniel, Martin, Marjolein, Bas, Simeon, Hoe-Ming, Sonia, Stratos, Amir, YiJing, Tom

2
Who are we and why are we here?

3
Synthesis Project Definition
Dedicated to the Climate City Campus (http://www.tudelft.nl/live/pagina.jsp?id=d278c89d-70ee-4257-9824-0bcf0cac34bf&lang=en)
“Make TU Delft a showcase for multidisciplinary climate research”
The Geomatics Synthesis project Our goal:Help building a fundamental framework which will support
multidisciplinary climate research in the campus.
Our objectives:“Provide the tools to measure and model the climate in the
campus“
4
Overview
o Urban Climate research
o The tools to do research on Campus Climate
o Showcases
o Building a spatial-temporal sensor system
o Building a 3D environment for climate research
o Conclusions and future work
5
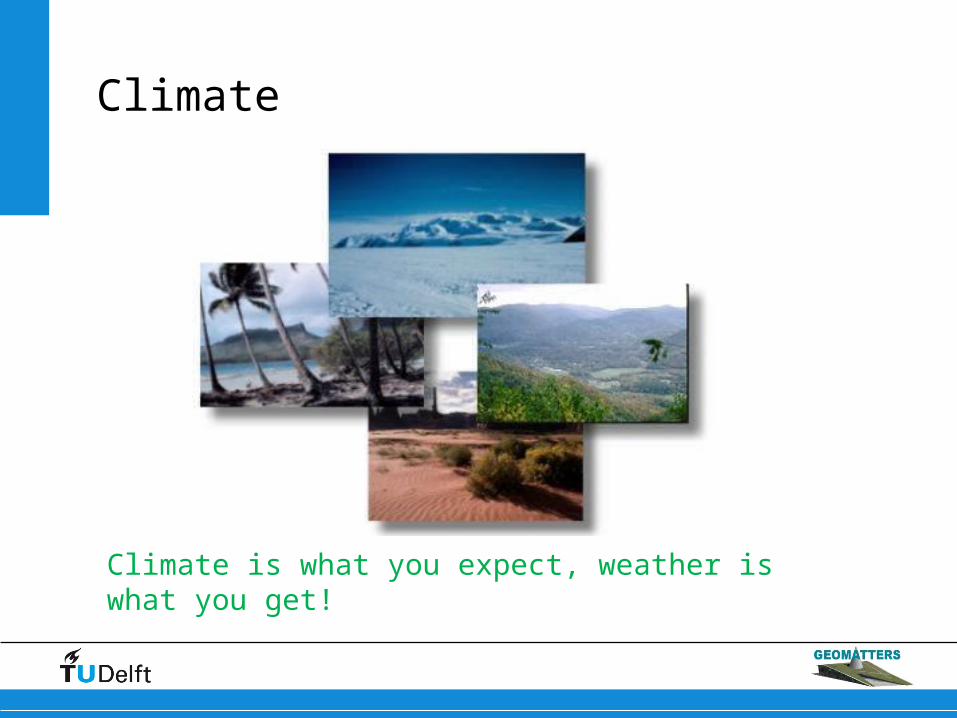
Climate
Climate is what you expect, weather is what you get!

6
Urban ClimateWhat is (urban) climate?
Depends on:
o size
o location
o activities
o stage of development
o …
Example: the energy balance depends on changes of chemical content of the area, CO2 emmision of cars, changes reflection (energy fluxes) of landcover, etc.

7
Stakeholder requirementsStakeholder activity Climate parameter
of interestRequirements on 3D model and sensing system
CCC organization All climate parameters Extensible 3D environment able to store and manage urban objects and their thematic properties
Heat simulations Trees, surface properties Storage of surface parameters and trees. Shadow analysis on trees and buildings
Wind simulations Trees, porosity of tree canopy, building geometry
Ability to insert and extract buildings or trees from the model
People tracking and comfort level
Trees, surface properties, temperature
Continuous tracking of people for mobility research

8
Climate parameters
Dynamic
•Temperature•Wind•Precipitation•Ground Absorption•Air humidity•Air pollution•Soil Contamination•Energy Consumption•People behaviour
Static
•Surface properties•Buildings•Vegetation•Water bodies•Roof types•Building facade
9
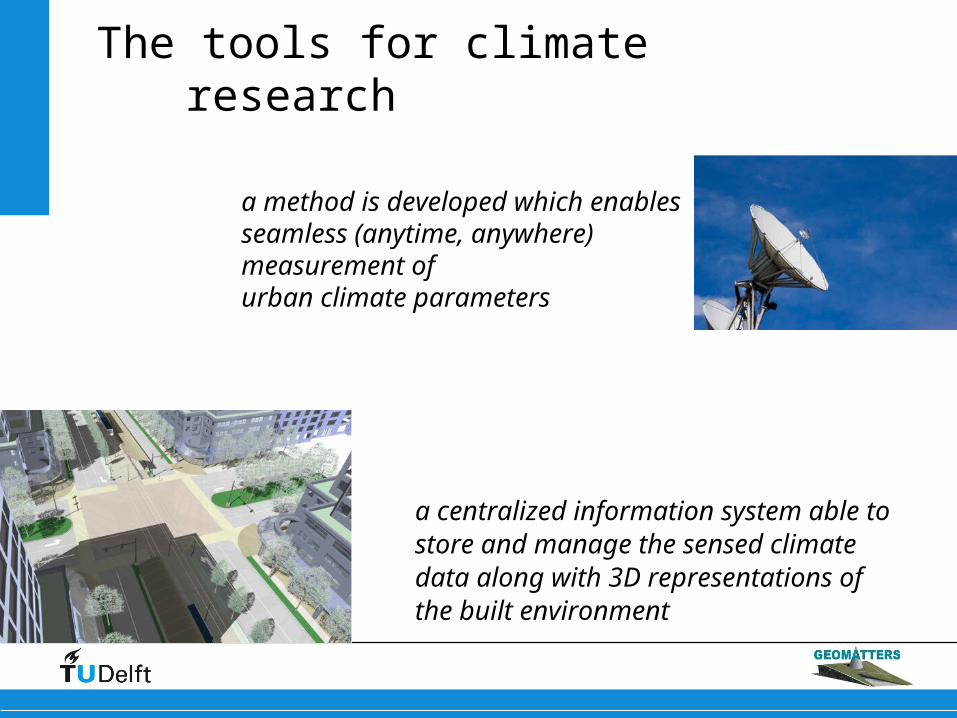
The tools for climate research
a method is developed which enables seamless (anytime, anywhere) measurement ofurban climate parameters
a centralized information system able tostore and manage the sensed climate data along with 3D representations of the built environment

10
The tools for climate research
Spatial Database
Dynamic climate parameters measured by sensors
Static climate parameters by modeling city objects and their properties
Get data by
query
Spatial Database

11
Show casesUrban Planning
Research Techniques:
• Continuous tracking with Wi-Fi & GPS platform (picture)
• Temperature/Heat flux sensors (on platform) (Stored in database)

12
Show casesWind simulation
Research question:• The effect of EWI building on wind pattern in a specific area• The contribution of trees’ to Wind pattern in our campus
Valuable data for research:• 3D geometric surface representations of buildings • 3D geometric surface representations of trees• Ability to extract certain buildings only• Surface attributes• Drag coefficient of canopy (winter and summer)

13
I want to know how EWI matters
Sure …

14
1st: OTB with Trees2nd: OTB without Trees
I want to know how trees
around OTB effect Wind
pattern

15
1st: Trees in Summer2nd: Trees in Winter
ID:12021NAME: ChestnutSPECIES:Castanea_SativaHEIGHT: 3.15NDVI:0.27986900000GEOMETRY: SDO_GEOM
LATIN NAME: Castanea_SativaENGLISH NAME: Sweet ChestnutDUTCH NAME: Tamme kastanjePAI: 2.92WAI: 0.32WAI/PAI: 0.11Compress: 1.6Drag CW: 0.2
I want to know how leaves
matters

16
Show casesUrban Heat Island
Research question:The contribution of green areas and water in our campus.
Valuable data for research:
• Grass areas• Water areas• Green roofs (area of flat roofs)

17
Grass areas, waters and buildings
How grass/water
areas matters?

18
Flat roofs
If I want to have green
roofs?

19
Building a spatio-temporal aware sensor network
Enable seamless (anytime, anywhere) measurement ofurban climate parameters in the university campus

20
MoSCoW diagramSensing requirements

21
Sensor networkSensors for climate research
Stationary and moving platforms
Thermometers
Barometers
Hygrometers
Anemometers and wind vanes
Rain gauges
Disdrometers
Pollution sensors
Human tracking

22
Positioning systemsPositioning techniques
GPS
A-GPSHSGPS
IMESGSM
IR
UWB RFI
D
INSWi-FiBluetoot
h
Ultrasonic
Pseudolites

23
Positioning systemsPositioning technique trade-off
GPS and INS reliable for short time periods, errors with accumulation characteristics
GPS and GSM continuous tracking dependent on the cell tower density and distance to the devices
GPS and IR unique IR and then high accuracy, limited range of IR, sensitivity to sunlight
GPS and Wi-Fi densely deployed access points, ubiquitous hardware with Wi-Fi enabled mobile devices, multipath, signal attenuation due to propagation, NLOS
GPS and Bluetooth like Wi-Fi, limited range and communication speed

24
Positioning systemsPositioning techniques combination
GPS
A-GPSHSGPS
IMESGSM
IR
UWB RFI
D
INSWi-FiBluetoot
h
Ultrasonic
Pseudolites

25
Positioning systemsLimitations- GPS blind spots in the campus
Survey with a U-blox GPS receiver

26
Positioning systemsLimitations- GPS blind spots

27
Positioning systemsLimitations- GPS blind spot map
GPS line-of-sight in OTB
GPS availability in OTB

28
Positioning systemsLimitations- Wi-Fi blind spots in the campus

29
ImplementationAccuracy table OTB survey

30
ImplementationContinuous tracking
• Testing usability of available GPS receivers • Garmin 76CSx• U-blox AEK-4t
• Surveying WiFi network• Cisco Aironet Access Points• Cisco Wireless LAN Controllers

31
ImplementationCombinationAlgorithm

32
ImplementationSensors
• Arduino open-source electronics prototyping platform• Low voltage temperature sensor
• Python to read the measurement from the Arduino

33
ConclusionsAdvantages
• Positioning where no GPS is available due to WiFi positioning
• Easy to extend WiFi positioning to indoor environments
• No location knowledge of Access Points needed
• Continuously track sensors within an urban environment
• Other sensors can be used in combination with the Arduino
• Digital• Analog
• GPS shield is available for the Arduino

34
ConclusionsDisadvantages
• WiFi fingerprinting within the TU Delft campus• Not enough coverage of Access Points for positioning
• WiFi blind spots• Low accuracy
• Access Points are placed in a line, zigzag preferred• Transmit Power Control
• Client sends collected fingerprints over the WiFi network• When Access Points are discovered but no data
connection is available the fingerprint is discarded

35
ConclusionsDisadvantages
• Synchronization of devices is difficult• All components write their data into a
data stream so the python code has to poll this stream to acquire the data
• WiFi fingerprint has to be sent to the Positioning Engine, matched and the location streamed back

36
Building a 3D environment for urban climate research
a centralized information system able tostore and manage the sensed climate data along with 3D representations of the built environment

37
MoSCoW diagramSensing requirements

38
Needed objectsWhich objects to model?
• Tree
• Building
•Roof: grass
•Side wall: glass
•Front wall: concrete
• Terrain
• Sensor: Climatic measurements (temperature, humidity, wind flow, rainfall etc.)
• Landuse

39
Literature studyHow to model these objects and attributes?
DXF:o No Thematic and topology attributes
SHP:o Only simple features and no topology
VRML:o No Thematic attributes
KML:o No Thematic attributes
CityGML:Geometric and thematic modelTexture surface and appearanceMultiple Level Of Details for building, trees and terrainTime measurement
40
Literature studyWhy database?
Advantages of Oracle Spatial Database:o Easy access via different software for different usero Make query of objects and attributeso Easy extension of attributes and objects (add column/table)o Spatial analysis and selection in 3D
File based:o Hard to extract infoo Hard to access by different userso Hard to extend

41
ImplementationLand Use
• Processing & Storage
Topograph
ic data
Water bodyRoads
Buildings
Grassland
Land use2D polygons
• We can…Calculate percentage of area of each land cover type within the campus.Calculate how much area of water is within 10 meters distance of OTB.etc…

42
ImplementationBuildings
• We can…Get a campus without EWI building.Retrieve the reflectivity of roof of Civil Engineeringetc…
• Processing & Storage
Existing CityGML model
3D Multi-surfaces

43
ImplementationSensors• Processing & Storage
• We can…Find the hottest/coldest hour of
a day in a certain location.Compare same measurement
from different times.
3D points
Measurements (location,
temperature, time)

44
ImplementationDigital Terrain Model
• Storage
• We can…Find the most fluctuated ground in the campus.Find the lower ground where water may flow to
after rainfall.etc.
Triangulated point cloud
3D surfaces

45
ImplementationTrees• Storage
• We can…Get the height and species of trees.Give trees with seasonal parameters.
3D multiple-surface
Tree surfacePoint Cloud
Tree parameters
46
Literature studyTrees & Climate
• Trees are important in urban heat mitigation strategies:
Create shadeReduce windspeedCool the environment (evapotranspiration)
Why include trees?
Logo of trees for cities
47
Literature studyTrees & Climate
So which tree parameters are useful for climate research?
• GeometrySize, shape, volume area are related to other climate parameters.
Shade and wind analysis.• Drag Coefficient
Necessary for wind analysis.
• Leaf Area IndexLAI is used to predict photosynthetic primary production and as a
reference tool for crop growth.• Normalized Difference Vegetation Index
NDVI is directly related to the photosynthetic capacity and hence
energy absorption of plant canopies.

48
ImplementationOuter hull reconstruction for LOD2

49
ImplementationLOD1 and LOD2

50
Implementation of LAILeaf Area Index • Determine the size of the
footprint from the acquisition system:
ALS (FLIMAP)
• Calculated the probability echo returns from a tree branch

51
Implementation of Drag Coefficient
Climate parameters & Trees
• Beyond the scope of this project to remotely sense the tree type
• Drag coëfficiënt is mostly dependent on the tree type and season
• Therefor a manual classification is performed and stored in the database

52
Implementation - NDVIClimate parameters & Trees
• NDVI raster map derived from Quickbird
• Computed average NDVI value per tree around OTB
• Stored in the database as a attribute of the tree

53
Literature studyDigital Terrain Model (DTM) & Climate
DTMs allow the study of the impacts of terrain on climate atmeso or micro-scale:
• Watershed / Waterflow analysis• Hydrological modeling • Shade analysis • Wind interaction• Etc
54
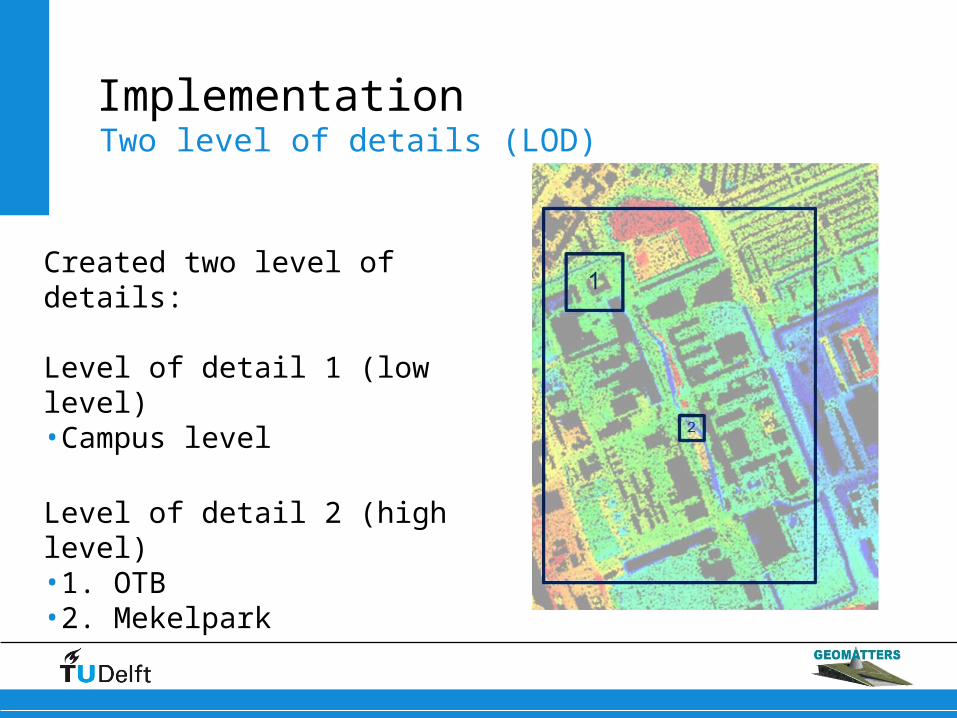
Implementation
Created two level of details:
Level of detail 1 (low level) •Campus level
Level of detail 2 (high level)•1. OTB•2. Mekelpark
Two level of details (LOD)

55
ImplementationExample of DTM around OTB
• Constraints:• Buildings are not empty• DTM and buildings do not connect perfectly• Random filtering instead of an algorithm that fixes the relevant vertices

56
ConclusionsAdvantages
• The Synthesis project has developed a 3D framework which is able to store representations of the urban environment and measurements made therein
• The 3D framework stores geometries and relevant attributes of all in several level of details:• Buildings• Trees• Terrain • Land use
• CityGML has been extended to support climate research
• The 3D framework is able to store measurements performed by static and mobile platforms

57
ConclusionsDisadvantages
• Custom software has to be written to handle these extensions• Exporting to CityGML is difficult• More parameters could have been extracted, due
to lack of time, scarcity and complexity of extraction algorithms this is limited

58
Conclusions
• CityGML is a suitable model for climate research • The ID increases continuously • Not all the tables are created (point, line) • The place for properties of surfaces … materialattrib?• The exporter does not consider new attributes (and classes) • There is no triggers (the user is responsible for the records in the
database)
CityGML database

59
Conclusion
Framework for climate research:
Implement more positioning techniques to improve the performance of continuously tracking mobile platforms.
Create interface for future users to easily input new features and extract data from spatial database.
The accessibility to the framework could be improved by using the web and mobile networks.
Future work

60
THANK YOU
Special thanks to:Our tutorsThe involved actors and companies