Embed Size (px)
Citation preview

1 © Experian Public

2 © Experian Public
Overview
Snapshot of Experian
For the year ending 31 March 2018
* At 12 November 2018
Experian is the world’s leading global
information services company. Our roots lie in
assessing credit risk; today we do much more.
Experian is the world’s leading
global information services company
We use data to help people and organisations to assess, predict, plan
and protect themselves
We are custodians of data on over 1 billion people globally
We have a diverse and growing range of clients and geographies…
… and multiple and growing uses for our data
We are the market leader in this growing market…
… and we are securing new types of data, and finding new uses for our data
We are large, stable and cash-generative:
• £17bn market cap* / currently FTSE top 35*
• 16,500 employees / 39 countries
• FY18: $4.7bn revenue / $1.3bn Benchmark EBIT
• Highly cash generative with high cash conversion rate
• 15.7% Return on Capital Employed (ROCE)

3 © Experian Public *Please refer to preliminary results or annual financial statements for definitions of organic revenue growth and Benchmark EBIT to Operating cash flow conversion
Market-leading global information
business with strong market
positions---------------------------------------------------------------
Significant growth potential
-----------------------------------------------------------
Strong financial track record
------------------------------------------------------------
• We are the market leader, holding the
number one or two positions across our
largest markets – the USA, Brazil and the UK
• We have a diversified portfolio of
businesses across different sectors and
geographies
• Our business model is scalable, which
means we can grow the business quickly
with low incremental cost
• We drive significant synergies across our
operations by combining data sources,
integrating analytics and using technology to
secure competitive advantage
• All the above creates a high barrier to entry
• We continually invest in new product
innovation to address new market
opportunities
• We are expanding our position with
existing clients and adding new ones in our
more developed markets
• We have considerable potential to
introduce and expand our services in
emerging markets
• We are expanding our services in new
industry segments, such as US
healthcare
• The revenues we generate typically have a
recurring profile and this, coupled with
successful growth investment, has meant we
have averaged organic revenue growth* of
5% each year since we became a listed
company in 2006. Our aim is to consistently
grow organic revenue at a mid-single digit
rate
• We are a highly cash generative, low
capital intensity company. Our Benchmark
EBIT to Operating cash flow* conversion rate
has averaged 99% since demerger
• We make the best use of cash we generate,
balancing the need for organic investment in
innovation, acquisitions and returns to
shareholders through dividends and share
repurchases
Overview
The Experian investment case

4 © Experian Public
Overview
Experian business activities – our services
● Large databases
● Credit history data on >1bn people and 145m businesses
● Segmentation data on markets with 2.8bn people
● Automotive information
● 18 consumer credit bureaux
● 11 business credit bureaux
● Credit reports
● Analytical sandbox
● Advanced software and analytics
● Credit scores
● Decisioning software
● Data quality
● Fraud software ● Health
● Analytical tools ● Expert consulting
● Direct to consumer credit monitoring
● Credit comparison services / lead generation
● Identity theft protection services
● Affinity (white label) credit and identity monitoring services
Decisioning
US$1.2bn*
Consumer Services
US$0.9bn
Data
US$2.6bn*
Business-to-Business (B2B)
Business-to-Consumer (B2C)
Revenue for 31 March 2018. * Reconciled for the new business segment Business-to-Business and its sub-divisions Data and Decisioning.
5 © Experian Public
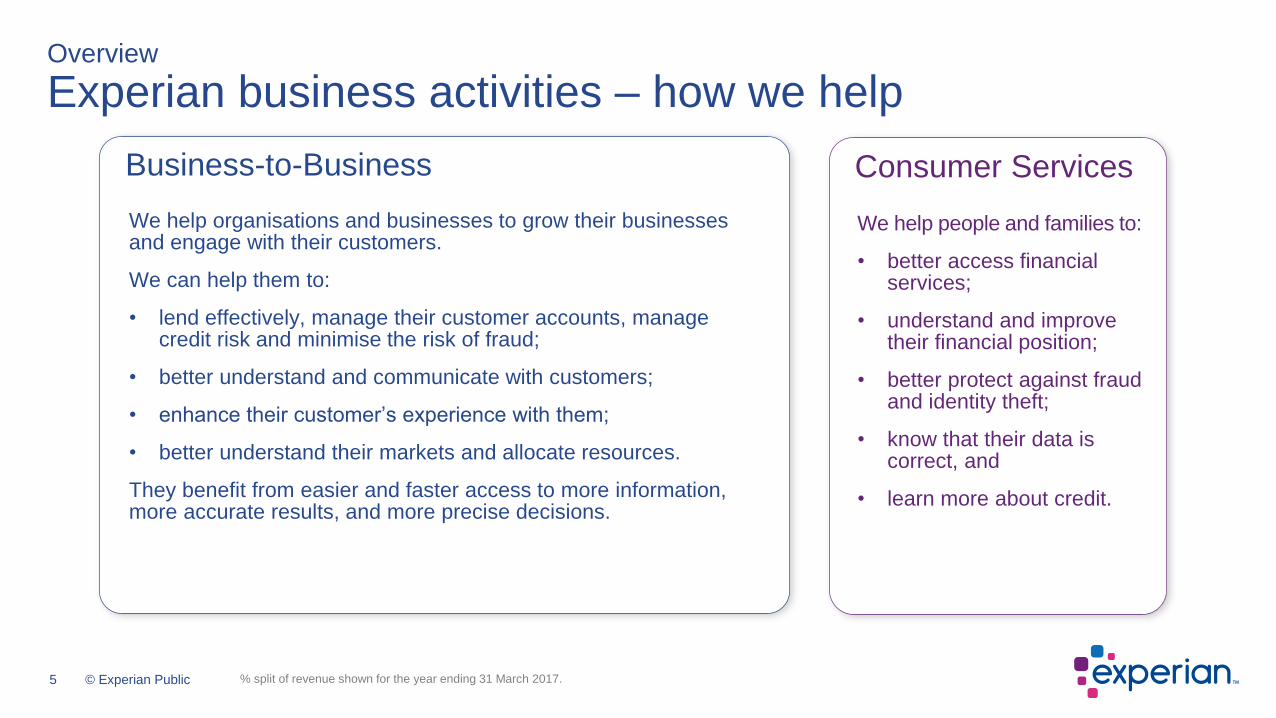
Consumer ServicesBusiness-to-Business
Overview
Experian business activities – how we help
We help organisations and businesses to grow their businesses and engage with their customers.
We can help them to:
• lend effectively, manage their customer accounts, manage credit risk and minimise the risk of fraud;
• better understand and communicate with customers;
• enhance their customer’s experience with them;
• better understand their markets and allocate resources.
They benefit from easier and faster access to more information, more accurate results, and more precise decisions.
We help people and families to:
• better access financial services;
• understand and improve their financial position;
• better protect against fraud and identity theft;
• know that their data is correct, and
• learn more about credit.
% split of revenue shown for the year ending 31 March 2017.
By customer
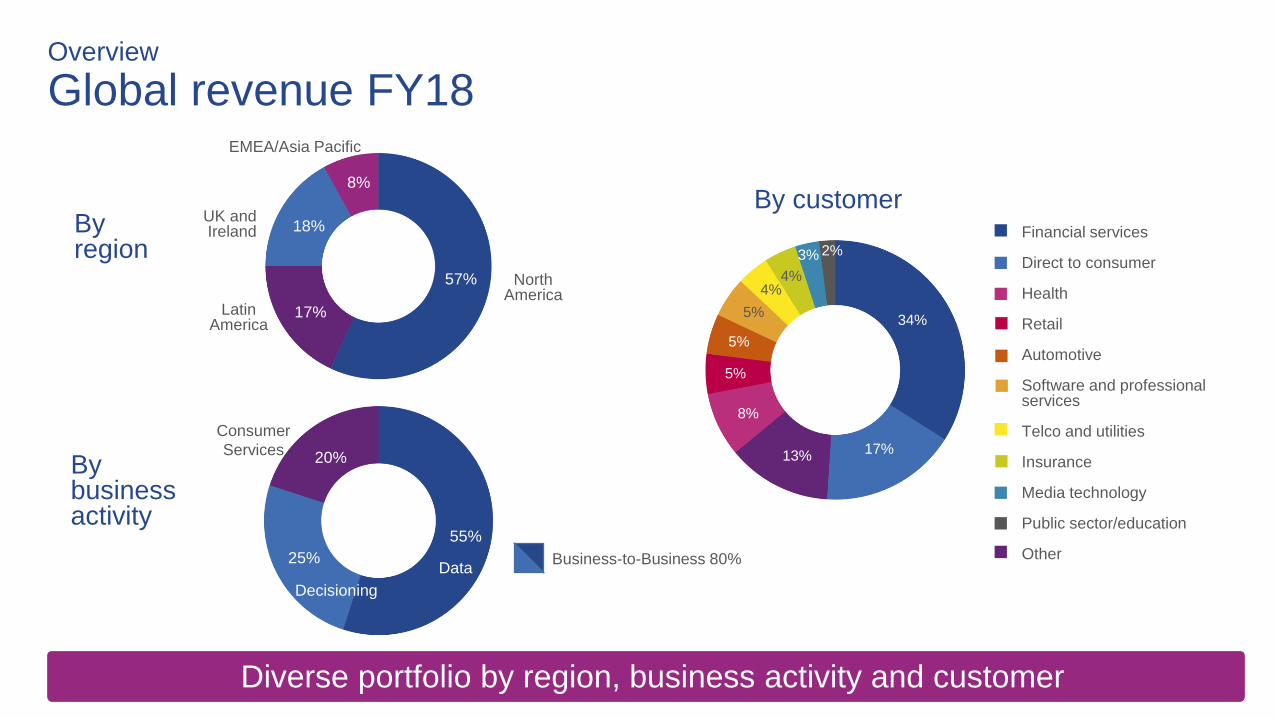
Overview
Global revenue FY18
Diverse portfolio by region, business activity and customer
Data
Decisioning
55%
25%
20%By business activity
EMEA/Asia Pacific
UK and Ireland
North America
Latin America
8%
18%
57%
17%
Consumer
Services
By region
Business-to-Business 80%
Financial services
Direct to consumer
Health
Retail
Automotive
Software and professionalservices
Telco and utilities
Insurance
Media technology
Public sector/education
Other
17%13%
8%
5%
5%
5%
4%
3% 2%
34%
4%

7 © Experian Public
57% 75%
82%* 83%
91%
43%
25%
18%17%
9%
4,6571
3,3622
1,9982
1,7432
9171
0
500
1,000
1,500
2,000
2,500
3,000
3,500
4,000
4,500
5,000
Experian Equifax TransUnion D&B FICO
North America Other regions
Overview
Market leader with unparalleled global reach and range
1 Year ended 31 March 2018
2 Year ended 31 December 2017
This analysis covers traditional competitors that are publicly listed. It does not include companies where a single division competes against Experian.
*US only.
Source: Latest full year revenue, company SEC filings
Glo
ba
l re
ve
nu
e U
S$
m

8 © Experian Public
Strategic overview

9 © Experian Public
Strategic overview
First-half financial highlights
All growth rates are at constant currency.
Organic revenue
Total revenue
Benchmark EBIT
Benchmark EPS
+8%
+9%
+10%
+12%

10 © Experian Public
Strategic overview
First-half strategic highlights
Build data depth and quality Engage more consumersAccelerate innovation
Ascend: 14* strategic clients in US, launching US mid-market, introduced in UK and EMEA
PowerCurve: major new agreements; SaaS version pending
CrossCore: additional 28 agreements signed
Text for Credit: 5 markets
Verdus (open data): engaging with clients
Alternative data:
• Clarity pipeline grows
• Adding consumer-permissioned data
Trended data
• US for mortgages
• UK introduced Nov 2018
IdentityWorks:
• 280,000 members
Free memberships: over 45m across 3 markets
• US 16m
• UK 4.7m
• Brazil over 25m
Credit marketplace agreements in Asia Pacific
* As at 31 October 2018.
11 © Experian Public
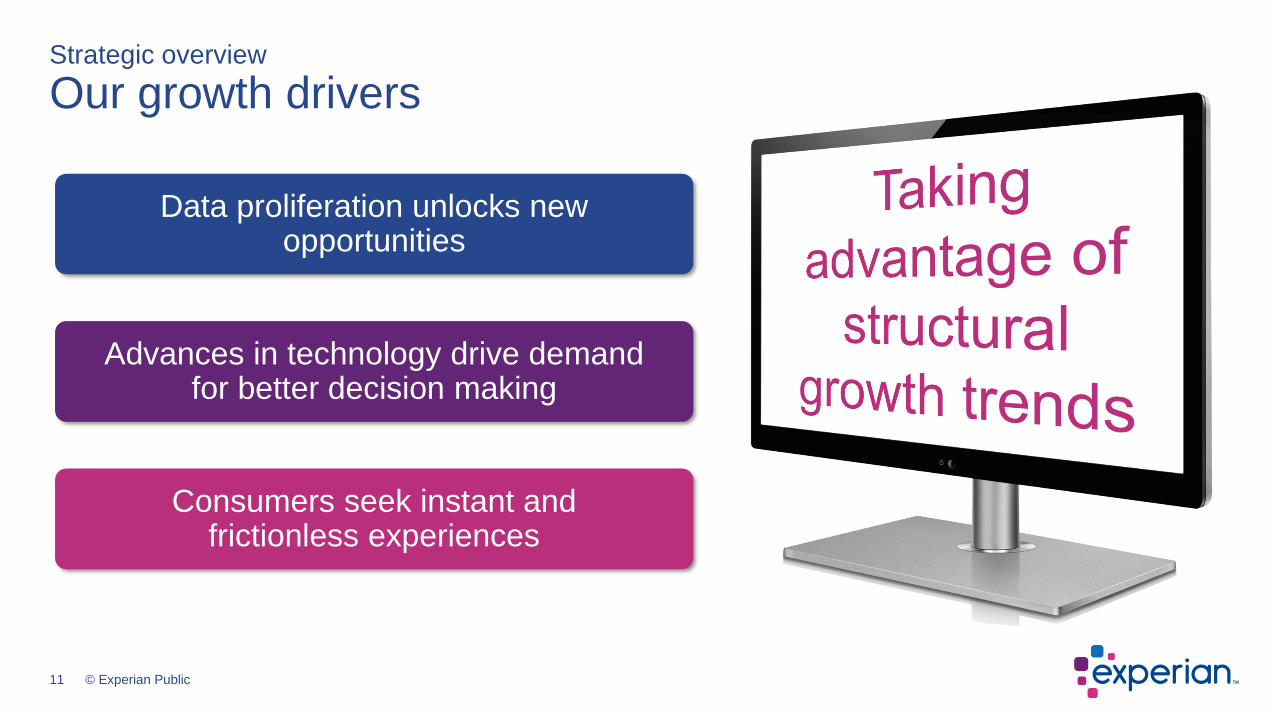
Strategic overview
Our growth drivers
Data proliferation unlocks new opportunities
Advances in technology drive demand for better decision making
Consumers seek instant and frictionless experiences
12 © Experian Public
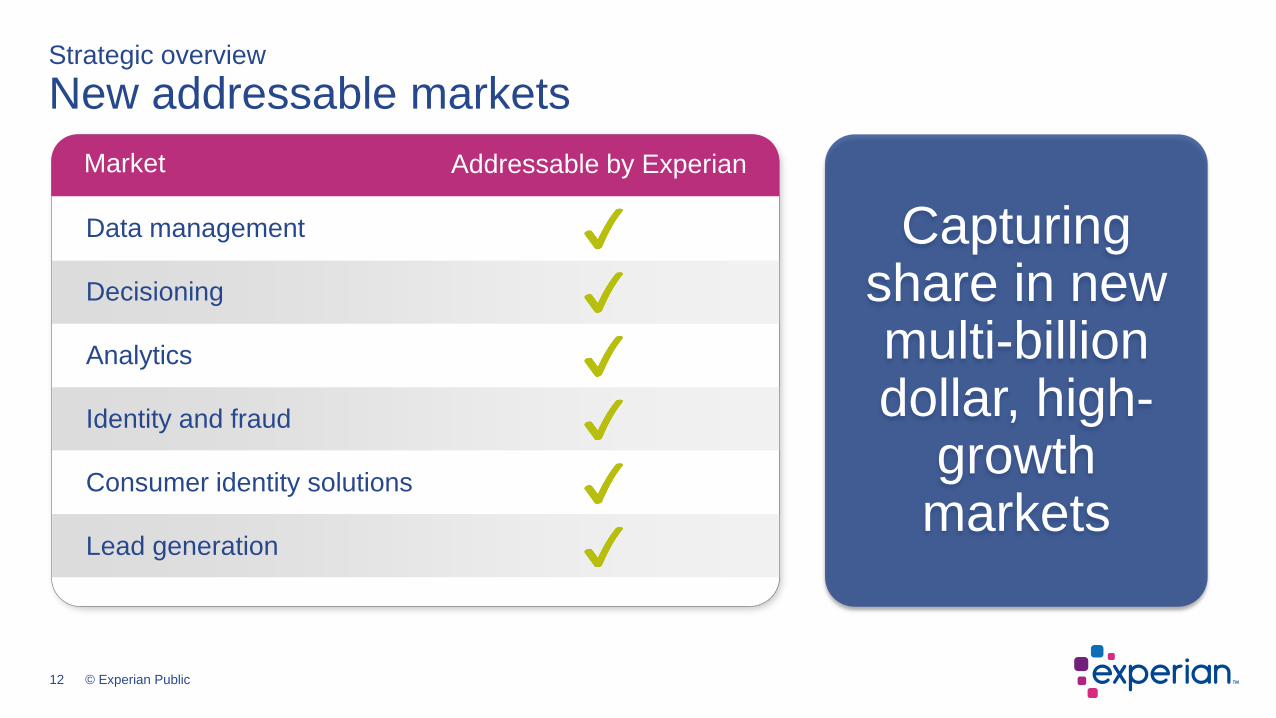
Strategic overview
New addressable markets
Lead generation
Data management
Decisioning
Analytics
Identity and fraud
Consumer identity solutions
Addressable by ExperianMarket
Capturing share in new multi-billion dollar, high-
growth markets
13 © Experian Public
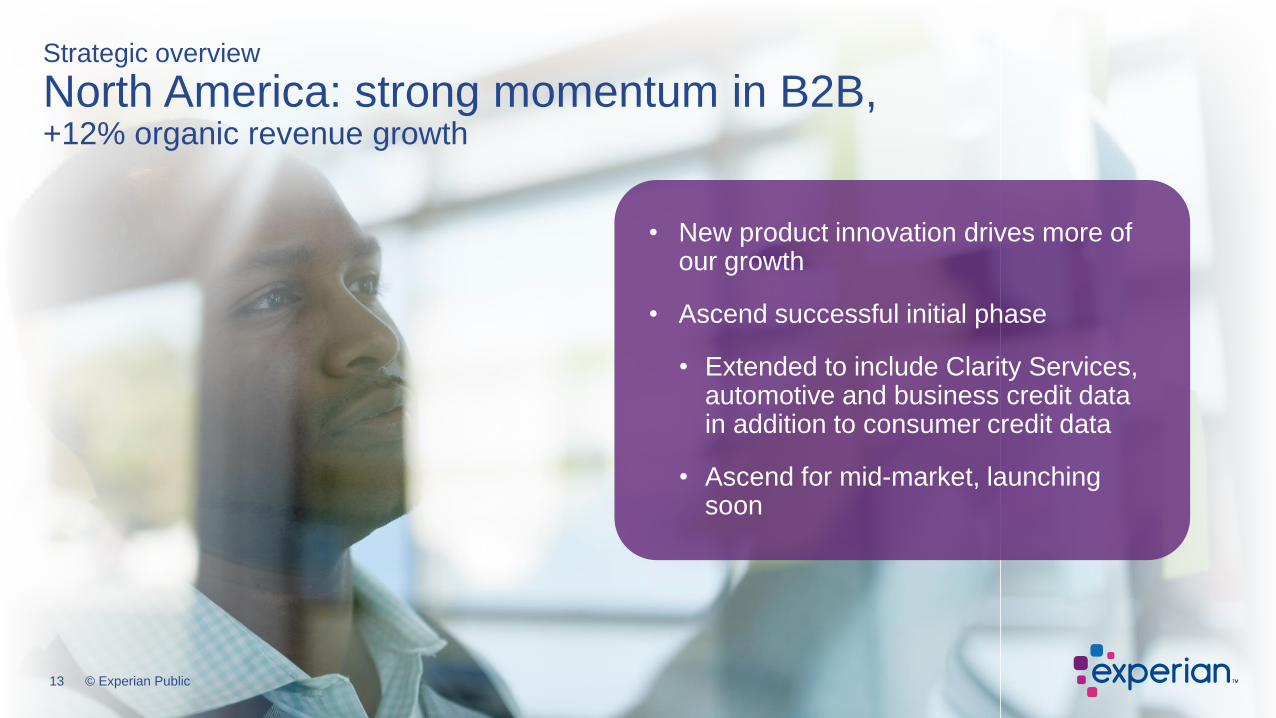
Strategic overview
North America: strong momentum in B2B, +12% organic revenue growth
• New product innovation drives more of our growth
• Ascend successful initial phase
• Extended to include Clarity Services, automotive and business credit data in addition to consumer credit data
• Ascend for mid-market, launching soon
13 © Experian Public

14 © Experian Public
Strategic overview
North America: strong momentum in B2B
Winning in the marketplace with Decisioning
• Large organisations upgrading infrastructure
• PowerCurve secures major wins
• Health grows double-digit, with strong pipeline
14 © Experian Public

15 © Experian Public
Strategic overview
North America Consumer Services: +8% organic revenue growth
Identity protection
• Strategy centred on:
• Putting consumers in control
• Driving engagement
• Strong new product roadmap for H2
Good progress in identity

16 © Experian Public
Experian Financial Profile
CreditMatch
New product pipeline
Helps consumers understand their position
Enables consumers to get offers at higher approval odds
To broaden reach and increase free member base
1
2
3
Strategic overview
North America Consumer Services: lead generation grows strongly
16m free members
17 © Experian Public
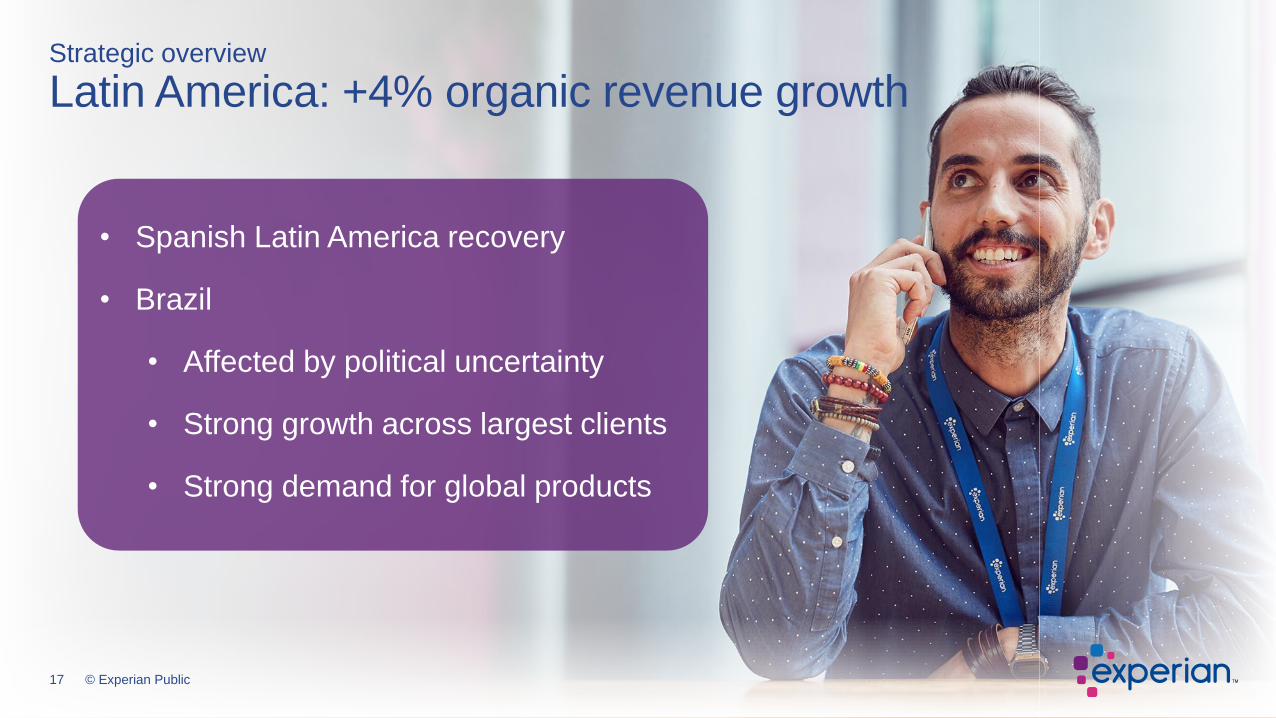
Strategic overview
Latin America: +4% organic revenue growth
• Spanish Latin America recovery
• Brazil
• Affected by political uncertainty
• Strong growth across largest clients
• Strong demand for global products
17 © Experian Public

18 © Experian Public
Strategic overview
Brazil: consumer initiative
Engage through free offers
Consulta Score Ensina Positive data
Revenue streams
Over 25m free members
AntifraudeLimpa Nome eCred
0 300 700 1,000
Serasa score range
• Free offers drive
engagement
• Consumers are
contributing valuable
data
• Products suited to
different consumer
profiles
19 © Experian Public
Others
EXPN
LexisNexis
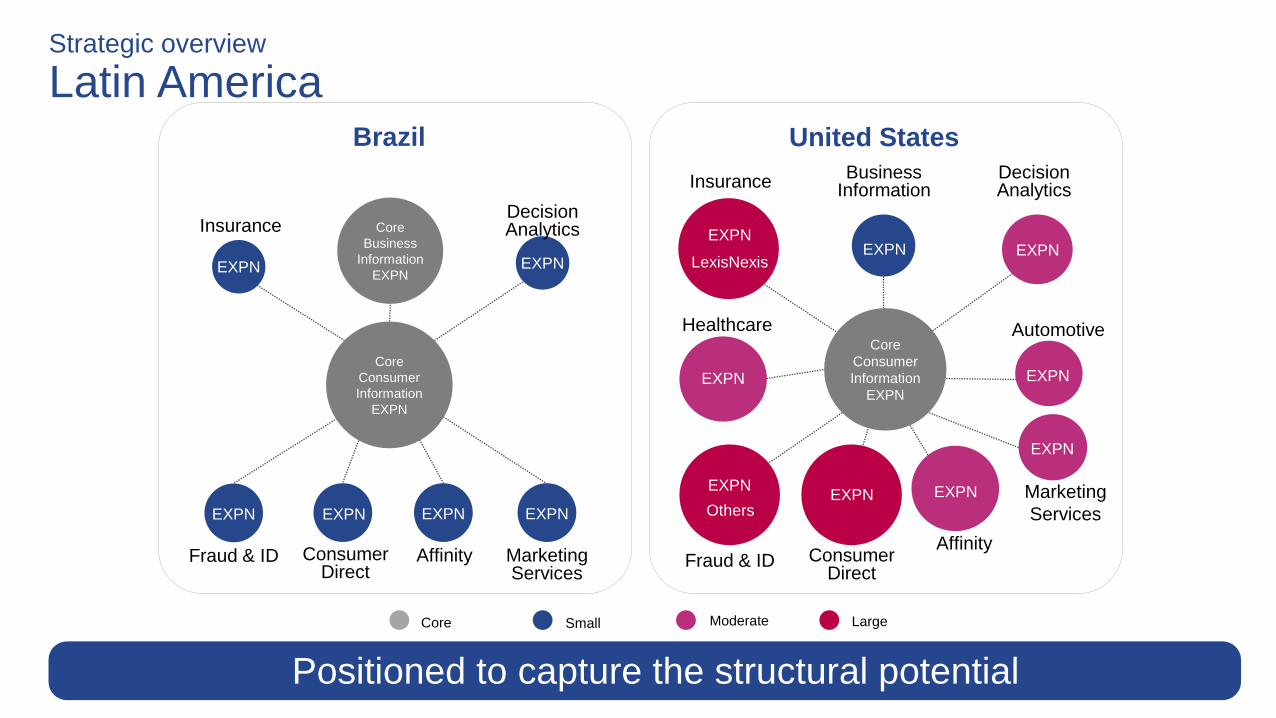
Strategic overview
Latin America
Small Moderate LargeCore
Positioned to capture the structural potential
BusinessInformation
DecisionAnalytics
EXPN
Marketing
Services
EXPN
ConsumerDirect
Healthcare
EXPN
Automotive
Fraud & ID
EXPN
Insurance
Affinity
EXPN
Core
Consumer
Information
EXPN
EXPN
EXPN
Core
Business
Information
EXPN
DecisionAnalytics
EXPN
Insurance
EXPN
EXPN
United StatesBrazil
MarketingServices
EXPN
ConsumerDirect
EXPN
Fraud & ID
EXPN
Affinity
EXPN
Core
Consumer
Information
EXPN

20 © Experian Public
Strategic overview
UK and Ireland B2B: +5% organic revenue growth
• Big wins for traditional credit and software
• Bringing new products to market:
• Ascend
• Trended data
• Engaging clients with Verdus (open data)
20 © Experian Public

21 © Experian Public
Strategic overview
UK and Ireland Consumer Services Further sequential improvement
4.7m free members
Expand sectors to meet more needs
Create a true financial marketplace
Launch data-driven recommendations
Our vision
The one place to manage all your finances
Get your next credit card with just a single click
Auto Switch – never pay more than you need to

22 © Experian Public
Strategic overview
EMEA/Asia Pacific: +13% organic revenue growth
Bureau builds
New products: Experian One, Ascend
Leadership through PowerCurve and CrossCore
Establishing data marketplaces, e.g. C88
Customer experience
Commercial strategy
Bureau modernisationG
row
th p
illa
rsF
oun
da
tio
ns
22 © Experian Public
23 © Experian Public
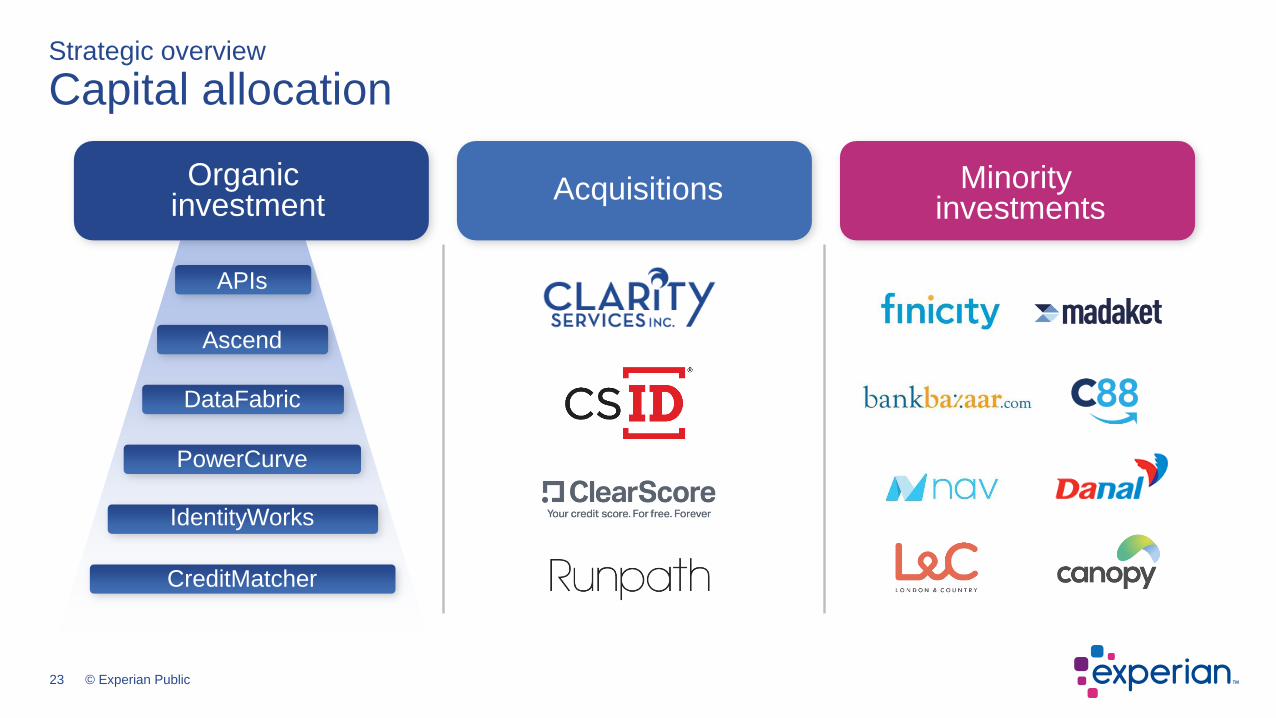
Strategic overview
Capital allocation
Ascend
PowerCurve
APIs
DataFabric
IdentityWorks
CreditMatcher
Organic investment
Acquisitions Minority investments

24 © Experian Public
Capital strategy
Our medium-term financial framework
Organic business
Mid single-digit organic growth
Operating cash flow application
Strong growth in Benchmark earnings per share
• Structural growth
• Strong cash generation
• Strong core and portfolio optionality
Organic investment Portfolio
Shareholder returns
Optimised capital allocation
25 © Experian Public
Recent performance

26 © Experian Public
Recent performance
Highlights – H1 FY19
Certain financial data have been rounded within this presentation. As a result of this rounding, the totals of data presented may vary slightly from the arithmetic totals of such data.Revenue, Benchmark EBIT growths and Benchmark EBIT margin are on an ongoing activities basis.
Margin progression
Total revenue growth
Organic revenue growth
Benchmark EBIT margin
Dividend per share growth 4%Dividend
Benchmark operating cash flow conversion 74%Operating cash flow
Benchmark earnings per share growth 8%Earnings
27.5%EBIT
7%Revenue Growth
Actualrates
Constant rates
8%
9%
12%
20 bps (10) bps

27 © Experian Public
Recent performance
Organic revenue trends
B2B defined as Credit Services, Decision Analytics and Marketing Services for FY17 and FY18.B2B defined as Data and Decisioning for FY19.
Strong B2B growth12%
10%
8%
6%
4%
2%
0%
FY17 FY18 FY19
H1 H2 H1 H2 H1
Consumer Services growing well
-10%
2%
0%
-2%
-4%
-6%
-8%
4%
6%
H1 H2 H1 H2 H1
FY18 FY19FY17

28 © Experian Public
Recent performance
Foreign exchange translation impact on EPS
FX rates FX movementsCurrencyRule of thumb full-year impact
on Benchmark EPS
3.751 ± 10%Brazilian real
(BRL)c. ± 2 US cents
1.291 ± 10%Pound sterling
(GBP)c. ± 1 US cents
1. FX rates are spot rates as at 12 November 2018.

29 © Experian Public
Recent performance
FY18 capital framework
1 Share repurchases as at 31 March 2018.
2 Funds from Operations is defined as Benchmark free cash flow plus organic capital investment (capital expenditure).
Capital summary
Organic capital investment
Share repurchaseprogramme
Dividends
Acquisitions and minority investments
Funds from Operations 2
Increase in net debt
Other
Capital allocation
• Organic innovation investment
• Acquisitions in the year included Clarity and Runpath
• FY18 shareholder returns:
• Dividend growth of 8%
• US$566m1 net share repurchases completed during FY18
• Return on Capital Employed (ROCE) of 15.7%, up 0.2% from prior year
• Expect to make up to $400m of net share repurchases
US$m
0
200
400
600
800
1,000
1,200
1,400
1,600
Cashgenerated
Uses ofcash

30 © Experian Public
Summary and outlook
• Good financial and strategic progress in the first half
• Strong B2B performance
• Good contribution from Consumer Services
• Outlook for FY19; at constant currency
• Strong revenue growth
• EBIT growth at or above rate of revenue growth
• Strong progress in Benchmark EPS
• Continued focus on investments to drive future value
creation

31 © Experian Public
This slide has been left intentionally blank

32 © Experian Public
Appendix

33 © Experian Public
Appendix
Modelling considerations for FY19
Acquisitions• FY18 acquisitions performing well and are now all included in organic
numbers from 1 October 2018
Foreign exchange• Based on recent rates, expect foreign exchange to be c.500bps headwind to
EBIT versus 400bps expected at Q1
Net interest • Expected to be c.US$110m; inclusive of share repurchase programme
Tax • Benchmark tax rate to be c. 26%
Share repurchases • Full year WANOS1 expected to be in the region of 903m shares
Capital expenditure • Capital expenditure of c.9% of revenue
1. Weighted average number of shares.

34 © Experian Public
Appendix
H1 revenue walkthrough
1 At actual foreign exchange rates.
+12% +4%
+5% +13%
+5%
FY19 H1revenue before
FX and acquisitions
FY19 H1 reported revenue
from ongoing activities
North
America B2B
Foreign
exchange
UK and
Ireland B2B
EMEA/
Asia PacificLatin
America
Acquisitions
FY18 H1revenue from
ongoing activities
Consumer
Services
+7%Total
revenue growth1
+9%Total
revenue growth
+8% Organic revenue growth
+9%B2B organic revenue growth
US$2,204m
US$2,364m
35 © Experian Public
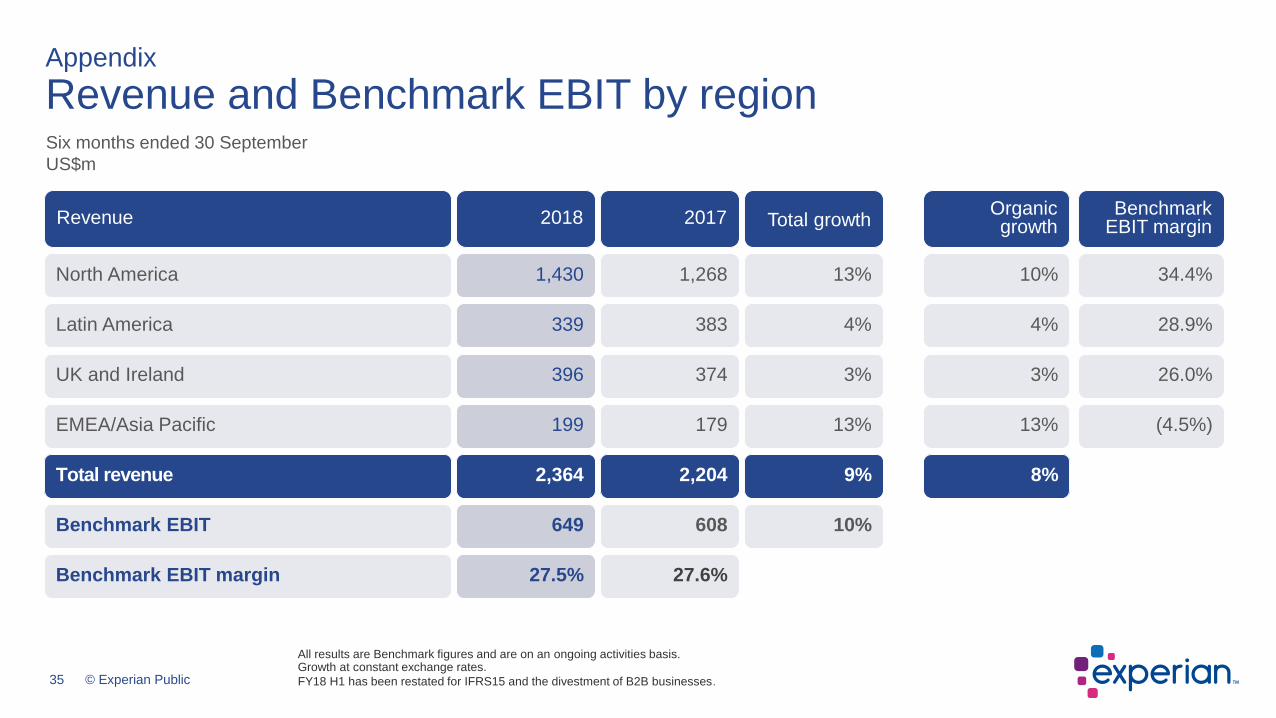
Appendix
Revenue and Benchmark EBIT by region
All results are Benchmark figures and are on an ongoing activities basis.Growth at constant exchange rates.
FY18 H1 has been restated for IFRS15 and the divestment of B2B businesses.
Six months ended 30 September
US$m
Revenue
North America
Latin America
UK and Ireland
EMEA/Asia Pacific
Total revenue
Benchmark EBIT
Benchmark EBIT margin
Organic growth
Benchmark EBIT margin
10% 34.4%
4% 28.9%
3% 26.0%
13% (4.5%)
8%
Total growth 20172018
13%1,2681,430
4%383339
3%374396
13%179199
9%2,2042,364
10%608649
27.6%27.5%

36 © Experian Public
Total growth
301Decisioning
Six months ended 30 September
US$m
Appendix
North America
All results are Benchmark figures and are on an ongoing activities basis.Growth at constant exchange rates.
FY18 H1 has been restated for IFRS15 and the divestment of B2B businesses.
2018
1,027
403
1,430
492
34.4%
Business-to-Business
Consumer Services
726Data
274
2017
893
375
1,268
411
32.4%
619
Total revenue
Benchmark EBIT
Benchmark EBIT margin
10%
15%
8%
13%
20%
17%
Organic growth
10%
12%
8%
10%
12%
37 © Experian Public
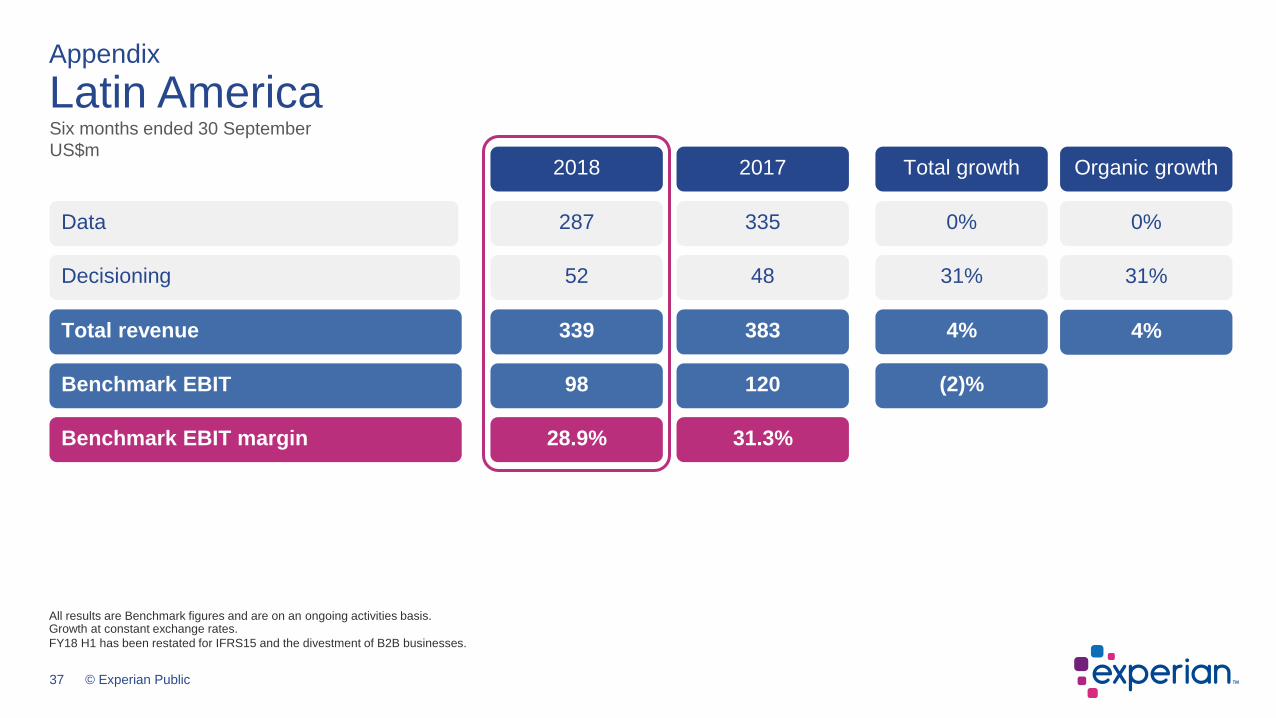
339
98
28.9%
383
120
31.3%
Total revenue
Benchmark EBIT
Benchmark EBIT margin
4%
(2)%
4%
52Decisioning
Six months ended 30 September
US$m
Appendix
Latin America
287Data
48
335
31%
0%
31%
0%
All results are Benchmark figures and are on an ongoing activities basis.Growth at constant exchange rates.
FY18 H1 has been restated for IFRS15 and the divestment of B2B businesses.
Total growth2018 2017 Organic growth
38 © Experian Public
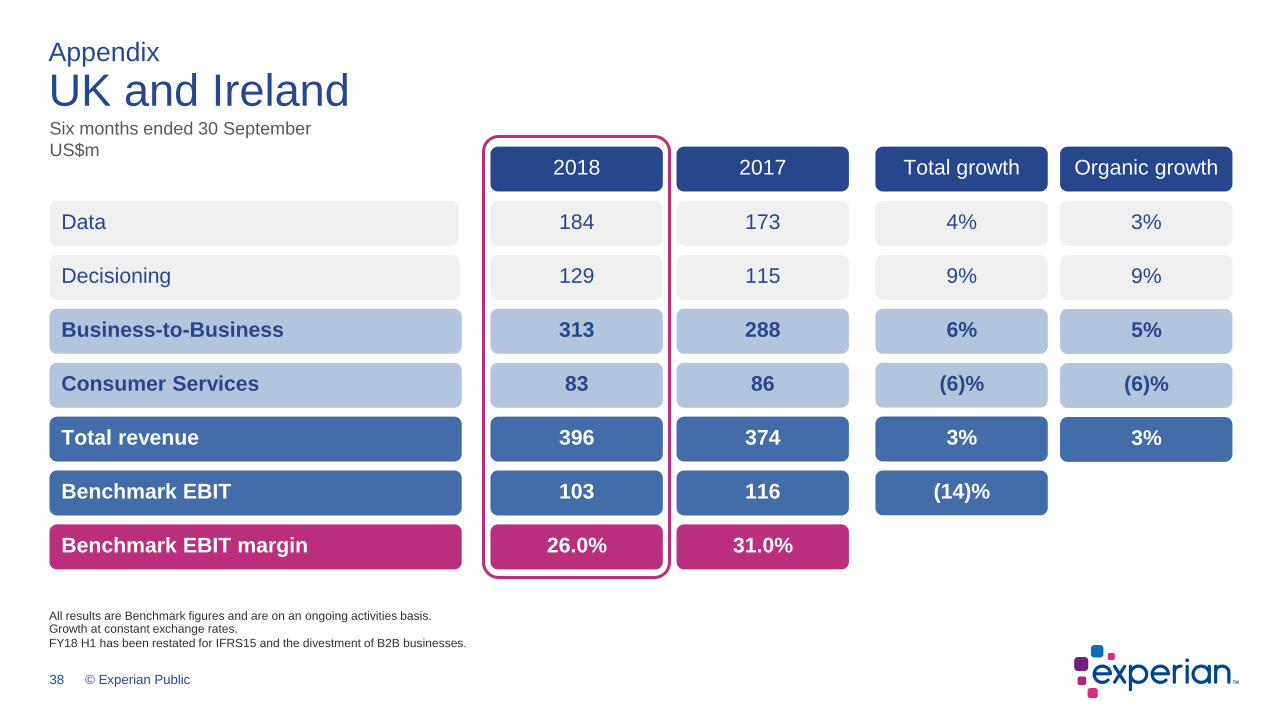
129Decisioning
Six months ended 30 September
US$m
Appendix
UK and Ireland
313
83
396
103
26.0%
Business-to-Business
Consumer Services
184Data
115
288
86
374
116
31.0%
173
Total revenue
Benchmark EBIT
Benchmark EBIT margin
9%
6%
(6)%
3%
(14)%
4%
9%
5%
(6)%
3%
3%
Total growth2018 2017 Organic growth
All results are Benchmark figures and are on an ongoing activities basis.Growth at constant exchange rates.
FY18 H1 has been restated for IFRS15 and the divestment of B2B businesses.
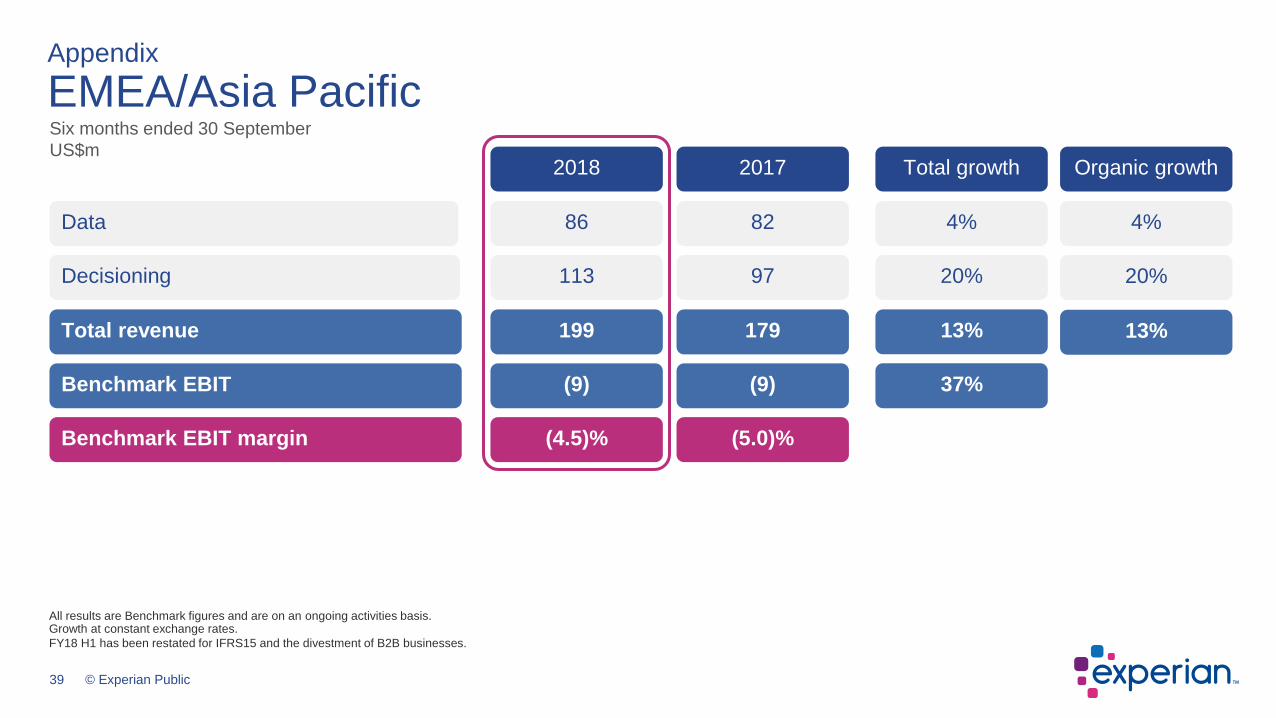
39 © Experian Public
199
(9)
(4.5)%
179
(9)
(5.0)%
Total revenue
Benchmark EBIT
Benchmark EBIT margin
13%
37%
13%
113Decisioning
Six months ended 30 September
US$m
Appendix
EMEA/Asia Pacific
86Data
97
82
20%
4%
20%
4%
Total growth2018 2017 Organic growth
All results are Benchmark figures and are on an ongoing activities basis.Growth at constant exchange rates.
FY18 H1 has been restated for IFRS15 and the divestment of B2B businesses.
40 © Experian Public
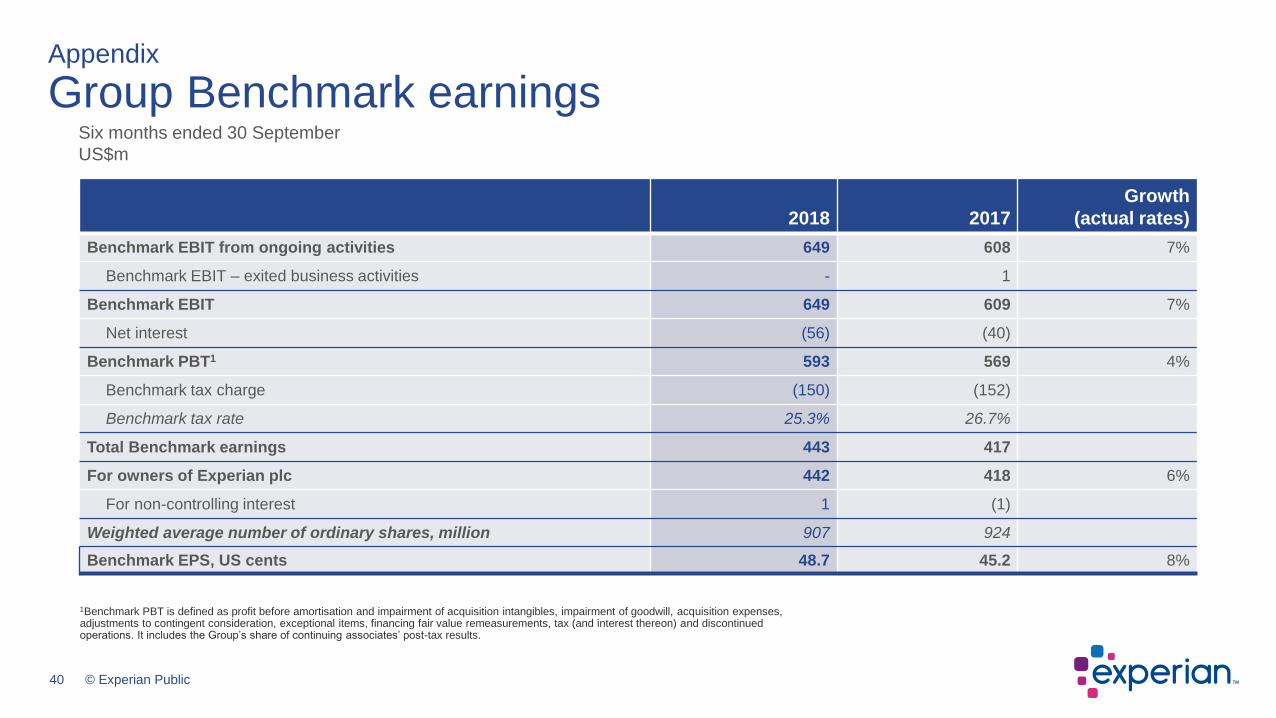
2018 2017
Growth
(actual rates)
Benchmark EBIT from ongoing activities 649 608 7%
Benchmark EBIT – exited business activities - 1
Benchmark EBIT 649 609 7%
Net interest (56) (40)
Benchmark PBT1 593 569 4%
Benchmark tax charge (150) (152)
Benchmark tax rate 25.3% 26.7%
Total Benchmark earnings 443 417
For owners of Experian plc 442 418 6%
For non-controlling interest 1 (1)
Weighted average number of ordinary shares, million 907 924
Benchmark EPS, US cents 48.7 45.2 8%
1Benchmark PBT is defined as profit before amortisation and impairment of acquisition intangibles, impairment of goodwill, acquisition expenses, adjustments to contingent consideration, exceptional items, financing fair value remeasurements, tax (and interest thereon) and discontinued operations. It includes the Group’s share of continuing associates’ post-tax results.
Six months ended 30 September
US$m
Appendix
Group Benchmark earnings
41 © Experian Public
Appendix
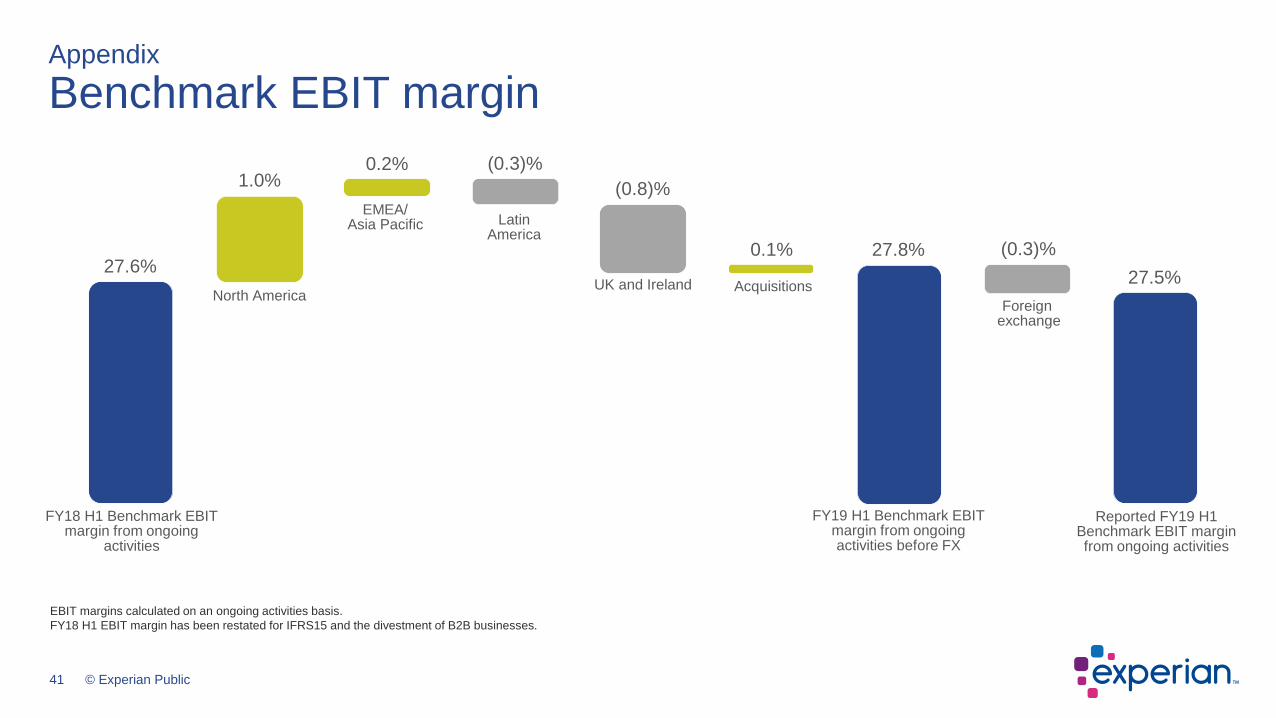
Benchmark EBIT margin
EBIT margins calculated on an ongoing activities basis.
FY18 H1 EBIT margin has been restated for IFRS15 and the divestment of B2B businesses.
FY18 H1 Benchmark EBIT margin from ongoing
activities
FY19 H1 Benchmark EBIT margin from ongoing activities before FX
Reported FY19 H1 Benchmark EBIT margin from ongoing activities
Foreignexchange
EMEA/Asia Pacific
UK and Ireland
Latin America
North America
27.6%
1.0% 0.2% (0.3)%
(0.8)%
27.8% (0.3)%
27.5% Acquisitions
0.1%

42 © Experian Public
+8%EPS
growth
+12%EPS
growth
+10%Constant currency
growth
Appendix
Benchmark earnings per share (EPS)
FY19 H1 reported
Benchmark EPSFY19 H1
Benchmark EPS
before FX
Interest Tax & Minority
Interest
Share
repurchases Foreign
exchange
US45.2c
FY19 H1
Benchmark EBIT
growth
from continuing
operations
US48.7c
FY18 H1
Benchmark EPS

43 © Experian Public
Six months ended 30 September 2018
Appendix
Benchmark cash flow performance
US$m
Benchmark EBIT
Benchmark operating cash
flow
Working capital and
other
Net capital expenditure
Amortisation and depreciation
Benchmark free cash flow
Net interest paid
Tax paid on operating activities
649 (181)
159 (149)
478(55)
(84)
339
74%conversion of Benchmark
EBIT into Benchmark operating cash flow
77%conversion of Benchmark
earnings into free cash flow

44 © Experian Public
Appendix
Net debt reconciliationUS$m
Net debt at
1 April 2018
Net debt /
Benchmark EBITDA
2.1x
Net share
purchases
Equity
dividends paidBenchmark
operating
cash flow
Acquisitions
and minority
investments
Net debt at
30 September 2018
Net debt /
Benchmark EBITDA
2.2x
FX and other
3,408
30
(478)
107284
139
13
3,503Interest and
tax paid
45 © Experian Public
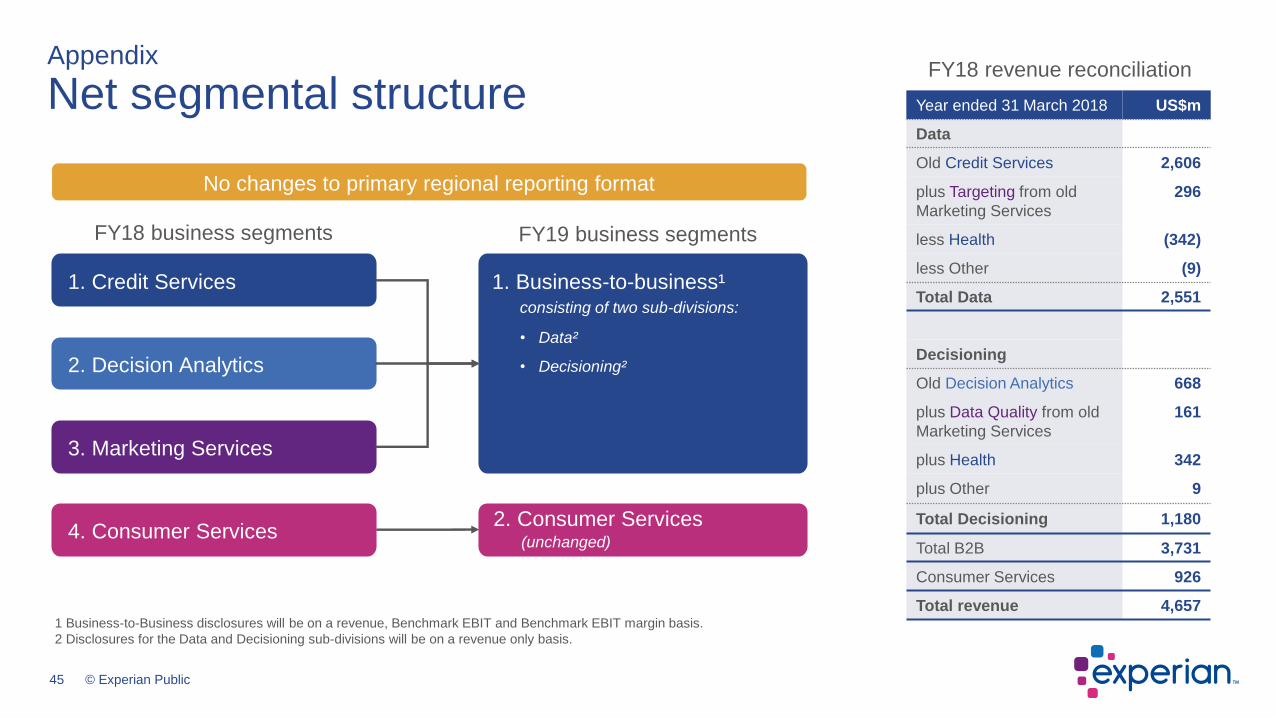
FY18 revenue reconciliation
Year ended 31 March 2018 US$m
Data
Old Credit Services 2,606
plus Targeting from old
Marketing Services
296
less Health (342)
less Other (9)
Total Data 2,551
Decisioning
Old Decision Analytics 668
plus Data Quality from old
Marketing Services
161
plus Health 342
plus Other 9
Total Decisioning 1,180
Total B2B 3,731
Consumer Services 926
Total revenue 4,6571 Business-to-Business disclosures will be on a revenue, Benchmark EBIT and Benchmark EBIT margin basis.
2 Disclosures for the Data and Decisioning sub-divisions will be on a revenue only basis.
FY18 business segments FY19 business segments
1. Credit Services
2. Decision Analytics
3. Marketing Services
4. Consumer Services
1. Business-to-business¹consisting of two sub-divisions:
• Data²
• Decisioning²
2. Consumer Services(unchanged)
No changes to primary regional reporting format
Appendix
Net segmental structure

46 © Experian Public
Appendix
Experian American Depositary Receipt (ADR) programme
For ADR shareholder enquiries,
please contact:
Shareholder Relations
BNY Mellon Shareowner Services
PO Box 505000
Louisville, KY 40233-5000
United States
T: + 1 201 680 6825
(From the US: 1-888-BNY-ADRS, toll free)
W: www.mybnymdr.com
Experian ADR shares trade on the
OTCQX under the following
information:
Symbol EXPGY
CUSIP 30215C101
Ratio 1 ADR : 1 ORD
Country United Kingdom
Effective Date October 11, 2006
Underlying SEDOL B19NLV4
Underlying ISIN GB00B19NLV48
U.S. ISIN US30215C1018
Depositary BNY Mellon
47 © Experian Public
Appendix
Contacts
Experian
Tel: +44 (0)203 042 4200
Website: www.experianplc.com
Email: [email protected]
Nadia Ridout-Jamieson Peg Smith
Chief Communications Officer Executive Vice-President
Email: [email protected] Email: [email protected]
Sarah Schibli Adam Rachlin
Investor Relations and Communications Manager Financial Reporting Manager
Email: [email protected] Email: [email protected]
Appendix
Contacts

48 © Experian Public
17 January 2019 Trading update, third quarter FY19
15 May 2019 Preliminary announcement FY19
16 July 2019 Trading update, first quarter FY20
24 July 2019 Annual General Meeting
Appendix
Event calendar
49 © Experian Public
• This presentation is being made only to, and is only directed at, persons to whom this presentation may lawfully be communicated(“relevant persons”). Any person who is not a relevant person should not act or rely on this presentation or any of its contents.
• Information in this presentation relating to the price at which relevant investments have been bought or sold in the past or the yield on such investments cannot be relied upon as a guide to the future performance of such investments.
• This presentation does not constitute or form part of, and should not be construed as, an offering of securities or otherwise constitute an invitation, inducement or recommendation to any person to underwrite, subscribe for or otherwise acquire securities in anycompany within the Experian group (the “Group”).
• Certain statements made in this presentation are forward looking statements. Such statements are based on current expectations and are subject to a number of risks and uncertainties that could cause actual events or results to differ materially from any expected future events or results expressed or implied in these forward-looking statements. Forward-looking statements speak only as of the date of this presentation.
• This presentation contains certain non-GAAP financial information. The Group’s management believes that these measures provide valuable additional information in understanding the performance of the Group or the Group’s businesses because they provide measures used by the Group to assess performance. Although these measures are important in the management of the business, they should not be viewed as replacements for, but rather as complementary to, the GAAP measures.
Appendix
Disclaimer


![manual tecnico factoringcampanha.cadastropositivo.com.br/relato/download/manual_tecnico... · 7 [Digite texto] [Digite texto] [Digite texto] LAYOUT SIMPLIFICADO SERASA EXPERIAN O](https://img.dokumen.tips/doc/110x75/5bf5d2cc09d3f279228c13b3/manual-tecnico-7-digite-texto-digite-texto-digite-texto-layout-simplificado.jpg)

![[BPM DAY RJ 2012] SERASA EXPERIAN – Desdobramento da estratégia em indicadores de gestão](https://img.dokumen.tips/doc/110x75/58f35b061a28abf1068b4577/bpm-day-rj-2012-serasa-experian-desdobramento-da-estrategia-em-indicadores.jpg)


