Embed Size (px)
Citation preview
1© 2014 SHL, a part of CEB. All rights reserved
Maximizing the Business Impact of Talent Analytics
Jean Martin, CEB
October 24 , 2014
2© 2014 SHL, a part of CEB. All rights reserved
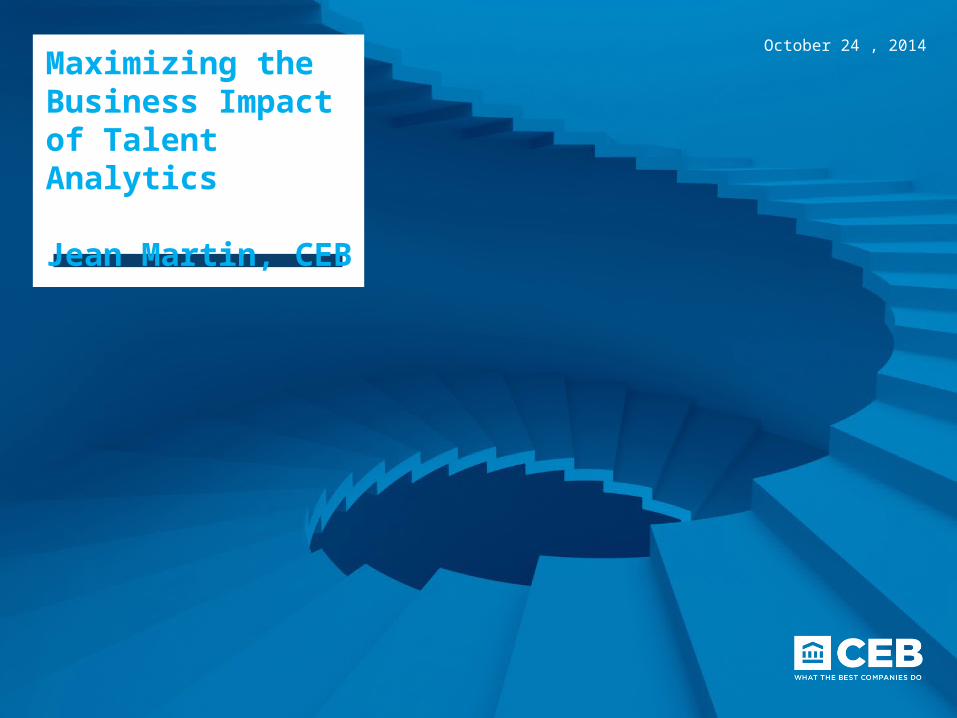
Pressure on HR to capitalize on data assets
Source: PwC, “15th Annual Global CEO Survey,” 2012, http:/ /www.pwc.com/en_GX/gx/ceo-survey/pdf/15th-global-ceo-survey.pdf.n = 1,258.
HR Plans to Increase Investments in HR Data and Analytics in the Next Two Years
Percentage of Senior HR Leaders
n = 108.
Source: CEB, CEB Corporate Leadership Council Analytics Survey 2013.
Information Is Important
Receives Sufficient Information
Percentage of CEOs
Costs of Employee Turnover
Return on Investment in
Human Capital
Assessments of Internal
Advancement
Labor Costs
Employees’ Views and
Needs
Staff Productivity
CEOs Want More Talent Data from HR
Percentage of CEOs Who Believe Information Is Important and Comprehensive
0% 50% 100%
95% Agree
3© 2014 SHL, a part of CEB. All rights reserved
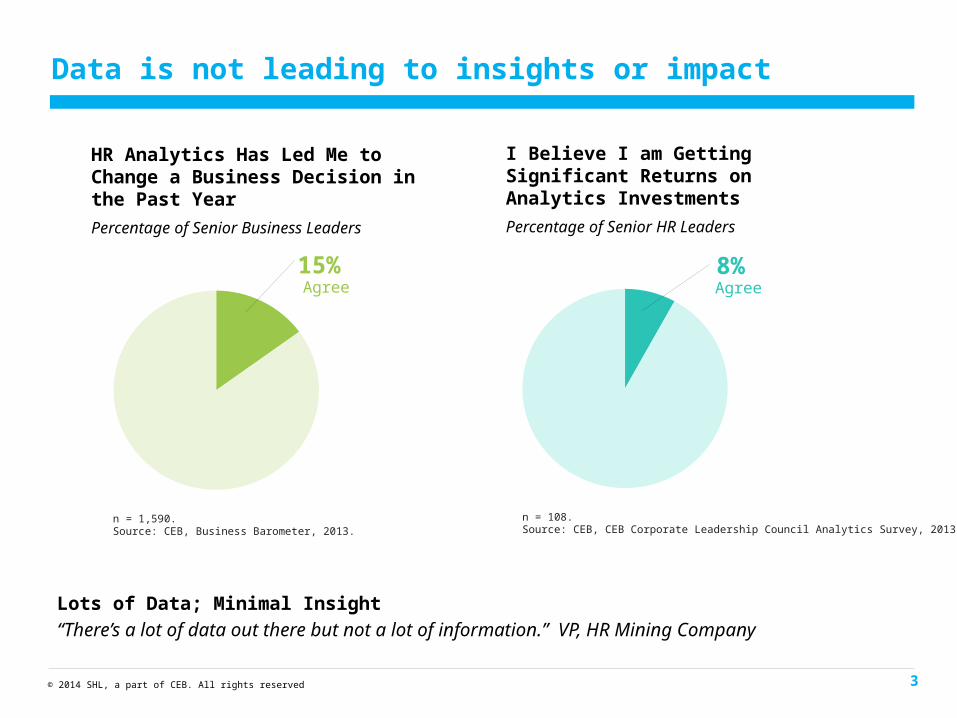
Data is not leading to insights or impact
Lots of Data; Minimal Insight
“There’s a lot of data out there but not a lot of information.” VP, HR Mining Company
HR Analytics Has Led Me to Change a Business Decision in the Past Year
Percentage of Senior Business Leaders
15% Agree
Source: CEB, Business Barometer, 2013.n = 1,590.
I Believe I am Getting Significant Returns on Analytics Investments
Percentage of Senior HR Leaders
8% Agree
Source: CEB, CEB Corporate Leadership Council Analytics Survey, 2013.n = 108.
4© 2014 SHL, a part of CEB. All rights reserved
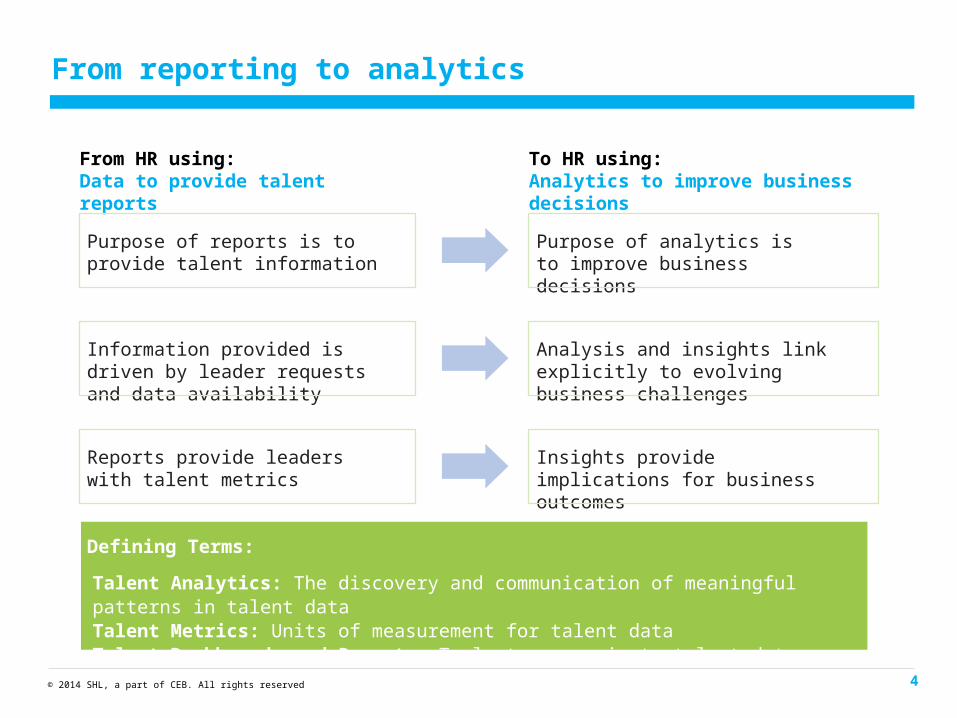
From reporting to analytics
Defining Terms:
Talent Analytics: The discovery and communication of meaningful patterns in talent dataTalent Metrics: Units of measurement for talent dataTalent Dashboards and Reports: Tools to communicate talent data
From HR using:Data to provide talent reports
To HR using:Analytics to improve business decisions
Purpose of reports is to provide talent information
Purpose of analytics is to improve business decisions
Information provided is driven by leader requests and data availability
Analysis and insights link explicitly to evolving business challenges
Reports provide leaders with talent metrics
Insights provide implications for business outcomes
5© 2014 SHL, a part of CEB. All rights reserved
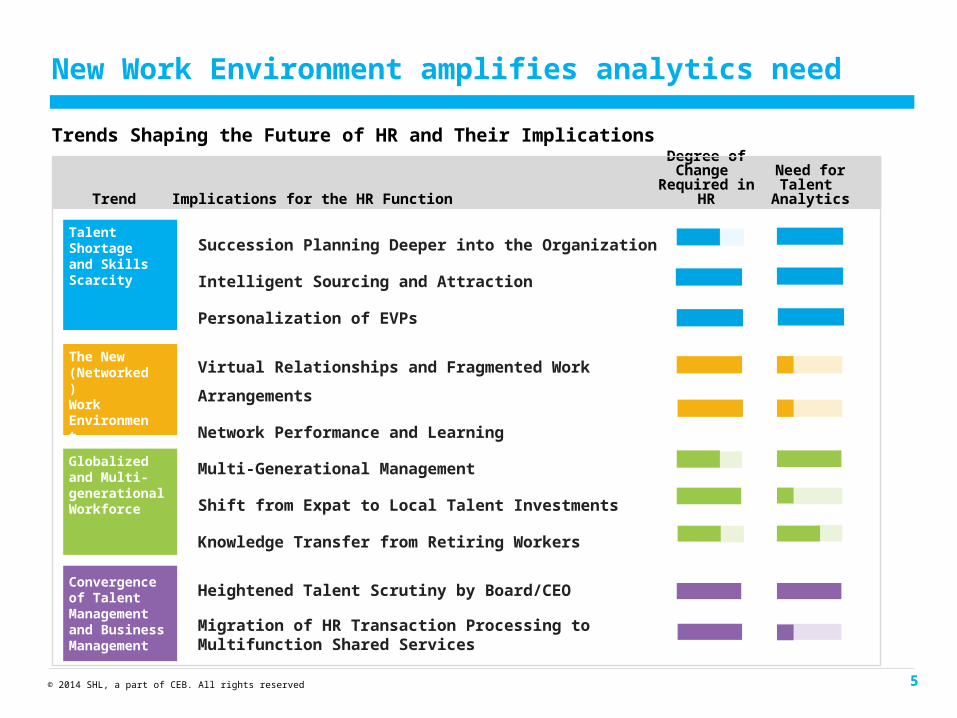
New Work Environment amplifies analytics need
Trend Implications for the HR Function
Degree of Change
Required in HR
Need forTalent
Analytics
Talent Shortage and Skills Scarcity
The New (Networked) Work Environment
Globalized and Multi-generational Workforce
Convergence of Talent Management and Business Management
Succession Planning Deeper into the Organization
Intelligent Sourcing and Attraction
Personalization of EVPs
Virtual Relationships and Fragmented Work Arrangements
Network Performance and Learning
Multi-Generational Management
Shift from Expat to Local Talent Investments
Knowledge Transfer from Retiring Workers
Heightened Talent Scrutiny by Board/CEO
Migration of HR Transaction Processing to Multifunction Shared Services
Trends Shaping the Future of HR and Their Implications
6© 2014 SHL, a part of CEB. All rights reserved
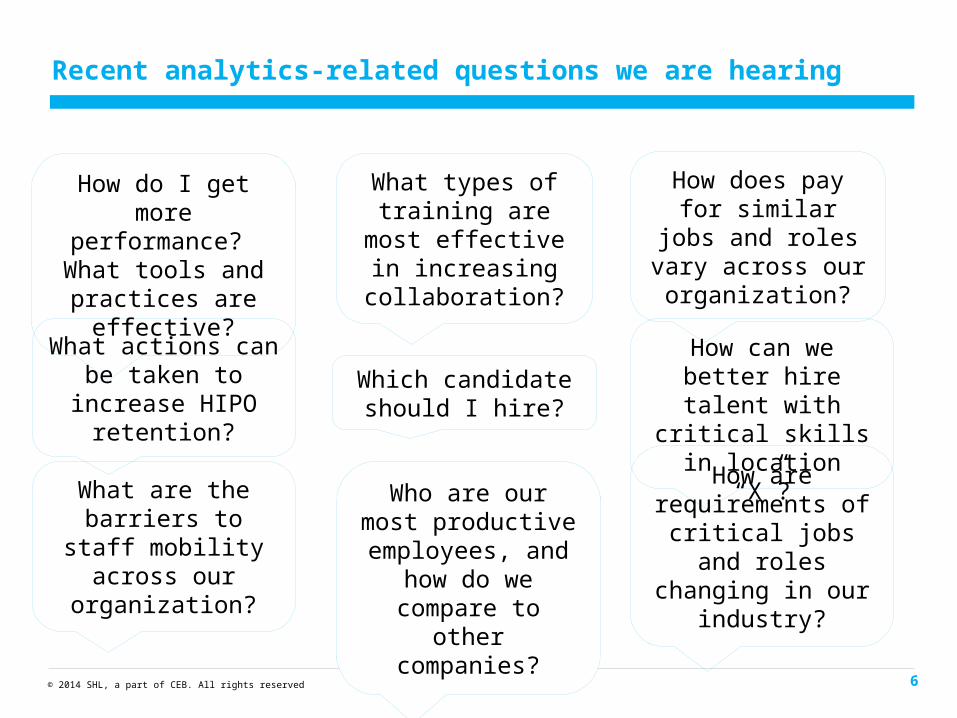
Recent analytics-related questions we are hearing
What actions can be taken to increase HIPO retention?
What types of training are most
effective in increasing
collaboration?
How can we better hire talent with critical skills in location “X”?
Which candidate should I hire?
How do I get more performance? What tools and practices
are effective?
Who are our most productive
employees, and how do we compare to other companies?
How does pay for similar jobs and
roles vary across our organization?
How are requirements of
critical jobs and roles changing in our
industry?
What are the barriers to staff mobility
across our organization?
7© 2014 SHL, a part of CEB. All rights reserved
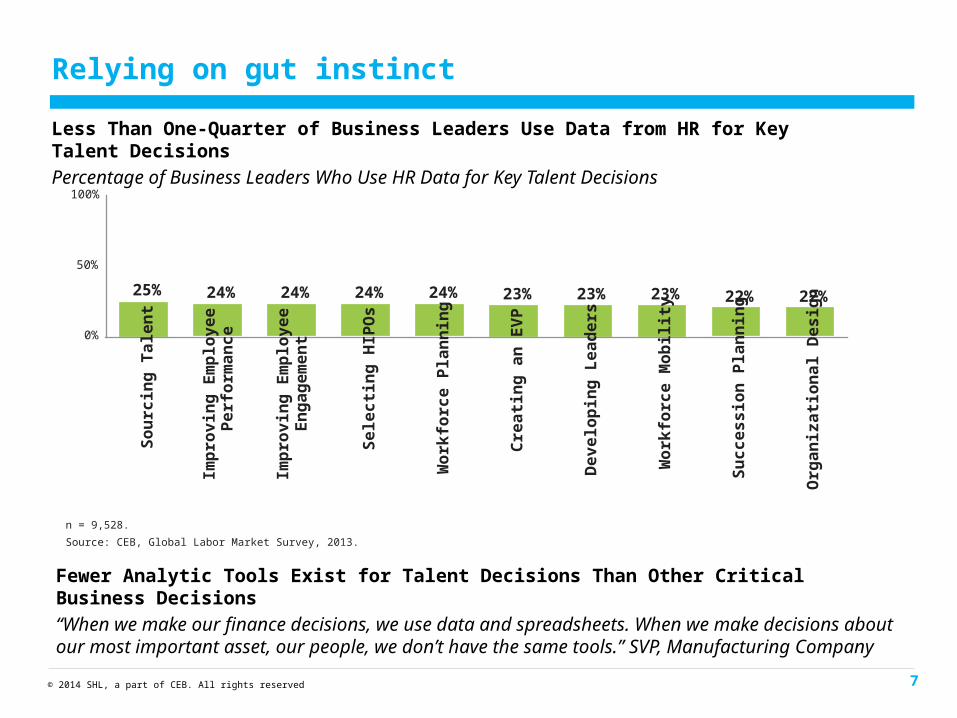
Relying on gut instinct
Less Than One-Quarter of Business Leaders Use Data from HR for Key Talent Decisions
Percentage of Business Leaders Who Use HR Data for Key Talent Decisions
Fewer Analytic Tools Exist for Talent Decisions Than Other Critical Business Decisions
“When we make our finance decisions, we use data and spreadsheets. When we make decisions about our most important asset, our people, we don’t have the same tools.” SVP, Manufacturing Company
Source: CEB, Global Labor Market Survey, 2013.
n = 9,528.
0%
50%
100%
25% 24% 24% 24% 24% 23% 23% 23% 22% 22%
Org
an
iza
tio
na
l D
es
ign
Su
cc
es
sio
n P
lan
nin
g
Wo
rkfo
rce
Mo
bil
ity
De
ve
lop
ing
Le
ad
ers
Cre
ati
ng
an
EV
P
Wo
rkfo
rce
Pla
nn
ing
Se
lec
tin
g H
IPO
s
Imp
rov
ing
Em
plo
ye
e
En
ga
ge
me
nt
Imp
rov
ing
Em
plo
ye
e
Pe
rfo
rma
nc
e
So
urc
ing
Ta
len
t
8© 2014 SHL, a part of CEB. All rights reserved
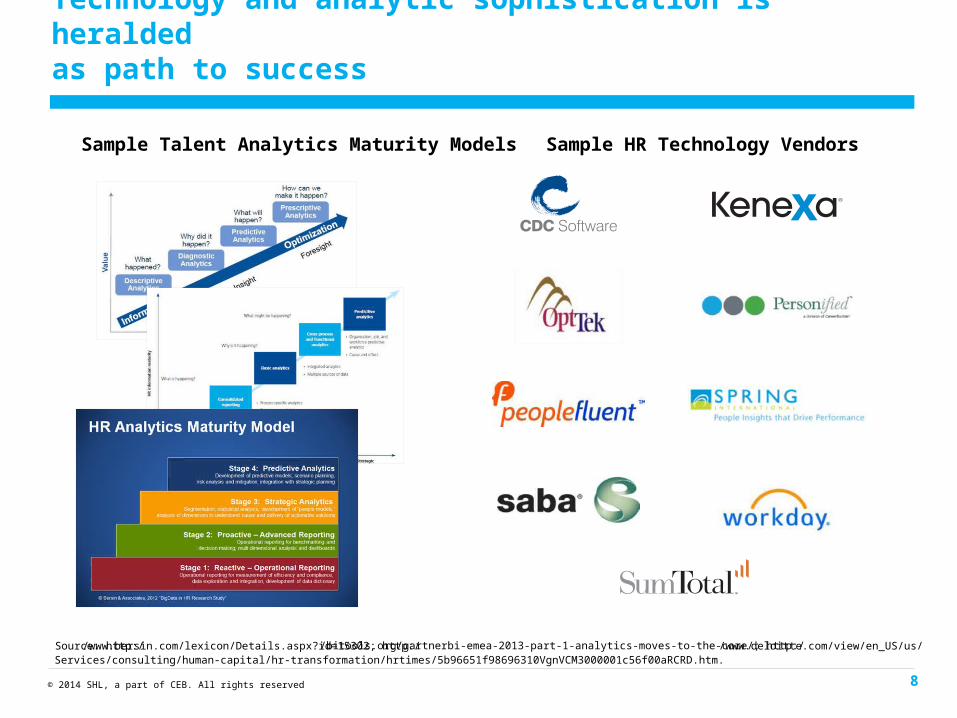
Technology and analytic sophistication is heralded as path to success
Sample Talent Analytics Maturity Models Sample HR Technology Vendors
Source: http:/ /www.bersin.com/lexicon/Details.aspx?id=15302; http:/ /bitools.org/gartnerbi-emea-2013-part-1-analytics-moves-to-the-core/; http:/ /www.deloitte.com/view/en_US/us/Services/consulting/human-capital/hr-transformation/hrtimes/5b96651f98696310VgnVCM3000001c56f00aRCRD.htm.
9© 2014 SHL, a part of CEB. All rights reserved
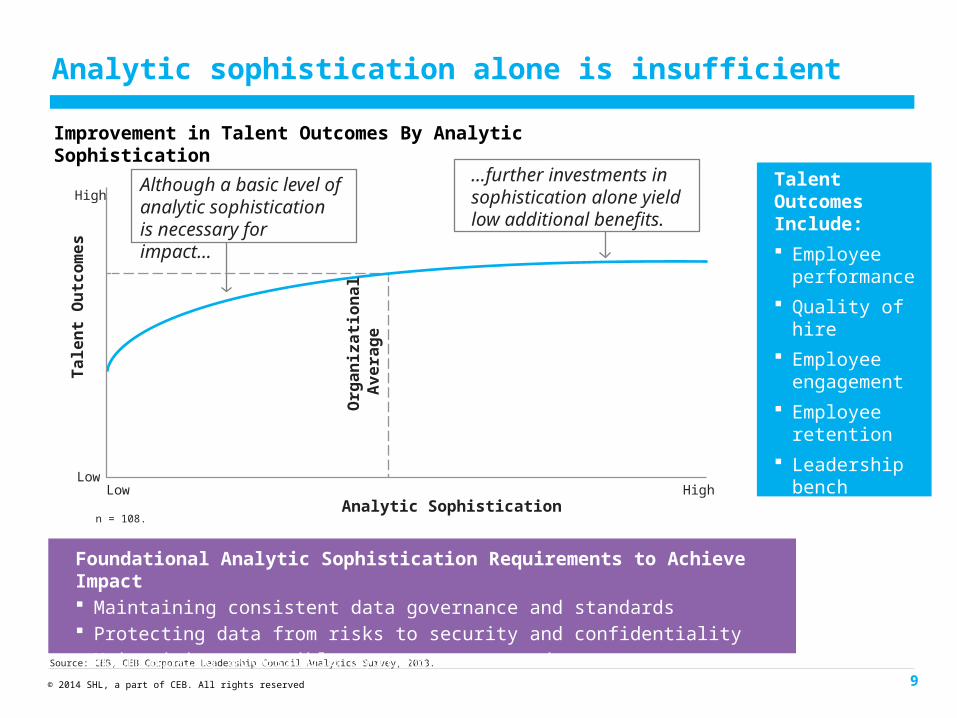
Analytic sophistication alone is insufficient
Improvement in Talent Outcomes By Analytic Sophistication
Source: CEB, CEB Corporate Leadership Council Analytics Survey, 2013.
Low High
High
Low
Although a basic level of analytic sophistication is necessary for impact…
…further investments in sophistication alone yield low additional benefits.
Org
an
iza
tio
na
l
Av
era
ge
Tale
nt
Ou
tco
me
s
Analytic Sophisticationn = 108.
Foundational Analytic Sophistication Requirements to Achieve Impact Maintaining consistent data governance and standards Protecting data from risks to security and confidentiality Maintaining accessible systems to store data
Talent Outcomes Include:
Employee performance
Quality of hire
Employee engagement
Employee retention
Leadership bench strength
10© 2014 SHL, a part of CEB. All rights reserved
A global study
11© 2014 SHL, a part of CEB. All rights reserved
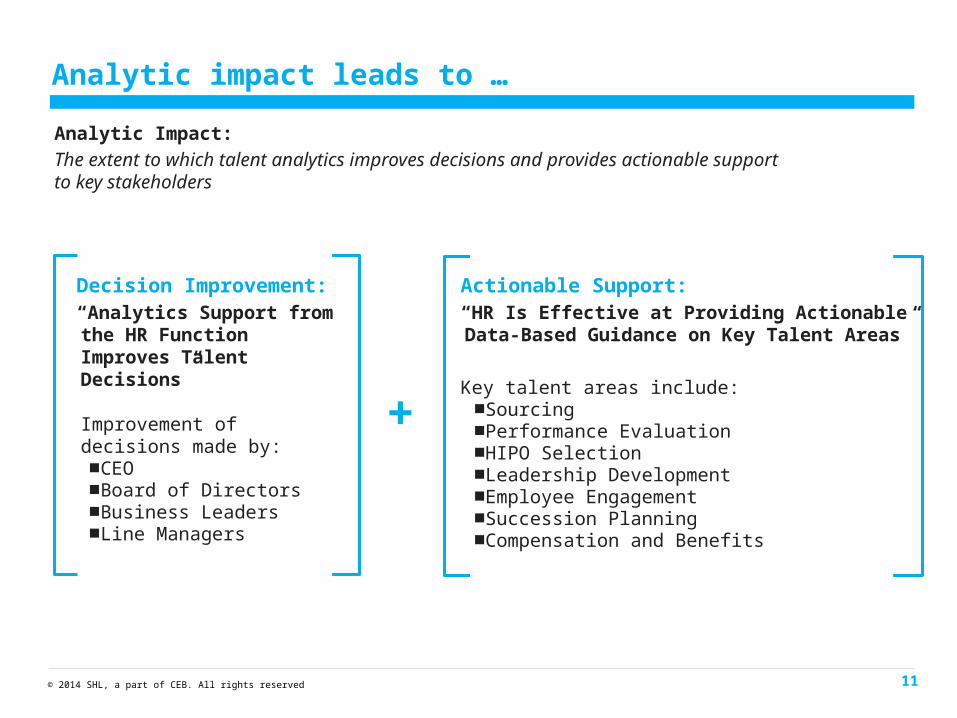
Analytic impact leads to …
Analytic Impact:
The extent to which talent analytics improves decisions and provides actionable supportto key stakeholders
Decision Improvement:“Analytics Support from the HR Function Improves Talent Decisions”
Improvement of decisions made by:■CEO■Board of Directors■Business Leaders■Line Managers
Actionable Support:“HR Is Effective at Providing ActionableData-Based Guidance on Key Talent Areas”
Key talent areas include:■Sourcing■Performance Evaluation■HIPO Selection■Leadership Development■Employee Engagement■Succession Planning ■Compensation and Benefits
+
12© 2014 SHL, a part of CEB. All rights reserved
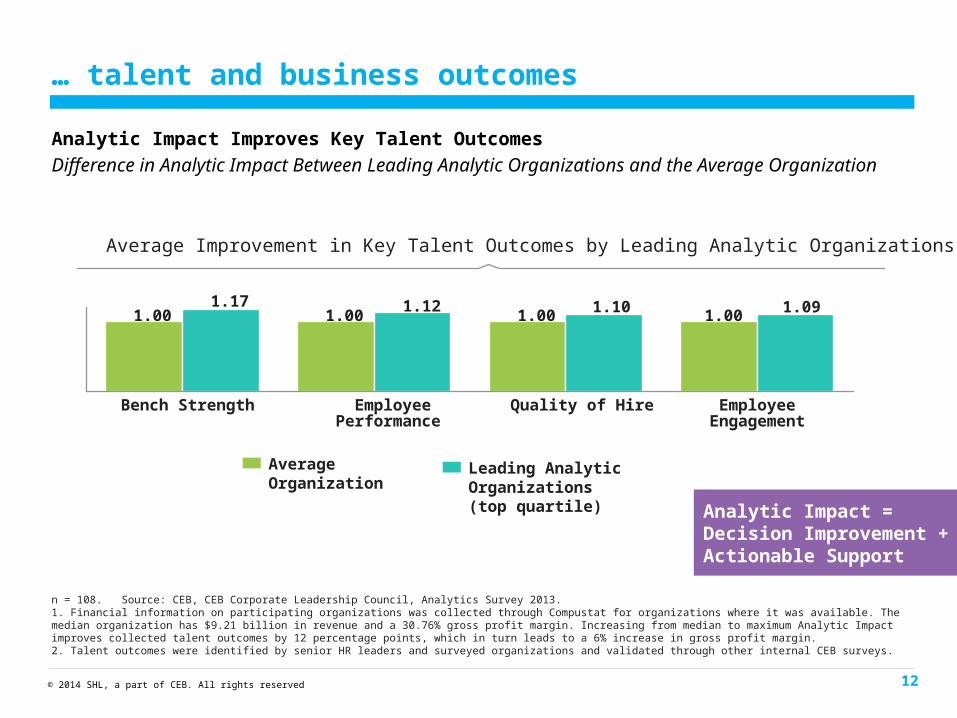
… talent and business outcomes
Analytic Impact Improves Key Talent Outcomes
Difference in Analytic Impact Between Leading Analytic Organizations and the Average Organization
n = 108. Source: CEB, CEB Corporate Leadership Council, Analytics Survey 2013.1. Financial information on participating organizations was collected through Compustat for organizations where it was available. The median organization has $9.21 billion in revenue and a 30.76% gross profit margin. Increasing from median to maximum Analytic Impact improves collected talent outcomes by 12 percentage points, which in turn leads to a 6% increase in gross profit margin. 2. Talent outcomes were identified by senior HR leaders and surveyed organizations and validated through other internal CEB surveys.
Bench Strength EmployeePerformance
Quality of Hire EmployeeEngagement
Average Organization
Leading Analytic Organizations(top quartile)
Average Improvement in Key Talent Outcomes by Leading Analytic Organizations = 12%
1.001.17
1.001.12
1.00 1.10 1.00 1.09
Analytic Impact = Decision Improvement +Actionable Support
13© 2014 SHL, a part of CEB. All rights reserved
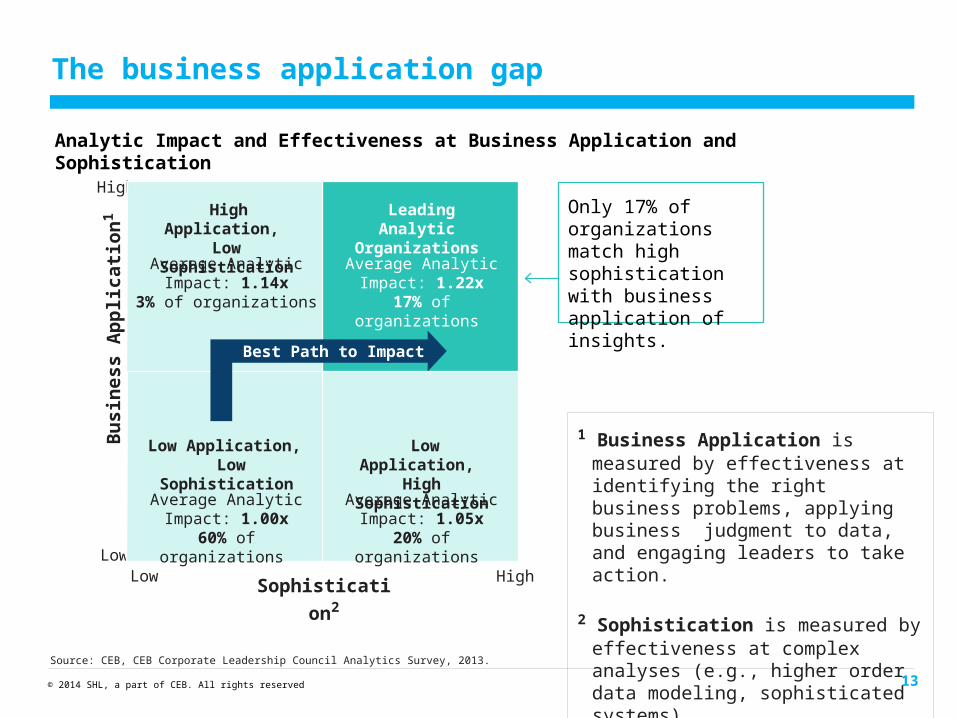
The business application gap
Analytic Impact and Effectiveness at Business Application and Sophistication
1 Business Application is measured by effectiveness at identifying the right business problems, applying business judgment to data, and engaging leaders to take action.
2 Sophistication is measured by effectiveness at complex analyses (e.g., higher order data modeling, sophisticated systems).
High
LowLow High
Bu
sin
ess
Ap
pli
cati
on
1
Sophistication2
High Application, Low Sophistication
Average Analytic Impact: 1.14x
3% of organizations
Leading Analytic Organizations
Average Analytic Impact: 1.22x
17% of organizations
Low Application, Low Sophistication
Average Analytic Impact: 1.00x
60% of organizations
Low Application, High Sophistication
Average Analytic Impact: 1.05x
20% of organizations
Best Path to Impact
Only 17% of organizations match high sophistication with business application of insights.
Source: CEB, CEB Corporate Leadership Council Analytics Survey, 2013.
14© 2014 SHL, a part of CEB. All rights reserved
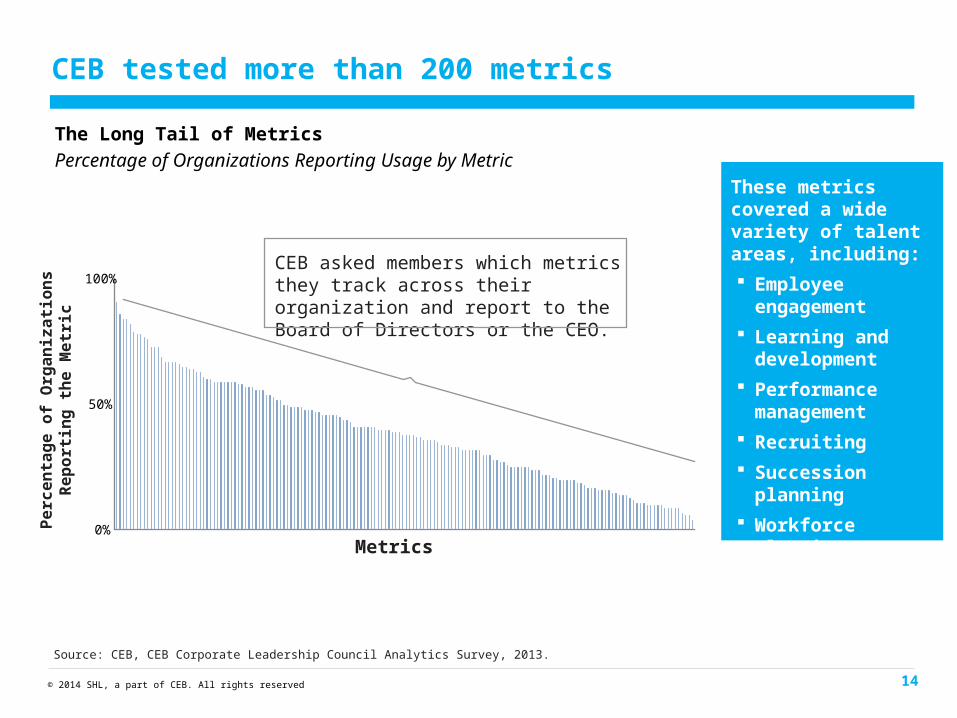
CEB tested more than 200 metrics
The Long Tail of Metrics
Percentage of Organizations Reporting Usage by Metric
These metrics covered a wide variety of talent areas, including:
Employee engagement
Learning and development
Performance management
Recruiting
Succession planning
Workforce planningMetrics
Pe
rce
nta
ge
of
Org
an
iza
tio
ns
Re
po
rtin
g t
he
Me
tric
0%
50%
100%CEB asked members which metrics they track across their organization and report to the Board of Directors or the CEO.
Source: CEB, CEB Corporate Leadership Council Analytics Survey, 2013.
15© 2014 SHL, a part of CEB. All rights reserved
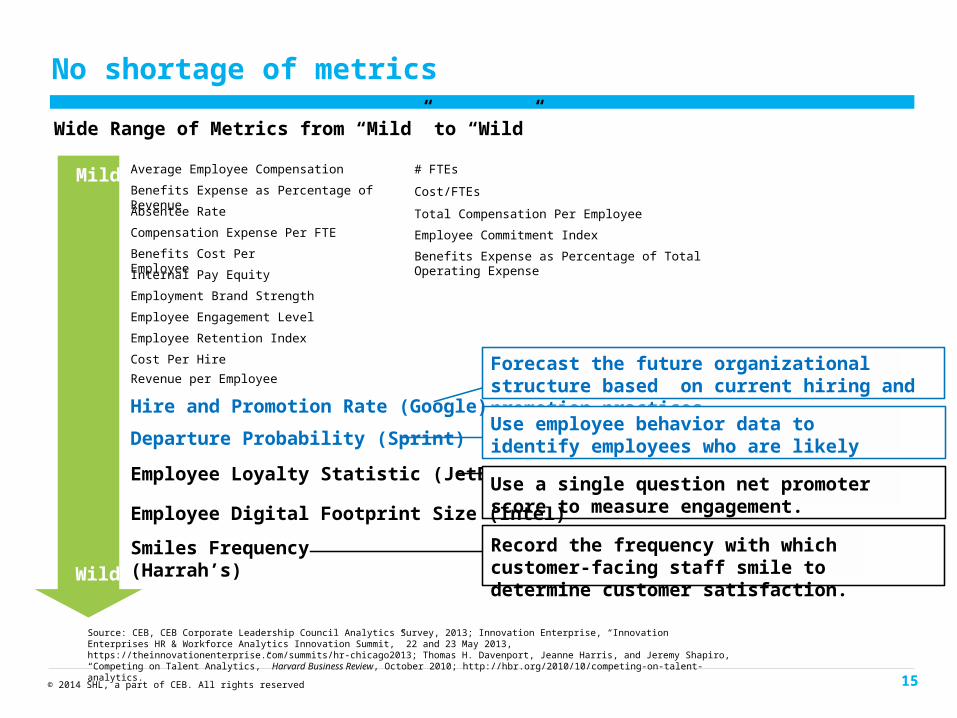
No shortage of metrics
Wide Range of Metrics from “Mild” to “Wild”
Source: CEB, CEB Corporate Leadership Council Analytics Survey, 2013; Innovation Enterprise, “Innovation Enterprises HR & Workforce Analytics Innovation Summit,” 22 and 23 May 2013, https://theinnovationenterprise.com/summits/hr-chicago2013; Thomas H. Davenport, Jeanne Harris, and Jeremy Shapiro, “Competing on Talent Analytics,” Harvard Business Review, October 2010; http://hbr.org/2010/10/competing-on-talent-analytics.
Wild
Mild
Record the frequency with which customer-facing staff smile to determine customer satisfaction.
Benefits Cost Per Employee
Smiles Frequency (Harrah’s)
Employee Digital Footprint Size (Intel)
Forecast the future organizational structure based on current hiring and promotion practices.
Employee Loyalty Statistic (JetBlue)
Use employee behavior data to identify employees who are likely to leave. Departure Probability (Sprint)
Use a single question net promoter score to measure engagement.
Hire and Promotion Rate (Google)
Total Compensation Per Employee
Benefits Expense as Percentage of Total Operating Expense
Benefits Expense as Percentage of Revenue
Employee Retention Index
Employment Brand Strength
Employee Commitment Index
Average Employee Compensation
Compensation Expense Per FTE
Absentee Rate
Cost/FTEs
Employee Engagement Level
Cost Per Hire
# FTEs
Internal Pay Equity
Revenue per Employee
16© 2014 SHL, a part of CEB. All rights reserved
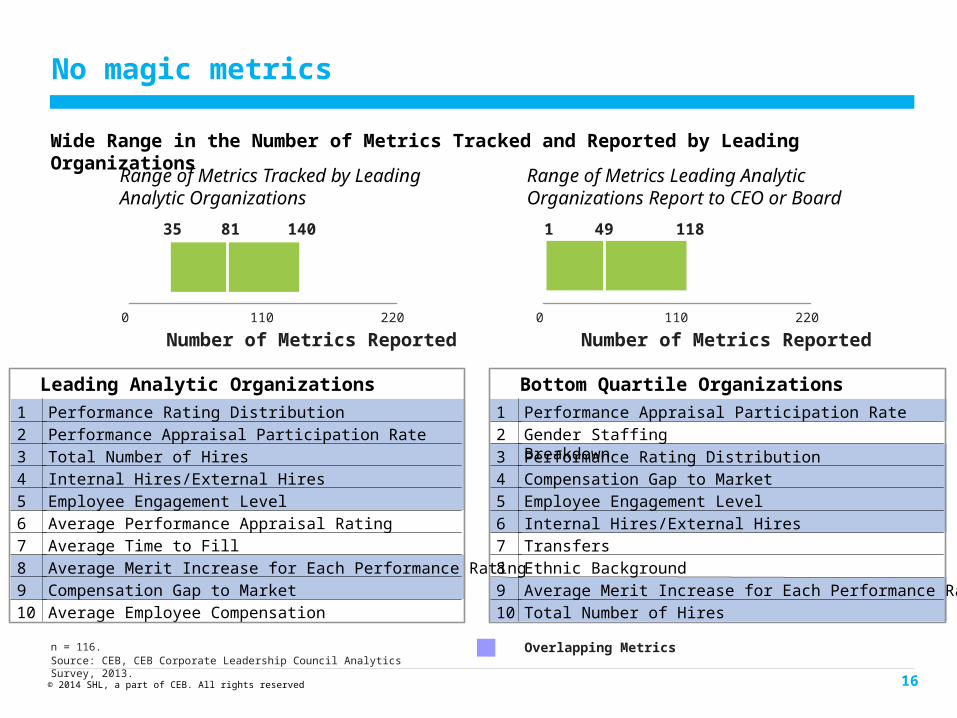
No magic metrics
Wide Range in the Number of Metrics Tracked and Reported by Leading Organizations
Range of Metrics Leading Analytic Organizations Report to CEO or Board
Range of Metrics Tracked by Leading Analytic Organizations
Overlapping MetricsSource: CEB, CEB Corporate Leadership Council Analytics Survey, 2013.n = 116.
0 110 220
35 81 140
Number of Metrics Reported0 110 220
1 49 118
Number of Metrics Reported
Bottom Quartile Organizations
1 Performance Appraisal Participation Rate
2 Gender Staffing Breakdown3 Performance Rating Distribution
4 Compensation Gap to Market5 Employee Engagement Level
6 Internal Hires/External Hires7 Transfers8 Ethnic Background
9 Average Merit Increase for Each Performance Rating10 Total Number of Hires
Leading Analytic Organizations
1 Performance Rating Distribution
2 Performance Appraisal Participation Rate3 Total Number of Hires4 Internal Hires/External Hires
5 Employee Engagement Level6 Average Performance Appraisal Rating7 Average Time to Fill
8 Average Merit Increase for Each Performance Rating9 Compensation Gap to Market
10 Average Employee Compensation
17© 2014 SHL, a part of CEB. All rights reserved
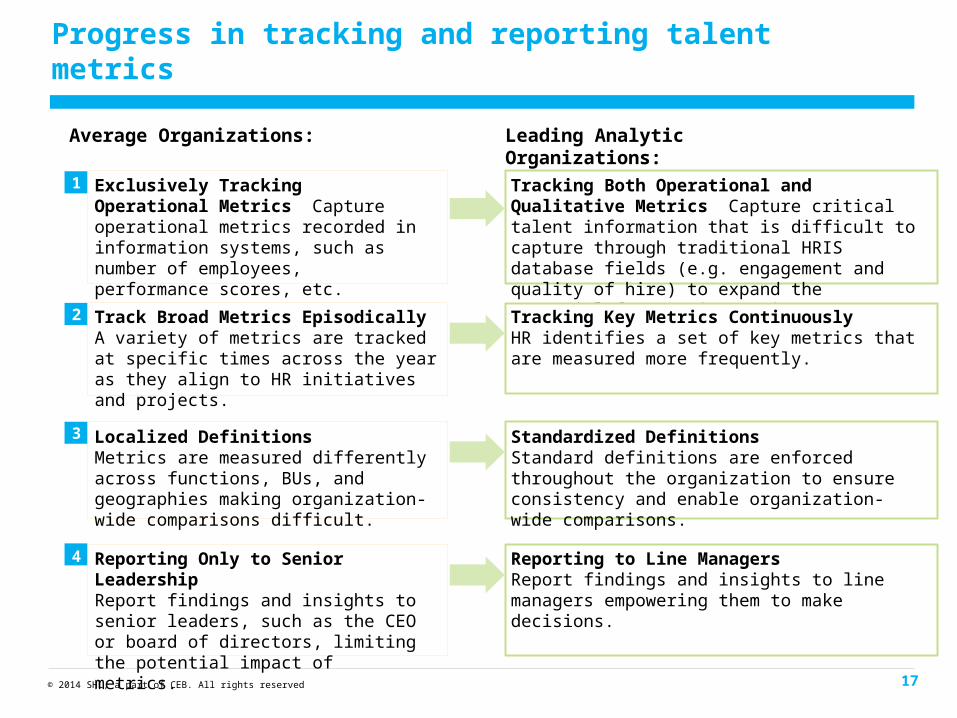
Progress in tracking and reporting talent metrics
Average Organizations: Leading Analytic Organizations:
Exclusively Tracking Operational Metrics Capture operational metrics recorded in information systems, such as number of employees, performance scores, etc.
1 Tracking Both Operational and Qualitative Metrics Capture critical talent information that is difficult to capture through traditional HRIS database fields (e.g. engagement and quality of hire) to expand the potential for metrics to impact business decisions.
Track Broad Metrics EpisodicallyA variety of metrics are tracked at specific times across the year as they align to HR initiatives and projects.
2 Tracking Key Metrics ContinuouslyHR identifies a set of key metrics that are measured more frequently.
Localized DefinitionsMetrics are measured differently across functions, BUs, and geographies making organization-wide comparisons difficult.
3 Standardized DefinitionsStandard definitions are enforced throughout the organization to ensure consistency and enable organization-wide comparisons.
Reporting Only to Senior LeadershipReport findings and insights to senior leaders, such as the CEO or board of directors, limiting the potential impact of metrics.
4 Reporting to Line ManagersReport findings and insights to line managers empowering them to make decisions.
18© 2014 SHL, a part of CEB. All rights reserved
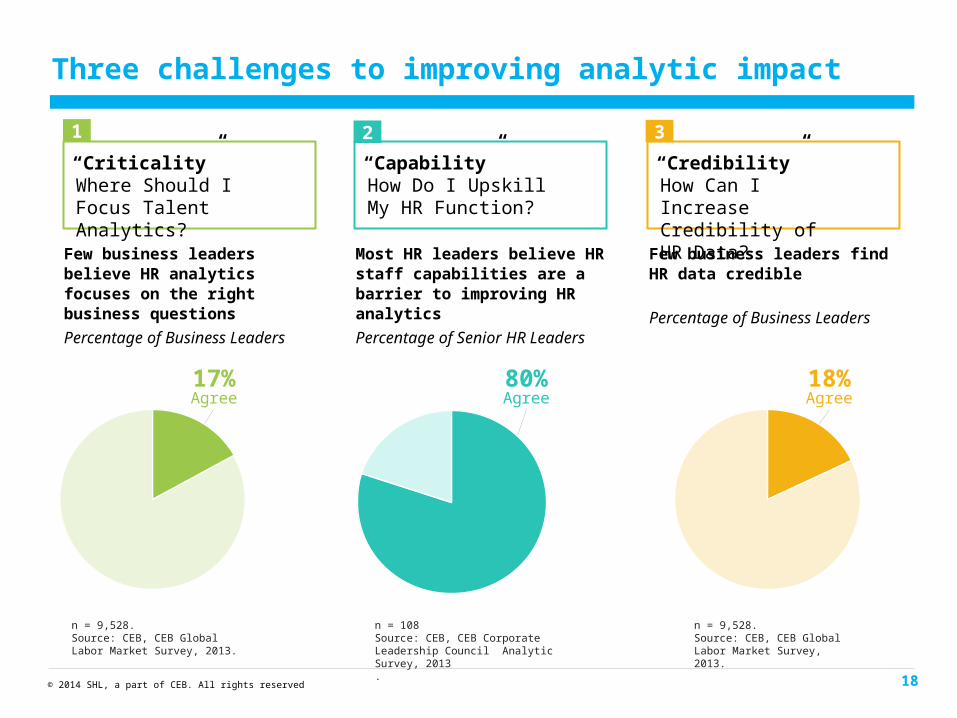
Three challenges to improving analytic impact
n = 9,528.Source: CEB, CEB Global Labor Market Survey, 2013.
n = 108Source: CEB, CEB Corporate Leadership Council Analytic Survey, 2013.
n = 9,528.Source: CEB, CEB Global Labor Market Survey, 2013.
1
Few business leaders believe HR analytics focuses on the right business questions
Percentage of Business Leaders
Most HR leaders believe HR staff capabilities are a barrier to improving HR analytics
Percentage of Senior HR Leaders
“Criticality”Where Should I Focus Talent Analytics?
“Capability”How Do I Upskill My HR Function?
“Credibility”How Can I Increase Credibility of HR Data?
17% Agree
80% Agree
18% Agree
2 3
Few business leaders findHR data credible
Percentage of Business Leaders

19© 2014 SHL, a part of CEB. All rights reserved
The Analytics Era: Transforming HR’s impact on the business
Criticality Capability Credibility
1Prioritize Critical
Business Questions
2Apply Business Judgment
to Data Science
3Drive End-User Ownership
of Talent Analytics
Prioritize the most scalable opportunities for business impact
rather than simply fulfilling on-demand data requests.
Reset goals for talent analytics to focus staff on
business judgment.
Provide implications of decisions; don’t prescribe
solutions.
Analytics Prioritization Principles Re-Goaled Talent Analytics Implication-Based Decision Support
Evaluate talent risks to business strategy to identify key metrics.
Revise HRBP competencies to emphasize application of business judgment to data.
Talent Analytics Map HRBP Analytics Competencies
Build capability by establishing accountability and facilitating
connection across the business.
Imperatives for CHROs to Improve Analytics Capability
1.Pseudonym.
Connect talent data to business
outcomes
Wishbone Inc.1
Talent P&L Dashboard
20© 2014 SHL, a part of CEB. All rights reserved
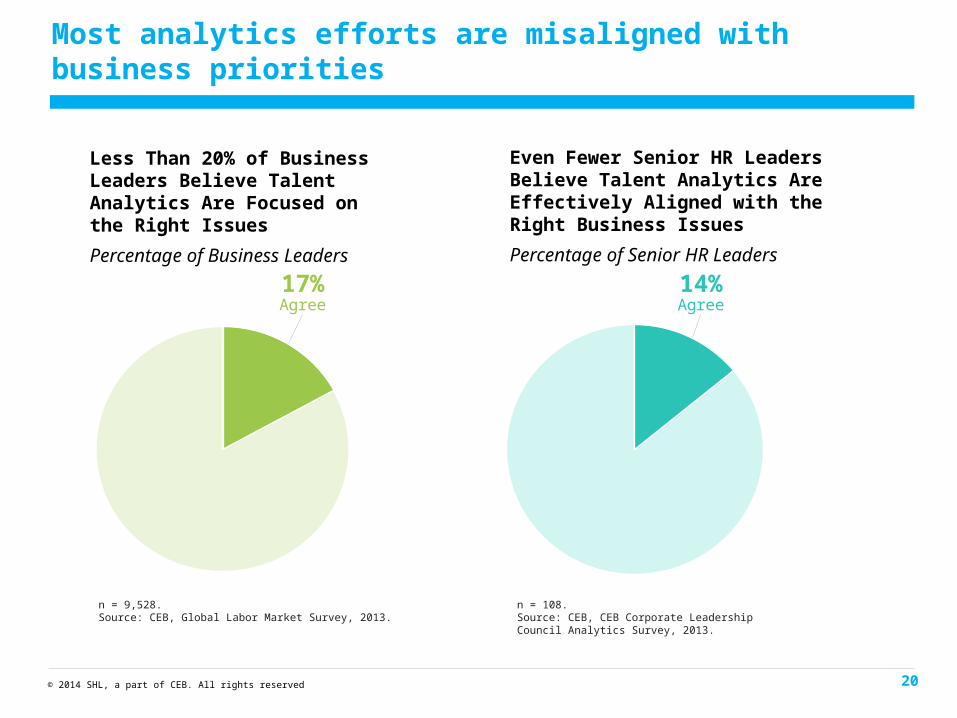
Most analytics efforts are misaligned withbusiness priorities
1,707%
Even Fewer Senior HR Leaders Believe Talent Analytics Are Effectively Aligned with the Right Business Issues
Percentage of Senior HR Leaders
n = 108.Source: CEB, CEB Corporate Leadership Council Analytics Survey, 2013.
n = 9,528.Source: CEB, Global Labor Market Survey, 2013.
Less Than 20% of Business Leaders Believe Talent Analytics Are Focused on the Right Issues
Percentage of Business Leaders
17% Agree
14% Agree
21© 2014 SHL, a part of CEB. All rights reserved
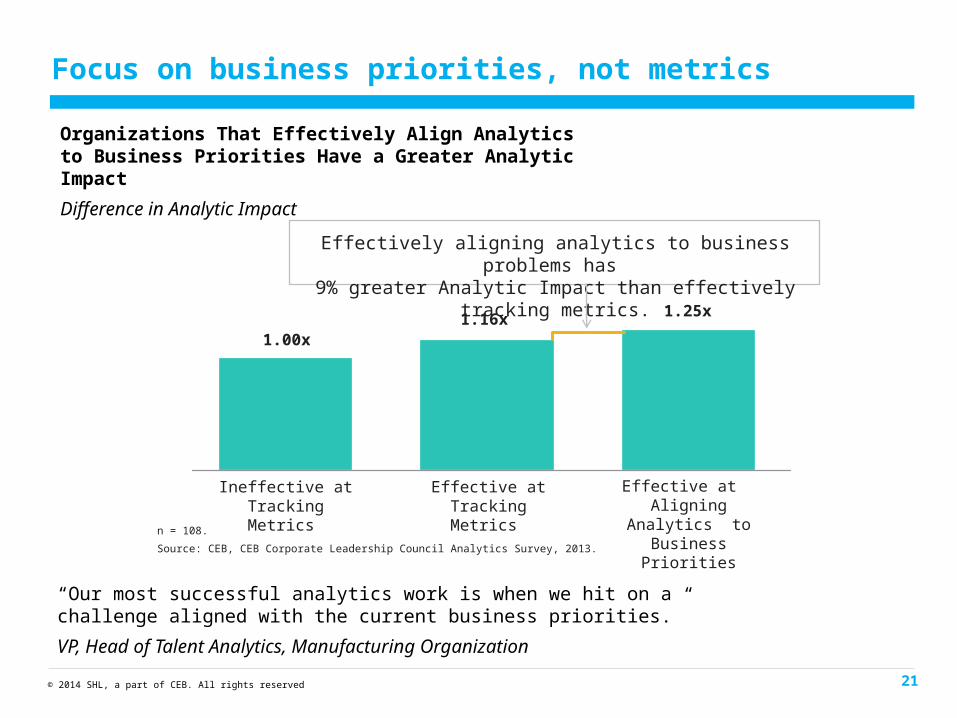
Focus on business priorities, not metrics
Organizations That Effectively Align Analytics to Business Priorities Have a Greater Analytic Impact
Difference in Analytic Impact
“Our most successful analytics work is when we hit on a challenge aligned with the current business priorities.”
VP, Head of Talent Analytics, Manufacturing Organization
n = 108.
Source: CEB, CEB Corporate Leadership Council Analytics Survey, 2013.
1.00x
Effectively aligning analytics to business problems has 9% greater Analytic Impact than effectively tracking metrics.
Ineffective at Tracking Metrics
Effective at Tracking Metrics
Effective at Aligning Analytics
to Business Priorities
1.16x 1.25x
22© 2014 SHL, a part of CEB. All rights reserved
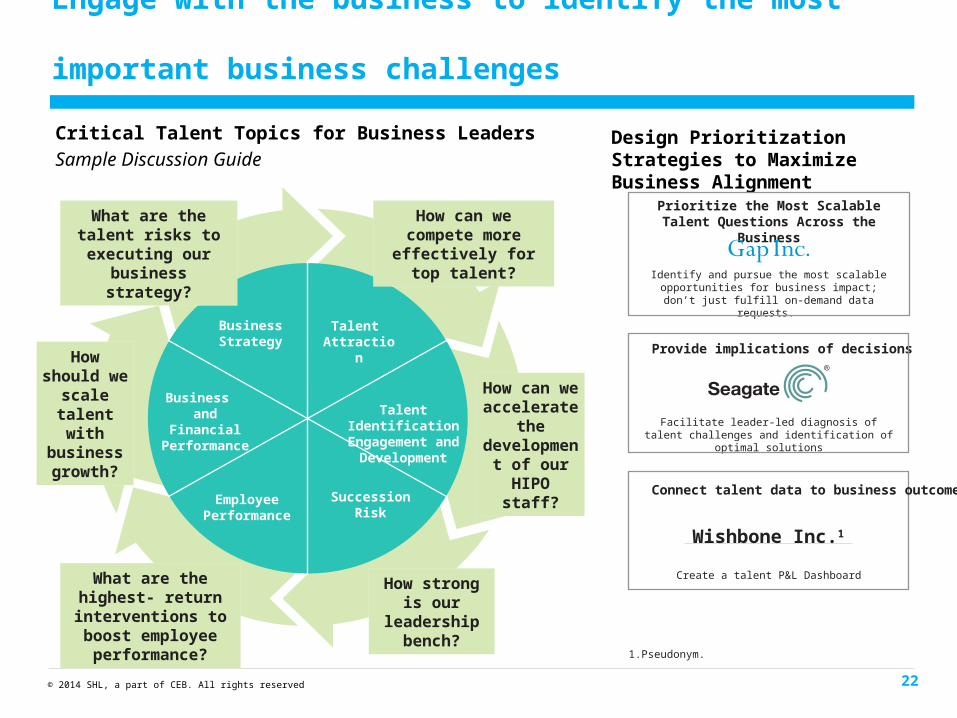
Critical Talent Topics for Business Leaders
Sample Discussion Guide
Talent Attraction
Succession Risk
Business Strategy
EmployeePerformance
Business and Financial Performance
Talent Identification Engagement and
Development
What are the talent risks to executing our
business strategy?
How should we
scale talent with
business growth?
What are the highest- return interventions to
boost employee performance?
How can we compete more effectively for
top talent?
How can we accelerate
the development of our HIPO
staff?
How strong is our leadership
bench?
Design Prioritization Strategies to Maximize Business Alignment
Prioritize the Most Scalable Talent Questions Across the Business
Identify and pursue the most scalable opportunities for business impact; don’t just fulfill
on-demand data requests.
Provide implications of decisions
Facilitate leader-led diagnosis of talent challenges and identification of optimal solutions
Engage with the business to identify the most important business challenges
Wishbone Inc.1
Connect talent data to business outcomes
Create a talent P&L Dashboard
1.Pseudonym.
23© 2014 SHL, a part of CEB. All rights reserved
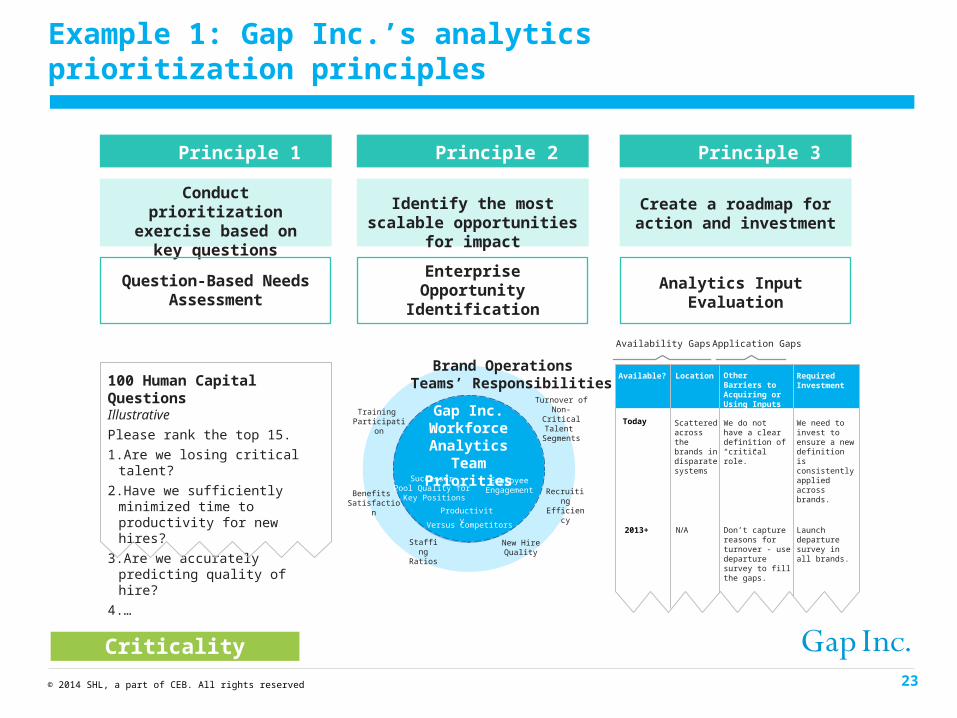
Example 1: Gap Inc.’s analytics prioritization principles
Principle 1
Conduct prioritization exercise based on key
questions
Question-Based Needs Assessment
Principle 2
Identify the most scalable opportunities for impact
Enterprise Opportunity Identification
Principle 3
Create a roadmap for action and investment
Analytics Input Evaluation
100 Human Capital Questions Illustrative
Please rank the top 15.
1.Are we losing critical talent?
2.Have we sufficiently minimized time to productivity for new hires?
3.Are we accurately predicting quality of hire?
4.…
Brand Operations Teams’ Responsibilities
Gap Inc. WorkforceAnalytics
Team Priorities
Turnover of Non-Critical
Talent Segments
Recruiting Efficiency
New Hire Quality
Training Participation
Productivity
Versus Competitors
Successor Pool Quality for Key Positions
Employee EngagementBenefits
Satisfaction
Staffing Ratios
Available? Location Other Barriers to Acquiring or Using Inputs
Required Investment
Today Scattered across the brands in disparate systems
We do not have a clear definition of “critical role.”
We need to invest to ensure a new definition is consistently applied across brands.
2013+ N/A Don’t capture reasons for turnover - use departure survey to fill the gaps.
Launch departure survey in all brands.
Availability Gaps Application Gaps
Criticality
24© 2014 SHL, a part of CEB. All rights reserved
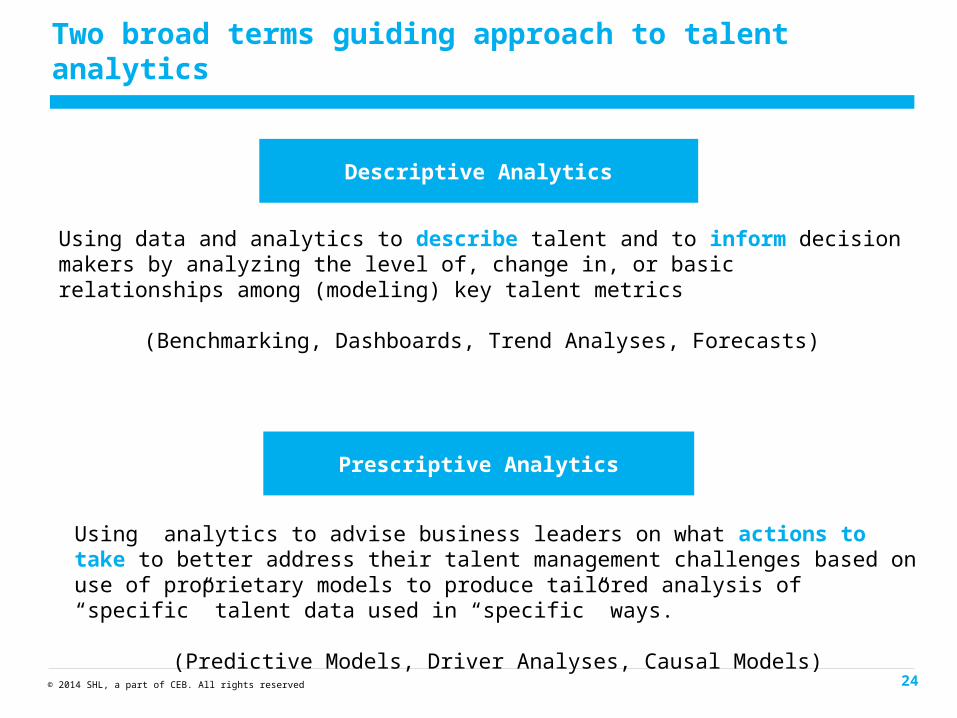
Using analytics to advise business leaders on what actions to take to better address their talent management challenges based on use of proprietary models to produce tailored analysis of “specific” talent data used in “specific” ways.
(Predictive Models, Driver Analyses, Causal Models)
Two broad terms guiding approach to talent analytics
Using data and analytics to describe talent and to inform decision makers by analyzing the level of, change in, or basic relationships among (modeling) key talent metrics
(Benchmarking, Dashboards, Trend Analyses, Forecasts)
Descriptive Analytics
Prescriptive Analytics
25© 2014 SHL, a part of CEB. All rights reserved
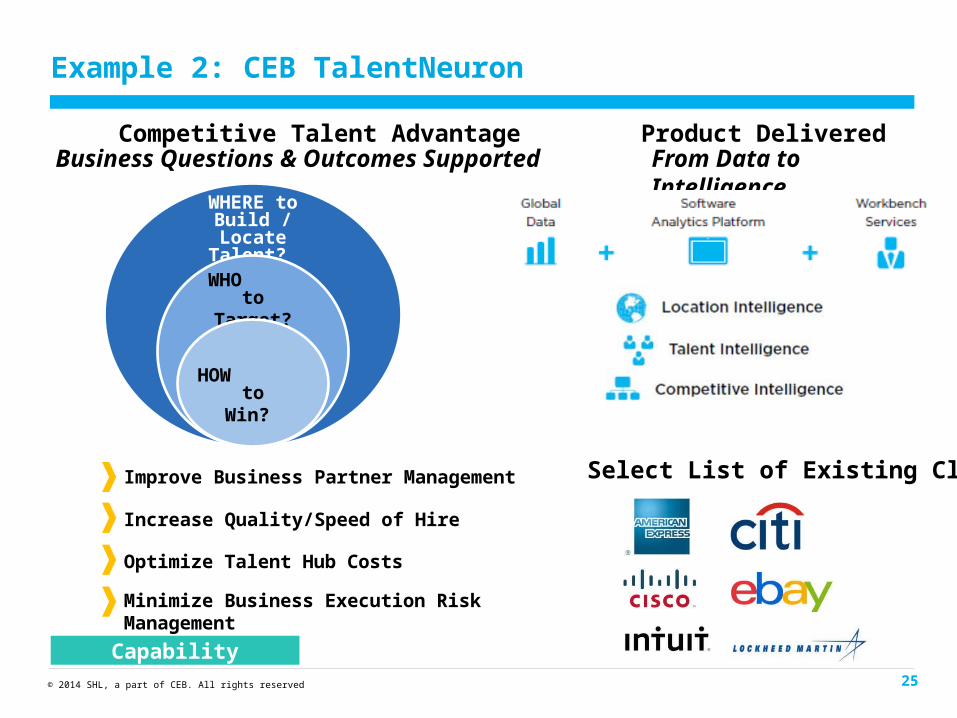
Example 2: CEB TalentNeuron
WHERE to Build / Locate
Talent?
WHO to Target?
HOW to Win?
Increase Quality/Speed of Hire
Improve Business Partner Management
Optimize Talent Hub Costs
Minimize Business Execution Risk Management
Competitive Talent Advantage Business Questions & Outcomes Supported
Product Delivered From Data to Intelligence
Select List of Existing Clients
Capability
26© 2014 SHL, a part of CEB. All rights reserved
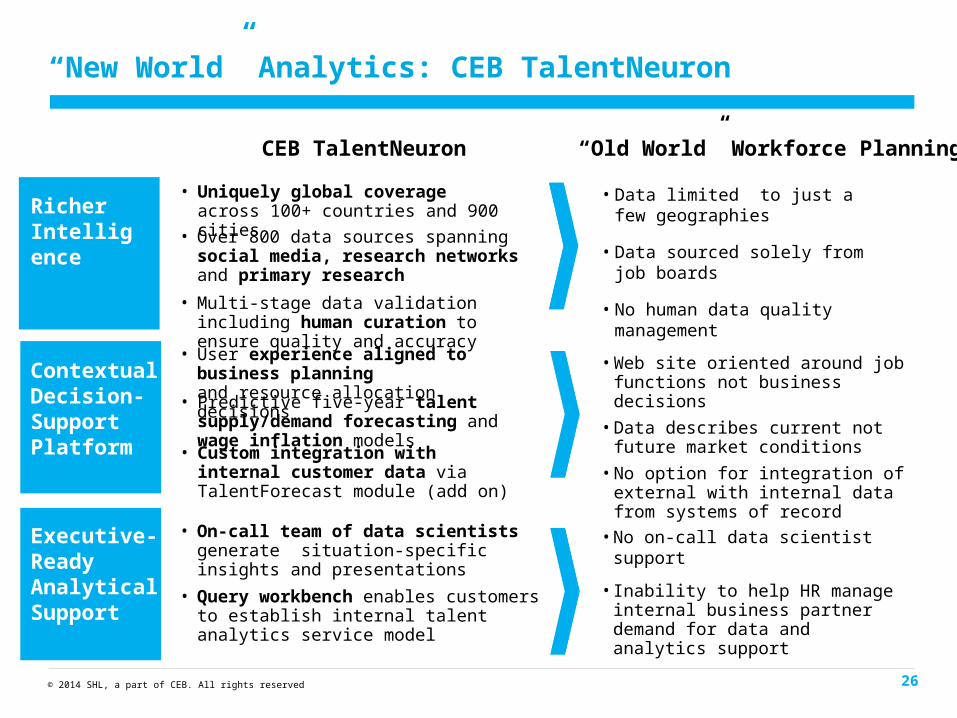
“New World” Analytics: CEB TalentNeuron
Richer Intelligence
Contextual Decision-SupportPlatform
Executive-ReadyAnalytical Support
CEB TalentNeuron
• Over 800 data sources spanning social media, research networks and primary research
• Multi-stage data validation including human curation to ensure quality and accuracy
• User experience aligned to business planning and resource allocation decisions
• Custom integration with internal customer data via TalentForecast module (add on)
• Predictive five-year talent supply/demand forecasting and wage inflation models
• On-call team of data scientists generate situation-specific insights and presentations
• Uniquely global coverage across 100+ countries and 900 cities
“Old World” Workforce Planning Analytics
• Data limited to just a few geographies
• Data sourced solely from job boards
• No human data quality management
• Web site oriented around job functions not business decisions
• Data describes current not future market conditions
• No option for integration of external with internal data from systems of record
• No on-call data scientist support
• Query workbench enables customers to establish internal talent analytics service model
• Inability to help HR manage internal business partner demand for data and analytics support
27© 2014 SHL, a part of CEB. All rights reserved
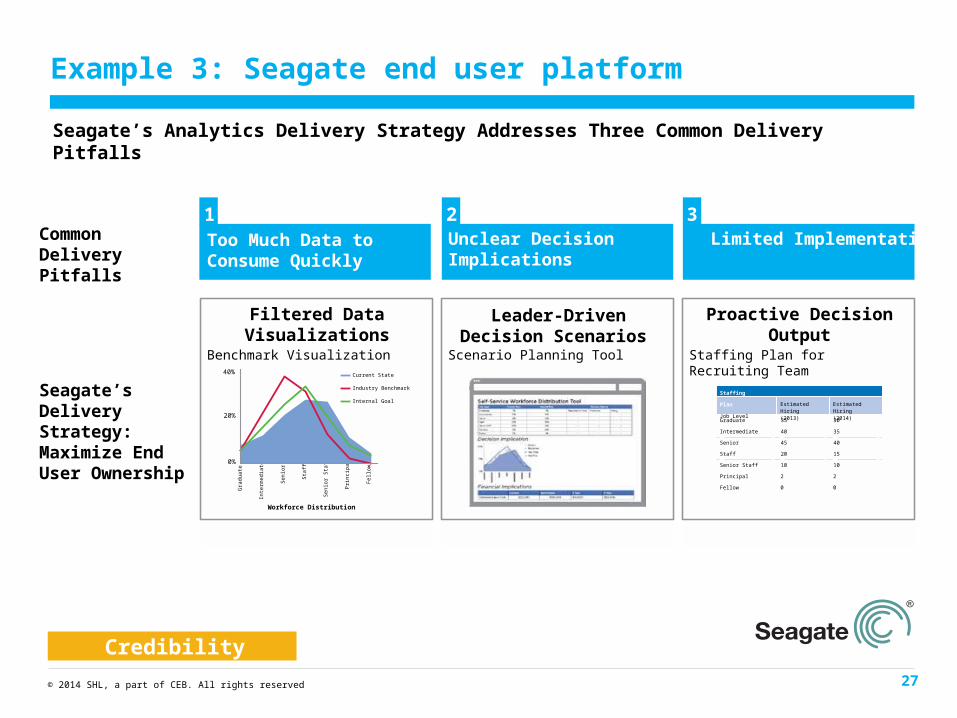
Seagate’s Analytics Delivery Strategy Addresses Three Common Delivery Pitfalls
Leader-Driven Decision Scenarios
Common Delivery Pitfalls
Seagate’s Delivery Strategy: Maximize End User Ownership
Too Much Data to Consume Quickly
Filtered DataVisualizations
Benchmark Visualization
Unclear DecisionImplications
Scenario Planning Tool
Limited Implementation
Proactive DecisionOutput
Staffing Plan for Recruiting Team
Workforce Distribution
Current State
Industry Benchmark
Internal Goal
Gra
duat
e
Inte
rmed
iate
Fel
low
Sen
ior
Sta
ff
Sen
ior
Sta
ff
Prin
cipa
l
40%
0%
20%
Staffing Plan
Job Level Estimated Hiring (2013)
Estimated Hiring (2014)
Graduate 35 30
Intermediate 40 35
Senior 45 40
Staff 20 15
Senior Staff 10 10
Principal 2 2
Fellow 0 0
1 2 3
Example 3: Seagate end user platform
Credibility
28© 2014 SHL, a part of CEB. All rights reserved
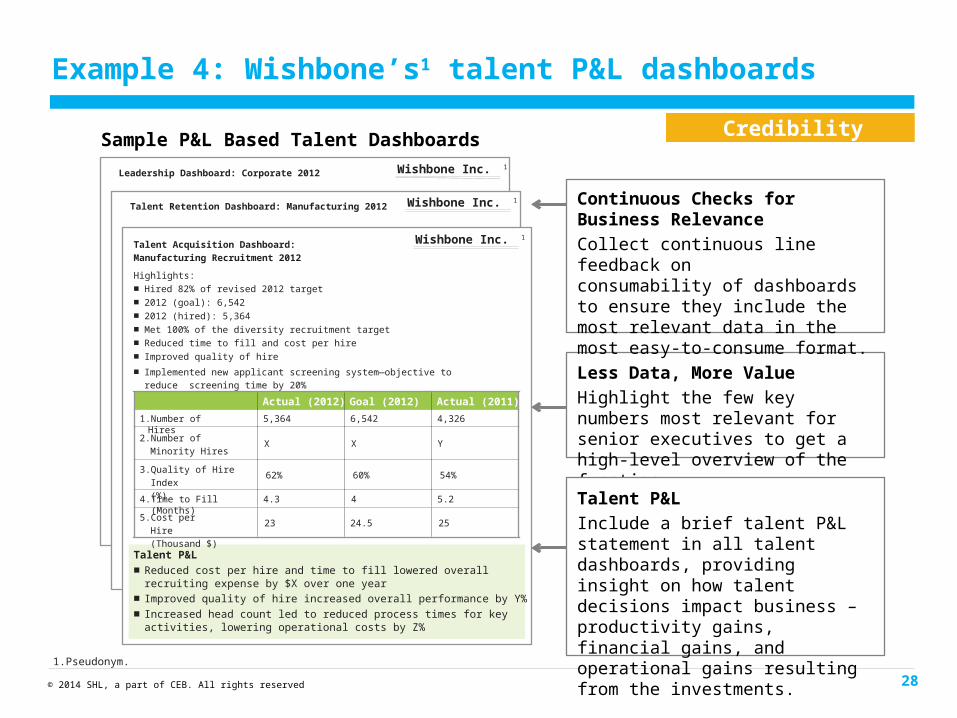
Example 4: Wishbone’s1 talent P&L dashboards
Continuous Checks for Business Relevance
Collect continuous line feedback on consumability of dashboards to ensure they include the most relevant data in the most easy-to-consume format.
Sample P&L Based Talent Dashboards
Leadership Dashboard: Corporate 2012
Talent Retention Dashboard: Manufacturing 2012
Talent Acquisition Dashboard:
Manufacturing Recruitment 2012
Highlights:
■Hired 82% of revised 2012 target
■ 2012 (goal): 6,542
■ 2012 (hired): 5,364
■Met 100% of the diversity recruitment target
■Reduced time to fill and cost per hire
■ Improved quality of hire
■ Implemented new applicant screening system—objective to reduce screening
time by 20%
Actual (2012) Goal (2012) Actual (2011)
1.Number of Hires 5,364 6,542 4,326
2. Number of Minority
Hires X X Y
3. Quality of Hire Index
(%)62% 60% 54%
4. Time to Fill (Months) 4.3 4 5.2
5. Cost per Hire
(Thousand $)23 24.5 25
Talent P&L
■Reduced cost per hire and time to fill lowered overall recruiting expense by $X over one year
■Improved quality of hire increased overall performance by Y%
■Increased head count led to reduced process times for key activities, lowering operational costs by Z%
Less Data, More Value
Highlight the few key numbers most relevant for senior executives to get a high-level overview of the function.
Wishbone Inc. 1
Wishbone Inc. 1
Wishbone Inc. 1
Talent P&L
Include a brief talent P&L statement in all talent dashboards, providing insight on how talent decisions impact business – productivity gains, financial gains, and operational gains resulting from the investments.
1.Pseudonym.
Credibility

29© 2014 SHL, a part of CEB. All rights reserved
The Analytics Era: Transforming HR’s impact on the business
1.Pseudonym.
Criticality Capability Credibility
1Prioritize Critical
Business Questions
2Apply Business Judgment
to Data Science
3Drive End-User Ownership
of Talent Analytics
Prioritize the most scalable opportunities for business impact
rather than simply fulfilling on-demand data requests.
Reset goals for talent analytics to focus staff on
business judgment.
Provide implications of decisions; don’t prescribe
solutions.
Analytics Prioritization Principles Re-Goaled Talent Analytics Implication-Based Decision Support
Evaluate talent risks to business strategy to identify key metrics.
Revise HRBP competencies to emphasize application of business judgment to data.
Talent Analytics Map HRBP Analytics Competencies
Build capability by establishing accountability and facilitating
connection across the business.
Connect talent data to business
outcomes
Wishbone Inc.1
Talent P&L Dashboard
Imperatives for CHROs to Improve Analytics Capability
30© 2014 SHL, a part of CEB. All rights reserved
Questions?
Maximizing the Business Impact of Talent Analytics