Embed Size (px)
Citation preview
1
Self-Assembly of a Si-based Cage by the Formation of 24 Equivalent Covalent Bonds
Jessica L Holmesa Brendan F Abrahamsa Anna Ahveninena Berin A Boughtonb Timothy A Hudsona Richard Robsona and Dinaiz Thinagaranb
Electronic Supporting Information
a School of Chemistry University of Melbourne Parkville Victoria 3010 Australia
b Metabolomics Australia School of Biosciences University of Melbourne Parkville Victoria 3010 Australia
S1 Comments on the formulation of the cage 2
S2 Instrumentation 2
S3 Synthesis and characterisation 2
S4 Further crystallographic details 4
S5 NMR spectroscopy 6
S6 Thermogravimetric analysis 9
S7 Powder Diffraction Patterns 11
S8 ESI mass spectrometry 13
S9 Infra-red spectroscopy 23
S10 References for ESI 25
Electronic Supplementary Material (ESI) for ChemCommThis journal is copy The Royal Society of Chemistry 2018
2
S1 Comments on the formulation of the cage
The covalent anionic tetrahedral cage has the formula [(PhSi)6(ctc)4]6- Whilst single crystal
X-ray diffraction clearly revealed the structure and formula of the cage other techniques have
been employed to identify counterions tetraethylammonium triethylammonium and bromide
For example NMR has been used to determine that the cage forms as a DMFEtOAc solvate (see
S5 NMR spectroscopy) The amount of solvent present varies depending on the treatment of the
crystals water is incorporated when the crystals are exposed to the atmosphere for extended
periods of time
S2 Instrumentation
Microwave reactor synthesis of the compound was performed using a Biotage Initiator
Classic microwave reactor Single crystal x-ray diffraction experiments were performed using a
SuperNova dual source diffractometer using CuKα radiation λ = 15418 Aring Powder X-ray
diffraction patterns were measured using a Rigaku Synergy instrument Mass spectrometry was
performed using an Agilent QTOF 6520 High resolution mass spectrometry was performed using
a Bruker Daltonics (Bremen Germany) SolariX 7 Tesla Hybrid MALDIESI-FT-ICR-MS 1H and 13C
NMR spectrometry was performed using a Varian 400 MHz NMR Spectrometer
Thermogravimetric analyses were performed using a Mettler TGASDTA851 apparatus Infrared
spectroscopy was performed using a Bruker Tensor FTIR 27
S3 Synthesis and characterisation
Method 1
This method was used for growing crystals for single crystal X-ray diffraction Preparation
of (NEt4)4(HNEt3)4[(PhSi)6(ctc)4]Br2middotsolvate Cyclotricatechylene (H6ctc) (192 mg 052 mmol) was
placed in a 10-20 mL microwave vial and dissolved in DMF (6 mL) NEt4Br (66 mg 031 mmol) in
DMF (6 mL) was added to the ctcH6 solution followed by SiPh(OEt)3 (030 mL) and excess NEt3
(ca 16 drops) The solution was sparged with N2 for 2 minutes then sealed and placed in a Biotage
3
Initiator microwave reactor The solution was heated to 100degC with stirring and held at this
temperature for 15 minutes then allowed to cool to room temperature 2 mL of the reaction
mixture was decanted into a vial and exposed to EtOAc vapour for several days over which time
large yellow crystals (typical dimensions between 05 and 10 mm) suitable for x-ray diffraction
grew on the surface of the vial A single crystal was taken from the mother liquor and placed
directly into protective oil Single crystal X-ray diffraction data was collected using a SuperNova
diffractometer fitted with a CuKα X-ray source The X-ray data revealed the crystals to be face
centered cubic with the adoption of the space group F-43m a = 279568(6) Aring
In order to improve the yield reduce solvent usage and reduce crystallization time of the
compound the synthetic procedure was modified and the resultant crystalline product used for
all further characterization experiments The method described above is hereafter designated
method 1 and the modified method detailed below is method 2
Method 2
Cyclotricatechylene (192 mg 052 mmol) was placed in a 2-5 mL microwave vial and
dissolved in DMF (4 mL) NEt4Br (66 mg 031 mmol) was then added to the ctcH6 solution
followed by SiPh(OEt)3 (030 mL) and excess NEt3 (ca 16 drops) The solution was sparged with
N2 for 2 minutes then sealed and placed in a Biotage Initiator microwave reactor The solution
was heated to 120degC with stirring and held at this temperature for 30 minutes then allowed to
cool to room temperature The reaction mixture was distributed into 5 vials in equal aliquots
before exposure to EtOAc vapour to induce crystallisation Each aliquot contained 105 x 10-5 mol
of the limiting reagent ctcH6
The crystals formed from method 2 were shown to be the same as those obtained by
method 1 by comparison of the powder x-ray diffraction pattern of the product from method 2
with the simulated pattern produced from the crystal structure determination obtained on a
crystal produced by method 1 (Figure S5) Crystals from one aliquot were collected via vacuum
filtration and dried in a stream of air These were used for elemental and infrared analyses
Elemental analysis was performed at Campbell Microanalytical Laboratory Chemistry
Department Te Tari Hua Ruānuku University of Otago Analysis (air dried sample prepared via
4
method 2) (NEt4)4(HNEt3)4[(PhSi)6(ctc)4]Br2(DMF)(H2O)19 Calc C 601 H 75 N 35 Found
C 601 H 69 N 33
Crystals from a second aliquot were collected on a glass frit and washed with minimum
EtOAc to measure the yield and 13C (not shown) and 1H NMR spectra of the compound The
percentage yield is based on the best approximation of the chemical formula of vacuum dried
crystals (NEt4)4(HNEt3)4[(PhSi)6(ctc)4]Br24DMF (from which all the EtOAc has been removed and
have not been exposed to atmospheric water vapour for an extended period of time) as
estimated by integration of the 1H NMR spectrum of the dried crystals (see figure S8) The yield
was 465 mg 51
S4 Further crystallographic details
In the crystal structure investigated initial refinements involved attempts to assign numerous
small peaks of electron density in the difference Fourier maps to atoms of disordered cations and
solvent molecules This approach resulted in unsatisfactorily high agreement values In response
to these difficulties the SQUEEZES1 routine within the crystallographic program PLATONS2 was
used to subtract the contribution of the diffuse solvent from the diffraction data and this led to
an improvement in agreement values It also provided an indication of the volume of the solvent
accessible void spaces and the number of electrons in these regions On the basis of this
information as well as thermogravimetric analysis of lsquowet crystalsrsquo (see S6 Thermogravimetric
analysis) and 1H NMR (see S5 NMR spectroscopy) the number of solvent molecules (assumed to
be only DMF and EtOAc) in the unit cell was estimated Despite the uncertainties arising from the
location of solvent molecules and cations within the structure the anionic cage which is the
focus of our interest is clearly defined The formula of the crystal that was crystallographically
characterized was assigned as (NEt4)4(HNEt3)4[(PhSi)6(ctc)4]Br2(DMF)4(EtOAc)6
Crystallographic analysis of the crystals immersed in the CsBr solution revealed a similar
structure to that of the parent crystals except that a Cs+ ion was now located in each of the four
corners of the [(PhSi)6(ctc)4]6- cage Estimation of the chemical formula of the crystals was difficult
because the solvent and cations occupying the inter-cage spaces could not be identified Given
that triethylammonium is likely to be more soluble in water it was assumed for the purposes of
estimating the formula of the crystals that the incorporation of Cs+ accompanied the loss of
5
triethylammonium to the aqueous environment upon immersion in the CsBr solution In addition
it was thought that the dimethylformamide and ethyl acetate would be replaced by water in the
crystal The formula of the immersed crystals therefore was tentatively assigned as
(NEt4)4Cs4[(PhSi)6(ctc)4]Br270H2O Despite the uncertainty associated with the overall formula
the crystal structure clearly indicates Cs+ ions associating with the internal surface of the cage
The cages in both the parent and immersed crystals pack in a face centred cubic (FCC)
arrangement in which six phenyl groups from six distinct cages converge upon octahedral sites
within the FCC structure as indicated in Fig S2
The structures were solved using SHELXTS3 and refined using a full-matrix least squares
procedure based upon F2 (SHELXLS4) The solution and refinement of
(NEt4)4(HNEt3)4[(PhSi)6(ctc)4]Br2(DMF)4(EtOAc)6was performed within the WinGX system of
programsS5 whereas OLEX2S6 was employed for (NEt4)4Cs4[(PhSi)6(ctc)4]Br270H2O
Figure S1 A representation of the packing in (NEt4)4(HNEt3)4[(PhSi)6(ctc)4]Br2(DMF)4(EtOAc)6 showing only the cages located in the middle of each face of the cubic unit cell The translucent sphere corresponds to an octahedral site at the centre of the cell where the phenyl rings from six cages converge Crystallographically equivalent octahedral sites are located half-way along each edge Only one phenyl ring from each cage is depicted The cages located at the vertices of the unit cell are not shown
6
S5 NMR spectroscopy
1H NMR spectra were collected for three samples of the compound each with different post-
synthetic treatment The three samples are shown in Figures S3 and S4 The top sample (3) in
each figure corresponds to a sample that was prepared by directly transferring multiple large
single crystals directly from the mother liquor into d6DMSO The middle sample (2) corresponds
to the bulk material collected on a glass frit without suction and washed with ethyl acetate The
bottom spectrum (1) was obtained on the bulk material that was collected on a glass frit and
dried at the pump without washing with additional solvent no heating was performed
The distinct absence of the three characteristic ethyl acetate peaks (118 ppm 198 ppm and 403
ppm) in sample 3 shows that it is easily released at room temperature Aside from this difference
the three spectra have the same peak profile indicating that the bulk sample is the same as the
single crystals A small shift in some of the peaks is observable on loss of ethyl acetate in sample
1
7
1013
1619
2225
2831
3437
4043
46chem
ical shift (ppm)
1 2 3
Single crystal sample transferred to deuterated solvent directly from
mother liquor
Bulk sample w
ashed with EtO
Ac and filtered on frit but not dried
Bulk sample air dried on frit w
ithout washing
Figure S2 1H NMR 28-45 ppm for three samples of the crystals each with different post-synthetic treatment All Samples were dissolved in and referenced to d6DMSO No peaks were present below 28 ppm or between 45 and 55 ppm
8
5658
6062
6466
6870
7274
7678
8082
8486
chemical shift (ppm
)
1 2 3
Single crystal sample transferred to deuterated solvent directly from
mother liquor
Bulk sample w
ashed with EtO
Ac and filtered on frit but not dried
Bulk sample air dried on frit w
ithout washing
Figure S3 1H NMR 55 to 87 ppm for three samples of the compound each with different post-synthetic treatment All samples were dissolved in and referenced to d6DMSO No peaks were present above 87 ppm
9
S6 Thermogravimetric analysis
Thermogravimetric analysis (TGA) of two samples of the compound was performed across a
temperature range of 25-450 degC The lsquodry crystalsrsquo represented below in Figure S5 in blue were
collected on a glass frit and air was pulled through the sample for several minutes The crystals
were left for several days before TGA was performed Though there is a small initial drop in mass
as dry nitrogen was blown across the sample at 25 degC the gradient of the graph remains close to
horizontal to temperatures around 250 degC indicating that most ethyl acetate is lost at room
temperature This is confirmed also by 1H NMR of the dried crystals (see S5 Nuclear Magnetic
Resonance Spectroscopy) Some of the mass loss below 80 degC may also correspond to water
adsorbed from the atmosphere however this has not been confirmed The total mass loss up to
450 degC corresponds approximately to all solvent (DMF) and counterions leaving only the cage
remaining Stability of the cage above 450 degC has not been measured
The lsquowet crystalsrsquo were prepared for analysis by filtration on a glass frit in the absence of suction
immediately before being transferred to the TGA instrument Some solvent loss may have
occurred during sample transfer and calibration of the instrument however the steeper gradient
of this line indicates presence and subsequent loss of ethyl acetate (and possibly water) up to
approximately 250 degC The TGA data of the wet crystals combined with the NMR provide the basis
for the estimate of the chemical formula of the single crystal used for x-ray diffraction
(NEt4)4(HNEt3)4[(PhSi)6(ctc)4]Br2(DMF)4(EtOAc)6
10
Figure S4 Thermogravimetric traces of air dried crystals that were exposed to atmosphere (blue) and crystals that were collected from their mother liquor with no vacuum and transferred directly to the instrument (red)
11
S7 Powder Diffraction Patterns
The powder diffraction pattern for the parent compound (NEt4)4(HNEt3)4[(PhSi)6(ctc)4]Br2solvate (Figure S5) of the boiled crystals (Figure S6) and the crystals soaked in aqueous CsBr (Figure S7) are shown below
Figure S5 Calculated powder x-ray diffraction pattern of (NEt4)4(HNEt3)4[(PhSi)6(ctc)4]Br2solvate (blue) compared with experimental data for ground up crystals prepared via method 2 and washed with a minimum of ethyl acetate (red)
5 10 15 20 25 30 35 402Θ
Intensity
12
Figure S6 Observed powder diffraction patterns of (NEt4)4(HNEt3)4[(PhSi)6(ctc)4]Br2middotsolvate untreated (blue) and after being boiled in H2O for 30 mins (red)
Figure S7 Calculated (blue) and observed (red) powder patterns of the Si-cage crystals [(NEt4)4Cs4[(PhSi)6(ctc)4]Br2solvate] after immersion in aqueous CsBr
5 10 15 20 25 30 35 400
2000
4000
6000
8000
10000
12000
0
5
10
15
20
25
30
35
40
45
2Θ
Intensity
4 9 14 19 24 29 34 390
10
20
30
40
50
60
70
0
2
4
6
8
10
12
14
16
18
2Θ
Intensity
13
S8 ESI mass spectrometry
A Bruker Daltonics (Bremen Germany) SolariX 7 Tesla Hybrid MALDIESI-FT-ICR-MS was
used for high mass resolution analysis The instrument was operated in ESI negative and positive
ionisation modes with TD acquisition = 1M mz 200-2000 or 4M mz 5375-3000 providing mass
resolutions of 260000 and 140000 at mz 400 respectively and ESI positive ionization mode The
system was calibrated using an external calibration of ESI-TOF low concentration Tune Mix
(Agilent Technologies Santa Clara CA USA) Samples were infused at a rate of 2 microL min-1 using
the syringe pump a total of 10-20 scans were collected and averaged to generate mass spectra
The following general instrument conditions were set capillary voltage negative mode = 4200 V
and positive mode = -4000 V drying gas flow 40 L min-1 drying gas temperature 180degC
nebulizer gas flow rate 10 bar source accumulation 0001 sec ion accumulation 05 sec ion
cooling time 001 sec flight time 0001 sec Data were analysed using the Bruker Compass Data
Analysis 42 (Build 3831) software
Unless otherwise indicated the mz values given refer to the base peak of on isotopologue series
Sample preparation for ESI-MS analysis
1 (NEt4)4(HNEt3)4[(PhSi)6(ctc)4]middotsolvate (untreated crystals)
3-4 large crystals of the compound prepared via synthetic method 1 were dissolved in a
minimum of DMF (lt1 mL) followed by dilution with acetone (10 mL) prior to analysis
2 (NEt4)4(HNEt3)4[(PhSi)6(ctc)4]middotsolvate crystals that had been immersed in boiling water
2 mg of crystals of the compound prepared via synthetic method 2 were boiled in
deionized water for 30 min then solution was kept at 60degC for 7 days then filtered the
crystals dried 3-4 large crystals were dissolved in a minimum of DMSO (lt1 mL) followed
by dilution with acetonitrile (10 mL)
3 (NEt4)4(HNEt3)4[(PhSi)6(ctc)4]middotsolvate soaked in aqueous CsBr
1 mg of large crystals prepared via synthetic method 2 was immersed in an aqueous CsBr
solution (30 mg in 2 mL water) for 3 days then filtered and dried 3-4 large crystals were
dissolved in DMF (1 mL) followed by dilution with acetonitrile (10 mL)
14
Results of ESI-MS analysis
1 (NEt4)4(HNEt3)4[(PhSi)6(ctc)4]middotsolvate (untreated crystals)
Figure S6 shows the full high resolution ESI mass spectrum in negative mode
Table S1 lists the dominant isotopologues in the full spectrum The relative intensities of
the base peaks within each of the isotopologue series are indicated as their percentage
contribution to the sum of the intensities of the base peaks in each of the isotopologue series
The error (in ppm) for each species is calculated based upon the monoisotopic peak for each
isotopologue series
Figure S7 shows a portion of the spectrum in which a series of dianionic cage adducts are
indicated Figure S8 shows an enlargement of the signal corresponding to [cage + (NEt4)4]2- and a
comparison with the calculated pattern An enlargement of the signal corresponding to [cage +
(NEt4)3]3- and a comparison with the calculated pattern is displayed in Figure S9
15
Figure S6 Full ESI-mass spectrum in negative mode of samples obtained from the dissolution of (NEt4)4(HNEt3)4[(PhSi)6(ctc)4]middotsolvate crystals
656106631-
820946233-
1296490462-
1479551682-
500 1000 1500 2000 2500 mz0
1
2
3x10⁹Intensity
4
16
Table S1 Selected negative ionisation mode mass spectrum data for untreated crystals
mz (monoisotopic
peak)
mz (base peak) Charge Species Mass Error (ppm)
62607767 62807517 -1 - 49364402513 64402513 -1 - 198
65410885 65610663 -1 - 662
81093470 81160256 -3 [cage + (Et4N)2(HNEt3)]3- 212 157
82027857 82094623 -3 [cage + (Et4N)3]3- 223 109483320603 83320603 -1 - 104
88062603 88162843 -3 - 1094
94231547 94298363 -3 - 15
102022131 102221970 -1 - 109
126746585 126846409 -2 [cage + (Et4N)2(HNEt3)2]2- 199 129
128147736 128247689 -2 [cage + (Et4N)3(HNEt3)]2- -126 1108
129549110 129649046 -2 [cage + (Et4N)4]2- -272 37
131600693 131700842 -2 [cage + (Et4N)4 + MeCN]2- -074 259
133202091 133302389 -2 [cage + (Et4N)4 + DMF]2- -008 433
133239625 133391475 -2 - 141
146453513 146553452 -2 - 436
147854996 147955168 -2 - 62
158309263 158459398 -2 - 104
Figure S7 ESI-mass spectrum in negative mode of the peaks associated with [cage + (Et4N)4]2- at mz 129649046 [cage + (Et4N)3 + (Et3NH)]2- at mz 128247896 and [cage + (Et4N)2 + (Et3NH)2]2- at mz 126846409 from the dissolution of [(NEt4)4(HNEt3)4[(PhSi)6(ctc)4]middotsolvate crystals
17
Figure S8 ESI-mass spectrum in negative mode of the peaks associated with [cage + (Et4N)4]2- at mz 129649046 from the dissolution of [(NEt4)4(HNEt3)4[(PhSi)6(ctc)4]middotsolvate crystals
129549110
129599073129649046
129699036
129749030
129799091129849193
129899429
129549463
129599601129649699
129699781
129749853
129799920129849983
129900046
Calculated for [(C21H12O6)4(C6H5Si)6(C8H20N)4]2-
mz 129649699Error = -272 ppm mSigma = 170
1
2
3Intensity x109
0
1
2
3
4
1295 1296 1297 1298 1299 1300 mz
4
Intensity x109
Obtained for [(C21H12O6)4(C6H5Si)6(C8H20N)4]2-
mz 129649046
18
Figure S9 ESI-mass spectrum in negative mode of the peaks associated with [cage + (Et4N)3]3- at mz 82094623 (base peak) from the dissolution of (NEt4)4(HNEt3)4[(PhSi)6(ctc)4]middotsolvate crystals
2 (NEt4)4(HNEt3)4[(PhSi)6(ctc)4]middotsolvate crystals that had been immersed in boiling water
Figure S10 shows the full negative mode high resolution ESI mass spectrum obtained for
crystals of the compound boiled in water then dissolved in dimethylsulfoxide and diluted with
acetonitrile The dominant peak in the spectrum corresponds to [cage + (Et4N)3]3- at mz 820
82094461 Additionally there is a significant peak corresponding to [cage + (Et4N)2]4- at mz
58316930
Table S2 lists the dominant isotopologues in the full spectrum The relative intensities of
the base peaks within each of the isotopologue series are indicated as their percentage
contribution to the sum of the intensities of the base peaks in each of the isotopologue series
The error (in ppm) for each species is calculated based upon the monoisotopic peak for each
isotopologue series
82027857
8206125282094623
82127980
82161346
8219470882228104
82261505
82027674
8206109982094495
82127880
82161259
8219463582228008
82261382
Calculated for [(ctc)4(C6H5Si)6(C8H20N)3]3-
mz 82094495Error = 223 ppm
mSigma = 102
02
04
06
08
10
12
Intensity x109
00
02
04
06
08
10
12
8200 8205 8210 8215 8220 8225 8230 8235 mz
Intensity x109
Obtained for [(ctc)4(C6H5Si)6(C8H20N)3]3-
mz 82094623
19
Figure S10 Full negative mode mass spectrum of the crystals that had been boiled in water prior to being dissolved in DMSO and diluted with MeCN
583169304-
820944613-
959016973-
1335511022-
200 400 600 800 1000 1200 1400 1600 1800 mz
02
04
06
08
10
Intensity x109
20
Table S2 Selected negative ionisation mode mass spectrum data for crystals boiled in water prior to being dissolved in DMSO and diluted with MeCN
mz (monoisotopic
peak)
mz (base peak) Charge Species Mass Error
(ppm)
52588164 52513325 -4 - 114
55012908 55037984 -4 - 115
57566102 57591153 -4 [cage + (Et4N)(HNEt3)]4- 181 428
58266875 58316930 -4 [cage + (Et4N)2]4- 163 1467
64190823 64215815 -4 - 76
57538082 57563061 -4 - 45
74322912 74356421 -3 - 253
76572434 76622586 -2 - 188
81093427 81122759 -3 [cage + (Et4N)2(HNEt3)]3- 159 427
82027674 82094461 -3 [cage + (Et4N)3]3- 000 4449
94231837 94298549 -3 - 302
95834956 95901697 -3 - 703
126634775 126734243 -2 [cage +(Et4N)(HNEt3)Na2]2- + DMSO + 2MeCN + H2O -1505 006
128142767 128192988 -2 [cage + (Et4N)3(HNEt3)]2- -4004 05
129549463 129599949 -2 [cage + (Et4N)4]2- 000 077
131601536 131701879 -2 [cage + (Et4N)4 + MeCN]2- 567 083
133500905 133551102 -2 - 127 indicates assignment of species where large mass error may be attributable to overlapping peaks in the mass spectrum
21
3 Analysis of (NEt4)4(HNEt3)4[(PhSi)6(ctc)4]middotsolvate soaked in CsBr
Figure S11 shows the full negative mode high resolution ESI mass spectrum of the sample
obtained for crystals of the compound that had been immersed in an aqueous CsBr solution then
dissolved in dimethylformamide and diluted with acetonitrile Overlapping isotopic profiles of
the cage with caesium and tetraethylammonium cations reflect the similarity in the mass of Cs+
and NEt4+
Table S3 lists the dominant isotopologues in the full spectrum The relative intensities of
the base peaks within each of the isotopologue series are indicated as their percentage
contribution to the sum of the intensities of the base peaks in each of the isotopologue series
The error (in ppm) for each species is calculated based upon the monoisotopic peak for each
isotopologue series
Figure S11 Full negative mode mass spectrum of the crystals soaked in aqueous CsBr solution followed by dissolution in DMF and dilution with MeCN
583610534-
821867643-
1317395382-
200 400 600 800 1000 1200 1400 1600 1800 mz00
05
10
15
Intensity x109
22
Table S3 Selected negative ionisation mode mass spectrum data for crystals soaked in aqueous CsBr solution followed by dissolution in DMF and dilution with MeCN
mz (monoisotopic
peak)
mz (base peak) Charge Species
Mass Error (ppm)
58335201 58360465 -4 [cage + (Et4N)Cs]4- -388 11
65818834 65868071 -4 - 1
66672091 66721334 -4 - 09
80449608 80516206 -3 - 1
80981919 81048446 -3 [cage + (Et4N)CsNa + DMF]3- -062 114
82027674 82061027 -3 [cage + (Et4N)3]3- 000 34
82118882 82185240 -3 [cage + (Et4N)2Cs]3- -392 148
82210659 82243943 -3 [cage + (Et4N)Cs2]3- -090 24
84554184 84587536 -3 [cage + (Et4N)2Cs + DMF]3- -132 06
118127721 118227765 -2 - 04
124432811 124530638 -2 [cage + (Et4N)Na3 + 3DMF]2- 727 11
125479724 125577383 -2 [cage + (HNEt3)3Cs]2- -1863 04
126275663 126327346 -2 [cage + (Et4N)CsNa2 + 2DMF]2- 483 19
127847421 127944904 -2 [cage + (Et4N)3Na + DMF]2- 2980 33
127994562 128081415 -2 [cage + (Et4N)2CsNa + DMF]2- 10671 5
129131199 129230828 -2 - 17
129549463 129648253 -2 [cage + (Et4N)4]2- 000 109
129927040 130027425 -2 [cage + (Et4N)CsNa2 + 3DMF]2- -501 94
130835264 130934288 -2 [cage + (Et4N)2(HNEt3)2 + 2MeCN]2- -10488 55
131635977 131734789 -2 [cage + (Et4N)(HNEt3)2Na + 2DMF + MeCN + H2O]2- -6835 125
133342580 133441156 -2 [cage + (Et4N)3Cs + DMF]2- 2389 115
indicates assignment of species where large mass error may be attributable to overlapping peaks in the mass spectrum
23
Figure S12 Shows three overlapping isotopic profiles of [cage + (Et4N)3]3- at mz 82061027 [cage + (Et4N)2(Cs)]3- (most abundant) at mz 82185240 and [cage + (Et4N)(Cs)2]3- at mz 822
S9 Infra-red spectroscopy
Infra-red spectrum (NEt4)4(HNEt3)4[(PhSi)6(ctc)4]Br2middotsolvate (pressed KBr disc)
IR(KBr) cm-1 3431 3065 3025 2984 2918 2854 1619 1498 1384 1277 1254 1171 1119 938 890 858 738 704 672 612 521
The infra-red spectrum of (NEt4)4(HNEt3)4[(PhSi)6(ctc)4]Br2middotsolvate (pressed KBr disc) is presented in Figure S16
Infra-red spectrum of crystal after soaking in aqueous CsBr (pressed KBr disc)
IR(KBr) cm-1 3427 3065 3024 2982 2925 2860 1658 1619 1498 1384 1277 1253 1170 1117 1000 937 890 858 738 704 610 521
820276743-
820610273- 82094337
3- 82118882
821521273- 82185240
3-
822185803-
822522393-
822773243-
8205 8210 8215 8220 8225 8230 mz00
05
10
15
3-
Intensity x109
822439433-
24
4009001400190024002900340039000
01
02
03
04
05
06
07
08
09
FTIR of (NEt4)4(HNEt3)4[(PhSi)6(ctc)4]Br2middotsolvate - (KBr Disc)
Wavenumbers (cm-1 )
Tran
smis
sion
()
Figure S13 Infrared spectrum of (NEt4)4(HNEt3)4[(PhSi)6(ctc)4]Br2middotsolvate (pressed KBr disc)
25
S10 References for ESI
1 A Spek Acta Cryst Sect C 2015 71 9-18
2 A Spek Acta Cryst Sect D 2009 65 148-155
3 G Sheldrick Acta Cryst Sect A 2015 71 3-8
4 G Sheldrick Acta Cryst Sect C 2015 71 3-8
5 L Farrugia J Appl Cryst 2012 45 849-854
6 O V Dolomanov L J Bourhis RJ Gildea J A K Howard and H Puschmann J Appl Cryst 2009 42 339-341
2
S1 Comments on the formulation of the cage
The covalent anionic tetrahedral cage has the formula [(PhSi)6(ctc)4]6- Whilst single crystal
X-ray diffraction clearly revealed the structure and formula of the cage other techniques have
been employed to identify counterions tetraethylammonium triethylammonium and bromide
For example NMR has been used to determine that the cage forms as a DMFEtOAc solvate (see
S5 NMR spectroscopy) The amount of solvent present varies depending on the treatment of the
crystals water is incorporated when the crystals are exposed to the atmosphere for extended
periods of time
S2 Instrumentation
Microwave reactor synthesis of the compound was performed using a Biotage Initiator
Classic microwave reactor Single crystal x-ray diffraction experiments were performed using a
SuperNova dual source diffractometer using CuKα radiation λ = 15418 Aring Powder X-ray
diffraction patterns were measured using a Rigaku Synergy instrument Mass spectrometry was
performed using an Agilent QTOF 6520 High resolution mass spectrometry was performed using
a Bruker Daltonics (Bremen Germany) SolariX 7 Tesla Hybrid MALDIESI-FT-ICR-MS 1H and 13C
NMR spectrometry was performed using a Varian 400 MHz NMR Spectrometer
Thermogravimetric analyses were performed using a Mettler TGASDTA851 apparatus Infrared
spectroscopy was performed using a Bruker Tensor FTIR 27
S3 Synthesis and characterisation
Method 1
This method was used for growing crystals for single crystal X-ray diffraction Preparation
of (NEt4)4(HNEt3)4[(PhSi)6(ctc)4]Br2middotsolvate Cyclotricatechylene (H6ctc) (192 mg 052 mmol) was
placed in a 10-20 mL microwave vial and dissolved in DMF (6 mL) NEt4Br (66 mg 031 mmol) in
DMF (6 mL) was added to the ctcH6 solution followed by SiPh(OEt)3 (030 mL) and excess NEt3
(ca 16 drops) The solution was sparged with N2 for 2 minutes then sealed and placed in a Biotage
3
Initiator microwave reactor The solution was heated to 100degC with stirring and held at this
temperature for 15 minutes then allowed to cool to room temperature 2 mL of the reaction
mixture was decanted into a vial and exposed to EtOAc vapour for several days over which time
large yellow crystals (typical dimensions between 05 and 10 mm) suitable for x-ray diffraction
grew on the surface of the vial A single crystal was taken from the mother liquor and placed
directly into protective oil Single crystal X-ray diffraction data was collected using a SuperNova
diffractometer fitted with a CuKα X-ray source The X-ray data revealed the crystals to be face
centered cubic with the adoption of the space group F-43m a = 279568(6) Aring
In order to improve the yield reduce solvent usage and reduce crystallization time of the
compound the synthetic procedure was modified and the resultant crystalline product used for
all further characterization experiments The method described above is hereafter designated
method 1 and the modified method detailed below is method 2
Method 2
Cyclotricatechylene (192 mg 052 mmol) was placed in a 2-5 mL microwave vial and
dissolved in DMF (4 mL) NEt4Br (66 mg 031 mmol) was then added to the ctcH6 solution
followed by SiPh(OEt)3 (030 mL) and excess NEt3 (ca 16 drops) The solution was sparged with
N2 for 2 minutes then sealed and placed in a Biotage Initiator microwave reactor The solution
was heated to 120degC with stirring and held at this temperature for 30 minutes then allowed to
cool to room temperature The reaction mixture was distributed into 5 vials in equal aliquots
before exposure to EtOAc vapour to induce crystallisation Each aliquot contained 105 x 10-5 mol
of the limiting reagent ctcH6
The crystals formed from method 2 were shown to be the same as those obtained by
method 1 by comparison of the powder x-ray diffraction pattern of the product from method 2
with the simulated pattern produced from the crystal structure determination obtained on a
crystal produced by method 1 (Figure S5) Crystals from one aliquot were collected via vacuum
filtration and dried in a stream of air These were used for elemental and infrared analyses
Elemental analysis was performed at Campbell Microanalytical Laboratory Chemistry
Department Te Tari Hua Ruānuku University of Otago Analysis (air dried sample prepared via
4
method 2) (NEt4)4(HNEt3)4[(PhSi)6(ctc)4]Br2(DMF)(H2O)19 Calc C 601 H 75 N 35 Found
C 601 H 69 N 33
Crystals from a second aliquot were collected on a glass frit and washed with minimum
EtOAc to measure the yield and 13C (not shown) and 1H NMR spectra of the compound The
percentage yield is based on the best approximation of the chemical formula of vacuum dried
crystals (NEt4)4(HNEt3)4[(PhSi)6(ctc)4]Br24DMF (from which all the EtOAc has been removed and
have not been exposed to atmospheric water vapour for an extended period of time) as
estimated by integration of the 1H NMR spectrum of the dried crystals (see figure S8) The yield
was 465 mg 51
S4 Further crystallographic details
In the crystal structure investigated initial refinements involved attempts to assign numerous
small peaks of electron density in the difference Fourier maps to atoms of disordered cations and
solvent molecules This approach resulted in unsatisfactorily high agreement values In response
to these difficulties the SQUEEZES1 routine within the crystallographic program PLATONS2 was
used to subtract the contribution of the diffuse solvent from the diffraction data and this led to
an improvement in agreement values It also provided an indication of the volume of the solvent
accessible void spaces and the number of electrons in these regions On the basis of this
information as well as thermogravimetric analysis of lsquowet crystalsrsquo (see S6 Thermogravimetric
analysis) and 1H NMR (see S5 NMR spectroscopy) the number of solvent molecules (assumed to
be only DMF and EtOAc) in the unit cell was estimated Despite the uncertainties arising from the
location of solvent molecules and cations within the structure the anionic cage which is the
focus of our interest is clearly defined The formula of the crystal that was crystallographically
characterized was assigned as (NEt4)4(HNEt3)4[(PhSi)6(ctc)4]Br2(DMF)4(EtOAc)6
Crystallographic analysis of the crystals immersed in the CsBr solution revealed a similar
structure to that of the parent crystals except that a Cs+ ion was now located in each of the four
corners of the [(PhSi)6(ctc)4]6- cage Estimation of the chemical formula of the crystals was difficult
because the solvent and cations occupying the inter-cage spaces could not be identified Given
that triethylammonium is likely to be more soluble in water it was assumed for the purposes of
estimating the formula of the crystals that the incorporation of Cs+ accompanied the loss of
5
triethylammonium to the aqueous environment upon immersion in the CsBr solution In addition
it was thought that the dimethylformamide and ethyl acetate would be replaced by water in the
crystal The formula of the immersed crystals therefore was tentatively assigned as
(NEt4)4Cs4[(PhSi)6(ctc)4]Br270H2O Despite the uncertainty associated with the overall formula
the crystal structure clearly indicates Cs+ ions associating with the internal surface of the cage
The cages in both the parent and immersed crystals pack in a face centred cubic (FCC)
arrangement in which six phenyl groups from six distinct cages converge upon octahedral sites
within the FCC structure as indicated in Fig S2
The structures were solved using SHELXTS3 and refined using a full-matrix least squares
procedure based upon F2 (SHELXLS4) The solution and refinement of
(NEt4)4(HNEt3)4[(PhSi)6(ctc)4]Br2(DMF)4(EtOAc)6was performed within the WinGX system of
programsS5 whereas OLEX2S6 was employed for (NEt4)4Cs4[(PhSi)6(ctc)4]Br270H2O
Figure S1 A representation of the packing in (NEt4)4(HNEt3)4[(PhSi)6(ctc)4]Br2(DMF)4(EtOAc)6 showing only the cages located in the middle of each face of the cubic unit cell The translucent sphere corresponds to an octahedral site at the centre of the cell where the phenyl rings from six cages converge Crystallographically equivalent octahedral sites are located half-way along each edge Only one phenyl ring from each cage is depicted The cages located at the vertices of the unit cell are not shown
6
S5 NMR spectroscopy
1H NMR spectra were collected for three samples of the compound each with different post-
synthetic treatment The three samples are shown in Figures S3 and S4 The top sample (3) in
each figure corresponds to a sample that was prepared by directly transferring multiple large
single crystals directly from the mother liquor into d6DMSO The middle sample (2) corresponds
to the bulk material collected on a glass frit without suction and washed with ethyl acetate The
bottom spectrum (1) was obtained on the bulk material that was collected on a glass frit and
dried at the pump without washing with additional solvent no heating was performed
The distinct absence of the three characteristic ethyl acetate peaks (118 ppm 198 ppm and 403
ppm) in sample 3 shows that it is easily released at room temperature Aside from this difference
the three spectra have the same peak profile indicating that the bulk sample is the same as the
single crystals A small shift in some of the peaks is observable on loss of ethyl acetate in sample
1
7
1013
1619
2225
2831
3437
4043
46chem
ical shift (ppm)
1 2 3
Single crystal sample transferred to deuterated solvent directly from
mother liquor
Bulk sample w
ashed with EtO
Ac and filtered on frit but not dried
Bulk sample air dried on frit w
ithout washing
Figure S2 1H NMR 28-45 ppm for three samples of the crystals each with different post-synthetic treatment All Samples were dissolved in and referenced to d6DMSO No peaks were present below 28 ppm or between 45 and 55 ppm
8
5658
6062
6466
6870
7274
7678
8082
8486
chemical shift (ppm
)
1 2 3
Single crystal sample transferred to deuterated solvent directly from
mother liquor
Bulk sample w
ashed with EtO
Ac and filtered on frit but not dried
Bulk sample air dried on frit w
ithout washing
Figure S3 1H NMR 55 to 87 ppm for three samples of the compound each with different post-synthetic treatment All samples were dissolved in and referenced to d6DMSO No peaks were present above 87 ppm
9
S6 Thermogravimetric analysis
Thermogravimetric analysis (TGA) of two samples of the compound was performed across a
temperature range of 25-450 degC The lsquodry crystalsrsquo represented below in Figure S5 in blue were
collected on a glass frit and air was pulled through the sample for several minutes The crystals
were left for several days before TGA was performed Though there is a small initial drop in mass
as dry nitrogen was blown across the sample at 25 degC the gradient of the graph remains close to
horizontal to temperatures around 250 degC indicating that most ethyl acetate is lost at room
temperature This is confirmed also by 1H NMR of the dried crystals (see S5 Nuclear Magnetic
Resonance Spectroscopy) Some of the mass loss below 80 degC may also correspond to water
adsorbed from the atmosphere however this has not been confirmed The total mass loss up to
450 degC corresponds approximately to all solvent (DMF) and counterions leaving only the cage
remaining Stability of the cage above 450 degC has not been measured
The lsquowet crystalsrsquo were prepared for analysis by filtration on a glass frit in the absence of suction
immediately before being transferred to the TGA instrument Some solvent loss may have
occurred during sample transfer and calibration of the instrument however the steeper gradient
of this line indicates presence and subsequent loss of ethyl acetate (and possibly water) up to
approximately 250 degC The TGA data of the wet crystals combined with the NMR provide the basis
for the estimate of the chemical formula of the single crystal used for x-ray diffraction
(NEt4)4(HNEt3)4[(PhSi)6(ctc)4]Br2(DMF)4(EtOAc)6
10
Figure S4 Thermogravimetric traces of air dried crystals that were exposed to atmosphere (blue) and crystals that were collected from their mother liquor with no vacuum and transferred directly to the instrument (red)
11
S7 Powder Diffraction Patterns
The powder diffraction pattern for the parent compound (NEt4)4(HNEt3)4[(PhSi)6(ctc)4]Br2solvate (Figure S5) of the boiled crystals (Figure S6) and the crystals soaked in aqueous CsBr (Figure S7) are shown below
Figure S5 Calculated powder x-ray diffraction pattern of (NEt4)4(HNEt3)4[(PhSi)6(ctc)4]Br2solvate (blue) compared with experimental data for ground up crystals prepared via method 2 and washed with a minimum of ethyl acetate (red)
5 10 15 20 25 30 35 402Θ
Intensity
12
Figure S6 Observed powder diffraction patterns of (NEt4)4(HNEt3)4[(PhSi)6(ctc)4]Br2middotsolvate untreated (blue) and after being boiled in H2O for 30 mins (red)
Figure S7 Calculated (blue) and observed (red) powder patterns of the Si-cage crystals [(NEt4)4Cs4[(PhSi)6(ctc)4]Br2solvate] after immersion in aqueous CsBr
5 10 15 20 25 30 35 400
2000
4000
6000
8000
10000
12000
0
5
10
15
20
25
30
35
40
45
2Θ
Intensity
4 9 14 19 24 29 34 390
10
20
30
40
50
60
70
0
2
4
6
8
10
12
14
16
18
2Θ
Intensity
13
S8 ESI mass spectrometry
A Bruker Daltonics (Bremen Germany) SolariX 7 Tesla Hybrid MALDIESI-FT-ICR-MS was
used for high mass resolution analysis The instrument was operated in ESI negative and positive
ionisation modes with TD acquisition = 1M mz 200-2000 or 4M mz 5375-3000 providing mass
resolutions of 260000 and 140000 at mz 400 respectively and ESI positive ionization mode The
system was calibrated using an external calibration of ESI-TOF low concentration Tune Mix
(Agilent Technologies Santa Clara CA USA) Samples were infused at a rate of 2 microL min-1 using
the syringe pump a total of 10-20 scans were collected and averaged to generate mass spectra
The following general instrument conditions were set capillary voltage negative mode = 4200 V
and positive mode = -4000 V drying gas flow 40 L min-1 drying gas temperature 180degC
nebulizer gas flow rate 10 bar source accumulation 0001 sec ion accumulation 05 sec ion
cooling time 001 sec flight time 0001 sec Data were analysed using the Bruker Compass Data
Analysis 42 (Build 3831) software
Unless otherwise indicated the mz values given refer to the base peak of on isotopologue series
Sample preparation for ESI-MS analysis
1 (NEt4)4(HNEt3)4[(PhSi)6(ctc)4]middotsolvate (untreated crystals)
3-4 large crystals of the compound prepared via synthetic method 1 were dissolved in a
minimum of DMF (lt1 mL) followed by dilution with acetone (10 mL) prior to analysis
2 (NEt4)4(HNEt3)4[(PhSi)6(ctc)4]middotsolvate crystals that had been immersed in boiling water
2 mg of crystals of the compound prepared via synthetic method 2 were boiled in
deionized water for 30 min then solution was kept at 60degC for 7 days then filtered the
crystals dried 3-4 large crystals were dissolved in a minimum of DMSO (lt1 mL) followed
by dilution with acetonitrile (10 mL)
3 (NEt4)4(HNEt3)4[(PhSi)6(ctc)4]middotsolvate soaked in aqueous CsBr
1 mg of large crystals prepared via synthetic method 2 was immersed in an aqueous CsBr
solution (30 mg in 2 mL water) for 3 days then filtered and dried 3-4 large crystals were
dissolved in DMF (1 mL) followed by dilution with acetonitrile (10 mL)
14
Results of ESI-MS analysis
1 (NEt4)4(HNEt3)4[(PhSi)6(ctc)4]middotsolvate (untreated crystals)
Figure S6 shows the full high resolution ESI mass spectrum in negative mode
Table S1 lists the dominant isotopologues in the full spectrum The relative intensities of
the base peaks within each of the isotopologue series are indicated as their percentage
contribution to the sum of the intensities of the base peaks in each of the isotopologue series
The error (in ppm) for each species is calculated based upon the monoisotopic peak for each
isotopologue series
Figure S7 shows a portion of the spectrum in which a series of dianionic cage adducts are
indicated Figure S8 shows an enlargement of the signal corresponding to [cage + (NEt4)4]2- and a
comparison with the calculated pattern An enlargement of the signal corresponding to [cage +
(NEt4)3]3- and a comparison with the calculated pattern is displayed in Figure S9
15
Figure S6 Full ESI-mass spectrum in negative mode of samples obtained from the dissolution of (NEt4)4(HNEt3)4[(PhSi)6(ctc)4]middotsolvate crystals
656106631-
820946233-
1296490462-
1479551682-
500 1000 1500 2000 2500 mz0
1
2
3x10⁹Intensity
4
16
Table S1 Selected negative ionisation mode mass spectrum data for untreated crystals
mz (monoisotopic
peak)
mz (base peak) Charge Species Mass Error (ppm)
62607767 62807517 -1 - 49364402513 64402513 -1 - 198
65410885 65610663 -1 - 662
81093470 81160256 -3 [cage + (Et4N)2(HNEt3)]3- 212 157
82027857 82094623 -3 [cage + (Et4N)3]3- 223 109483320603 83320603 -1 - 104
88062603 88162843 -3 - 1094
94231547 94298363 -3 - 15
102022131 102221970 -1 - 109
126746585 126846409 -2 [cage + (Et4N)2(HNEt3)2]2- 199 129
128147736 128247689 -2 [cage + (Et4N)3(HNEt3)]2- -126 1108
129549110 129649046 -2 [cage + (Et4N)4]2- -272 37
131600693 131700842 -2 [cage + (Et4N)4 + MeCN]2- -074 259
133202091 133302389 -2 [cage + (Et4N)4 + DMF]2- -008 433
133239625 133391475 -2 - 141
146453513 146553452 -2 - 436
147854996 147955168 -2 - 62
158309263 158459398 -2 - 104
Figure S7 ESI-mass spectrum in negative mode of the peaks associated with [cage + (Et4N)4]2- at mz 129649046 [cage + (Et4N)3 + (Et3NH)]2- at mz 128247896 and [cage + (Et4N)2 + (Et3NH)2]2- at mz 126846409 from the dissolution of [(NEt4)4(HNEt3)4[(PhSi)6(ctc)4]middotsolvate crystals
17
Figure S8 ESI-mass spectrum in negative mode of the peaks associated with [cage + (Et4N)4]2- at mz 129649046 from the dissolution of [(NEt4)4(HNEt3)4[(PhSi)6(ctc)4]middotsolvate crystals
129549110
129599073129649046
129699036
129749030
129799091129849193
129899429
129549463
129599601129649699
129699781
129749853
129799920129849983
129900046
Calculated for [(C21H12O6)4(C6H5Si)6(C8H20N)4]2-
mz 129649699Error = -272 ppm mSigma = 170
1
2
3Intensity x109
0
1
2
3
4
1295 1296 1297 1298 1299 1300 mz
4
Intensity x109
Obtained for [(C21H12O6)4(C6H5Si)6(C8H20N)4]2-
mz 129649046
18
Figure S9 ESI-mass spectrum in negative mode of the peaks associated with [cage + (Et4N)3]3- at mz 82094623 (base peak) from the dissolution of (NEt4)4(HNEt3)4[(PhSi)6(ctc)4]middotsolvate crystals
2 (NEt4)4(HNEt3)4[(PhSi)6(ctc)4]middotsolvate crystals that had been immersed in boiling water
Figure S10 shows the full negative mode high resolution ESI mass spectrum obtained for
crystals of the compound boiled in water then dissolved in dimethylsulfoxide and diluted with
acetonitrile The dominant peak in the spectrum corresponds to [cage + (Et4N)3]3- at mz 820
82094461 Additionally there is a significant peak corresponding to [cage + (Et4N)2]4- at mz
58316930
Table S2 lists the dominant isotopologues in the full spectrum The relative intensities of
the base peaks within each of the isotopologue series are indicated as their percentage
contribution to the sum of the intensities of the base peaks in each of the isotopologue series
The error (in ppm) for each species is calculated based upon the monoisotopic peak for each
isotopologue series
82027857
8206125282094623
82127980
82161346
8219470882228104
82261505
82027674
8206109982094495
82127880
82161259
8219463582228008
82261382
Calculated for [(ctc)4(C6H5Si)6(C8H20N)3]3-
mz 82094495Error = 223 ppm
mSigma = 102
02
04
06
08
10
12
Intensity x109
00
02
04
06
08
10
12
8200 8205 8210 8215 8220 8225 8230 8235 mz
Intensity x109
Obtained for [(ctc)4(C6H5Si)6(C8H20N)3]3-
mz 82094623
19
Figure S10 Full negative mode mass spectrum of the crystals that had been boiled in water prior to being dissolved in DMSO and diluted with MeCN
583169304-
820944613-
959016973-
1335511022-
200 400 600 800 1000 1200 1400 1600 1800 mz
02
04
06
08
10
Intensity x109
20
Table S2 Selected negative ionisation mode mass spectrum data for crystals boiled in water prior to being dissolved in DMSO and diluted with MeCN
mz (monoisotopic
peak)
mz (base peak) Charge Species Mass Error
(ppm)
52588164 52513325 -4 - 114
55012908 55037984 -4 - 115
57566102 57591153 -4 [cage + (Et4N)(HNEt3)]4- 181 428
58266875 58316930 -4 [cage + (Et4N)2]4- 163 1467
64190823 64215815 -4 - 76
57538082 57563061 -4 - 45
74322912 74356421 -3 - 253
76572434 76622586 -2 - 188
81093427 81122759 -3 [cage + (Et4N)2(HNEt3)]3- 159 427
82027674 82094461 -3 [cage + (Et4N)3]3- 000 4449
94231837 94298549 -3 - 302
95834956 95901697 -3 - 703
126634775 126734243 -2 [cage +(Et4N)(HNEt3)Na2]2- + DMSO + 2MeCN + H2O -1505 006
128142767 128192988 -2 [cage + (Et4N)3(HNEt3)]2- -4004 05
129549463 129599949 -2 [cage + (Et4N)4]2- 000 077
131601536 131701879 -2 [cage + (Et4N)4 + MeCN]2- 567 083
133500905 133551102 -2 - 127 indicates assignment of species where large mass error may be attributable to overlapping peaks in the mass spectrum
21
3 Analysis of (NEt4)4(HNEt3)4[(PhSi)6(ctc)4]middotsolvate soaked in CsBr
Figure S11 shows the full negative mode high resolution ESI mass spectrum of the sample
obtained for crystals of the compound that had been immersed in an aqueous CsBr solution then
dissolved in dimethylformamide and diluted with acetonitrile Overlapping isotopic profiles of
the cage with caesium and tetraethylammonium cations reflect the similarity in the mass of Cs+
and NEt4+
Table S3 lists the dominant isotopologues in the full spectrum The relative intensities of
the base peaks within each of the isotopologue series are indicated as their percentage
contribution to the sum of the intensities of the base peaks in each of the isotopologue series
The error (in ppm) for each species is calculated based upon the monoisotopic peak for each
isotopologue series
Figure S11 Full negative mode mass spectrum of the crystals soaked in aqueous CsBr solution followed by dissolution in DMF and dilution with MeCN
583610534-
821867643-
1317395382-
200 400 600 800 1000 1200 1400 1600 1800 mz00
05
10
15
Intensity x109
22
Table S3 Selected negative ionisation mode mass spectrum data for crystals soaked in aqueous CsBr solution followed by dissolution in DMF and dilution with MeCN
mz (monoisotopic
peak)
mz (base peak) Charge Species
Mass Error (ppm)
58335201 58360465 -4 [cage + (Et4N)Cs]4- -388 11
65818834 65868071 -4 - 1
66672091 66721334 -4 - 09
80449608 80516206 -3 - 1
80981919 81048446 -3 [cage + (Et4N)CsNa + DMF]3- -062 114
82027674 82061027 -3 [cage + (Et4N)3]3- 000 34
82118882 82185240 -3 [cage + (Et4N)2Cs]3- -392 148
82210659 82243943 -3 [cage + (Et4N)Cs2]3- -090 24
84554184 84587536 -3 [cage + (Et4N)2Cs + DMF]3- -132 06
118127721 118227765 -2 - 04
124432811 124530638 -2 [cage + (Et4N)Na3 + 3DMF]2- 727 11
125479724 125577383 -2 [cage + (HNEt3)3Cs]2- -1863 04
126275663 126327346 -2 [cage + (Et4N)CsNa2 + 2DMF]2- 483 19
127847421 127944904 -2 [cage + (Et4N)3Na + DMF]2- 2980 33
127994562 128081415 -2 [cage + (Et4N)2CsNa + DMF]2- 10671 5
129131199 129230828 -2 - 17
129549463 129648253 -2 [cage + (Et4N)4]2- 000 109
129927040 130027425 -2 [cage + (Et4N)CsNa2 + 3DMF]2- -501 94
130835264 130934288 -2 [cage + (Et4N)2(HNEt3)2 + 2MeCN]2- -10488 55
131635977 131734789 -2 [cage + (Et4N)(HNEt3)2Na + 2DMF + MeCN + H2O]2- -6835 125
133342580 133441156 -2 [cage + (Et4N)3Cs + DMF]2- 2389 115
indicates assignment of species where large mass error may be attributable to overlapping peaks in the mass spectrum
23
Figure S12 Shows three overlapping isotopic profiles of [cage + (Et4N)3]3- at mz 82061027 [cage + (Et4N)2(Cs)]3- (most abundant) at mz 82185240 and [cage + (Et4N)(Cs)2]3- at mz 822
S9 Infra-red spectroscopy
Infra-red spectrum (NEt4)4(HNEt3)4[(PhSi)6(ctc)4]Br2middotsolvate (pressed KBr disc)
IR(KBr) cm-1 3431 3065 3025 2984 2918 2854 1619 1498 1384 1277 1254 1171 1119 938 890 858 738 704 672 612 521
The infra-red spectrum of (NEt4)4(HNEt3)4[(PhSi)6(ctc)4]Br2middotsolvate (pressed KBr disc) is presented in Figure S16
Infra-red spectrum of crystal after soaking in aqueous CsBr (pressed KBr disc)
IR(KBr) cm-1 3427 3065 3024 2982 2925 2860 1658 1619 1498 1384 1277 1253 1170 1117 1000 937 890 858 738 704 610 521
820276743-
820610273- 82094337
3- 82118882
821521273- 82185240
3-
822185803-
822522393-
822773243-
8205 8210 8215 8220 8225 8230 mz00
05
10
15
3-
Intensity x109
822439433-
24
4009001400190024002900340039000
01
02
03
04
05
06
07
08
09
FTIR of (NEt4)4(HNEt3)4[(PhSi)6(ctc)4]Br2middotsolvate - (KBr Disc)
Wavenumbers (cm-1 )
Tran
smis
sion
()
Figure S13 Infrared spectrum of (NEt4)4(HNEt3)4[(PhSi)6(ctc)4]Br2middotsolvate (pressed KBr disc)
25
S10 References for ESI
1 A Spek Acta Cryst Sect C 2015 71 9-18
2 A Spek Acta Cryst Sect D 2009 65 148-155
3 G Sheldrick Acta Cryst Sect A 2015 71 3-8
4 G Sheldrick Acta Cryst Sect C 2015 71 3-8
5 L Farrugia J Appl Cryst 2012 45 849-854
6 O V Dolomanov L J Bourhis RJ Gildea J A K Howard and H Puschmann J Appl Cryst 2009 42 339-341
3
Initiator microwave reactor The solution was heated to 100degC with stirring and held at this
temperature for 15 minutes then allowed to cool to room temperature 2 mL of the reaction
mixture was decanted into a vial and exposed to EtOAc vapour for several days over which time
large yellow crystals (typical dimensions between 05 and 10 mm) suitable for x-ray diffraction
grew on the surface of the vial A single crystal was taken from the mother liquor and placed
directly into protective oil Single crystal X-ray diffraction data was collected using a SuperNova
diffractometer fitted with a CuKα X-ray source The X-ray data revealed the crystals to be face
centered cubic with the adoption of the space group F-43m a = 279568(6) Aring
In order to improve the yield reduce solvent usage and reduce crystallization time of the
compound the synthetic procedure was modified and the resultant crystalline product used for
all further characterization experiments The method described above is hereafter designated
method 1 and the modified method detailed below is method 2
Method 2
Cyclotricatechylene (192 mg 052 mmol) was placed in a 2-5 mL microwave vial and
dissolved in DMF (4 mL) NEt4Br (66 mg 031 mmol) was then added to the ctcH6 solution
followed by SiPh(OEt)3 (030 mL) and excess NEt3 (ca 16 drops) The solution was sparged with
N2 for 2 minutes then sealed and placed in a Biotage Initiator microwave reactor The solution
was heated to 120degC with stirring and held at this temperature for 30 minutes then allowed to
cool to room temperature The reaction mixture was distributed into 5 vials in equal aliquots
before exposure to EtOAc vapour to induce crystallisation Each aliquot contained 105 x 10-5 mol
of the limiting reagent ctcH6
The crystals formed from method 2 were shown to be the same as those obtained by
method 1 by comparison of the powder x-ray diffraction pattern of the product from method 2
with the simulated pattern produced from the crystal structure determination obtained on a
crystal produced by method 1 (Figure S5) Crystals from one aliquot were collected via vacuum
filtration and dried in a stream of air These were used for elemental and infrared analyses
Elemental analysis was performed at Campbell Microanalytical Laboratory Chemistry
Department Te Tari Hua Ruānuku University of Otago Analysis (air dried sample prepared via
4
method 2) (NEt4)4(HNEt3)4[(PhSi)6(ctc)4]Br2(DMF)(H2O)19 Calc C 601 H 75 N 35 Found
C 601 H 69 N 33
Crystals from a second aliquot were collected on a glass frit and washed with minimum
EtOAc to measure the yield and 13C (not shown) and 1H NMR spectra of the compound The
percentage yield is based on the best approximation of the chemical formula of vacuum dried
crystals (NEt4)4(HNEt3)4[(PhSi)6(ctc)4]Br24DMF (from which all the EtOAc has been removed and
have not been exposed to atmospheric water vapour for an extended period of time) as
estimated by integration of the 1H NMR spectrum of the dried crystals (see figure S8) The yield
was 465 mg 51
S4 Further crystallographic details
In the crystal structure investigated initial refinements involved attempts to assign numerous
small peaks of electron density in the difference Fourier maps to atoms of disordered cations and
solvent molecules This approach resulted in unsatisfactorily high agreement values In response
to these difficulties the SQUEEZES1 routine within the crystallographic program PLATONS2 was
used to subtract the contribution of the diffuse solvent from the diffraction data and this led to
an improvement in agreement values It also provided an indication of the volume of the solvent
accessible void spaces and the number of electrons in these regions On the basis of this
information as well as thermogravimetric analysis of lsquowet crystalsrsquo (see S6 Thermogravimetric
analysis) and 1H NMR (see S5 NMR spectroscopy) the number of solvent molecules (assumed to
be only DMF and EtOAc) in the unit cell was estimated Despite the uncertainties arising from the
location of solvent molecules and cations within the structure the anionic cage which is the
focus of our interest is clearly defined The formula of the crystal that was crystallographically
characterized was assigned as (NEt4)4(HNEt3)4[(PhSi)6(ctc)4]Br2(DMF)4(EtOAc)6
Crystallographic analysis of the crystals immersed in the CsBr solution revealed a similar
structure to that of the parent crystals except that a Cs+ ion was now located in each of the four
corners of the [(PhSi)6(ctc)4]6- cage Estimation of the chemical formula of the crystals was difficult
because the solvent and cations occupying the inter-cage spaces could not be identified Given
that triethylammonium is likely to be more soluble in water it was assumed for the purposes of
estimating the formula of the crystals that the incorporation of Cs+ accompanied the loss of
5
triethylammonium to the aqueous environment upon immersion in the CsBr solution In addition
it was thought that the dimethylformamide and ethyl acetate would be replaced by water in the
crystal The formula of the immersed crystals therefore was tentatively assigned as
(NEt4)4Cs4[(PhSi)6(ctc)4]Br270H2O Despite the uncertainty associated with the overall formula
the crystal structure clearly indicates Cs+ ions associating with the internal surface of the cage
The cages in both the parent and immersed crystals pack in a face centred cubic (FCC)
arrangement in which six phenyl groups from six distinct cages converge upon octahedral sites
within the FCC structure as indicated in Fig S2
The structures were solved using SHELXTS3 and refined using a full-matrix least squares
procedure based upon F2 (SHELXLS4) The solution and refinement of
(NEt4)4(HNEt3)4[(PhSi)6(ctc)4]Br2(DMF)4(EtOAc)6was performed within the WinGX system of
programsS5 whereas OLEX2S6 was employed for (NEt4)4Cs4[(PhSi)6(ctc)4]Br270H2O
Figure S1 A representation of the packing in (NEt4)4(HNEt3)4[(PhSi)6(ctc)4]Br2(DMF)4(EtOAc)6 showing only the cages located in the middle of each face of the cubic unit cell The translucent sphere corresponds to an octahedral site at the centre of the cell where the phenyl rings from six cages converge Crystallographically equivalent octahedral sites are located half-way along each edge Only one phenyl ring from each cage is depicted The cages located at the vertices of the unit cell are not shown
6
S5 NMR spectroscopy
1H NMR spectra were collected for three samples of the compound each with different post-
synthetic treatment The three samples are shown in Figures S3 and S4 The top sample (3) in
each figure corresponds to a sample that was prepared by directly transferring multiple large
single crystals directly from the mother liquor into d6DMSO The middle sample (2) corresponds
to the bulk material collected on a glass frit without suction and washed with ethyl acetate The
bottom spectrum (1) was obtained on the bulk material that was collected on a glass frit and
dried at the pump without washing with additional solvent no heating was performed
The distinct absence of the three characteristic ethyl acetate peaks (118 ppm 198 ppm and 403
ppm) in sample 3 shows that it is easily released at room temperature Aside from this difference
the three spectra have the same peak profile indicating that the bulk sample is the same as the
single crystals A small shift in some of the peaks is observable on loss of ethyl acetate in sample
1
7
1013
1619
2225
2831
3437
4043
46chem
ical shift (ppm)
1 2 3
Single crystal sample transferred to deuterated solvent directly from
mother liquor
Bulk sample w
ashed with EtO
Ac and filtered on frit but not dried
Bulk sample air dried on frit w
ithout washing
Figure S2 1H NMR 28-45 ppm for three samples of the crystals each with different post-synthetic treatment All Samples were dissolved in and referenced to d6DMSO No peaks were present below 28 ppm or between 45 and 55 ppm
8
5658
6062
6466
6870
7274
7678
8082
8486
chemical shift (ppm
)
1 2 3
Single crystal sample transferred to deuterated solvent directly from
mother liquor
Bulk sample w
ashed with EtO
Ac and filtered on frit but not dried
Bulk sample air dried on frit w
ithout washing
Figure S3 1H NMR 55 to 87 ppm for three samples of the compound each with different post-synthetic treatment All samples were dissolved in and referenced to d6DMSO No peaks were present above 87 ppm
9
S6 Thermogravimetric analysis
Thermogravimetric analysis (TGA) of two samples of the compound was performed across a
temperature range of 25-450 degC The lsquodry crystalsrsquo represented below in Figure S5 in blue were
collected on a glass frit and air was pulled through the sample for several minutes The crystals
were left for several days before TGA was performed Though there is a small initial drop in mass
as dry nitrogen was blown across the sample at 25 degC the gradient of the graph remains close to
horizontal to temperatures around 250 degC indicating that most ethyl acetate is lost at room
temperature This is confirmed also by 1H NMR of the dried crystals (see S5 Nuclear Magnetic
Resonance Spectroscopy) Some of the mass loss below 80 degC may also correspond to water
adsorbed from the atmosphere however this has not been confirmed The total mass loss up to
450 degC corresponds approximately to all solvent (DMF) and counterions leaving only the cage
remaining Stability of the cage above 450 degC has not been measured
The lsquowet crystalsrsquo were prepared for analysis by filtration on a glass frit in the absence of suction
immediately before being transferred to the TGA instrument Some solvent loss may have
occurred during sample transfer and calibration of the instrument however the steeper gradient
of this line indicates presence and subsequent loss of ethyl acetate (and possibly water) up to
approximately 250 degC The TGA data of the wet crystals combined with the NMR provide the basis
for the estimate of the chemical formula of the single crystal used for x-ray diffraction
(NEt4)4(HNEt3)4[(PhSi)6(ctc)4]Br2(DMF)4(EtOAc)6
10
Figure S4 Thermogravimetric traces of air dried crystals that were exposed to atmosphere (blue) and crystals that were collected from their mother liquor with no vacuum and transferred directly to the instrument (red)
11
S7 Powder Diffraction Patterns
The powder diffraction pattern for the parent compound (NEt4)4(HNEt3)4[(PhSi)6(ctc)4]Br2solvate (Figure S5) of the boiled crystals (Figure S6) and the crystals soaked in aqueous CsBr (Figure S7) are shown below
Figure S5 Calculated powder x-ray diffraction pattern of (NEt4)4(HNEt3)4[(PhSi)6(ctc)4]Br2solvate (blue) compared with experimental data for ground up crystals prepared via method 2 and washed with a minimum of ethyl acetate (red)
5 10 15 20 25 30 35 402Θ
Intensity
12
Figure S6 Observed powder diffraction patterns of (NEt4)4(HNEt3)4[(PhSi)6(ctc)4]Br2middotsolvate untreated (blue) and after being boiled in H2O for 30 mins (red)
Figure S7 Calculated (blue) and observed (red) powder patterns of the Si-cage crystals [(NEt4)4Cs4[(PhSi)6(ctc)4]Br2solvate] after immersion in aqueous CsBr
5 10 15 20 25 30 35 400
2000
4000
6000
8000
10000
12000
0
5
10
15
20
25
30
35
40
45
2Θ
Intensity
4 9 14 19 24 29 34 390
10
20
30
40
50
60
70
0
2
4
6
8
10
12
14
16
18
2Θ
Intensity
13
S8 ESI mass spectrometry
A Bruker Daltonics (Bremen Germany) SolariX 7 Tesla Hybrid MALDIESI-FT-ICR-MS was
used for high mass resolution analysis The instrument was operated in ESI negative and positive
ionisation modes with TD acquisition = 1M mz 200-2000 or 4M mz 5375-3000 providing mass
resolutions of 260000 and 140000 at mz 400 respectively and ESI positive ionization mode The
system was calibrated using an external calibration of ESI-TOF low concentration Tune Mix
(Agilent Technologies Santa Clara CA USA) Samples were infused at a rate of 2 microL min-1 using
the syringe pump a total of 10-20 scans were collected and averaged to generate mass spectra
The following general instrument conditions were set capillary voltage negative mode = 4200 V
and positive mode = -4000 V drying gas flow 40 L min-1 drying gas temperature 180degC
nebulizer gas flow rate 10 bar source accumulation 0001 sec ion accumulation 05 sec ion
cooling time 001 sec flight time 0001 sec Data were analysed using the Bruker Compass Data
Analysis 42 (Build 3831) software
Unless otherwise indicated the mz values given refer to the base peak of on isotopologue series
Sample preparation for ESI-MS analysis
1 (NEt4)4(HNEt3)4[(PhSi)6(ctc)4]middotsolvate (untreated crystals)
3-4 large crystals of the compound prepared via synthetic method 1 were dissolved in a
minimum of DMF (lt1 mL) followed by dilution with acetone (10 mL) prior to analysis
2 (NEt4)4(HNEt3)4[(PhSi)6(ctc)4]middotsolvate crystals that had been immersed in boiling water
2 mg of crystals of the compound prepared via synthetic method 2 were boiled in
deionized water for 30 min then solution was kept at 60degC for 7 days then filtered the
crystals dried 3-4 large crystals were dissolved in a minimum of DMSO (lt1 mL) followed
by dilution with acetonitrile (10 mL)
3 (NEt4)4(HNEt3)4[(PhSi)6(ctc)4]middotsolvate soaked in aqueous CsBr
1 mg of large crystals prepared via synthetic method 2 was immersed in an aqueous CsBr
solution (30 mg in 2 mL water) for 3 days then filtered and dried 3-4 large crystals were
dissolved in DMF (1 mL) followed by dilution with acetonitrile (10 mL)
14
Results of ESI-MS analysis
1 (NEt4)4(HNEt3)4[(PhSi)6(ctc)4]middotsolvate (untreated crystals)
Figure S6 shows the full high resolution ESI mass spectrum in negative mode
Table S1 lists the dominant isotopologues in the full spectrum The relative intensities of
the base peaks within each of the isotopologue series are indicated as their percentage
contribution to the sum of the intensities of the base peaks in each of the isotopologue series
The error (in ppm) for each species is calculated based upon the monoisotopic peak for each
isotopologue series
Figure S7 shows a portion of the spectrum in which a series of dianionic cage adducts are
indicated Figure S8 shows an enlargement of the signal corresponding to [cage + (NEt4)4]2- and a
comparison with the calculated pattern An enlargement of the signal corresponding to [cage +
(NEt4)3]3- and a comparison with the calculated pattern is displayed in Figure S9
15
Figure S6 Full ESI-mass spectrum in negative mode of samples obtained from the dissolution of (NEt4)4(HNEt3)4[(PhSi)6(ctc)4]middotsolvate crystals
656106631-
820946233-
1296490462-
1479551682-
500 1000 1500 2000 2500 mz0
1
2
3x10⁹Intensity
4
16
Table S1 Selected negative ionisation mode mass spectrum data for untreated crystals
mz (monoisotopic
peak)
mz (base peak) Charge Species Mass Error (ppm)
62607767 62807517 -1 - 49364402513 64402513 -1 - 198
65410885 65610663 -1 - 662
81093470 81160256 -3 [cage + (Et4N)2(HNEt3)]3- 212 157
82027857 82094623 -3 [cage + (Et4N)3]3- 223 109483320603 83320603 -1 - 104
88062603 88162843 -3 - 1094
94231547 94298363 -3 - 15
102022131 102221970 -1 - 109
126746585 126846409 -2 [cage + (Et4N)2(HNEt3)2]2- 199 129
128147736 128247689 -2 [cage + (Et4N)3(HNEt3)]2- -126 1108
129549110 129649046 -2 [cage + (Et4N)4]2- -272 37
131600693 131700842 -2 [cage + (Et4N)4 + MeCN]2- -074 259
133202091 133302389 -2 [cage + (Et4N)4 + DMF]2- -008 433
133239625 133391475 -2 - 141
146453513 146553452 -2 - 436
147854996 147955168 -2 - 62
158309263 158459398 -2 - 104
Figure S7 ESI-mass spectrum in negative mode of the peaks associated with [cage + (Et4N)4]2- at mz 129649046 [cage + (Et4N)3 + (Et3NH)]2- at mz 128247896 and [cage + (Et4N)2 + (Et3NH)2]2- at mz 126846409 from the dissolution of [(NEt4)4(HNEt3)4[(PhSi)6(ctc)4]middotsolvate crystals
17
Figure S8 ESI-mass spectrum in negative mode of the peaks associated with [cage + (Et4N)4]2- at mz 129649046 from the dissolution of [(NEt4)4(HNEt3)4[(PhSi)6(ctc)4]middotsolvate crystals
129549110
129599073129649046
129699036
129749030
129799091129849193
129899429
129549463
129599601129649699
129699781
129749853
129799920129849983
129900046
Calculated for [(C21H12O6)4(C6H5Si)6(C8H20N)4]2-
mz 129649699Error = -272 ppm mSigma = 170
1
2
3Intensity x109
0
1
2
3
4
1295 1296 1297 1298 1299 1300 mz
4
Intensity x109
Obtained for [(C21H12O6)4(C6H5Si)6(C8H20N)4]2-
mz 129649046
18
Figure S9 ESI-mass spectrum in negative mode of the peaks associated with [cage + (Et4N)3]3- at mz 82094623 (base peak) from the dissolution of (NEt4)4(HNEt3)4[(PhSi)6(ctc)4]middotsolvate crystals
2 (NEt4)4(HNEt3)4[(PhSi)6(ctc)4]middotsolvate crystals that had been immersed in boiling water
Figure S10 shows the full negative mode high resolution ESI mass spectrum obtained for
crystals of the compound boiled in water then dissolved in dimethylsulfoxide and diluted with
acetonitrile The dominant peak in the spectrum corresponds to [cage + (Et4N)3]3- at mz 820
82094461 Additionally there is a significant peak corresponding to [cage + (Et4N)2]4- at mz
58316930
Table S2 lists the dominant isotopologues in the full spectrum The relative intensities of
the base peaks within each of the isotopologue series are indicated as their percentage
contribution to the sum of the intensities of the base peaks in each of the isotopologue series
The error (in ppm) for each species is calculated based upon the monoisotopic peak for each
isotopologue series
82027857
8206125282094623
82127980
82161346
8219470882228104
82261505
82027674
8206109982094495
82127880
82161259
8219463582228008
82261382
Calculated for [(ctc)4(C6H5Si)6(C8H20N)3]3-
mz 82094495Error = 223 ppm
mSigma = 102
02
04
06
08
10
12
Intensity x109
00
02
04
06
08
10
12
8200 8205 8210 8215 8220 8225 8230 8235 mz
Intensity x109
Obtained for [(ctc)4(C6H5Si)6(C8H20N)3]3-
mz 82094623
19
Figure S10 Full negative mode mass spectrum of the crystals that had been boiled in water prior to being dissolved in DMSO and diluted with MeCN
583169304-
820944613-
959016973-
1335511022-
200 400 600 800 1000 1200 1400 1600 1800 mz
02
04
06
08
10
Intensity x109
20
Table S2 Selected negative ionisation mode mass spectrum data for crystals boiled in water prior to being dissolved in DMSO and diluted with MeCN
mz (monoisotopic
peak)
mz (base peak) Charge Species Mass Error
(ppm)
52588164 52513325 -4 - 114
55012908 55037984 -4 - 115
57566102 57591153 -4 [cage + (Et4N)(HNEt3)]4- 181 428
58266875 58316930 -4 [cage + (Et4N)2]4- 163 1467
64190823 64215815 -4 - 76
57538082 57563061 -4 - 45
74322912 74356421 -3 - 253
76572434 76622586 -2 - 188
81093427 81122759 -3 [cage + (Et4N)2(HNEt3)]3- 159 427
82027674 82094461 -3 [cage + (Et4N)3]3- 000 4449
94231837 94298549 -3 - 302
95834956 95901697 -3 - 703
126634775 126734243 -2 [cage +(Et4N)(HNEt3)Na2]2- + DMSO + 2MeCN + H2O -1505 006
128142767 128192988 -2 [cage + (Et4N)3(HNEt3)]2- -4004 05
129549463 129599949 -2 [cage + (Et4N)4]2- 000 077
131601536 131701879 -2 [cage + (Et4N)4 + MeCN]2- 567 083
133500905 133551102 -2 - 127 indicates assignment of species where large mass error may be attributable to overlapping peaks in the mass spectrum
21
3 Analysis of (NEt4)4(HNEt3)4[(PhSi)6(ctc)4]middotsolvate soaked in CsBr
Figure S11 shows the full negative mode high resolution ESI mass spectrum of the sample
obtained for crystals of the compound that had been immersed in an aqueous CsBr solution then
dissolved in dimethylformamide and diluted with acetonitrile Overlapping isotopic profiles of
the cage with caesium and tetraethylammonium cations reflect the similarity in the mass of Cs+
and NEt4+
Table S3 lists the dominant isotopologues in the full spectrum The relative intensities of
the base peaks within each of the isotopologue series are indicated as their percentage
contribution to the sum of the intensities of the base peaks in each of the isotopologue series
The error (in ppm) for each species is calculated based upon the monoisotopic peak for each
isotopologue series
Figure S11 Full negative mode mass spectrum of the crystals soaked in aqueous CsBr solution followed by dissolution in DMF and dilution with MeCN
583610534-
821867643-
1317395382-
200 400 600 800 1000 1200 1400 1600 1800 mz00
05
10
15
Intensity x109
22
Table S3 Selected negative ionisation mode mass spectrum data for crystals soaked in aqueous CsBr solution followed by dissolution in DMF and dilution with MeCN
mz (monoisotopic
peak)
mz (base peak) Charge Species
Mass Error (ppm)
58335201 58360465 -4 [cage + (Et4N)Cs]4- -388 11
65818834 65868071 -4 - 1
66672091 66721334 -4 - 09
80449608 80516206 -3 - 1
80981919 81048446 -3 [cage + (Et4N)CsNa + DMF]3- -062 114
82027674 82061027 -3 [cage + (Et4N)3]3- 000 34
82118882 82185240 -3 [cage + (Et4N)2Cs]3- -392 148
82210659 82243943 -3 [cage + (Et4N)Cs2]3- -090 24
84554184 84587536 -3 [cage + (Et4N)2Cs + DMF]3- -132 06
118127721 118227765 -2 - 04
124432811 124530638 -2 [cage + (Et4N)Na3 + 3DMF]2- 727 11
125479724 125577383 -2 [cage + (HNEt3)3Cs]2- -1863 04
126275663 126327346 -2 [cage + (Et4N)CsNa2 + 2DMF]2- 483 19
127847421 127944904 -2 [cage + (Et4N)3Na + DMF]2- 2980 33
127994562 128081415 -2 [cage + (Et4N)2CsNa + DMF]2- 10671 5
129131199 129230828 -2 - 17
129549463 129648253 -2 [cage + (Et4N)4]2- 000 109
129927040 130027425 -2 [cage + (Et4N)CsNa2 + 3DMF]2- -501 94
130835264 130934288 -2 [cage + (Et4N)2(HNEt3)2 + 2MeCN]2- -10488 55
131635977 131734789 -2 [cage + (Et4N)(HNEt3)2Na + 2DMF + MeCN + H2O]2- -6835 125
133342580 133441156 -2 [cage + (Et4N)3Cs + DMF]2- 2389 115
indicates assignment of species where large mass error may be attributable to overlapping peaks in the mass spectrum
23
Figure S12 Shows three overlapping isotopic profiles of [cage + (Et4N)3]3- at mz 82061027 [cage + (Et4N)2(Cs)]3- (most abundant) at mz 82185240 and [cage + (Et4N)(Cs)2]3- at mz 822
S9 Infra-red spectroscopy
Infra-red spectrum (NEt4)4(HNEt3)4[(PhSi)6(ctc)4]Br2middotsolvate (pressed KBr disc)
IR(KBr) cm-1 3431 3065 3025 2984 2918 2854 1619 1498 1384 1277 1254 1171 1119 938 890 858 738 704 672 612 521
The infra-red spectrum of (NEt4)4(HNEt3)4[(PhSi)6(ctc)4]Br2middotsolvate (pressed KBr disc) is presented in Figure S16
Infra-red spectrum of crystal after soaking in aqueous CsBr (pressed KBr disc)
IR(KBr) cm-1 3427 3065 3024 2982 2925 2860 1658 1619 1498 1384 1277 1253 1170 1117 1000 937 890 858 738 704 610 521
820276743-
820610273- 82094337
3- 82118882
821521273- 82185240
3-
822185803-
822522393-
822773243-
8205 8210 8215 8220 8225 8230 mz00
05
10
15
3-
Intensity x109
822439433-
24
4009001400190024002900340039000
01
02
03
04
05
06
07
08
09
FTIR of (NEt4)4(HNEt3)4[(PhSi)6(ctc)4]Br2middotsolvate - (KBr Disc)
Wavenumbers (cm-1 )
Tran
smis
sion
()
Figure S13 Infrared spectrum of (NEt4)4(HNEt3)4[(PhSi)6(ctc)4]Br2middotsolvate (pressed KBr disc)
25
S10 References for ESI
1 A Spek Acta Cryst Sect C 2015 71 9-18
2 A Spek Acta Cryst Sect D 2009 65 148-155
3 G Sheldrick Acta Cryst Sect A 2015 71 3-8
4 G Sheldrick Acta Cryst Sect C 2015 71 3-8
5 L Farrugia J Appl Cryst 2012 45 849-854
6 O V Dolomanov L J Bourhis RJ Gildea J A K Howard and H Puschmann J Appl Cryst 2009 42 339-341
4
method 2) (NEt4)4(HNEt3)4[(PhSi)6(ctc)4]Br2(DMF)(H2O)19 Calc C 601 H 75 N 35 Found
C 601 H 69 N 33
Crystals from a second aliquot were collected on a glass frit and washed with minimum
EtOAc to measure the yield and 13C (not shown) and 1H NMR spectra of the compound The
percentage yield is based on the best approximation of the chemical formula of vacuum dried
crystals (NEt4)4(HNEt3)4[(PhSi)6(ctc)4]Br24DMF (from which all the EtOAc has been removed and
have not been exposed to atmospheric water vapour for an extended period of time) as
estimated by integration of the 1H NMR spectrum of the dried crystals (see figure S8) The yield
was 465 mg 51
S4 Further crystallographic details
In the crystal structure investigated initial refinements involved attempts to assign numerous
small peaks of electron density in the difference Fourier maps to atoms of disordered cations and
solvent molecules This approach resulted in unsatisfactorily high agreement values In response
to these difficulties the SQUEEZES1 routine within the crystallographic program PLATONS2 was
used to subtract the contribution of the diffuse solvent from the diffraction data and this led to
an improvement in agreement values It also provided an indication of the volume of the solvent
accessible void spaces and the number of electrons in these regions On the basis of this
information as well as thermogravimetric analysis of lsquowet crystalsrsquo (see S6 Thermogravimetric
analysis) and 1H NMR (see S5 NMR spectroscopy) the number of solvent molecules (assumed to
be only DMF and EtOAc) in the unit cell was estimated Despite the uncertainties arising from the
location of solvent molecules and cations within the structure the anionic cage which is the
focus of our interest is clearly defined The formula of the crystal that was crystallographically
characterized was assigned as (NEt4)4(HNEt3)4[(PhSi)6(ctc)4]Br2(DMF)4(EtOAc)6
Crystallographic analysis of the crystals immersed in the CsBr solution revealed a similar
structure to that of the parent crystals except that a Cs+ ion was now located in each of the four
corners of the [(PhSi)6(ctc)4]6- cage Estimation of the chemical formula of the crystals was difficult
because the solvent and cations occupying the inter-cage spaces could not be identified Given
that triethylammonium is likely to be more soluble in water it was assumed for the purposes of
estimating the formula of the crystals that the incorporation of Cs+ accompanied the loss of
5
triethylammonium to the aqueous environment upon immersion in the CsBr solution In addition
it was thought that the dimethylformamide and ethyl acetate would be replaced by water in the
crystal The formula of the immersed crystals therefore was tentatively assigned as
(NEt4)4Cs4[(PhSi)6(ctc)4]Br270H2O Despite the uncertainty associated with the overall formula
the crystal structure clearly indicates Cs+ ions associating with the internal surface of the cage
The cages in both the parent and immersed crystals pack in a face centred cubic (FCC)
arrangement in which six phenyl groups from six distinct cages converge upon octahedral sites
within the FCC structure as indicated in Fig S2
The structures were solved using SHELXTS3 and refined using a full-matrix least squares
procedure based upon F2 (SHELXLS4) The solution and refinement of
(NEt4)4(HNEt3)4[(PhSi)6(ctc)4]Br2(DMF)4(EtOAc)6was performed within the WinGX system of
programsS5 whereas OLEX2S6 was employed for (NEt4)4Cs4[(PhSi)6(ctc)4]Br270H2O
Figure S1 A representation of the packing in (NEt4)4(HNEt3)4[(PhSi)6(ctc)4]Br2(DMF)4(EtOAc)6 showing only the cages located in the middle of each face of the cubic unit cell The translucent sphere corresponds to an octahedral site at the centre of the cell where the phenyl rings from six cages converge Crystallographically equivalent octahedral sites are located half-way along each edge Only one phenyl ring from each cage is depicted The cages located at the vertices of the unit cell are not shown
6
S5 NMR spectroscopy
1H NMR spectra were collected for three samples of the compound each with different post-
synthetic treatment The three samples are shown in Figures S3 and S4 The top sample (3) in
each figure corresponds to a sample that was prepared by directly transferring multiple large
single crystals directly from the mother liquor into d6DMSO The middle sample (2) corresponds
to the bulk material collected on a glass frit without suction and washed with ethyl acetate The
bottom spectrum (1) was obtained on the bulk material that was collected on a glass frit and
dried at the pump without washing with additional solvent no heating was performed
The distinct absence of the three characteristic ethyl acetate peaks (118 ppm 198 ppm and 403
ppm) in sample 3 shows that it is easily released at room temperature Aside from this difference
the three spectra have the same peak profile indicating that the bulk sample is the same as the
single crystals A small shift in some of the peaks is observable on loss of ethyl acetate in sample
1
7
1013
1619
2225
2831
3437
4043
46chem
ical shift (ppm)
1 2 3
Single crystal sample transferred to deuterated solvent directly from
mother liquor
Bulk sample w
ashed with EtO
Ac and filtered on frit but not dried
Bulk sample air dried on frit w
ithout washing
Figure S2 1H NMR 28-45 ppm for three samples of the crystals each with different post-synthetic treatment All Samples were dissolved in and referenced to d6DMSO No peaks were present below 28 ppm or between 45 and 55 ppm
8
5658
6062
6466
6870
7274
7678
8082
8486
chemical shift (ppm
)
1 2 3
Single crystal sample transferred to deuterated solvent directly from
mother liquor
Bulk sample w
ashed with EtO
Ac and filtered on frit but not dried
Bulk sample air dried on frit w
ithout washing
Figure S3 1H NMR 55 to 87 ppm for three samples of the compound each with different post-synthetic treatment All samples were dissolved in and referenced to d6DMSO No peaks were present above 87 ppm
9
S6 Thermogravimetric analysis
Thermogravimetric analysis (TGA) of two samples of the compound was performed across a
temperature range of 25-450 degC The lsquodry crystalsrsquo represented below in Figure S5 in blue were
collected on a glass frit and air was pulled through the sample for several minutes The crystals
were left for several days before TGA was performed Though there is a small initial drop in mass
as dry nitrogen was blown across the sample at 25 degC the gradient of the graph remains close to
horizontal to temperatures around 250 degC indicating that most ethyl acetate is lost at room
temperature This is confirmed also by 1H NMR of the dried crystals (see S5 Nuclear Magnetic
Resonance Spectroscopy) Some of the mass loss below 80 degC may also correspond to water
adsorbed from the atmosphere however this has not been confirmed The total mass loss up to
450 degC corresponds approximately to all solvent (DMF) and counterions leaving only the cage
remaining Stability of the cage above 450 degC has not been measured
The lsquowet crystalsrsquo were prepared for analysis by filtration on a glass frit in the absence of suction
immediately before being transferred to the TGA instrument Some solvent loss may have
occurred during sample transfer and calibration of the instrument however the steeper gradient
of this line indicates presence and subsequent loss of ethyl acetate (and possibly water) up to
approximately 250 degC The TGA data of the wet crystals combined with the NMR provide the basis
for the estimate of the chemical formula of the single crystal used for x-ray diffraction
(NEt4)4(HNEt3)4[(PhSi)6(ctc)4]Br2(DMF)4(EtOAc)6
10
Figure S4 Thermogravimetric traces of air dried crystals that were exposed to atmosphere (blue) and crystals that were collected from their mother liquor with no vacuum and transferred directly to the instrument (red)
11
S7 Powder Diffraction Patterns
The powder diffraction pattern for the parent compound (NEt4)4(HNEt3)4[(PhSi)6(ctc)4]Br2solvate (Figure S5) of the boiled crystals (Figure S6) and the crystals soaked in aqueous CsBr (Figure S7) are shown below
Figure S5 Calculated powder x-ray diffraction pattern of (NEt4)4(HNEt3)4[(PhSi)6(ctc)4]Br2solvate (blue) compared with experimental data for ground up crystals prepared via method 2 and washed with a minimum of ethyl acetate (red)
5 10 15 20 25 30 35 402Θ
Intensity
12
Figure S6 Observed powder diffraction patterns of (NEt4)4(HNEt3)4[(PhSi)6(ctc)4]Br2middotsolvate untreated (blue) and after being boiled in H2O for 30 mins (red)
Figure S7 Calculated (blue) and observed (red) powder patterns of the Si-cage crystals [(NEt4)4Cs4[(PhSi)6(ctc)4]Br2solvate] after immersion in aqueous CsBr
5 10 15 20 25 30 35 400
2000
4000
6000
8000
10000
12000
0
5
10
15
20
25
30
35
40
45
2Θ
Intensity
4 9 14 19 24 29 34 390
10
20
30
40
50
60
70
0
2
4
6
8
10
12
14
16
18
2Θ
Intensity
13
S8 ESI mass spectrometry
A Bruker Daltonics (Bremen Germany) SolariX 7 Tesla Hybrid MALDIESI-FT-ICR-MS was
used for high mass resolution analysis The instrument was operated in ESI negative and positive
ionisation modes with TD acquisition = 1M mz 200-2000 or 4M mz 5375-3000 providing mass
resolutions of 260000 and 140000 at mz 400 respectively and ESI positive ionization mode The
system was calibrated using an external calibration of ESI-TOF low concentration Tune Mix
(Agilent Technologies Santa Clara CA USA) Samples were infused at a rate of 2 microL min-1 using
the syringe pump a total of 10-20 scans were collected and averaged to generate mass spectra
The following general instrument conditions were set capillary voltage negative mode = 4200 V
and positive mode = -4000 V drying gas flow 40 L min-1 drying gas temperature 180degC
nebulizer gas flow rate 10 bar source accumulation 0001 sec ion accumulation 05 sec ion
cooling time 001 sec flight time 0001 sec Data were analysed using the Bruker Compass Data
Analysis 42 (Build 3831) software
Unless otherwise indicated the mz values given refer to the base peak of on isotopologue series
Sample preparation for ESI-MS analysis
1 (NEt4)4(HNEt3)4[(PhSi)6(ctc)4]middotsolvate (untreated crystals)
3-4 large crystals of the compound prepared via synthetic method 1 were dissolved in a
minimum of DMF (lt1 mL) followed by dilution with acetone (10 mL) prior to analysis
2 (NEt4)4(HNEt3)4[(PhSi)6(ctc)4]middotsolvate crystals that had been immersed in boiling water
2 mg of crystals of the compound prepared via synthetic method 2 were boiled in
deionized water for 30 min then solution was kept at 60degC for 7 days then filtered the
crystals dried 3-4 large crystals were dissolved in a minimum of DMSO (lt1 mL) followed
by dilution with acetonitrile (10 mL)
3 (NEt4)4(HNEt3)4[(PhSi)6(ctc)4]middotsolvate soaked in aqueous CsBr
1 mg of large crystals prepared via synthetic method 2 was immersed in an aqueous CsBr
solution (30 mg in 2 mL water) for 3 days then filtered and dried 3-4 large crystals were
dissolved in DMF (1 mL) followed by dilution with acetonitrile (10 mL)
14
Results of ESI-MS analysis
1 (NEt4)4(HNEt3)4[(PhSi)6(ctc)4]middotsolvate (untreated crystals)
Figure S6 shows the full high resolution ESI mass spectrum in negative mode
Table S1 lists the dominant isotopologues in the full spectrum The relative intensities of
the base peaks within each of the isotopologue series are indicated as their percentage
contribution to the sum of the intensities of the base peaks in each of the isotopologue series
The error (in ppm) for each species is calculated based upon the monoisotopic peak for each
isotopologue series
Figure S7 shows a portion of the spectrum in which a series of dianionic cage adducts are
indicated Figure S8 shows an enlargement of the signal corresponding to [cage + (NEt4)4]2- and a
comparison with the calculated pattern An enlargement of the signal corresponding to [cage +
(NEt4)3]3- and a comparison with the calculated pattern is displayed in Figure S9
15
Figure S6 Full ESI-mass spectrum in negative mode of samples obtained from the dissolution of (NEt4)4(HNEt3)4[(PhSi)6(ctc)4]middotsolvate crystals
656106631-
820946233-
1296490462-
1479551682-
500 1000 1500 2000 2500 mz0
1
2
3x10⁹Intensity
4
16
Table S1 Selected negative ionisation mode mass spectrum data for untreated crystals
mz (monoisotopic
peak)
mz (base peak) Charge Species Mass Error (ppm)
62607767 62807517 -1 - 49364402513 64402513 -1 - 198
65410885 65610663 -1 - 662
81093470 81160256 -3 [cage + (Et4N)2(HNEt3)]3- 212 157
82027857 82094623 -3 [cage + (Et4N)3]3- 223 109483320603 83320603 -1 - 104
88062603 88162843 -3 - 1094
94231547 94298363 -3 - 15
102022131 102221970 -1 - 109
126746585 126846409 -2 [cage + (Et4N)2(HNEt3)2]2- 199 129
128147736 128247689 -2 [cage + (Et4N)3(HNEt3)]2- -126 1108
129549110 129649046 -2 [cage + (Et4N)4]2- -272 37
131600693 131700842 -2 [cage + (Et4N)4 + MeCN]2- -074 259
133202091 133302389 -2 [cage + (Et4N)4 + DMF]2- -008 433
133239625 133391475 -2 - 141
146453513 146553452 -2 - 436
147854996 147955168 -2 - 62
158309263 158459398 -2 - 104
Figure S7 ESI-mass spectrum in negative mode of the peaks associated with [cage + (Et4N)4]2- at mz 129649046 [cage + (Et4N)3 + (Et3NH)]2- at mz 128247896 and [cage + (Et4N)2 + (Et3NH)2]2- at mz 126846409 from the dissolution of [(NEt4)4(HNEt3)4[(PhSi)6(ctc)4]middotsolvate crystals
17
Figure S8 ESI-mass spectrum in negative mode of the peaks associated with [cage + (Et4N)4]2- at mz 129649046 from the dissolution of [(NEt4)4(HNEt3)4[(PhSi)6(ctc)4]middotsolvate crystals
129549110
129599073129649046
129699036
129749030
129799091129849193
129899429
129549463
129599601129649699
129699781
129749853
129799920129849983
129900046
Calculated for [(C21H12O6)4(C6H5Si)6(C8H20N)4]2-
mz 129649699Error = -272 ppm mSigma = 170
1
2
3Intensity x109
0
1
2
3
4
1295 1296 1297 1298 1299 1300 mz
4
Intensity x109
Obtained for [(C21H12O6)4(C6H5Si)6(C8H20N)4]2-
mz 129649046
18
Figure S9 ESI-mass spectrum in negative mode of the peaks associated with [cage + (Et4N)3]3- at mz 82094623 (base peak) from the dissolution of (NEt4)4(HNEt3)4[(PhSi)6(ctc)4]middotsolvate crystals
2 (NEt4)4(HNEt3)4[(PhSi)6(ctc)4]middotsolvate crystals that had been immersed in boiling water
Figure S10 shows the full negative mode high resolution ESI mass spectrum obtained for
crystals of the compound boiled in water then dissolved in dimethylsulfoxide and diluted with
acetonitrile The dominant peak in the spectrum corresponds to [cage + (Et4N)3]3- at mz 820
82094461 Additionally there is a significant peak corresponding to [cage + (Et4N)2]4- at mz
58316930
Table S2 lists the dominant isotopologues in the full spectrum The relative intensities of
the base peaks within each of the isotopologue series are indicated as their percentage
contribution to the sum of the intensities of the base peaks in each of the isotopologue series
The error (in ppm) for each species is calculated based upon the monoisotopic peak for each
isotopologue series
82027857
8206125282094623
82127980
82161346
8219470882228104
82261505
82027674
8206109982094495
82127880
82161259
8219463582228008
82261382
Calculated for [(ctc)4(C6H5Si)6(C8H20N)3]3-
mz 82094495Error = 223 ppm
mSigma = 102
02
04
06
08
10
12
Intensity x109
00
02
04
06
08
10
12
8200 8205 8210 8215 8220 8225 8230 8235 mz
Intensity x109
Obtained for [(ctc)4(C6H5Si)6(C8H20N)3]3-
mz 82094623
19
Figure S10 Full negative mode mass spectrum of the crystals that had been boiled in water prior to being dissolved in DMSO and diluted with MeCN
583169304-
820944613-
959016973-
1335511022-
200 400 600 800 1000 1200 1400 1600 1800 mz
02
04
06
08
10
Intensity x109
20
Table S2 Selected negative ionisation mode mass spectrum data for crystals boiled in water prior to being dissolved in DMSO and diluted with MeCN
mz (monoisotopic
peak)
mz (base peak) Charge Species Mass Error
(ppm)
52588164 52513325 -4 - 114
55012908 55037984 -4 - 115
57566102 57591153 -4 [cage + (Et4N)(HNEt3)]4- 181 428
58266875 58316930 -4 [cage + (Et4N)2]4- 163 1467
64190823 64215815 -4 - 76
57538082 57563061 -4 - 45
74322912 74356421 -3 - 253
76572434 76622586 -2 - 188
81093427 81122759 -3 [cage + (Et4N)2(HNEt3)]3- 159 427
82027674 82094461 -3 [cage + (Et4N)3]3- 000 4449
94231837 94298549 -3 - 302
95834956 95901697 -3 - 703
126634775 126734243 -2 [cage +(Et4N)(HNEt3)Na2]2- + DMSO + 2MeCN + H2O -1505 006
128142767 128192988 -2 [cage + (Et4N)3(HNEt3)]2- -4004 05
129549463 129599949 -2 [cage + (Et4N)4]2- 000 077
131601536 131701879 -2 [cage + (Et4N)4 + MeCN]2- 567 083
133500905 133551102 -2 - 127 indicates assignment of species where large mass error may be attributable to overlapping peaks in the mass spectrum
21
3 Analysis of (NEt4)4(HNEt3)4[(PhSi)6(ctc)4]middotsolvate soaked in CsBr
Figure S11 shows the full negative mode high resolution ESI mass spectrum of the sample
obtained for crystals of the compound that had been immersed in an aqueous CsBr solution then
dissolved in dimethylformamide and diluted with acetonitrile Overlapping isotopic profiles of
the cage with caesium and tetraethylammonium cations reflect the similarity in the mass of Cs+
and NEt4+
Table S3 lists the dominant isotopologues in the full spectrum The relative intensities of
the base peaks within each of the isotopologue series are indicated as their percentage
contribution to the sum of the intensities of the base peaks in each of the isotopologue series
The error (in ppm) for each species is calculated based upon the monoisotopic peak for each
isotopologue series
Figure S11 Full negative mode mass spectrum of the crystals soaked in aqueous CsBr solution followed by dissolution in DMF and dilution with MeCN
583610534-
821867643-
1317395382-
200 400 600 800 1000 1200 1400 1600 1800 mz00
05
10
15
Intensity x109
22
Table S3 Selected negative ionisation mode mass spectrum data for crystals soaked in aqueous CsBr solution followed by dissolution in DMF and dilution with MeCN
mz (monoisotopic
peak)
mz (base peak) Charge Species
Mass Error (ppm)
58335201 58360465 -4 [cage + (Et4N)Cs]4- -388 11
65818834 65868071 -4 - 1
66672091 66721334 -4 - 09
80449608 80516206 -3 - 1
80981919 81048446 -3 [cage + (Et4N)CsNa + DMF]3- -062 114
82027674 82061027 -3 [cage + (Et4N)3]3- 000 34
82118882 82185240 -3 [cage + (Et4N)2Cs]3- -392 148
82210659 82243943 -3 [cage + (Et4N)Cs2]3- -090 24
84554184 84587536 -3 [cage + (Et4N)2Cs + DMF]3- -132 06
118127721 118227765 -2 - 04
124432811 124530638 -2 [cage + (Et4N)Na3 + 3DMF]2- 727 11
125479724 125577383 -2 [cage + (HNEt3)3Cs]2- -1863 04
126275663 126327346 -2 [cage + (Et4N)CsNa2 + 2DMF]2- 483 19
127847421 127944904 -2 [cage + (Et4N)3Na + DMF]2- 2980 33
127994562 128081415 -2 [cage + (Et4N)2CsNa + DMF]2- 10671 5
129131199 129230828 -2 - 17
129549463 129648253 -2 [cage + (Et4N)4]2- 000 109
129927040 130027425 -2 [cage + (Et4N)CsNa2 + 3DMF]2- -501 94
130835264 130934288 -2 [cage + (Et4N)2(HNEt3)2 + 2MeCN]2- -10488 55
131635977 131734789 -2 [cage + (Et4N)(HNEt3)2Na + 2DMF + MeCN + H2O]2- -6835 125
133342580 133441156 -2 [cage + (Et4N)3Cs + DMF]2- 2389 115
indicates assignment of species where large mass error may be attributable to overlapping peaks in the mass spectrum
23
Figure S12 Shows three overlapping isotopic profiles of [cage + (Et4N)3]3- at mz 82061027 [cage + (Et4N)2(Cs)]3- (most abundant) at mz 82185240 and [cage + (Et4N)(Cs)2]3- at mz 822
S9 Infra-red spectroscopy
Infra-red spectrum (NEt4)4(HNEt3)4[(PhSi)6(ctc)4]Br2middotsolvate (pressed KBr disc)
IR(KBr) cm-1 3431 3065 3025 2984 2918 2854 1619 1498 1384 1277 1254 1171 1119 938 890 858 738 704 672 612 521
The infra-red spectrum of (NEt4)4(HNEt3)4[(PhSi)6(ctc)4]Br2middotsolvate (pressed KBr disc) is presented in Figure S16
Infra-red spectrum of crystal after soaking in aqueous CsBr (pressed KBr disc)
IR(KBr) cm-1 3427 3065 3024 2982 2925 2860 1658 1619 1498 1384 1277 1253 1170 1117 1000 937 890 858 738 704 610 521
820276743-
820610273- 82094337
3- 82118882
821521273- 82185240
3-
822185803-
822522393-
822773243-
8205 8210 8215 8220 8225 8230 mz00
05
10
15
3-
Intensity x109
822439433-
24
4009001400190024002900340039000
01
02
03
04
05
06
07
08
09
FTIR of (NEt4)4(HNEt3)4[(PhSi)6(ctc)4]Br2middotsolvate - (KBr Disc)
Wavenumbers (cm-1 )
Tran
smis
sion
()
Figure S13 Infrared spectrum of (NEt4)4(HNEt3)4[(PhSi)6(ctc)4]Br2middotsolvate (pressed KBr disc)
25
S10 References for ESI
1 A Spek Acta Cryst Sect C 2015 71 9-18
2 A Spek Acta Cryst Sect D 2009 65 148-155
3 G Sheldrick Acta Cryst Sect A 2015 71 3-8
4 G Sheldrick Acta Cryst Sect C 2015 71 3-8
5 L Farrugia J Appl Cryst 2012 45 849-854
6 O V Dolomanov L J Bourhis RJ Gildea J A K Howard and H Puschmann J Appl Cryst 2009 42 339-341
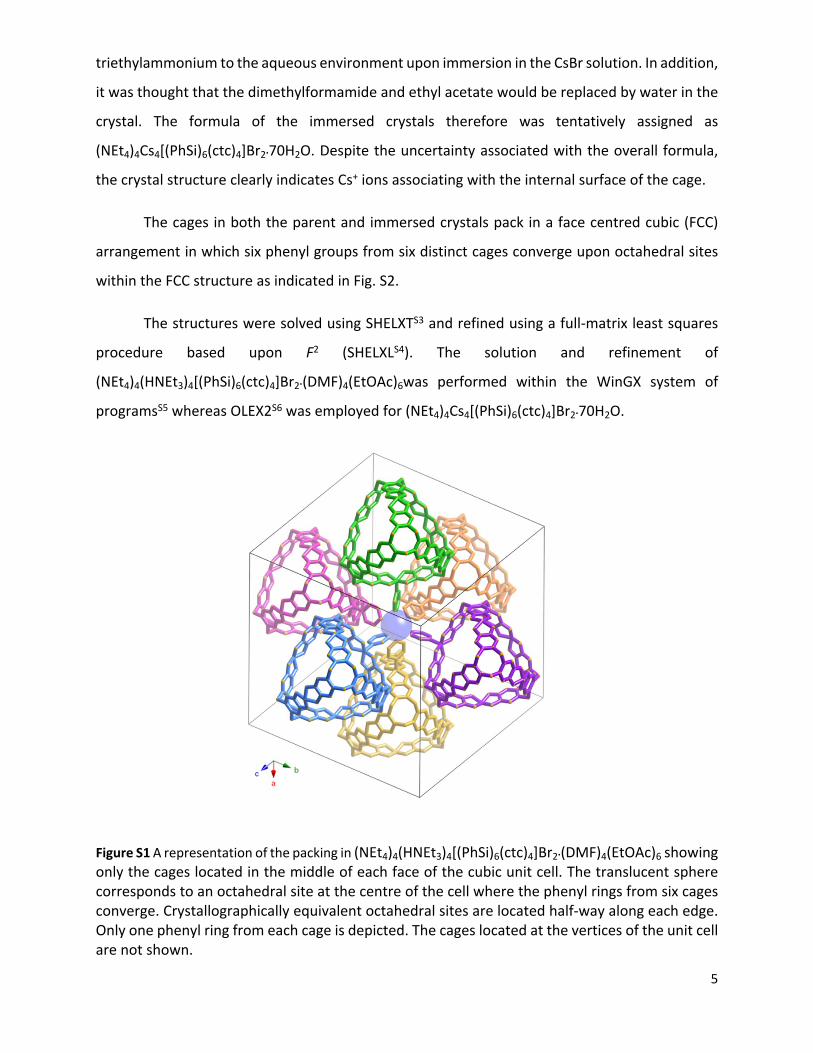
5
triethylammonium to the aqueous environment upon immersion in the CsBr solution In addition
it was thought that the dimethylformamide and ethyl acetate would be replaced by water in the
crystal The formula of the immersed crystals therefore was tentatively assigned as
(NEt4)4Cs4[(PhSi)6(ctc)4]Br270H2O Despite the uncertainty associated with the overall formula
the crystal structure clearly indicates Cs+ ions associating with the internal surface of the cage
The cages in both the parent and immersed crystals pack in a face centred cubic (FCC)
arrangement in which six phenyl groups from six distinct cages converge upon octahedral sites
within the FCC structure as indicated in Fig S2
The structures were solved using SHELXTS3 and refined using a full-matrix least squares
procedure based upon F2 (SHELXLS4) The solution and refinement of
(NEt4)4(HNEt3)4[(PhSi)6(ctc)4]Br2(DMF)4(EtOAc)6was performed within the WinGX system of
programsS5 whereas OLEX2S6 was employed for (NEt4)4Cs4[(PhSi)6(ctc)4]Br270H2O
Figure S1 A representation of the packing in (NEt4)4(HNEt3)4[(PhSi)6(ctc)4]Br2(DMF)4(EtOAc)6 showing only the cages located in the middle of each face of the cubic unit cell The translucent sphere corresponds to an octahedral site at the centre of the cell where the phenyl rings from six cages converge Crystallographically equivalent octahedral sites are located half-way along each edge Only one phenyl ring from each cage is depicted The cages located at the vertices of the unit cell are not shown
6
S5 NMR spectroscopy
1H NMR spectra were collected for three samples of the compound each with different post-
synthetic treatment The three samples are shown in Figures S3 and S4 The top sample (3) in
each figure corresponds to a sample that was prepared by directly transferring multiple large
single crystals directly from the mother liquor into d6DMSO The middle sample (2) corresponds
to the bulk material collected on a glass frit without suction and washed with ethyl acetate The
bottom spectrum (1) was obtained on the bulk material that was collected on a glass frit and
dried at the pump without washing with additional solvent no heating was performed
The distinct absence of the three characteristic ethyl acetate peaks (118 ppm 198 ppm and 403
ppm) in sample 3 shows that it is easily released at room temperature Aside from this difference
the three spectra have the same peak profile indicating that the bulk sample is the same as the
single crystals A small shift in some of the peaks is observable on loss of ethyl acetate in sample
1
7
1013
1619
2225
2831
3437
4043
46chem
ical shift (ppm)
1 2 3
Single crystal sample transferred to deuterated solvent directly from
mother liquor
Bulk sample w
ashed with EtO
Ac and filtered on frit but not dried
Bulk sample air dried on frit w
ithout washing
Figure S2 1H NMR 28-45 ppm for three samples of the crystals each with different post-synthetic treatment All Samples were dissolved in and referenced to d6DMSO No peaks were present below 28 ppm or between 45 and 55 ppm
8
5658
6062
6466
6870
7274
7678
8082
8486
chemical shift (ppm
)
1 2 3
Single crystal sample transferred to deuterated solvent directly from
mother liquor
Bulk sample w
ashed with EtO
Ac and filtered on frit but not dried
Bulk sample air dried on frit w
ithout washing
Figure S3 1H NMR 55 to 87 ppm for three samples of the compound each with different post-synthetic treatment All samples were dissolved in and referenced to d6DMSO No peaks were present above 87 ppm
9
S6 Thermogravimetric analysis
Thermogravimetric analysis (TGA) of two samples of the compound was performed across a
temperature range of 25-450 degC The lsquodry crystalsrsquo represented below in Figure S5 in blue were
collected on a glass frit and air was pulled through the sample for several minutes The crystals
were left for several days before TGA was performed Though there is a small initial drop in mass
as dry nitrogen was blown across the sample at 25 degC the gradient of the graph remains close to
horizontal to temperatures around 250 degC indicating that most ethyl acetate is lost at room
temperature This is confirmed also by 1H NMR of the dried crystals (see S5 Nuclear Magnetic
Resonance Spectroscopy) Some of the mass loss below 80 degC may also correspond to water
adsorbed from the atmosphere however this has not been confirmed The total mass loss up to
450 degC corresponds approximately to all solvent (DMF) and counterions leaving only the cage
remaining Stability of the cage above 450 degC has not been measured
The lsquowet crystalsrsquo were prepared for analysis by filtration on a glass frit in the absence of suction
immediately before being transferred to the TGA instrument Some solvent loss may have
occurred during sample transfer and calibration of the instrument however the steeper gradient
of this line indicates presence and subsequent loss of ethyl acetate (and possibly water) up to
approximately 250 degC The TGA data of the wet crystals combined with the NMR provide the basis
for the estimate of the chemical formula of the single crystal used for x-ray diffraction
(NEt4)4(HNEt3)4[(PhSi)6(ctc)4]Br2(DMF)4(EtOAc)6
10
Figure S4 Thermogravimetric traces of air dried crystals that were exposed to atmosphere (blue) and crystals that were collected from their mother liquor with no vacuum and transferred directly to the instrument (red)
11
S7 Powder Diffraction Patterns
The powder diffraction pattern for the parent compound (NEt4)4(HNEt3)4[(PhSi)6(ctc)4]Br2solvate (Figure S5) of the boiled crystals (Figure S6) and the crystals soaked in aqueous CsBr (Figure S7) are shown below
Figure S5 Calculated powder x-ray diffraction pattern of (NEt4)4(HNEt3)4[(PhSi)6(ctc)4]Br2solvate (blue) compared with experimental data for ground up crystals prepared via method 2 and washed with a minimum of ethyl acetate (red)
5 10 15 20 25 30 35 402Θ
Intensity
12
Figure S6 Observed powder diffraction patterns of (NEt4)4(HNEt3)4[(PhSi)6(ctc)4]Br2middotsolvate untreated (blue) and after being boiled in H2O for 30 mins (red)
Figure S7 Calculated (blue) and observed (red) powder patterns of the Si-cage crystals [(NEt4)4Cs4[(PhSi)6(ctc)4]Br2solvate] after immersion in aqueous CsBr
5 10 15 20 25 30 35 400
2000
4000
6000
8000
10000
12000
0
5
10
15
20
25
30
35
40
45
2Θ
Intensity
4 9 14 19 24 29 34 390
10
20
30
40
50
60
70
0
2
4
6
8
10
12
14
16
18
2Θ
Intensity
13
S8 ESI mass spectrometry
A Bruker Daltonics (Bremen Germany) SolariX 7 Tesla Hybrid MALDIESI-FT-ICR-MS was
used for high mass resolution analysis The instrument was operated in ESI negative and positive
ionisation modes with TD acquisition = 1M mz 200-2000 or 4M mz 5375-3000 providing mass
resolutions of 260000 and 140000 at mz 400 respectively and ESI positive ionization mode The
system was calibrated using an external calibration of ESI-TOF low concentration Tune Mix
(Agilent Technologies Santa Clara CA USA) Samples were infused at a rate of 2 microL min-1 using
the syringe pump a total of 10-20 scans were collected and averaged to generate mass spectra
The following general instrument conditions were set capillary voltage negative mode = 4200 V
and positive mode = -4000 V drying gas flow 40 L min-1 drying gas temperature 180degC
nebulizer gas flow rate 10 bar source accumulation 0001 sec ion accumulation 05 sec ion
cooling time 001 sec flight time 0001 sec Data were analysed using the Bruker Compass Data
Analysis 42 (Build 3831) software
Unless otherwise indicated the mz values given refer to the base peak of on isotopologue series
Sample preparation for ESI-MS analysis
1 (NEt4)4(HNEt3)4[(PhSi)6(ctc)4]middotsolvate (untreated crystals)
3-4 large crystals of the compound prepared via synthetic method 1 were dissolved in a
minimum of DMF (lt1 mL) followed by dilution with acetone (10 mL) prior to analysis
2 (NEt4)4(HNEt3)4[(PhSi)6(ctc)4]middotsolvate crystals that had been immersed in boiling water
2 mg of crystals of the compound prepared via synthetic method 2 were boiled in
deionized water for 30 min then solution was kept at 60degC for 7 days then filtered the
crystals dried 3-4 large crystals were dissolved in a minimum of DMSO (lt1 mL) followed
by dilution with acetonitrile (10 mL)
3 (NEt4)4(HNEt3)4[(PhSi)6(ctc)4]middotsolvate soaked in aqueous CsBr
1 mg of large crystals prepared via synthetic method 2 was immersed in an aqueous CsBr
solution (30 mg in 2 mL water) for 3 days then filtered and dried 3-4 large crystals were
dissolved in DMF (1 mL) followed by dilution with acetonitrile (10 mL)
14
Results of ESI-MS analysis
1 (NEt4)4(HNEt3)4[(PhSi)6(ctc)4]middotsolvate (untreated crystals)
Figure S6 shows the full high resolution ESI mass spectrum in negative mode
Table S1 lists the dominant isotopologues in the full spectrum The relative intensities of
the base peaks within each of the isotopologue series are indicated as their percentage
contribution to the sum of the intensities of the base peaks in each of the isotopologue series
The error (in ppm) for each species is calculated based upon the monoisotopic peak for each
isotopologue series
Figure S7 shows a portion of the spectrum in which a series of dianionic cage adducts are
indicated Figure S8 shows an enlargement of the signal corresponding to [cage + (NEt4)4]2- and a
comparison with the calculated pattern An enlargement of the signal corresponding to [cage +
(NEt4)3]3- and a comparison with the calculated pattern is displayed in Figure S9
15
Figure S6 Full ESI-mass spectrum in negative mode of samples obtained from the dissolution of (NEt4)4(HNEt3)4[(PhSi)6(ctc)4]middotsolvate crystals
656106631-
820946233-
1296490462-
1479551682-
500 1000 1500 2000 2500 mz0
1
2
3x10⁹Intensity
4
16
Table S1 Selected negative ionisation mode mass spectrum data for untreated crystals
mz (monoisotopic
peak)
mz (base peak) Charge Species Mass Error (ppm)
62607767 62807517 -1 - 49364402513 64402513 -1 - 198
65410885 65610663 -1 - 662
81093470 81160256 -3 [cage + (Et4N)2(HNEt3)]3- 212 157
82027857 82094623 -3 [cage + (Et4N)3]3- 223 109483320603 83320603 -1 - 104
88062603 88162843 -3 - 1094
94231547 94298363 -3 - 15
102022131 102221970 -1 - 109
126746585 126846409 -2 [cage + (Et4N)2(HNEt3)2]2- 199 129
128147736 128247689 -2 [cage + (Et4N)3(HNEt3)]2- -126 1108
129549110 129649046 -2 [cage + (Et4N)4]2- -272 37
131600693 131700842 -2 [cage + (Et4N)4 + MeCN]2- -074 259
133202091 133302389 -2 [cage + (Et4N)4 + DMF]2- -008 433
133239625 133391475 -2 - 141
146453513 146553452 -2 - 436
147854996 147955168 -2 - 62
158309263 158459398 -2 - 104
Figure S7 ESI-mass spectrum in negative mode of the peaks associated with [cage + (Et4N)4]2- at mz 129649046 [cage + (Et4N)3 + (Et3NH)]2- at mz 128247896 and [cage + (Et4N)2 + (Et3NH)2]2- at mz 126846409 from the dissolution of [(NEt4)4(HNEt3)4[(PhSi)6(ctc)4]middotsolvate crystals
17
Figure S8 ESI-mass spectrum in negative mode of the peaks associated with [cage + (Et4N)4]2- at mz 129649046 from the dissolution of [(NEt4)4(HNEt3)4[(PhSi)6(ctc)4]middotsolvate crystals
129549110
129599073129649046
129699036
129749030
129799091129849193
129899429
129549463
129599601129649699
129699781
129749853
129799920129849983
129900046
Calculated for [(C21H12O6)4(C6H5Si)6(C8H20N)4]2-
mz 129649699Error = -272 ppm mSigma = 170
1
2
3Intensity x109
0
1
2
3
4
1295 1296 1297 1298 1299 1300 mz
4
Intensity x109
Obtained for [(C21H12O6)4(C6H5Si)6(C8H20N)4]2-
mz 129649046
18
Figure S9 ESI-mass spectrum in negative mode of the peaks associated with [cage + (Et4N)3]3- at mz 82094623 (base peak) from the dissolution of (NEt4)4(HNEt3)4[(PhSi)6(ctc)4]middotsolvate crystals
2 (NEt4)4(HNEt3)4[(PhSi)6(ctc)4]middotsolvate crystals that had been immersed in boiling water
Figure S10 shows the full negative mode high resolution ESI mass spectrum obtained for
crystals of the compound boiled in water then dissolved in dimethylsulfoxide and diluted with
acetonitrile The dominant peak in the spectrum corresponds to [cage + (Et4N)3]3- at mz 820
82094461 Additionally there is a significant peak corresponding to [cage + (Et4N)2]4- at mz
58316930
Table S2 lists the dominant isotopologues in the full spectrum The relative intensities of
the base peaks within each of the isotopologue series are indicated as their percentage
contribution to the sum of the intensities of the base peaks in each of the isotopologue series
The error (in ppm) for each species is calculated based upon the monoisotopic peak for each
isotopologue series
82027857
8206125282094623
82127980
82161346
8219470882228104
82261505
82027674
8206109982094495
82127880
82161259
8219463582228008
82261382
Calculated for [(ctc)4(C6H5Si)6(C8H20N)3]3-
mz 82094495Error = 223 ppm
mSigma = 102
02
04
06
08
10
12
Intensity x109
00
02
04
06
08
10
12
8200 8205 8210 8215 8220 8225 8230 8235 mz
Intensity x109
Obtained for [(ctc)4(C6H5Si)6(C8H20N)3]3-
mz 82094623
19
Figure S10 Full negative mode mass spectrum of the crystals that had been boiled in water prior to being dissolved in DMSO and diluted with MeCN
583169304-
820944613-
959016973-
1335511022-
200 400 600 800 1000 1200 1400 1600 1800 mz
02
04
06
08
10
Intensity x109
20
Table S2 Selected negative ionisation mode mass spectrum data for crystals boiled in water prior to being dissolved in DMSO and diluted with MeCN
mz (monoisotopic
peak)
mz (base peak) Charge Species Mass Error
(ppm)
52588164 52513325 -4 - 114
55012908 55037984 -4 - 115
57566102 57591153 -4 [cage + (Et4N)(HNEt3)]4- 181 428
58266875 58316930 -4 [cage + (Et4N)2]4- 163 1467
64190823 64215815 -4 - 76
57538082 57563061 -4 - 45
74322912 74356421 -3 - 253
76572434 76622586 -2 - 188
81093427 81122759 -3 [cage + (Et4N)2(HNEt3)]3- 159 427
82027674 82094461 -3 [cage + (Et4N)3]3- 000 4449
94231837 94298549 -3 - 302
95834956 95901697 -3 - 703
126634775 126734243 -2 [cage +(Et4N)(HNEt3)Na2]2- + DMSO + 2MeCN + H2O -1505 006
128142767 128192988 -2 [cage + (Et4N)3(HNEt3)]2- -4004 05
129549463 129599949 -2 [cage + (Et4N)4]2- 000 077
131601536 131701879 -2 [cage + (Et4N)4 + MeCN]2- 567 083
133500905 133551102 -2 - 127 indicates assignment of species where large mass error may be attributable to overlapping peaks in the mass spectrum
21
3 Analysis of (NEt4)4(HNEt3)4[(PhSi)6(ctc)4]middotsolvate soaked in CsBr
Figure S11 shows the full negative mode high resolution ESI mass spectrum of the sample
obtained for crystals of the compound that had been immersed in an aqueous CsBr solution then
dissolved in dimethylformamide and diluted with acetonitrile Overlapping isotopic profiles of
the cage with caesium and tetraethylammonium cations reflect the similarity in the mass of Cs+
and NEt4+
Table S3 lists the dominant isotopologues in the full spectrum The relative intensities of
the base peaks within each of the isotopologue series are indicated as their percentage
contribution to the sum of the intensities of the base peaks in each of the isotopologue series
The error (in ppm) for each species is calculated based upon the monoisotopic peak for each
isotopologue series
Figure S11 Full negative mode mass spectrum of the crystals soaked in aqueous CsBr solution followed by dissolution in DMF and dilution with MeCN
583610534-
821867643-
1317395382-
200 400 600 800 1000 1200 1400 1600 1800 mz00
05
10
15
Intensity x109
22
Table S3 Selected negative ionisation mode mass spectrum data for crystals soaked in aqueous CsBr solution followed by dissolution in DMF and dilution with MeCN
mz (monoisotopic
peak)
mz (base peak) Charge Species
Mass Error (ppm)
58335201 58360465 -4 [cage + (Et4N)Cs]4- -388 11
65818834 65868071 -4 - 1
66672091 66721334 -4 - 09
80449608 80516206 -3 - 1
80981919 81048446 -3 [cage + (Et4N)CsNa + DMF]3- -062 114
82027674 82061027 -3 [cage + (Et4N)3]3- 000 34
82118882 82185240 -3 [cage + (Et4N)2Cs]3- -392 148
82210659 82243943 -3 [cage + (Et4N)Cs2]3- -090 24
84554184 84587536 -3 [cage + (Et4N)2Cs + DMF]3- -132 06
118127721 118227765 -2 - 04
124432811 124530638 -2 [cage + (Et4N)Na3 + 3DMF]2- 727 11
125479724 125577383 -2 [cage + (HNEt3)3Cs]2- -1863 04
126275663 126327346 -2 [cage + (Et4N)CsNa2 + 2DMF]2- 483 19
127847421 127944904 -2 [cage + (Et4N)3Na + DMF]2- 2980 33
127994562 128081415 -2 [cage + (Et4N)2CsNa + DMF]2- 10671 5
129131199 129230828 -2 - 17
129549463 129648253 -2 [cage + (Et4N)4]2- 000 109
129927040 130027425 -2 [cage + (Et4N)CsNa2 + 3DMF]2- -501 94
130835264 130934288 -2 [cage + (Et4N)2(HNEt3)2 + 2MeCN]2- -10488 55
131635977 131734789 -2 [cage + (Et4N)(HNEt3)2Na + 2DMF + MeCN + H2O]2- -6835 125
133342580 133441156 -2 [cage + (Et4N)3Cs + DMF]2- 2389 115
indicates assignment of species where large mass error may be attributable to overlapping peaks in the mass spectrum
23
Figure S12 Shows three overlapping isotopic profiles of [cage + (Et4N)3]3- at mz 82061027 [cage + (Et4N)2(Cs)]3- (most abundant) at mz 82185240 and [cage + (Et4N)(Cs)2]3- at mz 822
S9 Infra-red spectroscopy
Infra-red spectrum (NEt4)4(HNEt3)4[(PhSi)6(ctc)4]Br2middotsolvate (pressed KBr disc)
IR(KBr) cm-1 3431 3065 3025 2984 2918 2854 1619 1498 1384 1277 1254 1171 1119 938 890 858 738 704 672 612 521
The infra-red spectrum of (NEt4)4(HNEt3)4[(PhSi)6(ctc)4]Br2middotsolvate (pressed KBr disc) is presented in Figure S16
Infra-red spectrum of crystal after soaking in aqueous CsBr (pressed KBr disc)
IR(KBr) cm-1 3427 3065 3024 2982 2925 2860 1658 1619 1498 1384 1277 1253 1170 1117 1000 937 890 858 738 704 610 521
820276743-
820610273- 82094337
3- 82118882
821521273- 82185240
3-
822185803-
822522393-
822773243-
8205 8210 8215 8220 8225 8230 mz00
05
10
15
3-
Intensity x109
822439433-
24
4009001400190024002900340039000
01
02
03
04
05
06
07
08
09
FTIR of (NEt4)4(HNEt3)4[(PhSi)6(ctc)4]Br2middotsolvate - (KBr Disc)
Wavenumbers (cm-1 )
Tran
smis
sion
()
Figure S13 Infrared spectrum of (NEt4)4(HNEt3)4[(PhSi)6(ctc)4]Br2middotsolvate (pressed KBr disc)
25
S10 References for ESI
1 A Spek Acta Cryst Sect C 2015 71 9-18
2 A Spek Acta Cryst Sect D 2009 65 148-155
3 G Sheldrick Acta Cryst Sect A 2015 71 3-8
4 G Sheldrick Acta Cryst Sect C 2015 71 3-8
5 L Farrugia J Appl Cryst 2012 45 849-854
6 O V Dolomanov L J Bourhis RJ Gildea J A K Howard and H Puschmann J Appl Cryst 2009 42 339-341
6
S5 NMR spectroscopy
1H NMR spectra were collected for three samples of the compound each with different post-
synthetic treatment The three samples are shown in Figures S3 and S4 The top sample (3) in
each figure corresponds to a sample that was prepared by directly transferring multiple large
single crystals directly from the mother liquor into d6DMSO The middle sample (2) corresponds
to the bulk material collected on a glass frit without suction and washed with ethyl acetate The
bottom spectrum (1) was obtained on the bulk material that was collected on a glass frit and
dried at the pump without washing with additional solvent no heating was performed
The distinct absence of the three characteristic ethyl acetate peaks (118 ppm 198 ppm and 403
ppm) in sample 3 shows that it is easily released at room temperature Aside from this difference
the three spectra have the same peak profile indicating that the bulk sample is the same as the
single crystals A small shift in some of the peaks is observable on loss of ethyl acetate in sample
1
7
1013
1619
2225
2831
3437
4043
46chem
ical shift (ppm)
1 2 3
Single crystal sample transferred to deuterated solvent directly from
mother liquor
Bulk sample w
ashed with EtO
Ac and filtered on frit but not dried
Bulk sample air dried on frit w
ithout washing
Figure S2 1H NMR 28-45 ppm for three samples of the crystals each with different post-synthetic treatment All Samples were dissolved in and referenced to d6DMSO No peaks were present below 28 ppm or between 45 and 55 ppm
8
5658
6062
6466
6870
7274
7678
8082
8486
chemical shift (ppm
)
1 2 3
Single crystal sample transferred to deuterated solvent directly from
mother liquor
Bulk sample w
ashed with EtO
Ac and filtered on frit but not dried
Bulk sample air dried on frit w
ithout washing
Figure S3 1H NMR 55 to 87 ppm for three samples of the compound each with different post-synthetic treatment All samples were dissolved in and referenced to d6DMSO No peaks were present above 87 ppm
9
S6 Thermogravimetric analysis
Thermogravimetric analysis (TGA) of two samples of the compound was performed across a
temperature range of 25-450 degC The lsquodry crystalsrsquo represented below in Figure S5 in blue were
collected on a glass frit and air was pulled through the sample for several minutes The crystals
were left for several days before TGA was performed Though there is a small initial drop in mass
as dry nitrogen was blown across the sample at 25 degC the gradient of the graph remains close to
horizontal to temperatures around 250 degC indicating that most ethyl acetate is lost at room
temperature This is confirmed also by 1H NMR of the dried crystals (see S5 Nuclear Magnetic
Resonance Spectroscopy) Some of the mass loss below 80 degC may also correspond to water
adsorbed from the atmosphere however this has not been confirmed The total mass loss up to
450 degC corresponds approximately to all solvent (DMF) and counterions leaving only the cage
remaining Stability of the cage above 450 degC has not been measured
The lsquowet crystalsrsquo were prepared for analysis by filtration on a glass frit in the absence of suction
immediately before being transferred to the TGA instrument Some solvent loss may have
occurred during sample transfer and calibration of the instrument however the steeper gradient
of this line indicates presence and subsequent loss of ethyl acetate (and possibly water) up to
approximately 250 degC The TGA data of the wet crystals combined with the NMR provide the basis
for the estimate of the chemical formula of the single crystal used for x-ray diffraction
(NEt4)4(HNEt3)4[(PhSi)6(ctc)4]Br2(DMF)4(EtOAc)6
10
Figure S4 Thermogravimetric traces of air dried crystals that were exposed to atmosphere (blue) and crystals that were collected from their mother liquor with no vacuum and transferred directly to the instrument (red)
11
S7 Powder Diffraction Patterns
The powder diffraction pattern for the parent compound (NEt4)4(HNEt3)4[(PhSi)6(ctc)4]Br2solvate (Figure S5) of the boiled crystals (Figure S6) and the crystals soaked in aqueous CsBr (Figure S7) are shown below
Figure S5 Calculated powder x-ray diffraction pattern of (NEt4)4(HNEt3)4[(PhSi)6(ctc)4]Br2solvate (blue) compared with experimental data for ground up crystals prepared via method 2 and washed with a minimum of ethyl acetate (red)
5 10 15 20 25 30 35 402Θ
Intensity
12
Figure S6 Observed powder diffraction patterns of (NEt4)4(HNEt3)4[(PhSi)6(ctc)4]Br2middotsolvate untreated (blue) and after being boiled in H2O for 30 mins (red)
Figure S7 Calculated (blue) and observed (red) powder patterns of the Si-cage crystals [(NEt4)4Cs4[(PhSi)6(ctc)4]Br2solvate] after immersion in aqueous CsBr
5 10 15 20 25 30 35 400
2000
4000
6000
8000
10000
12000
0
5
10
15
20
25
30
35
40
45
2Θ
Intensity
4 9 14 19 24 29 34 390
10
20
30
40
50
60
70
0
2
4
6
8
10
12
14
16
18
2Θ
Intensity
13
S8 ESI mass spectrometry
A Bruker Daltonics (Bremen Germany) SolariX 7 Tesla Hybrid MALDIESI-FT-ICR-MS was
used for high mass resolution analysis The instrument was operated in ESI negative and positive
ionisation modes with TD acquisition = 1M mz 200-2000 or 4M mz 5375-3000 providing mass
resolutions of 260000 and 140000 at mz 400 respectively and ESI positive ionization mode The
system was calibrated using an external calibration of ESI-TOF low concentration Tune Mix
(Agilent Technologies Santa Clara CA USA) Samples were infused at a rate of 2 microL min-1 using
the syringe pump a total of 10-20 scans were collected and averaged to generate mass spectra
The following general instrument conditions were set capillary voltage negative mode = 4200 V
and positive mode = -4000 V drying gas flow 40 L min-1 drying gas temperature 180degC
nebulizer gas flow rate 10 bar source accumulation 0001 sec ion accumulation 05 sec ion
cooling time 001 sec flight time 0001 sec Data were analysed using the Bruker Compass Data
Analysis 42 (Build 3831) software
Unless otherwise indicated the mz values given refer to the base peak of on isotopologue series
Sample preparation for ESI-MS analysis
1 (NEt4)4(HNEt3)4[(PhSi)6(ctc)4]middotsolvate (untreated crystals)
3-4 large crystals of the compound prepared via synthetic method 1 were dissolved in a
minimum of DMF (lt1 mL) followed by dilution with acetone (10 mL) prior to analysis
2 (NEt4)4(HNEt3)4[(PhSi)6(ctc)4]middotsolvate crystals that had been immersed in boiling water
2 mg of crystals of the compound prepared via synthetic method 2 were boiled in
deionized water for 30 min then solution was kept at 60degC for 7 days then filtered the
crystals dried 3-4 large crystals were dissolved in a minimum of DMSO (lt1 mL) followed
by dilution with acetonitrile (10 mL)
3 (NEt4)4(HNEt3)4[(PhSi)6(ctc)4]middotsolvate soaked in aqueous CsBr
1 mg of large crystals prepared via synthetic method 2 was immersed in an aqueous CsBr
solution (30 mg in 2 mL water) for 3 days then filtered and dried 3-4 large crystals were
dissolved in DMF (1 mL) followed by dilution with acetonitrile (10 mL)
14
Results of ESI-MS analysis
1 (NEt4)4(HNEt3)4[(PhSi)6(ctc)4]middotsolvate (untreated crystals)
Figure S6 shows the full high resolution ESI mass spectrum in negative mode
Table S1 lists the dominant isotopologues in the full spectrum The relative intensities of
the base peaks within each of the isotopologue series are indicated as their percentage
contribution to the sum of the intensities of the base peaks in each of the isotopologue series
The error (in ppm) for each species is calculated based upon the monoisotopic peak for each
isotopologue series
Figure S7 shows a portion of the spectrum in which a series of dianionic cage adducts are
indicated Figure S8 shows an enlargement of the signal corresponding to [cage + (NEt4)4]2- and a
comparison with the calculated pattern An enlargement of the signal corresponding to [cage +
(NEt4)3]3- and a comparison with the calculated pattern is displayed in Figure S9
15
Figure S6 Full ESI-mass spectrum in negative mode of samples obtained from the dissolution of (NEt4)4(HNEt3)4[(PhSi)6(ctc)4]middotsolvate crystals
656106631-
820946233-
1296490462-
1479551682-
500 1000 1500 2000 2500 mz0
1
2
3x10⁹Intensity
4
16
Table S1 Selected negative ionisation mode mass spectrum data for untreated crystals
mz (monoisotopic
peak)
mz (base peak) Charge Species Mass Error (ppm)
62607767 62807517 -1 - 49364402513 64402513 -1 - 198
65410885 65610663 -1 - 662
81093470 81160256 -3 [cage + (Et4N)2(HNEt3)]3- 212 157
82027857 82094623 -3 [cage + (Et4N)3]3- 223 109483320603 83320603 -1 - 104
88062603 88162843 -3 - 1094
94231547 94298363 -3 - 15
102022131 102221970 -1 - 109
126746585 126846409 -2 [cage + (Et4N)2(HNEt3)2]2- 199 129
128147736 128247689 -2 [cage + (Et4N)3(HNEt3)]2- -126 1108
129549110 129649046 -2 [cage + (Et4N)4]2- -272 37
131600693 131700842 -2 [cage + (Et4N)4 + MeCN]2- -074 259
133202091 133302389 -2 [cage + (Et4N)4 + DMF]2- -008 433
133239625 133391475 -2 - 141
146453513 146553452 -2 - 436
147854996 147955168 -2 - 62
158309263 158459398 -2 - 104
Figure S7 ESI-mass spectrum in negative mode of the peaks associated with [cage + (Et4N)4]2- at mz 129649046 [cage + (Et4N)3 + (Et3NH)]2- at mz 128247896 and [cage + (Et4N)2 + (Et3NH)2]2- at mz 126846409 from the dissolution of [(NEt4)4(HNEt3)4[(PhSi)6(ctc)4]middotsolvate crystals
17
Figure S8 ESI-mass spectrum in negative mode of the peaks associated with [cage + (Et4N)4]2- at mz 129649046 from the dissolution of [(NEt4)4(HNEt3)4[(PhSi)6(ctc)4]middotsolvate crystals
129549110
129599073129649046
129699036
129749030
129799091129849193
129899429
129549463
129599601129649699
129699781
129749853
129799920129849983
129900046
Calculated for [(C21H12O6)4(C6H5Si)6(C8H20N)4]2-
mz 129649699Error = -272 ppm mSigma = 170
1
2
3Intensity x109
0
1
2
3
4
1295 1296 1297 1298 1299 1300 mz
4
Intensity x109
Obtained for [(C21H12O6)4(C6H5Si)6(C8H20N)4]2-
mz 129649046
18
Figure S9 ESI-mass spectrum in negative mode of the peaks associated with [cage + (Et4N)3]3- at mz 82094623 (base peak) from the dissolution of (NEt4)4(HNEt3)4[(PhSi)6(ctc)4]middotsolvate crystals
2 (NEt4)4(HNEt3)4[(PhSi)6(ctc)4]middotsolvate crystals that had been immersed in boiling water
Figure S10 shows the full negative mode high resolution ESI mass spectrum obtained for
crystals of the compound boiled in water then dissolved in dimethylsulfoxide and diluted with
acetonitrile The dominant peak in the spectrum corresponds to [cage + (Et4N)3]3- at mz 820
82094461 Additionally there is a significant peak corresponding to [cage + (Et4N)2]4- at mz
58316930
Table S2 lists the dominant isotopologues in the full spectrum The relative intensities of
the base peaks within each of the isotopologue series are indicated as their percentage
contribution to the sum of the intensities of the base peaks in each of the isotopologue series
The error (in ppm) for each species is calculated based upon the monoisotopic peak for each
isotopologue series
82027857
8206125282094623
82127980
82161346
8219470882228104
82261505
82027674
8206109982094495
82127880
82161259
8219463582228008
82261382
Calculated for [(ctc)4(C6H5Si)6(C8H20N)3]3-
mz 82094495Error = 223 ppm
mSigma = 102
02
04
06
08
10
12
Intensity x109
00
02
04
06
08
10
12
8200 8205 8210 8215 8220 8225 8230 8235 mz
Intensity x109
Obtained for [(ctc)4(C6H5Si)6(C8H20N)3]3-
mz 82094623
19
Figure S10 Full negative mode mass spectrum of the crystals that had been boiled in water prior to being dissolved in DMSO and diluted with MeCN
583169304-
820944613-
959016973-
1335511022-
200 400 600 800 1000 1200 1400 1600 1800 mz
02
04
06
08
10
Intensity x109
20
Table S2 Selected negative ionisation mode mass spectrum data for crystals boiled in water prior to being dissolved in DMSO and diluted with MeCN
mz (monoisotopic
peak)
mz (base peak) Charge Species Mass Error
(ppm)
52588164 52513325 -4 - 114
55012908 55037984 -4 - 115
57566102 57591153 -4 [cage + (Et4N)(HNEt3)]4- 181 428
58266875 58316930 -4 [cage + (Et4N)2]4- 163 1467
64190823 64215815 -4 - 76
57538082 57563061 -4 - 45
74322912 74356421 -3 - 253
76572434 76622586 -2 - 188
81093427 81122759 -3 [cage + (Et4N)2(HNEt3)]3- 159 427
82027674 82094461 -3 [cage + (Et4N)3]3- 000 4449
94231837 94298549 -3 - 302
95834956 95901697 -3 - 703
126634775 126734243 -2 [cage +(Et4N)(HNEt3)Na2]2- + DMSO + 2MeCN + H2O -1505 006
128142767 128192988 -2 [cage + (Et4N)3(HNEt3)]2- -4004 05
129549463 129599949 -2 [cage + (Et4N)4]2- 000 077
131601536 131701879 -2 [cage + (Et4N)4 + MeCN]2- 567 083
133500905 133551102 -2 - 127 indicates assignment of species where large mass error may be attributable to overlapping peaks in the mass spectrum
21
3 Analysis of (NEt4)4(HNEt3)4[(PhSi)6(ctc)4]middotsolvate soaked in CsBr
Figure S11 shows the full negative mode high resolution ESI mass spectrum of the sample
obtained for crystals of the compound that had been immersed in an aqueous CsBr solution then
dissolved in dimethylformamide and diluted with acetonitrile Overlapping isotopic profiles of
the cage with caesium and tetraethylammonium cations reflect the similarity in the mass of Cs+
and NEt4+
Table S3 lists the dominant isotopologues in the full spectrum The relative intensities of
the base peaks within each of the isotopologue series are indicated as their percentage
contribution to the sum of the intensities of the base peaks in each of the isotopologue series
The error (in ppm) for each species is calculated based upon the monoisotopic peak for each
isotopologue series
Figure S11 Full negative mode mass spectrum of the crystals soaked in aqueous CsBr solution followed by dissolution in DMF and dilution with MeCN
583610534-
821867643-
1317395382-
200 400 600 800 1000 1200 1400 1600 1800 mz00
05
10
15
Intensity x109
22
Table S3 Selected negative ionisation mode mass spectrum data for crystals soaked in aqueous CsBr solution followed by dissolution in DMF and dilution with MeCN
mz (monoisotopic
peak)
mz (base peak) Charge Species
Mass Error (ppm)
58335201 58360465 -4 [cage + (Et4N)Cs]4- -388 11
65818834 65868071 -4 - 1
66672091 66721334 -4 - 09
80449608 80516206 -3 - 1
80981919 81048446 -3 [cage + (Et4N)CsNa + DMF]3- -062 114
82027674 82061027 -3 [cage + (Et4N)3]3- 000 34
82118882 82185240 -3 [cage + (Et4N)2Cs]3- -392 148
82210659 82243943 -3 [cage + (Et4N)Cs2]3- -090 24
84554184 84587536 -3 [cage + (Et4N)2Cs + DMF]3- -132 06
118127721 118227765 -2 - 04
124432811 124530638 -2 [cage + (Et4N)Na3 + 3DMF]2- 727 11
125479724 125577383 -2 [cage + (HNEt3)3Cs]2- -1863 04
126275663 126327346 -2 [cage + (Et4N)CsNa2 + 2DMF]2- 483 19
127847421 127944904 -2 [cage + (Et4N)3Na + DMF]2- 2980 33
127994562 128081415 -2 [cage + (Et4N)2CsNa + DMF]2- 10671 5
129131199 129230828 -2 - 17
129549463 129648253 -2 [cage + (Et4N)4]2- 000 109
129927040 130027425 -2 [cage + (Et4N)CsNa2 + 3DMF]2- -501 94
130835264 130934288 -2 [cage + (Et4N)2(HNEt3)2 + 2MeCN]2- -10488 55
131635977 131734789 -2 [cage + (Et4N)(HNEt3)2Na + 2DMF + MeCN + H2O]2- -6835 125
133342580 133441156 -2 [cage + (Et4N)3Cs + DMF]2- 2389 115
indicates assignment of species where large mass error may be attributable to overlapping peaks in the mass spectrum
23
Figure S12 Shows three overlapping isotopic profiles of [cage + (Et4N)3]3- at mz 82061027 [cage + (Et4N)2(Cs)]3- (most abundant) at mz 82185240 and [cage + (Et4N)(Cs)2]3- at mz 822
S9 Infra-red spectroscopy
Infra-red spectrum (NEt4)4(HNEt3)4[(PhSi)6(ctc)4]Br2middotsolvate (pressed KBr disc)
IR(KBr) cm-1 3431 3065 3025 2984 2918 2854 1619 1498 1384 1277 1254 1171 1119 938 890 858 738 704 672 612 521
The infra-red spectrum of (NEt4)4(HNEt3)4[(PhSi)6(ctc)4]Br2middotsolvate (pressed KBr disc) is presented in Figure S16
Infra-red spectrum of crystal after soaking in aqueous CsBr (pressed KBr disc)
IR(KBr) cm-1 3427 3065 3024 2982 2925 2860 1658 1619 1498 1384 1277 1253 1170 1117 1000 937 890 858 738 704 610 521
820276743-
820610273- 82094337
3- 82118882
821521273- 82185240
3-
822185803-
822522393-
822773243-
8205 8210 8215 8220 8225 8230 mz00
05
10
15
3-
Intensity x109
822439433-
24
4009001400190024002900340039000
01
02
03
04
05
06
07
08
09
FTIR of (NEt4)4(HNEt3)4[(PhSi)6(ctc)4]Br2middotsolvate - (KBr Disc)
Wavenumbers (cm-1 )
Tran
smis
sion
()
Figure S13 Infrared spectrum of (NEt4)4(HNEt3)4[(PhSi)6(ctc)4]Br2middotsolvate (pressed KBr disc)
25
S10 References for ESI
1 A Spek Acta Cryst Sect C 2015 71 9-18
2 A Spek Acta Cryst Sect D 2009 65 148-155
3 G Sheldrick Acta Cryst Sect A 2015 71 3-8
4 G Sheldrick Acta Cryst Sect C 2015 71 3-8
5 L Farrugia J Appl Cryst 2012 45 849-854
6 O V Dolomanov L J Bourhis RJ Gildea J A K Howard and H Puschmann J Appl Cryst 2009 42 339-341
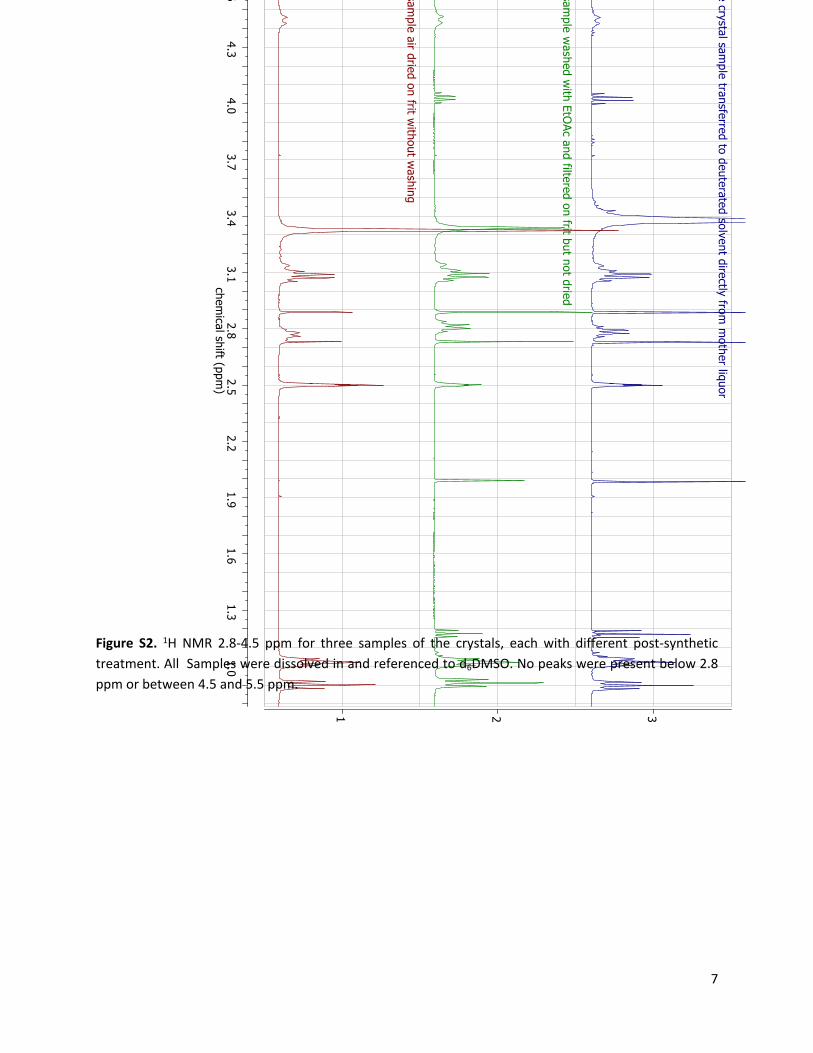
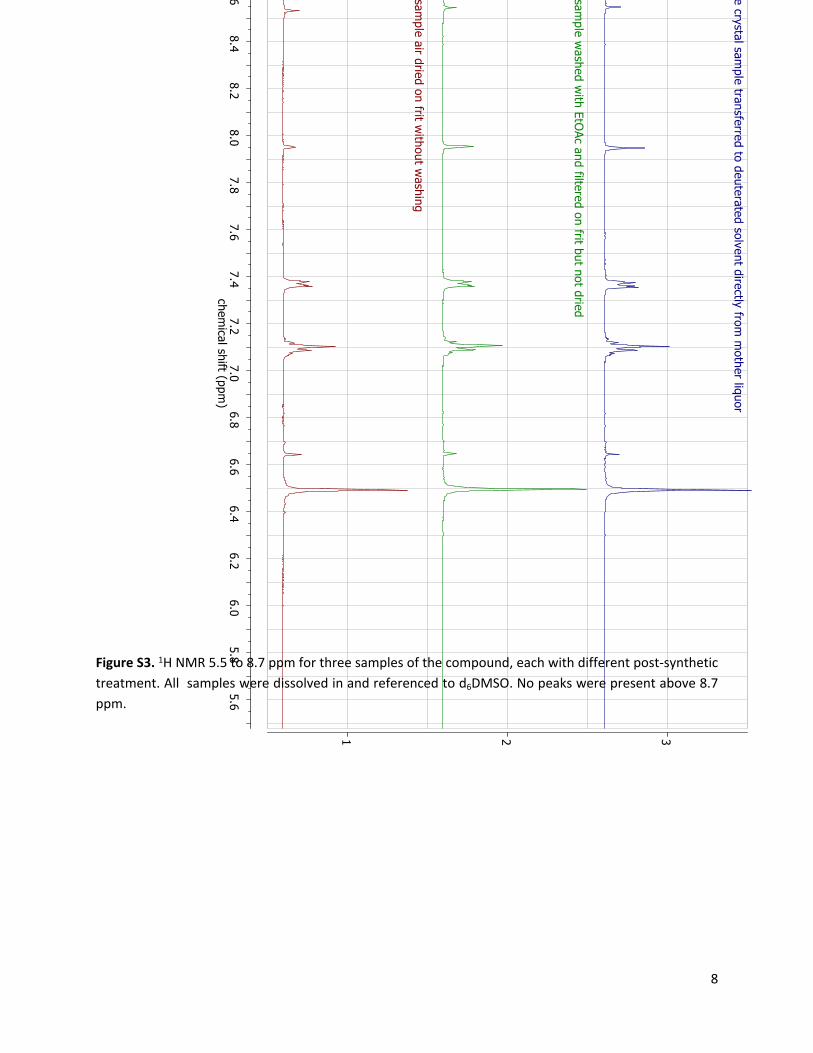
8
5658
6062
6466
6870
7274
7678
8082
8486
chemical shift (ppm
)
1 2 3
Single crystal sample transferred to deuterated solvent directly from
mother liquor
Bulk sample w
ashed with EtO
Ac and filtered on frit but not dried
Bulk sample air dried on frit w
ithout washing
Figure S3 1H NMR 55 to 87 ppm for three samples of the compound each with different post-synthetic treatment All samples were dissolved in and referenced to d6DMSO No peaks were present above 87 ppm
9
S6 Thermogravimetric analysis
Thermogravimetric analysis (TGA) of two samples of the compound was performed across a
temperature range of 25-450 degC The lsquodry crystalsrsquo represented below in Figure S5 in blue were
collected on a glass frit and air was pulled through the sample for several minutes The crystals
were left for several days before TGA was performed Though there is a small initial drop in mass
as dry nitrogen was blown across the sample at 25 degC the gradient of the graph remains close to
horizontal to temperatures around 250 degC indicating that most ethyl acetate is lost at room
temperature This is confirmed also by 1H NMR of the dried crystals (see S5 Nuclear Magnetic
Resonance Spectroscopy) Some of the mass loss below 80 degC may also correspond to water
adsorbed from the atmosphere however this has not been confirmed The total mass loss up to
450 degC corresponds approximately to all solvent (DMF) and counterions leaving only the cage
remaining Stability of the cage above 450 degC has not been measured
The lsquowet crystalsrsquo were prepared for analysis by filtration on a glass frit in the absence of suction
immediately before being transferred to the TGA instrument Some solvent loss may have
occurred during sample transfer and calibration of the instrument however the steeper gradient
of this line indicates presence and subsequent loss of ethyl acetate (and possibly water) up to
approximately 250 degC The TGA data of the wet crystals combined with the NMR provide the basis
for the estimate of the chemical formula of the single crystal used for x-ray diffraction
(NEt4)4(HNEt3)4[(PhSi)6(ctc)4]Br2(DMF)4(EtOAc)6
10
Figure S4 Thermogravimetric traces of air dried crystals that were exposed to atmosphere (blue) and crystals that were collected from their mother liquor with no vacuum and transferred directly to the instrument (red)
11
S7 Powder Diffraction Patterns
The powder diffraction pattern for the parent compound (NEt4)4(HNEt3)4[(PhSi)6(ctc)4]Br2solvate (Figure S5) of the boiled crystals (Figure S6) and the crystals soaked in aqueous CsBr (Figure S7) are shown below
Figure S5 Calculated powder x-ray diffraction pattern of (NEt4)4(HNEt3)4[(PhSi)6(ctc)4]Br2solvate (blue) compared with experimental data for ground up crystals prepared via method 2 and washed with a minimum of ethyl acetate (red)
5 10 15 20 25 30 35 402Θ
Intensity
12
Figure S6 Observed powder diffraction patterns of (NEt4)4(HNEt3)4[(PhSi)6(ctc)4]Br2middotsolvate untreated (blue) and after being boiled in H2O for 30 mins (red)
Figure S7 Calculated (blue) and observed (red) powder patterns of the Si-cage crystals [(NEt4)4Cs4[(PhSi)6(ctc)4]Br2solvate] after immersion in aqueous CsBr
5 10 15 20 25 30 35 400
2000
4000
6000
8000
10000
12000
0
5
10
15
20
25
30
35
40
45
2Θ
Intensity
4 9 14 19 24 29 34 390
10
20
30
40
50
60
70
0
2
4
6
8
10
12
14
16
18
2Θ
Intensity
13
S8 ESI mass spectrometry
A Bruker Daltonics (Bremen Germany) SolariX 7 Tesla Hybrid MALDIESI-FT-ICR-MS was
used for high mass resolution analysis The instrument was operated in ESI negative and positive
ionisation modes with TD acquisition = 1M mz 200-2000 or 4M mz 5375-3000 providing mass
resolutions of 260000 and 140000 at mz 400 respectively and ESI positive ionization mode The
system was calibrated using an external calibration of ESI-TOF low concentration Tune Mix
(Agilent Technologies Santa Clara CA USA) Samples were infused at a rate of 2 microL min-1 using
the syringe pump a total of 10-20 scans were collected and averaged to generate mass spectra
The following general instrument conditions were set capillary voltage negative mode = 4200 V
and positive mode = -4000 V drying gas flow 40 L min-1 drying gas temperature 180degC
nebulizer gas flow rate 10 bar source accumulation 0001 sec ion accumulation 05 sec ion
cooling time 001 sec flight time 0001 sec Data were analysed using the Bruker Compass Data
Analysis 42 (Build 3831) software
Unless otherwise indicated the mz values given refer to the base peak of on isotopologue series
Sample preparation for ESI-MS analysis
1 (NEt4)4(HNEt3)4[(PhSi)6(ctc)4]middotsolvate (untreated crystals)
3-4 large crystals of the compound prepared via synthetic method 1 were dissolved in a
minimum of DMF (lt1 mL) followed by dilution with acetone (10 mL) prior to analysis
2 (NEt4)4(HNEt3)4[(PhSi)6(ctc)4]middotsolvate crystals that had been immersed in boiling water
2 mg of crystals of the compound prepared via synthetic method 2 were boiled in
deionized water for 30 min then solution was kept at 60degC for 7 days then filtered the
crystals dried 3-4 large crystals were dissolved in a minimum of DMSO (lt1 mL) followed
by dilution with acetonitrile (10 mL)
3 (NEt4)4(HNEt3)4[(PhSi)6(ctc)4]middotsolvate soaked in aqueous CsBr
1 mg of large crystals prepared via synthetic method 2 was immersed in an aqueous CsBr
solution (30 mg in 2 mL water) for 3 days then filtered and dried 3-4 large crystals were
dissolved in DMF (1 mL) followed by dilution with acetonitrile (10 mL)
14
Results of ESI-MS analysis
1 (NEt4)4(HNEt3)4[(PhSi)6(ctc)4]middotsolvate (untreated crystals)
Figure S6 shows the full high resolution ESI mass spectrum in negative mode
Table S1 lists the dominant isotopologues in the full spectrum The relative intensities of
the base peaks within each of the isotopologue series are indicated as their percentage
contribution to the sum of the intensities of the base peaks in each of the isotopologue series
The error (in ppm) for each species is calculated based upon the monoisotopic peak for each
isotopologue series
Figure S7 shows a portion of the spectrum in which a series of dianionic cage adducts are
indicated Figure S8 shows an enlargement of the signal corresponding to [cage + (NEt4)4]2- and a
comparison with the calculated pattern An enlargement of the signal corresponding to [cage +
(NEt4)3]3- and a comparison with the calculated pattern is displayed in Figure S9
15
Figure S6 Full ESI-mass spectrum in negative mode of samples obtained from the dissolution of (NEt4)4(HNEt3)4[(PhSi)6(ctc)4]middotsolvate crystals
656106631-
820946233-
1296490462-
1479551682-
500 1000 1500 2000 2500 mz0
1
2
3x10⁹Intensity
4
16
Table S1 Selected negative ionisation mode mass spectrum data for untreated crystals
mz (monoisotopic
peak)
mz (base peak) Charge Species Mass Error (ppm)
62607767 62807517 -1 - 49364402513 64402513 -1 - 198
65410885 65610663 -1 - 662
81093470 81160256 -3 [cage + (Et4N)2(HNEt3)]3- 212 157
82027857 82094623 -3 [cage + (Et4N)3]3- 223 109483320603 83320603 -1 - 104
88062603 88162843 -3 - 1094
94231547 94298363 -3 - 15
102022131 102221970 -1 - 109
126746585 126846409 -2 [cage + (Et4N)2(HNEt3)2]2- 199 129
128147736 128247689 -2 [cage + (Et4N)3(HNEt3)]2- -126 1108
129549110 129649046 -2 [cage + (Et4N)4]2- -272 37
131600693 131700842 -2 [cage + (Et4N)4 + MeCN]2- -074 259
133202091 133302389 -2 [cage + (Et4N)4 + DMF]2- -008 433
133239625 133391475 -2 - 141
146453513 146553452 -2 - 436
147854996 147955168 -2 - 62
158309263 158459398 -2 - 104
Figure S7 ESI-mass spectrum in negative mode of the peaks associated with [cage + (Et4N)4]2- at mz 129649046 [cage + (Et4N)3 + (Et3NH)]2- at mz 128247896 and [cage + (Et4N)2 + (Et3NH)2]2- at mz 126846409 from the dissolution of [(NEt4)4(HNEt3)4[(PhSi)6(ctc)4]middotsolvate crystals
17
Figure S8 ESI-mass spectrum in negative mode of the peaks associated with [cage + (Et4N)4]2- at mz 129649046 from the dissolution of [(NEt4)4(HNEt3)4[(PhSi)6(ctc)4]middotsolvate crystals
129549110
129599073129649046
129699036
129749030
129799091129849193
129899429
129549463
129599601129649699
129699781
129749853
129799920129849983
129900046
Calculated for [(C21H12O6)4(C6H5Si)6(C8H20N)4]2-
mz 129649699Error = -272 ppm mSigma = 170
1
2
3Intensity x109
0
1
2
3
4
1295 1296 1297 1298 1299 1300 mz
4
Intensity x109
Obtained for [(C21H12O6)4(C6H5Si)6(C8H20N)4]2-
mz 129649046
18
Figure S9 ESI-mass spectrum in negative mode of the peaks associated with [cage + (Et4N)3]3- at mz 82094623 (base peak) from the dissolution of (NEt4)4(HNEt3)4[(PhSi)6(ctc)4]middotsolvate crystals
2 (NEt4)4(HNEt3)4[(PhSi)6(ctc)4]middotsolvate crystals that had been immersed in boiling water
Figure S10 shows the full negative mode high resolution ESI mass spectrum obtained for
crystals of the compound boiled in water then dissolved in dimethylsulfoxide and diluted with
acetonitrile The dominant peak in the spectrum corresponds to [cage + (Et4N)3]3- at mz 820
82094461 Additionally there is a significant peak corresponding to [cage + (Et4N)2]4- at mz
58316930
Table S2 lists the dominant isotopologues in the full spectrum The relative intensities of
the base peaks within each of the isotopologue series are indicated as their percentage
contribution to the sum of the intensities of the base peaks in each of the isotopologue series
The error (in ppm) for each species is calculated based upon the monoisotopic peak for each
isotopologue series
82027857
8206125282094623
82127980
82161346
8219470882228104
82261505
82027674
8206109982094495
82127880
82161259
8219463582228008
82261382
Calculated for [(ctc)4(C6H5Si)6(C8H20N)3]3-
mz 82094495Error = 223 ppm
mSigma = 102
02
04
06
08
10
12
Intensity x109
00
02
04
06
08
10
12
8200 8205 8210 8215 8220 8225 8230 8235 mz
Intensity x109
Obtained for [(ctc)4(C6H5Si)6(C8H20N)3]3-
mz 82094623
19
Figure S10 Full negative mode mass spectrum of the crystals that had been boiled in water prior to being dissolved in DMSO and diluted with MeCN
583169304-
820944613-
959016973-
1335511022-
200 400 600 800 1000 1200 1400 1600 1800 mz
02
04
06
08
10
Intensity x109
20
Table S2 Selected negative ionisation mode mass spectrum data for crystals boiled in water prior to being dissolved in DMSO and diluted with MeCN
mz (monoisotopic
peak)
mz (base peak) Charge Species Mass Error
(ppm)
52588164 52513325 -4 - 114
55012908 55037984 -4 - 115
57566102 57591153 -4 [cage + (Et4N)(HNEt3)]4- 181 428
58266875 58316930 -4 [cage + (Et4N)2]4- 163 1467
64190823 64215815 -4 - 76
57538082 57563061 -4 - 45
74322912 74356421 -3 - 253
76572434 76622586 -2 - 188
81093427 81122759 -3 [cage + (Et4N)2(HNEt3)]3- 159 427
82027674 82094461 -3 [cage + (Et4N)3]3- 000 4449
94231837 94298549 -3 - 302
95834956 95901697 -3 - 703
126634775 126734243 -2 [cage +(Et4N)(HNEt3)Na2]2- + DMSO + 2MeCN + H2O -1505 006
128142767 128192988 -2 [cage + (Et4N)3(HNEt3)]2- -4004 05
129549463 129599949 -2 [cage + (Et4N)4]2- 000 077
131601536 131701879 -2 [cage + (Et4N)4 + MeCN]2- 567 083
133500905 133551102 -2 - 127 indicates assignment of species where large mass error may be attributable to overlapping peaks in the mass spectrum
21
3 Analysis of (NEt4)4(HNEt3)4[(PhSi)6(ctc)4]middotsolvate soaked in CsBr
Figure S11 shows the full negative mode high resolution ESI mass spectrum of the sample
obtained for crystals of the compound that had been immersed in an aqueous CsBr solution then
dissolved in dimethylformamide and diluted with acetonitrile Overlapping isotopic profiles of
the cage with caesium and tetraethylammonium cations reflect the similarity in the mass of Cs+
and NEt4+
Table S3 lists the dominant isotopologues in the full spectrum The relative intensities of
the base peaks within each of the isotopologue series are indicated as their percentage
contribution to the sum of the intensities of the base peaks in each of the isotopologue series
The error (in ppm) for each species is calculated based upon the monoisotopic peak for each
isotopologue series
Figure S11 Full negative mode mass spectrum of the crystals soaked in aqueous CsBr solution followed by dissolution in DMF and dilution with MeCN
583610534-
821867643-
1317395382-
200 400 600 800 1000 1200 1400 1600 1800 mz00
05
10
15
Intensity x109
22
Table S3 Selected negative ionisation mode mass spectrum data for crystals soaked in aqueous CsBr solution followed by dissolution in DMF and dilution with MeCN
mz (monoisotopic
peak)
mz (base peak) Charge Species
Mass Error (ppm)
58335201 58360465 -4 [cage + (Et4N)Cs]4- -388 11
65818834 65868071 -4 - 1
66672091 66721334 -4 - 09
80449608 80516206 -3 - 1
80981919 81048446 -3 [cage + (Et4N)CsNa + DMF]3- -062 114
82027674 82061027 -3 [cage + (Et4N)3]3- 000 34
82118882 82185240 -3 [cage + (Et4N)2Cs]3- -392 148
82210659 82243943 -3 [cage + (Et4N)Cs2]3- -090 24
84554184 84587536 -3 [cage + (Et4N)2Cs + DMF]3- -132 06
118127721 118227765 -2 - 04
124432811 124530638 -2 [cage + (Et4N)Na3 + 3DMF]2- 727 11
125479724 125577383 -2 [cage + (HNEt3)3Cs]2- -1863 04
126275663 126327346 -2 [cage + (Et4N)CsNa2 + 2DMF]2- 483 19
127847421 127944904 -2 [cage + (Et4N)3Na + DMF]2- 2980 33
127994562 128081415 -2 [cage + (Et4N)2CsNa + DMF]2- 10671 5
129131199 129230828 -2 - 17
129549463 129648253 -2 [cage + (Et4N)4]2- 000 109
129927040 130027425 -2 [cage + (Et4N)CsNa2 + 3DMF]2- -501 94
130835264 130934288 -2 [cage + (Et4N)2(HNEt3)2 + 2MeCN]2- -10488 55
131635977 131734789 -2 [cage + (Et4N)(HNEt3)2Na + 2DMF + MeCN + H2O]2- -6835 125
133342580 133441156 -2 [cage + (Et4N)3Cs + DMF]2- 2389 115
indicates assignment of species where large mass error may be attributable to overlapping peaks in the mass spectrum
23
Figure S12 Shows three overlapping isotopic profiles of [cage + (Et4N)3]3- at mz 82061027 [cage + (Et4N)2(Cs)]3- (most abundant) at mz 82185240 and [cage + (Et4N)(Cs)2]3- at mz 822
S9 Infra-red spectroscopy
Infra-red spectrum (NEt4)4(HNEt3)4[(PhSi)6(ctc)4]Br2middotsolvate (pressed KBr disc)
IR(KBr) cm-1 3431 3065 3025 2984 2918 2854 1619 1498 1384 1277 1254 1171 1119 938 890 858 738 704 672 612 521
The infra-red spectrum of (NEt4)4(HNEt3)4[(PhSi)6(ctc)4]Br2middotsolvate (pressed KBr disc) is presented in Figure S16
Infra-red spectrum of crystal after soaking in aqueous CsBr (pressed KBr disc)
IR(KBr) cm-1 3427 3065 3024 2982 2925 2860 1658 1619 1498 1384 1277 1253 1170 1117 1000 937 890 858 738 704 610 521
820276743-
820610273- 82094337
3- 82118882
821521273- 82185240
3-
822185803-
822522393-
822773243-
8205 8210 8215 8220 8225 8230 mz00
05
10
15
3-
Intensity x109
822439433-
24
4009001400190024002900340039000
01
02
03
04
05
06
07
08
09
FTIR of (NEt4)4(HNEt3)4[(PhSi)6(ctc)4]Br2middotsolvate - (KBr Disc)
Wavenumbers (cm-1 )
Tran
smis
sion
()
Figure S13 Infrared spectrum of (NEt4)4(HNEt3)4[(PhSi)6(ctc)4]Br2middotsolvate (pressed KBr disc)
25
S10 References for ESI
1 A Spek Acta Cryst Sect C 2015 71 9-18
2 A Spek Acta Cryst Sect D 2009 65 148-155
3 G Sheldrick Acta Cryst Sect A 2015 71 3-8
4 G Sheldrick Acta Cryst Sect C 2015 71 3-8
5 L Farrugia J Appl Cryst 2012 45 849-854
6 O V Dolomanov L J Bourhis RJ Gildea J A K Howard and H Puschmann J Appl Cryst 2009 42 339-341
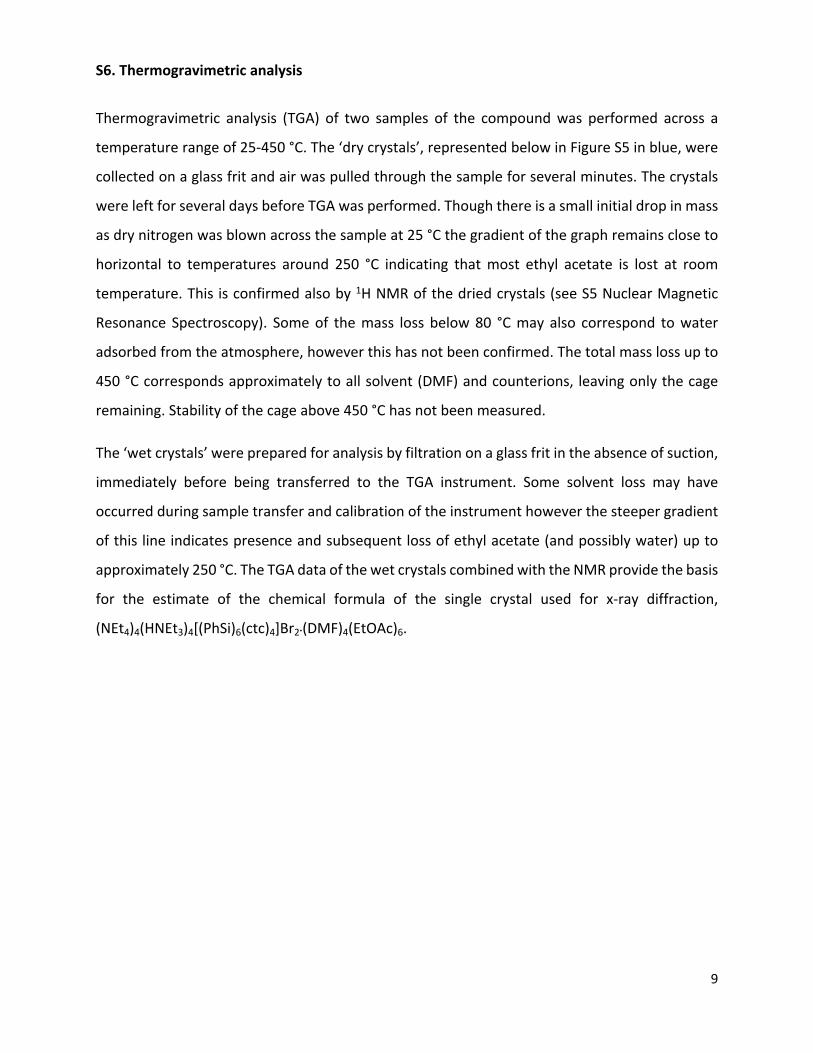
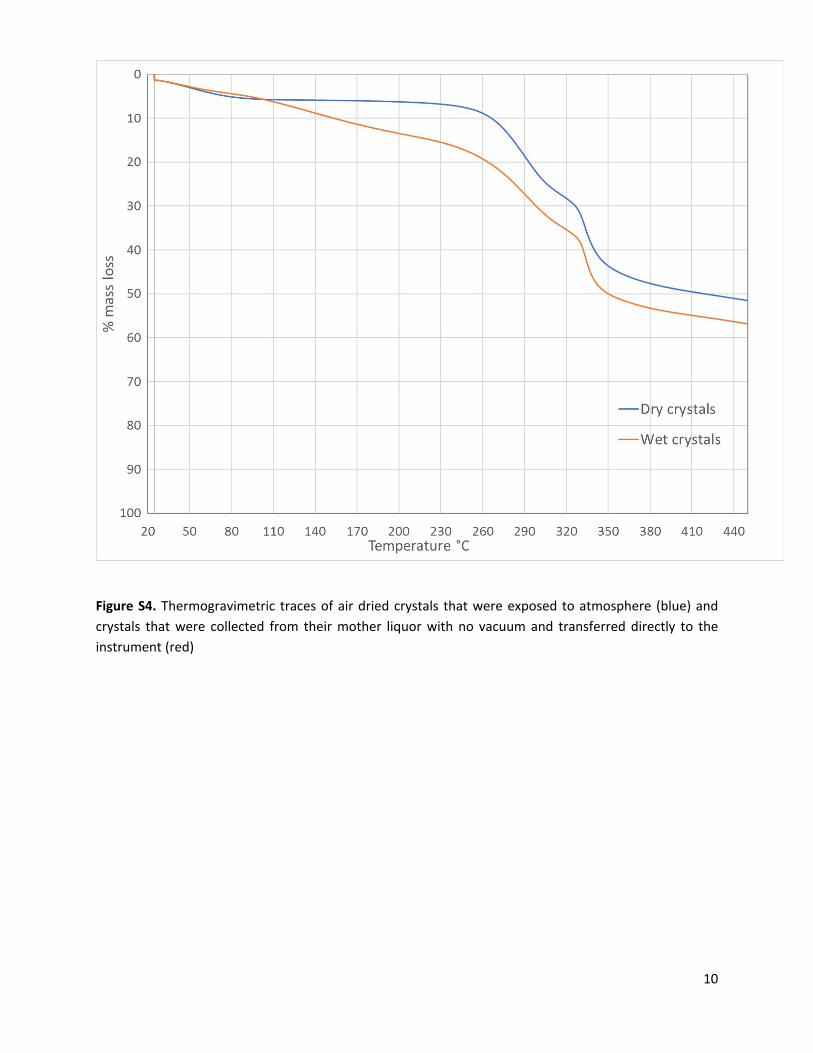
10
Figure S4 Thermogravimetric traces of air dried crystals that were exposed to atmosphere (blue) and crystals that were collected from their mother liquor with no vacuum and transferred directly to the instrument (red)
11
S7 Powder Diffraction Patterns
The powder diffraction pattern for the parent compound (NEt4)4(HNEt3)4[(PhSi)6(ctc)4]Br2solvate (Figure S5) of the boiled crystals (Figure S6) and the crystals soaked in aqueous CsBr (Figure S7) are shown below
Figure S5 Calculated powder x-ray diffraction pattern of (NEt4)4(HNEt3)4[(PhSi)6(ctc)4]Br2solvate (blue) compared with experimental data for ground up crystals prepared via method 2 and washed with a minimum of ethyl acetate (red)
5 10 15 20 25 30 35 402Θ
Intensity
12
Figure S6 Observed powder diffraction patterns of (NEt4)4(HNEt3)4[(PhSi)6(ctc)4]Br2middotsolvate untreated (blue) and after being boiled in H2O for 30 mins (red)
Figure S7 Calculated (blue) and observed (red) powder patterns of the Si-cage crystals [(NEt4)4Cs4[(PhSi)6(ctc)4]Br2solvate] after immersion in aqueous CsBr
5 10 15 20 25 30 35 400
2000
4000
6000
8000
10000
12000
0
5
10
15
20
25
30
35
40
45
2Θ
Intensity
4 9 14 19 24 29 34 390
10
20
30
40
50
60
70
0
2
4
6
8
10
12
14
16
18
2Θ
Intensity
13
S8 ESI mass spectrometry
A Bruker Daltonics (Bremen Germany) SolariX 7 Tesla Hybrid MALDIESI-FT-ICR-MS was
used for high mass resolution analysis The instrument was operated in ESI negative and positive
ionisation modes with TD acquisition = 1M mz 200-2000 or 4M mz 5375-3000 providing mass
resolutions of 260000 and 140000 at mz 400 respectively and ESI positive ionization mode The
system was calibrated using an external calibration of ESI-TOF low concentration Tune Mix
(Agilent Technologies Santa Clara CA USA) Samples were infused at a rate of 2 microL min-1 using
the syringe pump a total of 10-20 scans were collected and averaged to generate mass spectra
The following general instrument conditions were set capillary voltage negative mode = 4200 V
and positive mode = -4000 V drying gas flow 40 L min-1 drying gas temperature 180degC
nebulizer gas flow rate 10 bar source accumulation 0001 sec ion accumulation 05 sec ion
cooling time 001 sec flight time 0001 sec Data were analysed using the Bruker Compass Data
Analysis 42 (Build 3831) software
Unless otherwise indicated the mz values given refer to the base peak of on isotopologue series
Sample preparation for ESI-MS analysis
1 (NEt4)4(HNEt3)4[(PhSi)6(ctc)4]middotsolvate (untreated crystals)
3-4 large crystals of the compound prepared via synthetic method 1 were dissolved in a
minimum of DMF (lt1 mL) followed by dilution with acetone (10 mL) prior to analysis
2 (NEt4)4(HNEt3)4[(PhSi)6(ctc)4]middotsolvate crystals that had been immersed in boiling water
2 mg of crystals of the compound prepared via synthetic method 2 were boiled in
deionized water for 30 min then solution was kept at 60degC for 7 days then filtered the
crystals dried 3-4 large crystals were dissolved in a minimum of DMSO (lt1 mL) followed
by dilution with acetonitrile (10 mL)
3 (NEt4)4(HNEt3)4[(PhSi)6(ctc)4]middotsolvate soaked in aqueous CsBr
1 mg of large crystals prepared via synthetic method 2 was immersed in an aqueous CsBr
solution (30 mg in 2 mL water) for 3 days then filtered and dried 3-4 large crystals were
dissolved in DMF (1 mL) followed by dilution with acetonitrile (10 mL)
14
Results of ESI-MS analysis
1 (NEt4)4(HNEt3)4[(PhSi)6(ctc)4]middotsolvate (untreated crystals)
Figure S6 shows the full high resolution ESI mass spectrum in negative mode
Table S1 lists the dominant isotopologues in the full spectrum The relative intensities of
the base peaks within each of the isotopologue series are indicated as their percentage
contribution to the sum of the intensities of the base peaks in each of the isotopologue series
The error (in ppm) for each species is calculated based upon the monoisotopic peak for each
isotopologue series
Figure S7 shows a portion of the spectrum in which a series of dianionic cage adducts are
indicated Figure S8 shows an enlargement of the signal corresponding to [cage + (NEt4)4]2- and a
comparison with the calculated pattern An enlargement of the signal corresponding to [cage +
(NEt4)3]3- and a comparison with the calculated pattern is displayed in Figure S9
15
Figure S6 Full ESI-mass spectrum in negative mode of samples obtained from the dissolution of (NEt4)4(HNEt3)4[(PhSi)6(ctc)4]middotsolvate crystals
656106631-
820946233-
1296490462-
1479551682-
500 1000 1500 2000 2500 mz0
1
2
3x10⁹Intensity
4
16
Table S1 Selected negative ionisation mode mass spectrum data for untreated crystals
mz (monoisotopic
peak)
mz (base peak) Charge Species Mass Error (ppm)
62607767 62807517 -1 - 49364402513 64402513 -1 - 198
65410885 65610663 -1 - 662
81093470 81160256 -3 [cage + (Et4N)2(HNEt3)]3- 212 157
82027857 82094623 -3 [cage + (Et4N)3]3- 223 109483320603 83320603 -1 - 104
88062603 88162843 -3 - 1094
94231547 94298363 -3 - 15
102022131 102221970 -1 - 109
126746585 126846409 -2 [cage + (Et4N)2(HNEt3)2]2- 199 129
128147736 128247689 -2 [cage + (Et4N)3(HNEt3)]2- -126 1108
129549110 129649046 -2 [cage + (Et4N)4]2- -272 37
131600693 131700842 -2 [cage + (Et4N)4 + MeCN]2- -074 259
133202091 133302389 -2 [cage + (Et4N)4 + DMF]2- -008 433
133239625 133391475 -2 - 141
146453513 146553452 -2 - 436
147854996 147955168 -2 - 62
158309263 158459398 -2 - 104
Figure S7 ESI-mass spectrum in negative mode of the peaks associated with [cage + (Et4N)4]2- at mz 129649046 [cage + (Et4N)3 + (Et3NH)]2- at mz 128247896 and [cage + (Et4N)2 + (Et3NH)2]2- at mz 126846409 from the dissolution of [(NEt4)4(HNEt3)4[(PhSi)6(ctc)4]middotsolvate crystals
17
Figure S8 ESI-mass spectrum in negative mode of the peaks associated with [cage + (Et4N)4]2- at mz 129649046 from the dissolution of [(NEt4)4(HNEt3)4[(PhSi)6(ctc)4]middotsolvate crystals
129549110
129599073129649046
129699036
129749030
129799091129849193
129899429
129549463
129599601129649699
129699781
129749853
129799920129849983
129900046
Calculated for [(C21H12O6)4(C6H5Si)6(C8H20N)4]2-
mz 129649699Error = -272 ppm mSigma = 170
1
2
3Intensity x109
0
1
2
3
4
1295 1296 1297 1298 1299 1300 mz
4
Intensity x109
Obtained for [(C21H12O6)4(C6H5Si)6(C8H20N)4]2-
mz 129649046
18
Figure S9 ESI-mass spectrum in negative mode of the peaks associated with [cage + (Et4N)3]3- at mz 82094623 (base peak) from the dissolution of (NEt4)4(HNEt3)4[(PhSi)6(ctc)4]middotsolvate crystals
2 (NEt4)4(HNEt3)4[(PhSi)6(ctc)4]middotsolvate crystals that had been immersed in boiling water
Figure S10 shows the full negative mode high resolution ESI mass spectrum obtained for
crystals of the compound boiled in water then dissolved in dimethylsulfoxide and diluted with
acetonitrile The dominant peak in the spectrum corresponds to [cage + (Et4N)3]3- at mz 820
82094461 Additionally there is a significant peak corresponding to [cage + (Et4N)2]4- at mz
58316930
Table S2 lists the dominant isotopologues in the full spectrum The relative intensities of
the base peaks within each of the isotopologue series are indicated as their percentage
contribution to the sum of the intensities of the base peaks in each of the isotopologue series
The error (in ppm) for each species is calculated based upon the monoisotopic peak for each
isotopologue series
82027857
8206125282094623
82127980
82161346
8219470882228104
82261505
82027674
8206109982094495
82127880
82161259
8219463582228008
82261382
Calculated for [(ctc)4(C6H5Si)6(C8H20N)3]3-
mz 82094495Error = 223 ppm
mSigma = 102
02
04
06
08
10
12
Intensity x109
00
02
04
06
08
10
12
8200 8205 8210 8215 8220 8225 8230 8235 mz
Intensity x109
Obtained for [(ctc)4(C6H5Si)6(C8H20N)3]3-
mz 82094623
19
Figure S10 Full negative mode mass spectrum of the crystals that had been boiled in water prior to being dissolved in DMSO and diluted with MeCN
583169304-
820944613-
959016973-
1335511022-
200 400 600 800 1000 1200 1400 1600 1800 mz
02
04
06
08
10
Intensity x109
20
Table S2 Selected negative ionisation mode mass spectrum data for crystals boiled in water prior to being dissolved in DMSO and diluted with MeCN
mz (monoisotopic
peak)
mz (base peak) Charge Species Mass Error
(ppm)
52588164 52513325 -4 - 114
55012908 55037984 -4 - 115
57566102 57591153 -4 [cage + (Et4N)(HNEt3)]4- 181 428
58266875 58316930 -4 [cage + (Et4N)2]4- 163 1467
64190823 64215815 -4 - 76
57538082 57563061 -4 - 45
74322912 74356421 -3 - 253
76572434 76622586 -2 - 188
81093427 81122759 -3 [cage + (Et4N)2(HNEt3)]3- 159 427
82027674 82094461 -3 [cage + (Et4N)3]3- 000 4449
94231837 94298549 -3 - 302
95834956 95901697 -3 - 703
126634775 126734243 -2 [cage +(Et4N)(HNEt3)Na2]2- + DMSO + 2MeCN + H2O -1505 006
128142767 128192988 -2 [cage + (Et4N)3(HNEt3)]2- -4004 05
129549463 129599949 -2 [cage + (Et4N)4]2- 000 077
131601536 131701879 -2 [cage + (Et4N)4 + MeCN]2- 567 083
133500905 133551102 -2 - 127 indicates assignment of species where large mass error may be attributable to overlapping peaks in the mass spectrum
21
3 Analysis of (NEt4)4(HNEt3)4[(PhSi)6(ctc)4]middotsolvate soaked in CsBr
Figure S11 shows the full negative mode high resolution ESI mass spectrum of the sample
obtained for crystals of the compound that had been immersed in an aqueous CsBr solution then
dissolved in dimethylformamide and diluted with acetonitrile Overlapping isotopic profiles of
the cage with caesium and tetraethylammonium cations reflect the similarity in the mass of Cs+
and NEt4+
Table S3 lists the dominant isotopologues in the full spectrum The relative intensities of
the base peaks within each of the isotopologue series are indicated as their percentage
contribution to the sum of the intensities of the base peaks in each of the isotopologue series
The error (in ppm) for each species is calculated based upon the monoisotopic peak for each
isotopologue series
Figure S11 Full negative mode mass spectrum of the crystals soaked in aqueous CsBr solution followed by dissolution in DMF and dilution with MeCN
583610534-
821867643-
1317395382-
200 400 600 800 1000 1200 1400 1600 1800 mz00
05
10
15
Intensity x109
22
Table S3 Selected negative ionisation mode mass spectrum data for crystals soaked in aqueous CsBr solution followed by dissolution in DMF and dilution with MeCN
mz (monoisotopic
peak)
mz (base peak) Charge Species
Mass Error (ppm)
58335201 58360465 -4 [cage + (Et4N)Cs]4- -388 11
65818834 65868071 -4 - 1
66672091 66721334 -4 - 09
80449608 80516206 -3 - 1
80981919 81048446 -3 [cage + (Et4N)CsNa + DMF]3- -062 114
82027674 82061027 -3 [cage + (Et4N)3]3- 000 34
82118882 82185240 -3 [cage + (Et4N)2Cs]3- -392 148
82210659 82243943 -3 [cage + (Et4N)Cs2]3- -090 24
84554184 84587536 -3 [cage + (Et4N)2Cs + DMF]3- -132 06
118127721 118227765 -2 - 04
124432811 124530638 -2 [cage + (Et4N)Na3 + 3DMF]2- 727 11
125479724 125577383 -2 [cage + (HNEt3)3Cs]2- -1863 04
126275663 126327346 -2 [cage + (Et4N)CsNa2 + 2DMF]2- 483 19
127847421 127944904 -2 [cage + (Et4N)3Na + DMF]2- 2980 33
127994562 128081415 -2 [cage + (Et4N)2CsNa + DMF]2- 10671 5
129131199 129230828 -2 - 17
129549463 129648253 -2 [cage + (Et4N)4]2- 000 109
129927040 130027425 -2 [cage + (Et4N)CsNa2 + 3DMF]2- -501 94
130835264 130934288 -2 [cage + (Et4N)2(HNEt3)2 + 2MeCN]2- -10488 55
131635977 131734789 -2 [cage + (Et4N)(HNEt3)2Na + 2DMF + MeCN + H2O]2- -6835 125
133342580 133441156 -2 [cage + (Et4N)3Cs + DMF]2- 2389 115
indicates assignment of species where large mass error may be attributable to overlapping peaks in the mass spectrum
23
Figure S12 Shows three overlapping isotopic profiles of [cage + (Et4N)3]3- at mz 82061027 [cage + (Et4N)2(Cs)]3- (most abundant) at mz 82185240 and [cage + (Et4N)(Cs)2]3- at mz 822
S9 Infra-red spectroscopy
Infra-red spectrum (NEt4)4(HNEt3)4[(PhSi)6(ctc)4]Br2middotsolvate (pressed KBr disc)
IR(KBr) cm-1 3431 3065 3025 2984 2918 2854 1619 1498 1384 1277 1254 1171 1119 938 890 858 738 704 672 612 521
The infra-red spectrum of (NEt4)4(HNEt3)4[(PhSi)6(ctc)4]Br2middotsolvate (pressed KBr disc) is presented in Figure S16
Infra-red spectrum of crystal after soaking in aqueous CsBr (pressed KBr disc)
IR(KBr) cm-1 3427 3065 3024 2982 2925 2860 1658 1619 1498 1384 1277 1253 1170 1117 1000 937 890 858 738 704 610 521
820276743-
820610273- 82094337
3- 82118882
821521273- 82185240
3-
822185803-
822522393-
822773243-
8205 8210 8215 8220 8225 8230 mz00
05
10
15
3-
Intensity x109
822439433-
24
4009001400190024002900340039000
01
02
03
04
05
06
07
08
09
FTIR of (NEt4)4(HNEt3)4[(PhSi)6(ctc)4]Br2middotsolvate - (KBr Disc)
Wavenumbers (cm-1 )
Tran
smis
sion
()
Figure S13 Infrared spectrum of (NEt4)4(HNEt3)4[(PhSi)6(ctc)4]Br2middotsolvate (pressed KBr disc)
25
S10 References for ESI
1 A Spek Acta Cryst Sect C 2015 71 9-18
2 A Spek Acta Cryst Sect D 2009 65 148-155
3 G Sheldrick Acta Cryst Sect A 2015 71 3-8
4 G Sheldrick Acta Cryst Sect C 2015 71 3-8
5 L Farrugia J Appl Cryst 2012 45 849-854
6 O V Dolomanov L J Bourhis RJ Gildea J A K Howard and H Puschmann J Appl Cryst 2009 42 339-341
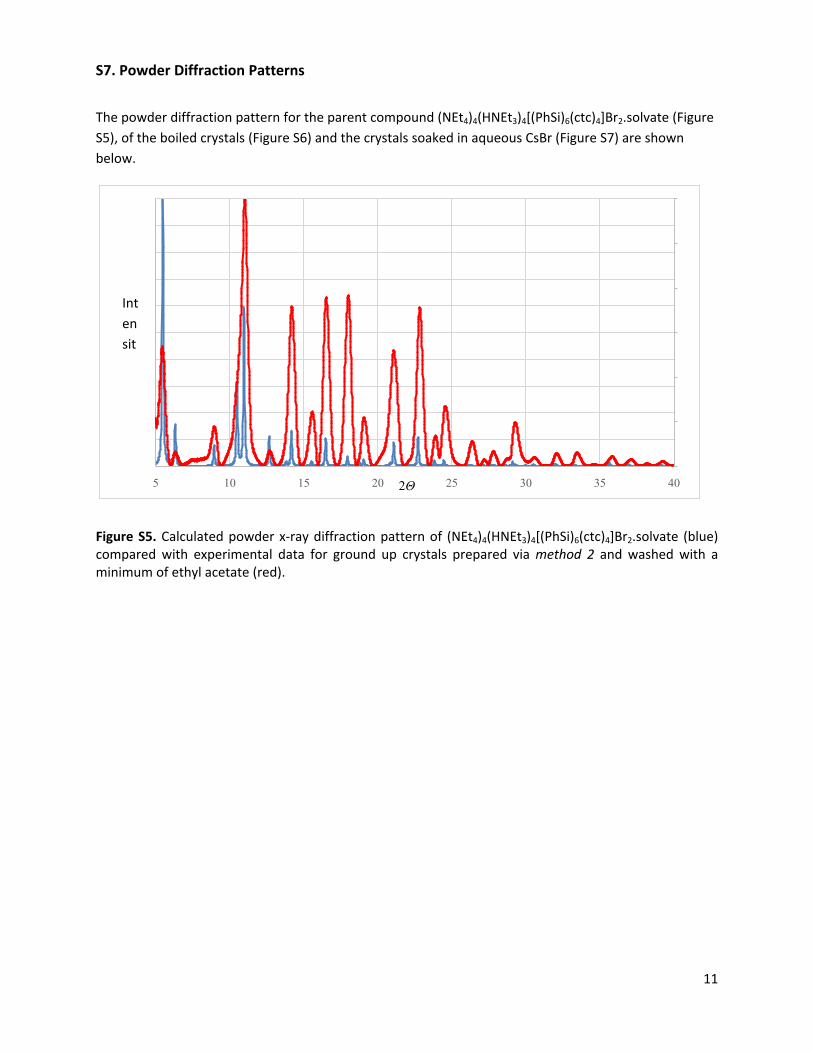
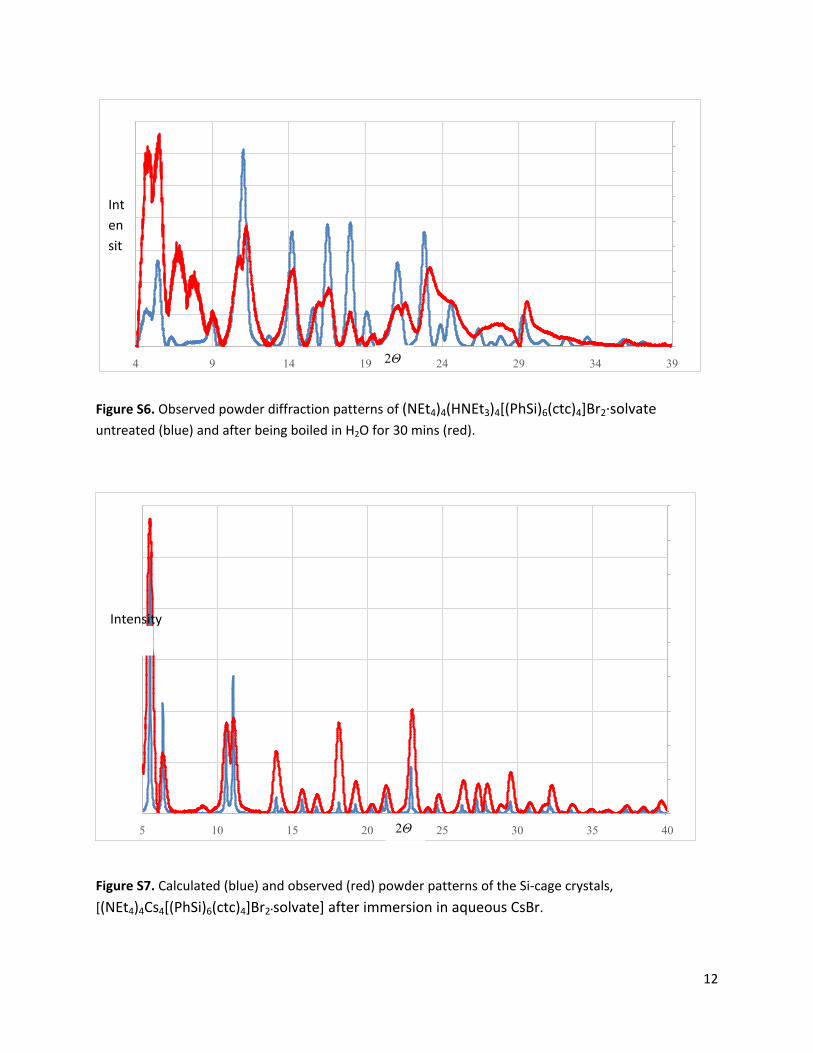
12
Figure S6 Observed powder diffraction patterns of (NEt4)4(HNEt3)4[(PhSi)6(ctc)4]Br2middotsolvate untreated (blue) and after being boiled in H2O for 30 mins (red)
Figure S7 Calculated (blue) and observed (red) powder patterns of the Si-cage crystals [(NEt4)4Cs4[(PhSi)6(ctc)4]Br2solvate] after immersion in aqueous CsBr
5 10 15 20 25 30 35 400
2000
4000
6000
8000
10000
12000
0
5
10
15
20
25
30
35
40
45
2Θ
Intensity
4 9 14 19 24 29 34 390
10
20
30
40
50
60
70
0
2
4
6
8
10
12
14
16
18
2Θ
Intensity
13
S8 ESI mass spectrometry
A Bruker Daltonics (Bremen Germany) SolariX 7 Tesla Hybrid MALDIESI-FT-ICR-MS was
used for high mass resolution analysis The instrument was operated in ESI negative and positive
ionisation modes with TD acquisition = 1M mz 200-2000 or 4M mz 5375-3000 providing mass
resolutions of 260000 and 140000 at mz 400 respectively and ESI positive ionization mode The
system was calibrated using an external calibration of ESI-TOF low concentration Tune Mix
(Agilent Technologies Santa Clara CA USA) Samples were infused at a rate of 2 microL min-1 using
the syringe pump a total of 10-20 scans were collected and averaged to generate mass spectra
The following general instrument conditions were set capillary voltage negative mode = 4200 V
and positive mode = -4000 V drying gas flow 40 L min-1 drying gas temperature 180degC
nebulizer gas flow rate 10 bar source accumulation 0001 sec ion accumulation 05 sec ion
cooling time 001 sec flight time 0001 sec Data were analysed using the Bruker Compass Data
Analysis 42 (Build 3831) software
Unless otherwise indicated the mz values given refer to the base peak of on isotopologue series
Sample preparation for ESI-MS analysis
1 (NEt4)4(HNEt3)4[(PhSi)6(ctc)4]middotsolvate (untreated crystals)
3-4 large crystals of the compound prepared via synthetic method 1 were dissolved in a
minimum of DMF (lt1 mL) followed by dilution with acetone (10 mL) prior to analysis
2 (NEt4)4(HNEt3)4[(PhSi)6(ctc)4]middotsolvate crystals that had been immersed in boiling water
2 mg of crystals of the compound prepared via synthetic method 2 were boiled in
deionized water for 30 min then solution was kept at 60degC for 7 days then filtered the
crystals dried 3-4 large crystals were dissolved in a minimum of DMSO (lt1 mL) followed
by dilution with acetonitrile (10 mL)
3 (NEt4)4(HNEt3)4[(PhSi)6(ctc)4]middotsolvate soaked in aqueous CsBr
1 mg of large crystals prepared via synthetic method 2 was immersed in an aqueous CsBr
solution (30 mg in 2 mL water) for 3 days then filtered and dried 3-4 large crystals were
dissolved in DMF (1 mL) followed by dilution with acetonitrile (10 mL)
14
Results of ESI-MS analysis
1 (NEt4)4(HNEt3)4[(PhSi)6(ctc)4]middotsolvate (untreated crystals)
Figure S6 shows the full high resolution ESI mass spectrum in negative mode
Table S1 lists the dominant isotopologues in the full spectrum The relative intensities of
the base peaks within each of the isotopologue series are indicated as their percentage
contribution to the sum of the intensities of the base peaks in each of the isotopologue series
The error (in ppm) for each species is calculated based upon the monoisotopic peak for each
isotopologue series
Figure S7 shows a portion of the spectrum in which a series of dianionic cage adducts are
indicated Figure S8 shows an enlargement of the signal corresponding to [cage + (NEt4)4]2- and a
comparison with the calculated pattern An enlargement of the signal corresponding to [cage +
(NEt4)3]3- and a comparison with the calculated pattern is displayed in Figure S9
15
Figure S6 Full ESI-mass spectrum in negative mode of samples obtained from the dissolution of (NEt4)4(HNEt3)4[(PhSi)6(ctc)4]middotsolvate crystals
656106631-
820946233-
1296490462-
1479551682-
500 1000 1500 2000 2500 mz0
1
2
3x10⁹Intensity
4
16
Table S1 Selected negative ionisation mode mass spectrum data for untreated crystals
mz (monoisotopic
peak)
mz (base peak) Charge Species Mass Error (ppm)
62607767 62807517 -1 - 49364402513 64402513 -1 - 198
65410885 65610663 -1 - 662
81093470 81160256 -3 [cage + (Et4N)2(HNEt3)]3- 212 157
82027857 82094623 -3 [cage + (Et4N)3]3- 223 109483320603 83320603 -1 - 104
88062603 88162843 -3 - 1094
94231547 94298363 -3 - 15
102022131 102221970 -1 - 109
126746585 126846409 -2 [cage + (Et4N)2(HNEt3)2]2- 199 129
128147736 128247689 -2 [cage + (Et4N)3(HNEt3)]2- -126 1108
129549110 129649046 -2 [cage + (Et4N)4]2- -272 37
131600693 131700842 -2 [cage + (Et4N)4 + MeCN]2- -074 259
133202091 133302389 -2 [cage + (Et4N)4 + DMF]2- -008 433
133239625 133391475 -2 - 141
146453513 146553452 -2 - 436
147854996 147955168 -2 - 62
158309263 158459398 -2 - 104
Figure S7 ESI-mass spectrum in negative mode of the peaks associated with [cage + (Et4N)4]2- at mz 129649046 [cage + (Et4N)3 + (Et3NH)]2- at mz 128247896 and [cage + (Et4N)2 + (Et3NH)2]2- at mz 126846409 from the dissolution of [(NEt4)4(HNEt3)4[(PhSi)6(ctc)4]middotsolvate crystals
17
Figure S8 ESI-mass spectrum in negative mode of the peaks associated with [cage + (Et4N)4]2- at mz 129649046 from the dissolution of [(NEt4)4(HNEt3)4[(PhSi)6(ctc)4]middotsolvate crystals
129549110
129599073129649046
129699036
129749030
129799091129849193
129899429
129549463
129599601129649699
129699781
129749853
129799920129849983
129900046
Calculated for [(C21H12O6)4(C6H5Si)6(C8H20N)4]2-
mz 129649699Error = -272 ppm mSigma = 170
1
2
3Intensity x109
0
1
2
3
4
1295 1296 1297 1298 1299 1300 mz
4
Intensity x109
Obtained for [(C21H12O6)4(C6H5Si)6(C8H20N)4]2-
mz 129649046
18
Figure S9 ESI-mass spectrum in negative mode of the peaks associated with [cage + (Et4N)3]3- at mz 82094623 (base peak) from the dissolution of (NEt4)4(HNEt3)4[(PhSi)6(ctc)4]middotsolvate crystals
2 (NEt4)4(HNEt3)4[(PhSi)6(ctc)4]middotsolvate crystals that had been immersed in boiling water
Figure S10 shows the full negative mode high resolution ESI mass spectrum obtained for
crystals of the compound boiled in water then dissolved in dimethylsulfoxide and diluted with
acetonitrile The dominant peak in the spectrum corresponds to [cage + (Et4N)3]3- at mz 820
82094461 Additionally there is a significant peak corresponding to [cage + (Et4N)2]4- at mz
58316930
Table S2 lists the dominant isotopologues in the full spectrum The relative intensities of
the base peaks within each of the isotopologue series are indicated as their percentage
contribution to the sum of the intensities of the base peaks in each of the isotopologue series
The error (in ppm) for each species is calculated based upon the monoisotopic peak for each
isotopologue series
82027857
8206125282094623
82127980
82161346
8219470882228104
82261505
82027674
8206109982094495
82127880
82161259
8219463582228008
82261382
Calculated for [(ctc)4(C6H5Si)6(C8H20N)3]3-
mz 82094495Error = 223 ppm
mSigma = 102
02
04
06
08
10
12
Intensity x109
00
02
04
06
08
10
12
8200 8205 8210 8215 8220 8225 8230 8235 mz
Intensity x109
Obtained for [(ctc)4(C6H5Si)6(C8H20N)3]3-
mz 82094623
19
Figure S10 Full negative mode mass spectrum of the crystals that had been boiled in water prior to being dissolved in DMSO and diluted with MeCN
583169304-
820944613-
959016973-
1335511022-
200 400 600 800 1000 1200 1400 1600 1800 mz
02
04
06
08
10
Intensity x109
20
Table S2 Selected negative ionisation mode mass spectrum data for crystals boiled in water prior to being dissolved in DMSO and diluted with MeCN
mz (monoisotopic
peak)
mz (base peak) Charge Species Mass Error
(ppm)
52588164 52513325 -4 - 114
55012908 55037984 -4 - 115
57566102 57591153 -4 [cage + (Et4N)(HNEt3)]4- 181 428
58266875 58316930 -4 [cage + (Et4N)2]4- 163 1467
64190823 64215815 -4 - 76
57538082 57563061 -4 - 45
74322912 74356421 -3 - 253
76572434 76622586 -2 - 188
81093427 81122759 -3 [cage + (Et4N)2(HNEt3)]3- 159 427
82027674 82094461 -3 [cage + (Et4N)3]3- 000 4449
94231837 94298549 -3 - 302
95834956 95901697 -3 - 703
126634775 126734243 -2 [cage +(Et4N)(HNEt3)Na2]2- + DMSO + 2MeCN + H2O -1505 006
128142767 128192988 -2 [cage + (Et4N)3(HNEt3)]2- -4004 05
129549463 129599949 -2 [cage + (Et4N)4]2- 000 077
131601536 131701879 -2 [cage + (Et4N)4 + MeCN]2- 567 083
133500905 133551102 -2 - 127 indicates assignment of species where large mass error may be attributable to overlapping peaks in the mass spectrum
21
3 Analysis of (NEt4)4(HNEt3)4[(PhSi)6(ctc)4]middotsolvate soaked in CsBr
Figure S11 shows the full negative mode high resolution ESI mass spectrum of the sample
obtained for crystals of the compound that had been immersed in an aqueous CsBr solution then
dissolved in dimethylformamide and diluted with acetonitrile Overlapping isotopic profiles of
the cage with caesium and tetraethylammonium cations reflect the similarity in the mass of Cs+
and NEt4+
Table S3 lists the dominant isotopologues in the full spectrum The relative intensities of
the base peaks within each of the isotopologue series are indicated as their percentage
contribution to the sum of the intensities of the base peaks in each of the isotopologue series
The error (in ppm) for each species is calculated based upon the monoisotopic peak for each
isotopologue series
Figure S11 Full negative mode mass spectrum of the crystals soaked in aqueous CsBr solution followed by dissolution in DMF and dilution with MeCN
583610534-
821867643-
1317395382-
200 400 600 800 1000 1200 1400 1600 1800 mz00
05
10
15
Intensity x109
22
Table S3 Selected negative ionisation mode mass spectrum data for crystals soaked in aqueous CsBr solution followed by dissolution in DMF and dilution with MeCN
mz (monoisotopic
peak)
mz (base peak) Charge Species
Mass Error (ppm)
58335201 58360465 -4 [cage + (Et4N)Cs]4- -388 11
65818834 65868071 -4 - 1
66672091 66721334 -4 - 09
80449608 80516206 -3 - 1
80981919 81048446 -3 [cage + (Et4N)CsNa + DMF]3- -062 114
82027674 82061027 -3 [cage + (Et4N)3]3- 000 34
82118882 82185240 -3 [cage + (Et4N)2Cs]3- -392 148
82210659 82243943 -3 [cage + (Et4N)Cs2]3- -090 24
84554184 84587536 -3 [cage + (Et4N)2Cs + DMF]3- -132 06
118127721 118227765 -2 - 04
124432811 124530638 -2 [cage + (Et4N)Na3 + 3DMF]2- 727 11
125479724 125577383 -2 [cage + (HNEt3)3Cs]2- -1863 04
126275663 126327346 -2 [cage + (Et4N)CsNa2 + 2DMF]2- 483 19
127847421 127944904 -2 [cage + (Et4N)3Na + DMF]2- 2980 33
127994562 128081415 -2 [cage + (Et4N)2CsNa + DMF]2- 10671 5
129131199 129230828 -2 - 17
129549463 129648253 -2 [cage + (Et4N)4]2- 000 109
129927040 130027425 -2 [cage + (Et4N)CsNa2 + 3DMF]2- -501 94
130835264 130934288 -2 [cage + (Et4N)2(HNEt3)2 + 2MeCN]2- -10488 55
131635977 131734789 -2 [cage + (Et4N)(HNEt3)2Na + 2DMF + MeCN + H2O]2- -6835 125
133342580 133441156 -2 [cage + (Et4N)3Cs + DMF]2- 2389 115
indicates assignment of species where large mass error may be attributable to overlapping peaks in the mass spectrum
23
Figure S12 Shows three overlapping isotopic profiles of [cage + (Et4N)3]3- at mz 82061027 [cage + (Et4N)2(Cs)]3- (most abundant) at mz 82185240 and [cage + (Et4N)(Cs)2]3- at mz 822
S9 Infra-red spectroscopy
Infra-red spectrum (NEt4)4(HNEt3)4[(PhSi)6(ctc)4]Br2middotsolvate (pressed KBr disc)
IR(KBr) cm-1 3431 3065 3025 2984 2918 2854 1619 1498 1384 1277 1254 1171 1119 938 890 858 738 704 672 612 521
The infra-red spectrum of (NEt4)4(HNEt3)4[(PhSi)6(ctc)4]Br2middotsolvate (pressed KBr disc) is presented in Figure S16
Infra-red spectrum of crystal after soaking in aqueous CsBr (pressed KBr disc)
IR(KBr) cm-1 3427 3065 3024 2982 2925 2860 1658 1619 1498 1384 1277 1253 1170 1117 1000 937 890 858 738 704 610 521
820276743-
820610273- 82094337
3- 82118882
821521273- 82185240
3-
822185803-
822522393-
822773243-
8205 8210 8215 8220 8225 8230 mz00
05
10
15
3-
Intensity x109
822439433-
24
4009001400190024002900340039000
01
02
03
04
05
06
07
08
09
FTIR of (NEt4)4(HNEt3)4[(PhSi)6(ctc)4]Br2middotsolvate - (KBr Disc)
Wavenumbers (cm-1 )
Tran
smis
sion
()
Figure S13 Infrared spectrum of (NEt4)4(HNEt3)4[(PhSi)6(ctc)4]Br2middotsolvate (pressed KBr disc)
25
S10 References for ESI
1 A Spek Acta Cryst Sect C 2015 71 9-18
2 A Spek Acta Cryst Sect D 2009 65 148-155
3 G Sheldrick Acta Cryst Sect A 2015 71 3-8
4 G Sheldrick Acta Cryst Sect C 2015 71 3-8
5 L Farrugia J Appl Cryst 2012 45 849-854
6 O V Dolomanov L J Bourhis RJ Gildea J A K Howard and H Puschmann J Appl Cryst 2009 42 339-341
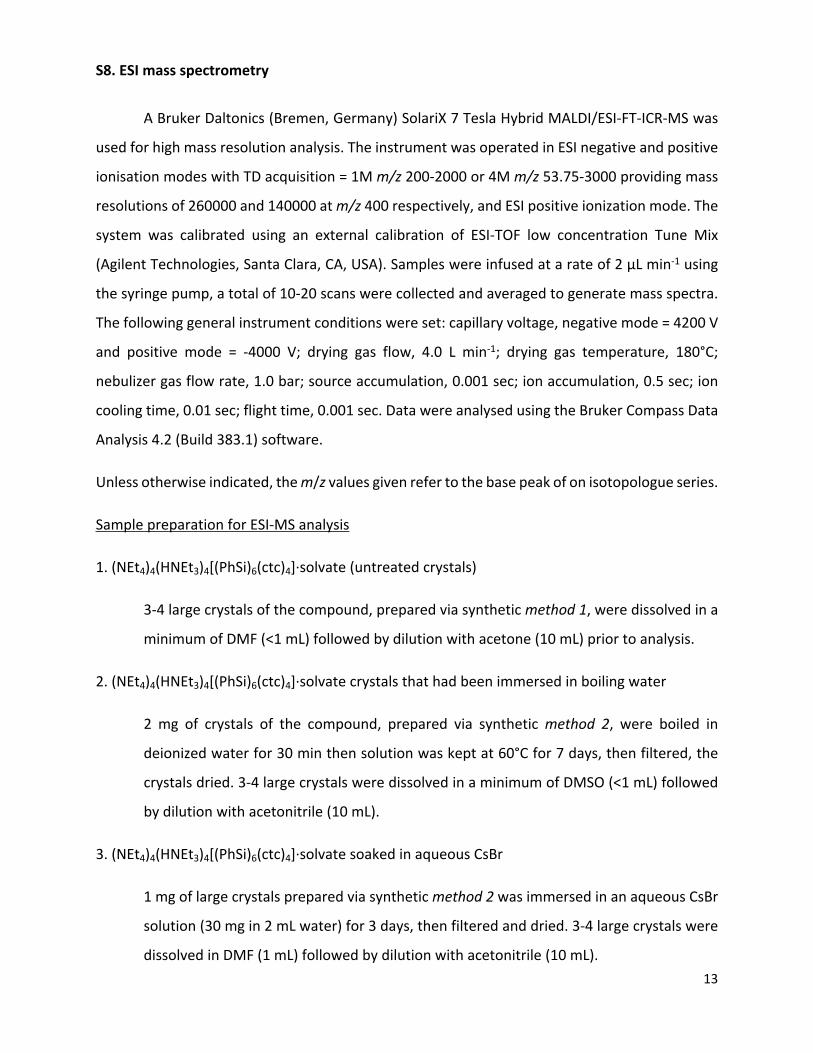
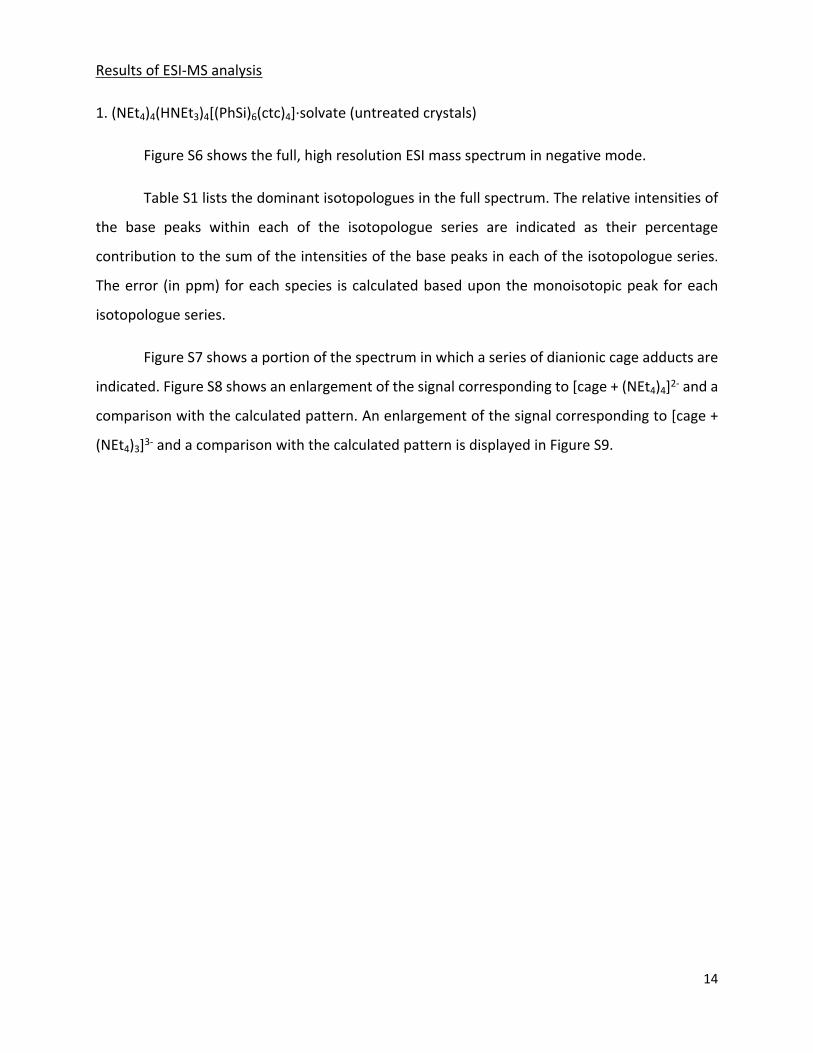
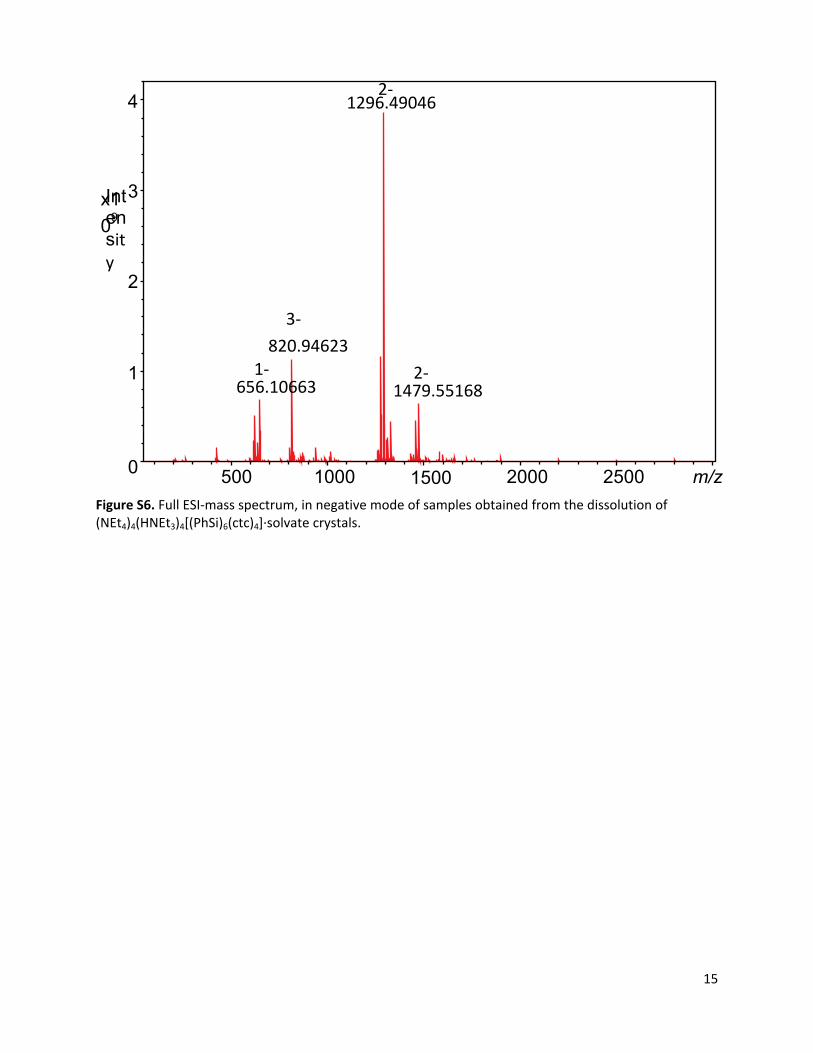
15
Figure S6 Full ESI-mass spectrum in negative mode of samples obtained from the dissolution of (NEt4)4(HNEt3)4[(PhSi)6(ctc)4]middotsolvate crystals
656106631-
820946233-
1296490462-
1479551682-
500 1000 1500 2000 2500 mz0
1
2
3x10⁹Intensity
4
16
Table S1 Selected negative ionisation mode mass spectrum data for untreated crystals
mz (monoisotopic
peak)
mz (base peak) Charge Species Mass Error (ppm)
62607767 62807517 -1 - 49364402513 64402513 -1 - 198
65410885 65610663 -1 - 662
81093470 81160256 -3 [cage + (Et4N)2(HNEt3)]3- 212 157
82027857 82094623 -3 [cage + (Et4N)3]3- 223 109483320603 83320603 -1 - 104
88062603 88162843 -3 - 1094
94231547 94298363 -3 - 15
102022131 102221970 -1 - 109
126746585 126846409 -2 [cage + (Et4N)2(HNEt3)2]2- 199 129
128147736 128247689 -2 [cage + (Et4N)3(HNEt3)]2- -126 1108
129549110 129649046 -2 [cage + (Et4N)4]2- -272 37
131600693 131700842 -2 [cage + (Et4N)4 + MeCN]2- -074 259
133202091 133302389 -2 [cage + (Et4N)4 + DMF]2- -008 433
133239625 133391475 -2 - 141
146453513 146553452 -2 - 436
147854996 147955168 -2 - 62
158309263 158459398 -2 - 104
Figure S7 ESI-mass spectrum in negative mode of the peaks associated with [cage + (Et4N)4]2- at mz 129649046 [cage + (Et4N)3 + (Et3NH)]2- at mz 128247896 and [cage + (Et4N)2 + (Et3NH)2]2- at mz 126846409 from the dissolution of [(NEt4)4(HNEt3)4[(PhSi)6(ctc)4]middotsolvate crystals
17
Figure S8 ESI-mass spectrum in negative mode of the peaks associated with [cage + (Et4N)4]2- at mz 129649046 from the dissolution of [(NEt4)4(HNEt3)4[(PhSi)6(ctc)4]middotsolvate crystals
129549110
129599073129649046
129699036
129749030
129799091129849193
129899429
129549463
129599601129649699
129699781
129749853
129799920129849983
129900046
Calculated for [(C21H12O6)4(C6H5Si)6(C8H20N)4]2-
mz 129649699Error = -272 ppm mSigma = 170
1
2
3Intensity x109
0
1
2
3
4
1295 1296 1297 1298 1299 1300 mz
4
Intensity x109
Obtained for [(C21H12O6)4(C6H5Si)6(C8H20N)4]2-
mz 129649046
18
Figure S9 ESI-mass spectrum in negative mode of the peaks associated with [cage + (Et4N)3]3- at mz 82094623 (base peak) from the dissolution of (NEt4)4(HNEt3)4[(PhSi)6(ctc)4]middotsolvate crystals
2 (NEt4)4(HNEt3)4[(PhSi)6(ctc)4]middotsolvate crystals that had been immersed in boiling water
Figure S10 shows the full negative mode high resolution ESI mass spectrum obtained for
crystals of the compound boiled in water then dissolved in dimethylsulfoxide and diluted with
acetonitrile The dominant peak in the spectrum corresponds to [cage + (Et4N)3]3- at mz 820
82094461 Additionally there is a significant peak corresponding to [cage + (Et4N)2]4- at mz
58316930
Table S2 lists the dominant isotopologues in the full spectrum The relative intensities of
the base peaks within each of the isotopologue series are indicated as their percentage
contribution to the sum of the intensities of the base peaks in each of the isotopologue series
The error (in ppm) for each species is calculated based upon the monoisotopic peak for each
isotopologue series
82027857
8206125282094623
82127980
82161346
8219470882228104
82261505
82027674
8206109982094495
82127880
82161259
8219463582228008
82261382
Calculated for [(ctc)4(C6H5Si)6(C8H20N)3]3-
mz 82094495Error = 223 ppm
mSigma = 102
02
04
06
08
10
12
Intensity x109
00
02
04
06
08
10
12
8200 8205 8210 8215 8220 8225 8230 8235 mz
Intensity x109
Obtained for [(ctc)4(C6H5Si)6(C8H20N)3]3-
mz 82094623
19
Figure S10 Full negative mode mass spectrum of the crystals that had been boiled in water prior to being dissolved in DMSO and diluted with MeCN
583169304-
820944613-
959016973-
1335511022-
200 400 600 800 1000 1200 1400 1600 1800 mz
02
04
06
08
10
Intensity x109
20
Table S2 Selected negative ionisation mode mass spectrum data for crystals boiled in water prior to being dissolved in DMSO and diluted with MeCN
mz (monoisotopic
peak)
mz (base peak) Charge Species Mass Error
(ppm)
52588164 52513325 -4 - 114
55012908 55037984 -4 - 115
57566102 57591153 -4 [cage + (Et4N)(HNEt3)]4- 181 428
58266875 58316930 -4 [cage + (Et4N)2]4- 163 1467
64190823 64215815 -4 - 76
57538082 57563061 -4 - 45
74322912 74356421 -3 - 253
76572434 76622586 -2 - 188
81093427 81122759 -3 [cage + (Et4N)2(HNEt3)]3- 159 427
82027674 82094461 -3 [cage + (Et4N)3]3- 000 4449
94231837 94298549 -3 - 302
95834956 95901697 -3 - 703
126634775 126734243 -2 [cage +(Et4N)(HNEt3)Na2]2- + DMSO + 2MeCN + H2O -1505 006
128142767 128192988 -2 [cage + (Et4N)3(HNEt3)]2- -4004 05
129549463 129599949 -2 [cage + (Et4N)4]2- 000 077
131601536 131701879 -2 [cage + (Et4N)4 + MeCN]2- 567 083
133500905 133551102 -2 - 127 indicates assignment of species where large mass error may be attributable to overlapping peaks in the mass spectrum
21
3 Analysis of (NEt4)4(HNEt3)4[(PhSi)6(ctc)4]middotsolvate soaked in CsBr
Figure S11 shows the full negative mode high resolution ESI mass spectrum of the sample
obtained for crystals of the compound that had been immersed in an aqueous CsBr solution then
dissolved in dimethylformamide and diluted with acetonitrile Overlapping isotopic profiles of
the cage with caesium and tetraethylammonium cations reflect the similarity in the mass of Cs+
and NEt4+
Table S3 lists the dominant isotopologues in the full spectrum The relative intensities of
the base peaks within each of the isotopologue series are indicated as their percentage
contribution to the sum of the intensities of the base peaks in each of the isotopologue series
The error (in ppm) for each species is calculated based upon the monoisotopic peak for each
isotopologue series
Figure S11 Full negative mode mass spectrum of the crystals soaked in aqueous CsBr solution followed by dissolution in DMF and dilution with MeCN
583610534-
821867643-
1317395382-
200 400 600 800 1000 1200 1400 1600 1800 mz00
05
10
15
Intensity x109
22
Table S3 Selected negative ionisation mode mass spectrum data for crystals soaked in aqueous CsBr solution followed by dissolution in DMF and dilution with MeCN
mz (monoisotopic
peak)
mz (base peak) Charge Species
Mass Error (ppm)
58335201 58360465 -4 [cage + (Et4N)Cs]4- -388 11
65818834 65868071 -4 - 1
66672091 66721334 -4 - 09
80449608 80516206 -3 - 1
80981919 81048446 -3 [cage + (Et4N)CsNa + DMF]3- -062 114
82027674 82061027 -3 [cage + (Et4N)3]3- 000 34
82118882 82185240 -3 [cage + (Et4N)2Cs]3- -392 148
82210659 82243943 -3 [cage + (Et4N)Cs2]3- -090 24
84554184 84587536 -3 [cage + (Et4N)2Cs + DMF]3- -132 06
118127721 118227765 -2 - 04
124432811 124530638 -2 [cage + (Et4N)Na3 + 3DMF]2- 727 11
125479724 125577383 -2 [cage + (HNEt3)3Cs]2- -1863 04
126275663 126327346 -2 [cage + (Et4N)CsNa2 + 2DMF]2- 483 19
127847421 127944904 -2 [cage + (Et4N)3Na + DMF]2- 2980 33
127994562 128081415 -2 [cage + (Et4N)2CsNa + DMF]2- 10671 5
129131199 129230828 -2 - 17
129549463 129648253 -2 [cage + (Et4N)4]2- 000 109
129927040 130027425 -2 [cage + (Et4N)CsNa2 + 3DMF]2- -501 94
130835264 130934288 -2 [cage + (Et4N)2(HNEt3)2 + 2MeCN]2- -10488 55
131635977 131734789 -2 [cage + (Et4N)(HNEt3)2Na + 2DMF + MeCN + H2O]2- -6835 125
133342580 133441156 -2 [cage + (Et4N)3Cs + DMF]2- 2389 115
indicates assignment of species where large mass error may be attributable to overlapping peaks in the mass spectrum
23
Figure S12 Shows three overlapping isotopic profiles of [cage + (Et4N)3]3- at mz 82061027 [cage + (Et4N)2(Cs)]3- (most abundant) at mz 82185240 and [cage + (Et4N)(Cs)2]3- at mz 822
S9 Infra-red spectroscopy
Infra-red spectrum (NEt4)4(HNEt3)4[(PhSi)6(ctc)4]Br2middotsolvate (pressed KBr disc)
IR(KBr) cm-1 3431 3065 3025 2984 2918 2854 1619 1498 1384 1277 1254 1171 1119 938 890 858 738 704 672 612 521
The infra-red spectrum of (NEt4)4(HNEt3)4[(PhSi)6(ctc)4]Br2middotsolvate (pressed KBr disc) is presented in Figure S16
Infra-red spectrum of crystal after soaking in aqueous CsBr (pressed KBr disc)
IR(KBr) cm-1 3427 3065 3024 2982 2925 2860 1658 1619 1498 1384 1277 1253 1170 1117 1000 937 890 858 738 704 610 521
820276743-
820610273- 82094337
3- 82118882
821521273- 82185240
3-
822185803-
822522393-
822773243-
8205 8210 8215 8220 8225 8230 mz00
05
10
15
3-
Intensity x109
822439433-
24
4009001400190024002900340039000
01
02
03
04
05
06
07
08
09
FTIR of (NEt4)4(HNEt3)4[(PhSi)6(ctc)4]Br2middotsolvate - (KBr Disc)
Wavenumbers (cm-1 )
Tran
smis
sion
()
Figure S13 Infrared spectrum of (NEt4)4(HNEt3)4[(PhSi)6(ctc)4]Br2middotsolvate (pressed KBr disc)
25
S10 References for ESI
1 A Spek Acta Cryst Sect C 2015 71 9-18
2 A Spek Acta Cryst Sect D 2009 65 148-155
3 G Sheldrick Acta Cryst Sect A 2015 71 3-8
4 G Sheldrick Acta Cryst Sect C 2015 71 3-8
5 L Farrugia J Appl Cryst 2012 45 849-854
6 O V Dolomanov L J Bourhis RJ Gildea J A K Howard and H Puschmann J Appl Cryst 2009 42 339-341
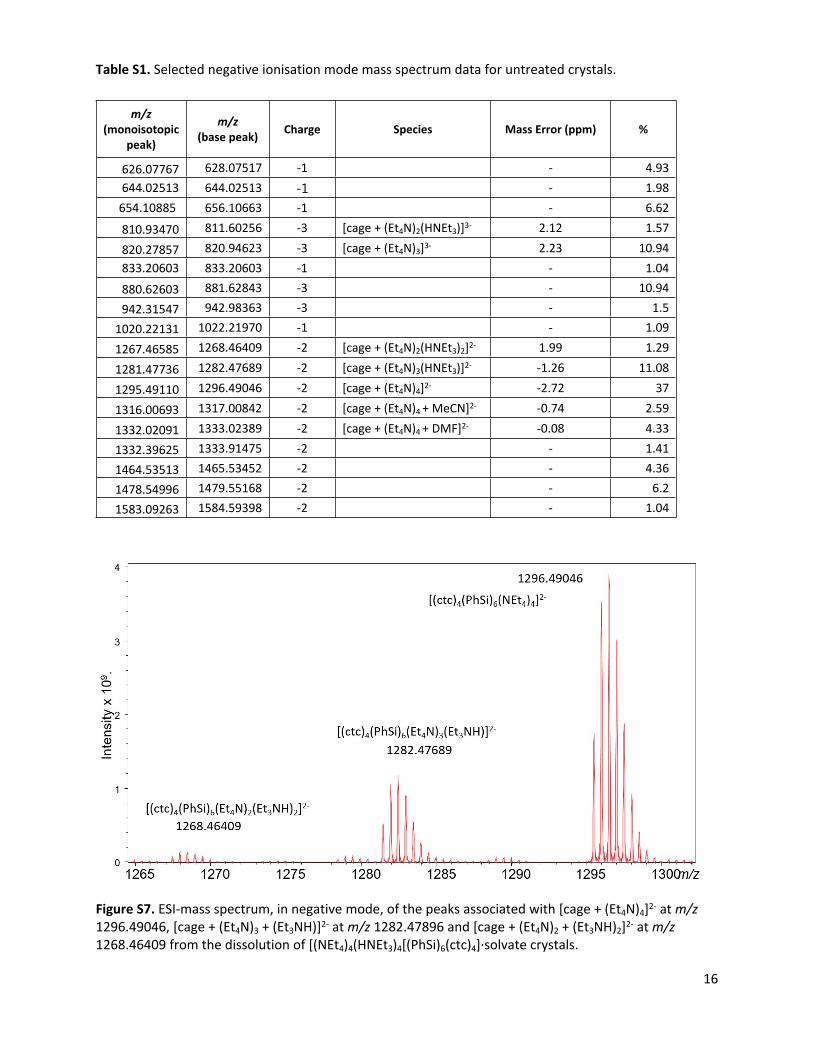
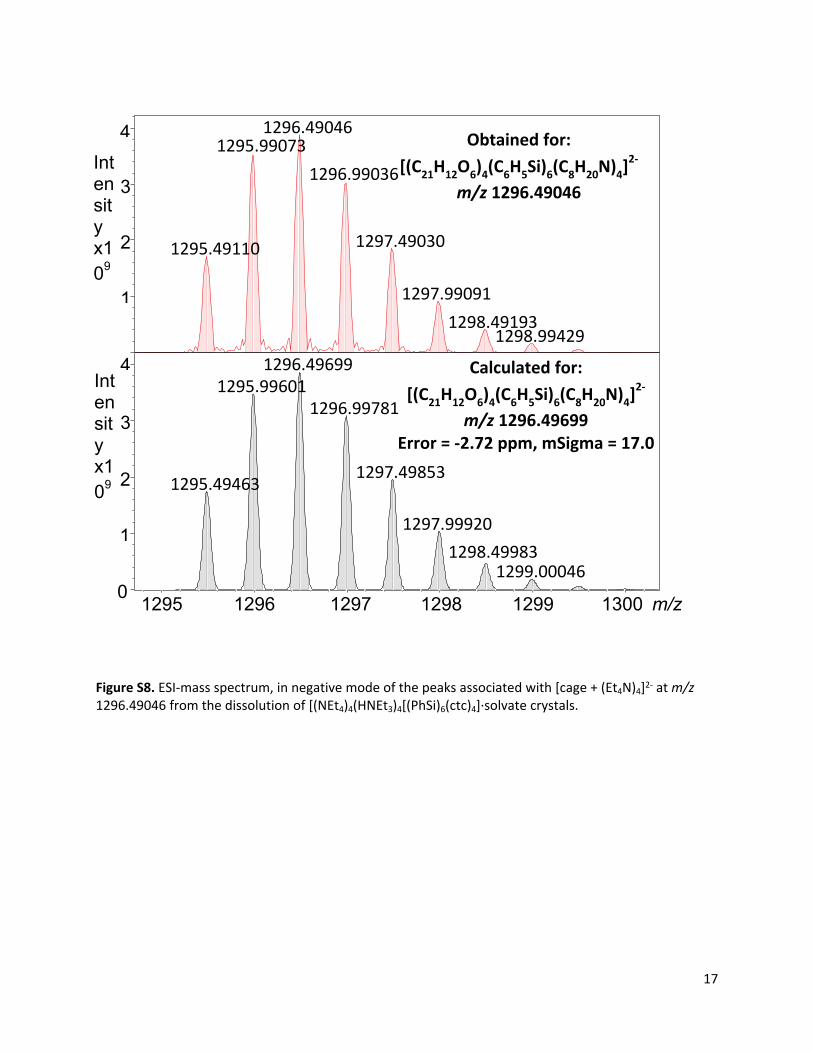
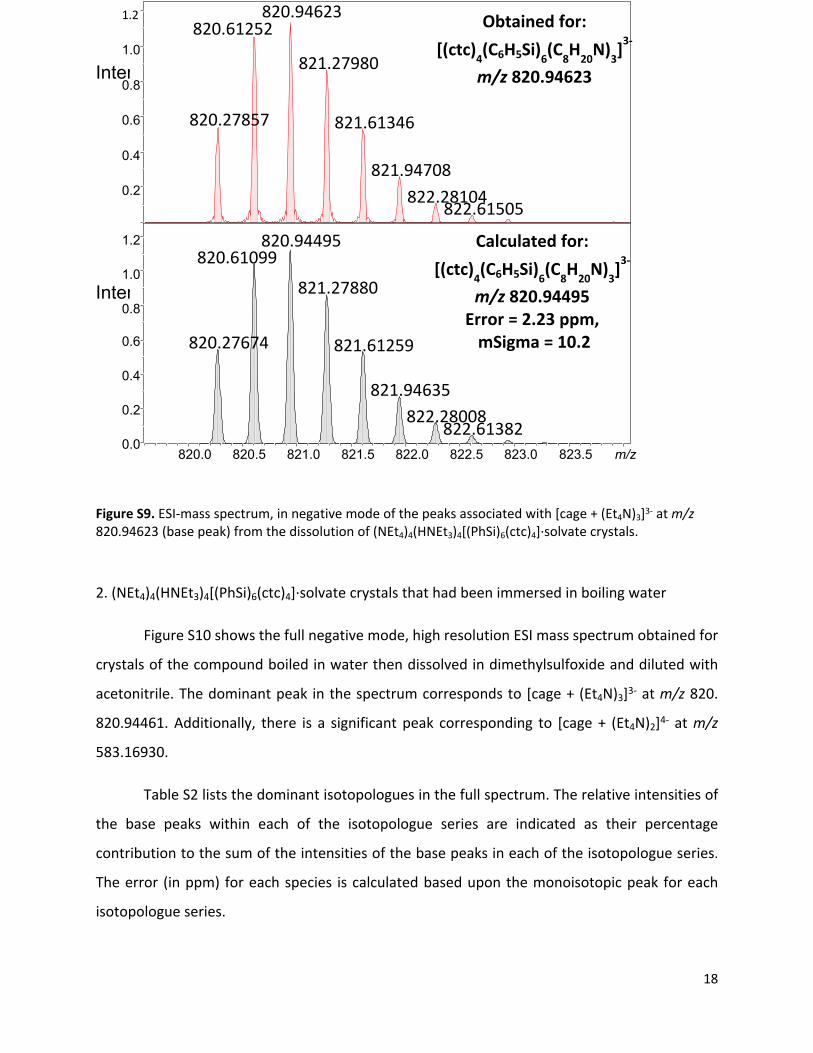
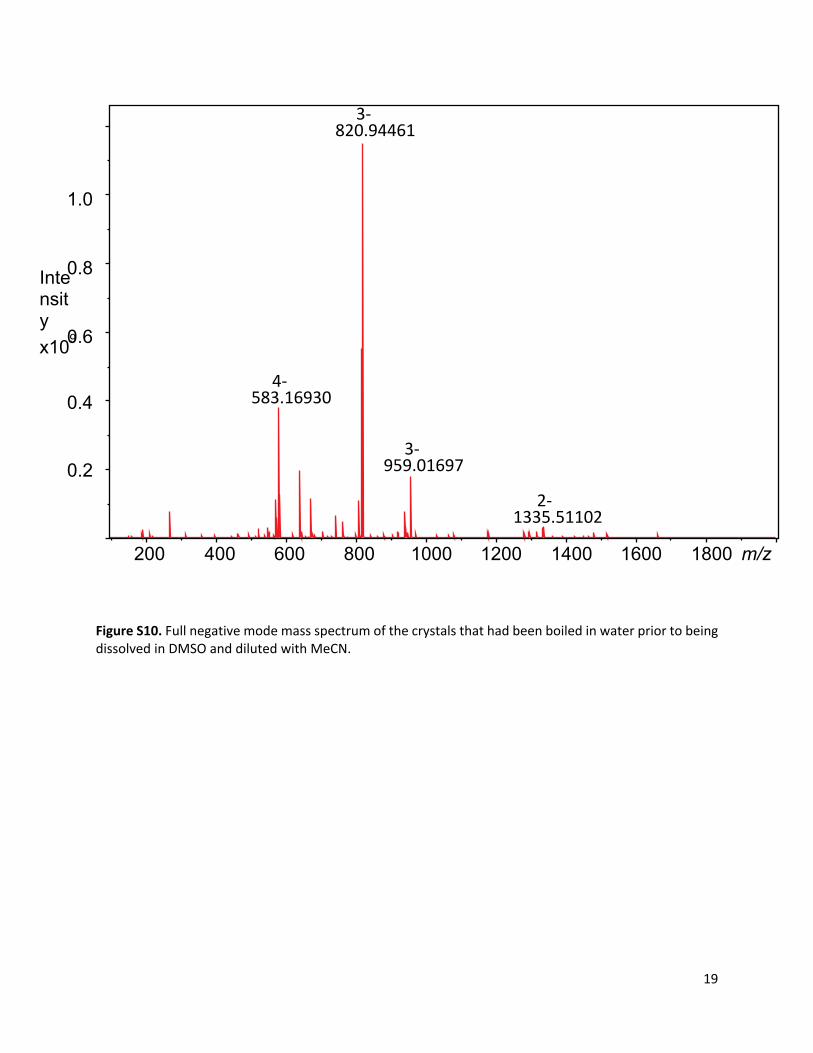
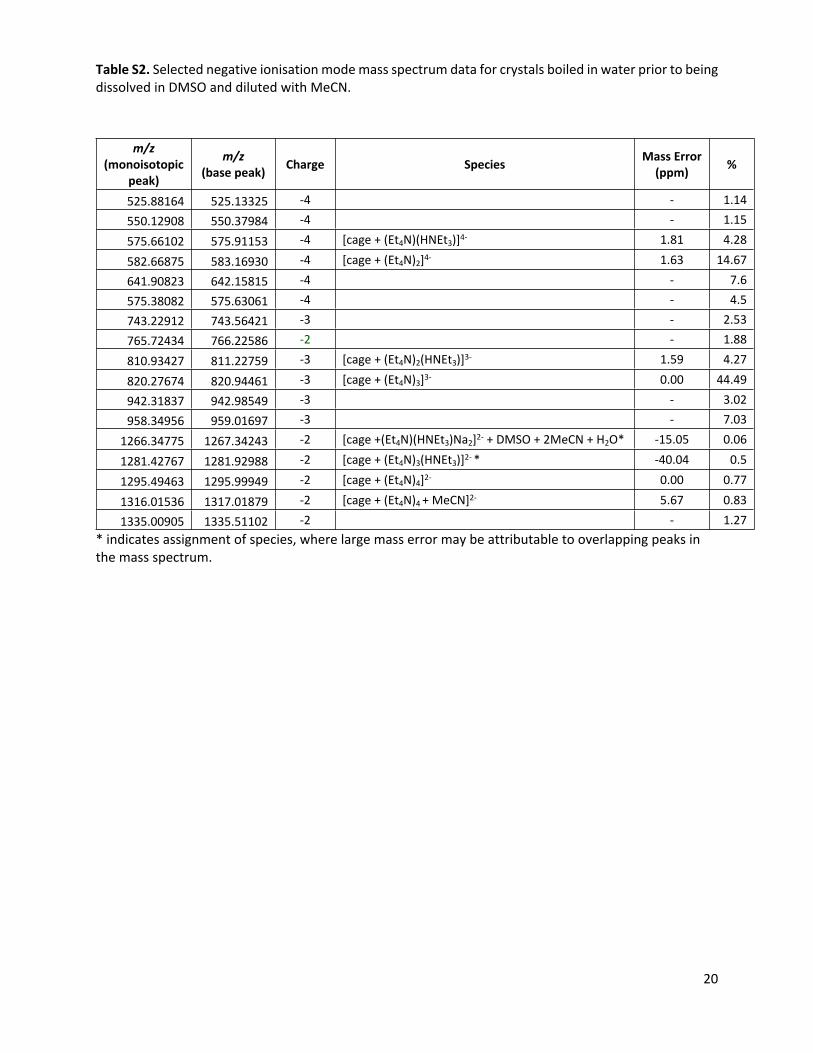
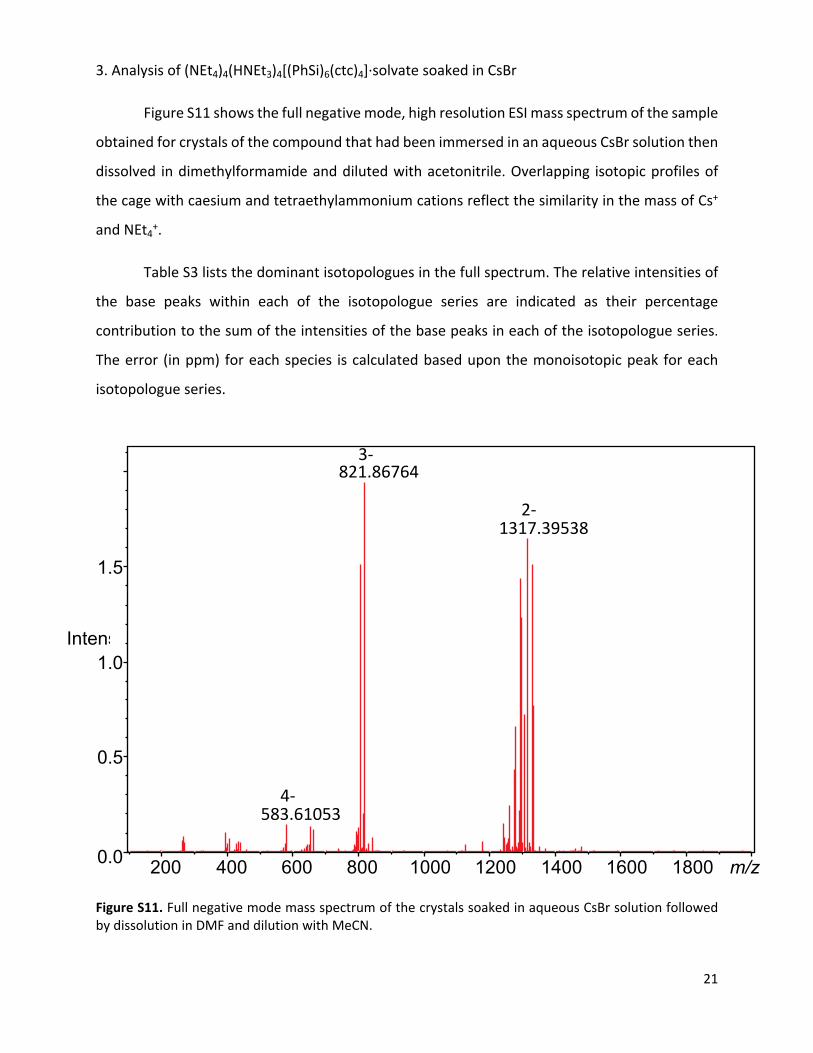
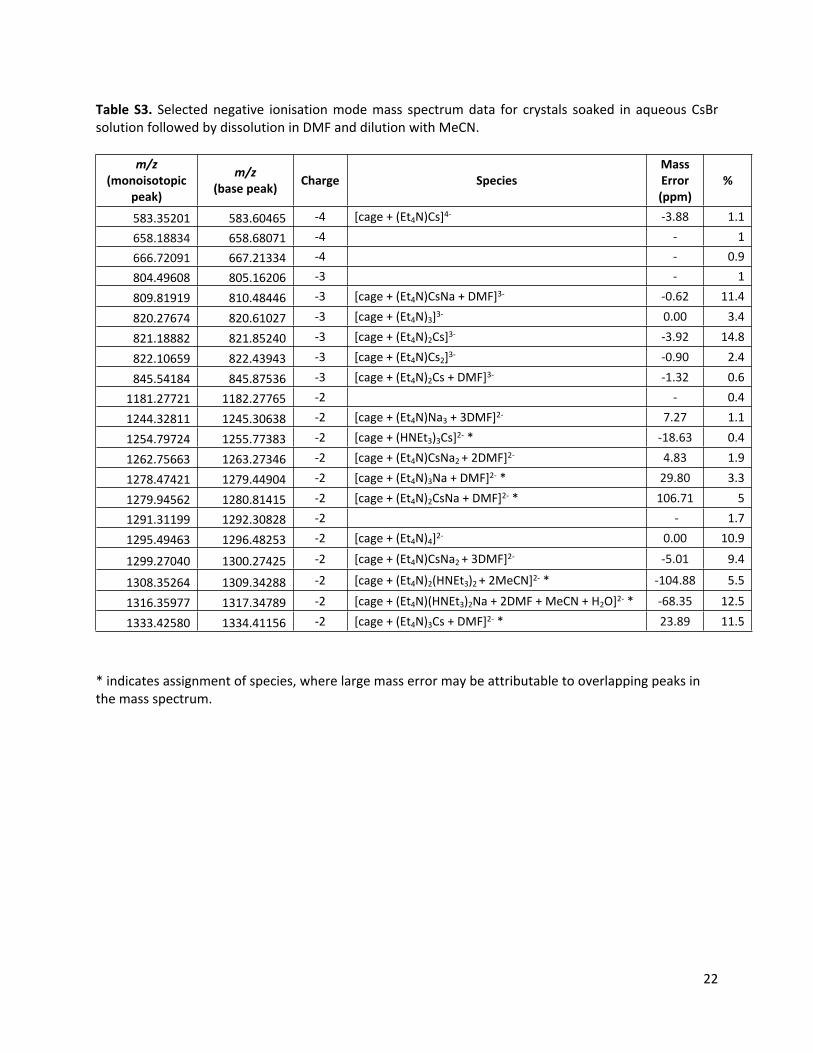
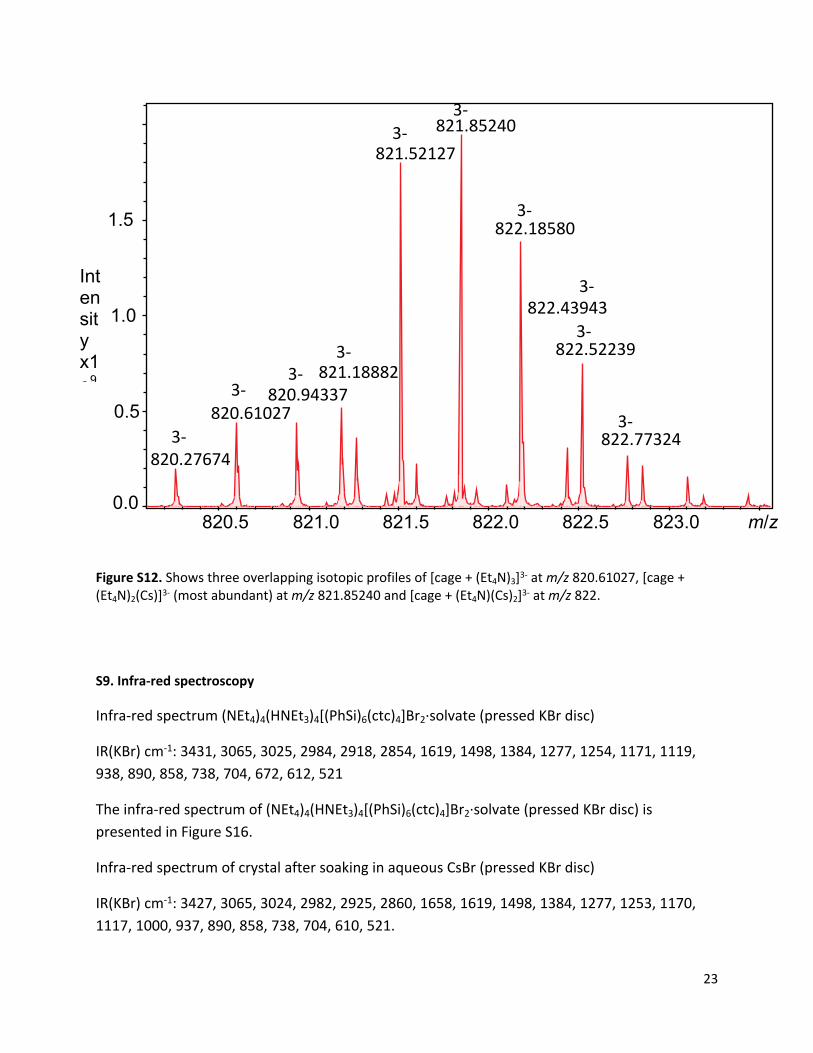
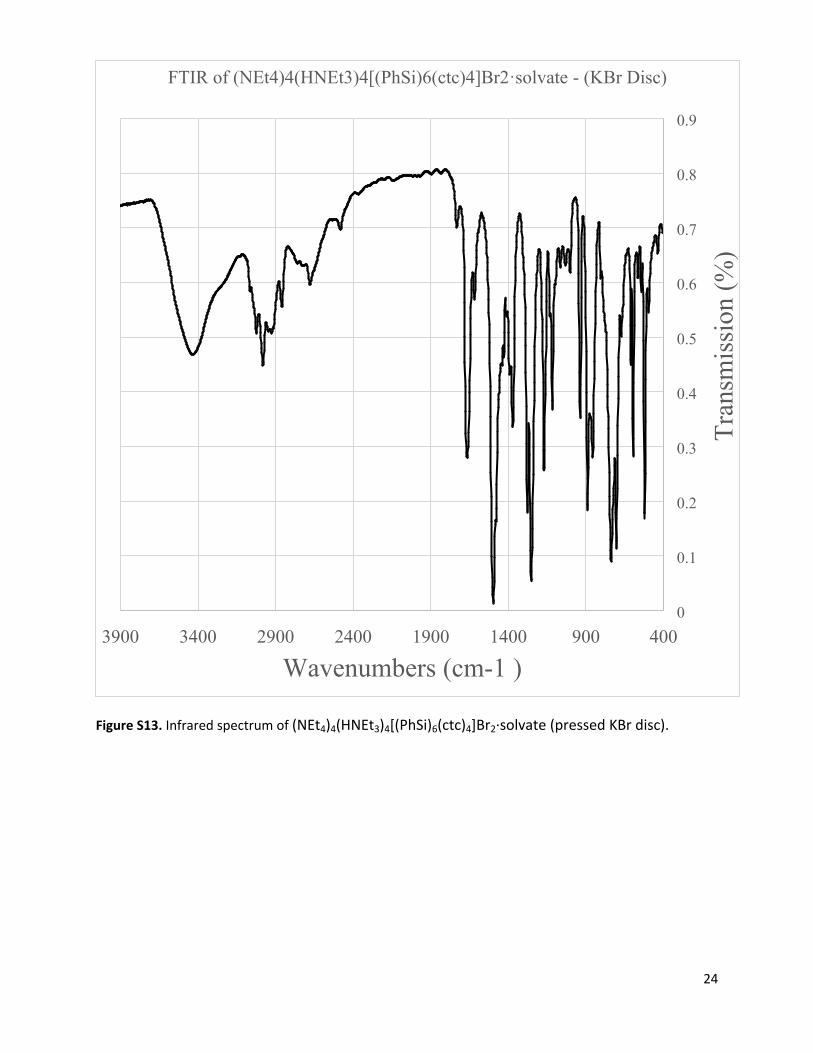