Embed Size (px)
Citation preview
8/11/2019 0804 Lit Man
http://slidepdf.com/reader/full/0804-lit-man 1/9A u g us t 2 0 0 4 I STRATEGIC FINANCE 3 1
Five Lessons from Return Driven StrategyB Y JO E L L I T M A N A N D M A R K L . F R I G O
Picture a business strategy expert.What characteristics come to mind?How does the person
behave?What schooling, certi fications, and work experience would this person have?
Now imagine a valuation expert in terms of characteristics, behavior, or background.
How does that person differ from the strategy expert?Is one more likely to have earned the CFA
(Chartered Financial Analyst) designation while the other an MBA degree?Is one more likely to be
a consultant and the other a money manager?
Cover Story
ANDStrategyWHEN
MEETValuation
8/11/2019 0804 Lit Man
http://slidepdf.com/reader/full/0804-lit-man 2/9
The goal of this exercise is to raise one signif icant
problem with what we conceive in these differing types of
expertise:There should be no disti nction. Great business
strategy and great business valuati ons requi re the same
discipline.
S K I L L S O F T H E B U S I N E S S S T R A T E G Y E X P E R TA true business strategy expert must have one firm goal
in mind that should drive all of his or her analysis and
decision making: helping the business maximize the cre-
ation of financial value. This overr iding concept is often
clouded because many other uses of the term “strategy”
are bandied about, such as “market strategy,” “channel
strategy,” “Internet strategy,” and a list that goes on and
on. Yet if we are to focus on true business strategy, then
we must also focus on the purpose of the business—to
generate more cash flow than the cash flow it uses up.
Any other concept would suggest strategy for something
other than a business, such as a hobby or a not-for-profit
organization with other delineated purposes. While those
organizations certainly require strategy, we would not
deem it business strategy .
Financial value maximization is an overriding tenet of business strategy. That means any expert in business
strategy must have a superior understanding of what
drives financial value creation in the first place. Such a
strategy expert must thoroughly understand the differ-
ences and nuances between relative valuations and dis-
counted cash flow analyses. That expert also must be able
to understand how any strategic initiative considered by a
company ultimately affects that company’s abili ty to gen-
erate financial value. In short, he or she must be an
expert in business valuations.
For instance, what effect would a new branding ini tia-
tive have on long-term sustainability of business returns?
How might a new partnership or innovation strategy cre-
ate value for the shareholders or owners of the existing
business?In what ways would an initiative to improve
execution, such as use of the balanced scorecard, drive
future return on investment (ROI)?I f they are consider-
ing a publicly traded company, how wil l investors react to
any major strategy change or initiative?As higher valua-
tion is the goal of business strategy, any initiative consid-
ered must be credibly linked to its impact on long-termcash flow generation. Without this comprehension, how
could someone ever be called a “business strategy expert”
in the first place?The core valuation skills of any strategy
expert must go far beyond a rudimentary MBA-level
understanding of finance. Expertise in one area is a pre-
requisite for expertise in the other.
S K I L L S O F T H E B U S I N E S S V A L U A T I O N E XP E R TWhat are the necessary competencies of a business valua-
tion expert?If the valuation expert’s methodology favors a
relative valuation approach (using multiples like P/Es),
that person would need to understand the nuances of rel-
ative valuation calculations. He or she must fully under-
stand the potential impact of any particular business
initiative on valuation multiple expansion or compression.
Valuation multiples “expand” or increase as the expecta-
tions of a company’s future performance improve. Multi-
ples “compress” or decrease when forecasted financial
performance drops. On the other hand, if the valuation
expert prefers the discounted cash flow methodology, he
or she would need to understand how to adjust near-term
3 2 STRATEGIC FINANCE I A u g us t 2 0 0 4
THE RETURN DRIVEN STRATEGY INITIATIVE
The Return Driven Strategy Initiative is an ongoing research
study that has screened thousands of companies, public and
private, and identified, documented, and benchmarked the
strategic activities that separate the best performers from the
worst and what lies in between. Involving multiple avenues of
research and application and a consortium of academic and
professional research, it has resulted in the creation of the
Return Driven Strategy model (see Frigo and Litman, “What is
Return Driven Strategy?,” Strategic Finance , February 2002),
which describes the strategic activities great companies have
demonstrated over a sustained period of time.
Return Driven Strategy is a framework and set of guidelines
for evaluating, developing, and refining executable strategy that
is firmly aligned with the goal of maximizing financial value.
Mark L. Frigo and Joel Litman have led the ongoing academic,
clinical, and real-world research and development of the frame-
work over the last several years. The Return Driven Strategy
model is being used in the Center for Strategy, Execution, and
Valuation at DePaul University’s top-ranked MBA program and
Executive Seminars in Chicago. One of its key differentiators is
the use of CSFB HOLT’s ValueSearch database of cash flow
performance and valuations of tens of thousands of companies
in 20 or more countries.
Return Driven Strategy is being used successfully by execu-
tives in strategic planning retreats, at board meetings, as a plat-
form for balanced scorecard initiatives, and by investment
analysts. It has also been used successfully and adopted by pri-
vately held companies and nonprofit organizations. The Return
Driven Strategy model is the subject of articles, executive semi-
nars, and a forthcoming book.
8/11/2019 0804 Lit Man
http://slidepdf.com/reader/full/0804-lit-man 3/9
and long-term cash flow forecasts in meaningful ways
based on activities the business is engaging in today and
plans to engage in tomorrow.
For example, how would new spending in research and
development, while a near-term cash loss, lead to higher
valuations for a business long term?How might a new
employee benefits program lead to higher personnel per-formance, higher ROI, and thereby higher value creation
for shareholders?Regardless of the valuation approach, the
need to better understand strategic activities is paramount.
Any valuation expert must possess an intimate under-
standing of the strategies of the business being valued. He
or she must also be capable of linking those strategies back
to the valuation models by understanding the impact of
those activities on long-term financial performance.
W H E N S T R A T E G Y A N D V A L U A T I O N M E E TWhile disparate images of these two separate practition-
ers have existed, a convergence is finally forming. No one
can be at the top of his/her game at business strategy
without also having incredible mastery over the frame-
works of business valuation. The reverse holds true as
well . Any true business valuation expert must understand
the deep levels of strategic analysis regarding the busi-
nesses he/she is valuing.
Yet how many valuation practitioners really under-
stand competi tive strategy?How often do consultants,
tout ing themselves as “strategists,” fail to comprehend thecomplexities and errors inherent in the simple-looking
P/E mult iple or nuances of long-term forecasts in dis-
counted cash flow models?For this reason, strategy con-
sultants are often seen as being too “soft” and with
daydreamer mentalities. On the other hand, valuation
analysts are often perceived as having “black box” valua-
tions with r idiculously obtuse spreadsheets. We hear
them debate endlessly over “peer mult iples” or intricate
cost of capital calculations. Yet, if we listen into the con-
versations of true experts in valuation, we hear as much
discussion about business strategies as we do the frame-
works for valuing them.
Thankfully, the convergence of strategy and valuation is
occurring quickly. The Return Driven Strategy Initiative
(see sidebar), a research project designed to uncover these
insights, resulted in the creation of the Return Driven
Strategy framework, which is a set of tenets and founda-
tions that describe what business activities truly maximize
financial value over the long term. Here are five lessons
from Return Driven Strategy—a few of the insights that
stand at the convergence of strategy and valuation.
1. A great product seldom ensures a great business;
2. Being “different” is not core to strategy—it’s only a
by-product;
3. The difference between a great company and a great
stock;
4. Why monopolies are often not great stocks;
5. When and why growth isnot necessarily a good thing.To show you how these lessons apply,we include some
financial performance charts courtesy of CSFB HOLT,a
division of Credit Suisse First Boston. These charts dis-
play the financial performance of companies over long
periods of time—as much as two decades. They show
cash flow returns on investment (CFROI®—a registered
trademark in the U.S. and other countries (excluding the
U.K.) of Credit Suisse First Boston or i ts subsidiaries or
affiliates), adjusted for distor tions caused by flaws in
accounting information. The charts also show a compa-
ny’s real asset growth rate over time—how much capital a
business is putting to work over time. And they show rel-
ative total shareholder returns (RTSR) against an appro-
priate major market index. Taken together, this
information provides a lens into economic reality that
lets us better understand key issues in business strategy,
such as these five lessons.
What’s the Difference Between a Great Product anda Great Business?
One of the underlying myths held by the layperson in strat-egy and valuation is that companies with great products
that customers truly enjoy must also be great businesses.
Nothing could be further from the truth. Time and again,
many companies that produce offerings (products or ser-
vices) that people love are simultaneously terrible business-
es with low profitabili ty and poor returns on investment.
One example is BMW. The Bay Motoren Werk Group
produces vehicles that are one of the strongest brands with
consumers.Car and motorcycle enthusiasts recognize the
quality and innovation in BMW’s products.Yet detailed
financial performance analysis shows that BMW has had
trouble earning its cost of capital for more than a decade.
This puts BMW’s ROI distinctly below the average returns
of most major industrial companies globally (see Figure 1).
How is it possible that such great products can co-exist
in a business with such low profitability?Our research in
the Return Driven Strategy Initiative provides a basis for
understanding this seeming disconnect. If you view this
problem from a converged understanding of strategy and
valuation, the explanation must be grounded in both
qualitative and quantitative analysis.
A u g us t 2 0 0 4 I STRATEGIC FINANCE 3 3

8/11/2019 0804 Lit Man
http://slidepdf.com/reader/full/0804-lit-man 4/9
Our research showed that one of the goal tenets of any
business is “Fulfi ll Otherwise Unmet Customer Needs.”
As you examine how well BMW achieves this tenet, note
that each of these words is loaded with importance.
Do customers claim that BMW’s offerings fulfill their
needs?Ask a BMW driver, and the answer is probably
“yes.” The next question is “Are those needs otherwise
unmet?”—meaning that if BMW suddenly began charging
double for its 5-series cars, would consumers continue to
pay, seeing no suitable substitute?Here the answer would
probably be “no.” The problem for BMW is that, while its
offerings are superb, there are other ways for consumers to
suitably fulfill that need. That means that BMW maintains
li ttle in the way of pricing power, so it’s tougher for the
company to generate sustained profits throughout its lines
of offerings regardless of how great they may be. Of
course, this substitutability may not hold true for every
die-hard BMW customer,but i t has held true for enough
customers to make a difference, as BMW’s long-term,
below-average cash flow returns show. Unfortunately,as
many consumers see substitutes in Mercedes, Audi, and
other brands, BMW’s great product remains trapped by a
price point that has not been high enough above its pro-
duction costs to generate higher profits.
This leads to a deeper quantitative aspect of the analy-
sis. As long as suitable substi tutes exist in the minds of a
large enough customer base, even the “greatest” product
has little ability to combat pricing power—at least not
enough to allow BMW to price up its goods sufficiently
to deliver revenues to more than just adequately cover its
operating costs and capital investments. The benchmark
for this justification is a cash flow return on investment
3 4 STRATEGIC FINANCE I A u g us t 2 0 0 4
Panel I shows that BMW’s annual CFROI®
has ba rely achieved i ts cost of ca pita l ,
despite produ c ing vehic les and moto rcyc les
tha t peop le love. Though an impor tan t d is-t inction over the last few years shows a move
from a low ROI plateau to a higher one,
albeit sti l l an average industr ial return level
at best .
Panel I I shows that BM W has reinvested in
i ts asset base quite rapidly. Note th is re in-
vestment rate has been quite con s is tent
regardless of the cor respond ing cash f low
returns over t ime.
Panel I I I clearly highlights that growth
accompanied by poor cash f low returns does
l i t t le for stock pr ice. However, as cash f low
returns signif icantly increase in the last f ive
years , s tock per formance m oves upward
dramat ical ly .
CFROI® is a registered trademark in the United States
and other countr ies (exc lud ing the United Kingdom) of
Credit Suisse First Boston or its subsidiaries or affil iates.
Figure 1: CSFB HOLT Relative Wealth Chart —Historical Company PerformanceBMW (BMWG),Fiscal Years 1989-2003
Panel I: Historical Cash Flow Returns on Investment (CFROI®)
Panel II: Historical Growth Asset Growth Rate
Panel III: Relative Total Shareholder Returns Versus Major Market Index
CSFBHOLT
8/11/2019 0804 Lit Man
http://slidepdf.com/reader/full/0804-lit-man 5/9
calculation (CFROI). That calculation must be at least as
high as the opportunity cost of capital, a measure of how
well that capital could have been employed on average
elsewhere.This problem has persisted for BMW for more
than a decade, as you can see from Figure 1.
Being “ D if fe rent” Isn’t Core to S tra tegy… I t ’s Only aBy-Product.There is a too-common notion that being “different” is
core to business strategy. This idea holds that competi tive
strategy can be achieved only through different activities
producing different products. Our research shows that i t
does appear that companies with superior financial per-
formance truly tend to be “different” in the way
described, but was being different the goal of the high-
performing businesses or simply a natural by-product of
their activities?
Again we refer to an ever-important tenet of business
strategy. When companies create products and services
that fulfi ll consumers’ needs that would otherwise be
unmet, we see an incredible relationship with higher-
than-average cash flow returns on investment. In other
words, these companies, given the same relative level of
cash resources, are able to generate much higher levels of
profi t. Of course, the businesses wil l naturally look differ-
ent since they have unique business models, but this is far
more a natural by-product of fulfi ll ing other tenets of
business strategy and must never be considered the goal.
During the Internet bubble period, plenty of Internet
businesses looked extremely different, but they lacked
focus on customer needs and cash flow that can be de-
rived from fulf illing customer needs. Great companies—
A u g us t 2 0 0 4 I STRATEGIC FINANCE 3 5
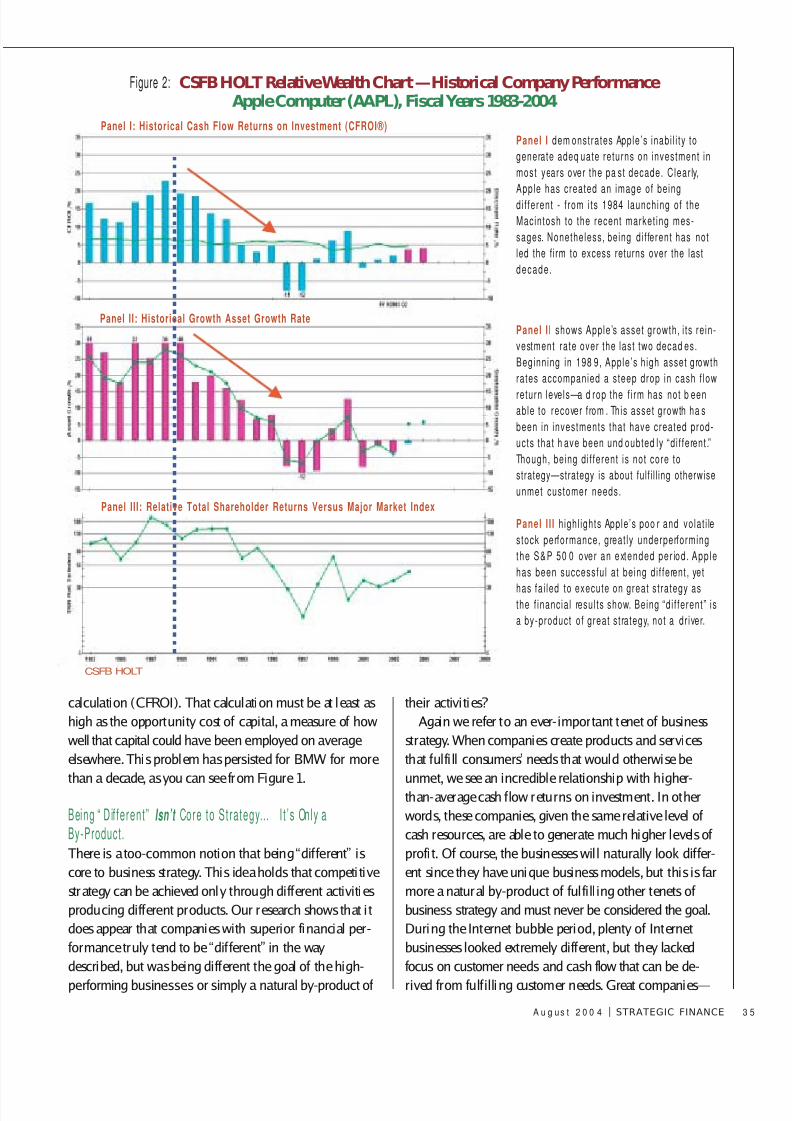
Panel I dem onstrates Apple’s inabi l i ty to
generate adeq uate returns on investment in
most years over the pa st decade. Clear ly,
Apple has created an image of being
dif ferent - f rom i ts 1984 launching of the
Macintosh to the recent market ing mes-
sages. Nonetheless, being di f ferent has not
led the f irm to excess returns over the last
decade.
Panel I I shows Apple’s asset growth, i ts re in-
vestment rate over the las t two decad es.
Beginning in 198 9, Apple’s h igh asset growth
rates accompanied a s teep drop in cash f low
return levels—a d rop the f i rm has not b eenable to recover f rom . This asset growth ha s
been in investments that have created prod-
ucts that h ave been und oubted ly “d i f ferent .”
Though, being di f ferent is not core to
strategy—strategy is about fulf i l l ing otherwise
unmet customer needs.
Panel I I I highl ights Apple’s poo r and volat i le
s tock performance, great ly underperforming
the S&P 50 0 over an extended per iod . App le
has been successful at being di f ferent , yet
has fa i led to execute on great s t rategy asthe f inanc ial results show. Being “di f ferent” is
a by-product of great s t rategy, not a dr iver.
Figure 2: CSFB HOLT Relative Wealth Chart —Historical Company PerformanceApple Computer (AAPL),Fiscal Years 1983-2004
Panel I: Historical Cash Flow Returns on Investment (CFROI®)
Panel II: Historical Growth Asset Growth Rate
Panel III: Relative Total Shareholder Returns Versus Major Market Index
CSFBHOLT
8/11/2019 0804 Lit Man
http://slidepdf.com/reader/full/0804-lit-man 6/9
high performers—definitely do things differently, but
companies that are different are by no means necessarily
great performers. The first implies the latter, but the latter
by no means implies the first.
Apple Computer, Inc. is a company that projects itself
as being different. Like BMW,Apple’s offerings have some
of the most die-hard customers.Despite this difference,however, the company is unable to reach enough con-
sumers who would see no substi tute for Apple. That fail-
ure leads to what we see in Figure 2,a chart that shows
some incredibly poor performance in ROI and the subse-
quent effect on stock price over the last 10 years.
What’s the Difference Between a Great Company and aGreat Sto ck?You might ask why BMW has been a tremendous stock
over the last few years, outperforming major market
indices. The answer lies in another great insight when the
discipline of strategy converges with the world of valua-
tion: Great stocks are not always the most profitable busi-
nesses, and the most profitable businesses are not always
great stocks.
For about 10 years, BMW’s ROI hovered around a low
2%-4%. Suddenly, in the year 2000, an uptrend began
that has brought the business’s returns to cost of capital
levels for the first time in years.These levels approximate
merely corporate average levels. The key here isn’t the
absolute level but the dramatic change in returns andthereby a change in investors’ long-term expectations of
future financial performance.
This concept requires deeper investigation. Bill Miller
of Legg Mason is one of the most respected mutual fund
managers in the investment industry. His money manage-
ment skills and those of his team have delivered to their
investors market outperformance for 13 years straight.
On the heels of his 12th consecutive year of achieving
returns in the funds he managed that were superior to
the market indices, Mil ler commented in his 2002 fourth
quarter commentary:
The first duty of the investor or analyst is to figure out
what i s embedded in the pri ce, what i s discounted. The
fai lure to address that question is the main source of
the poor relat ive results of most money managers and
the general lack of value provided by the opinions of
analysts.
In BMW’s case, real annual performance changed dra-
matically,and the changes drove investors’ expectations.
The company’s cash flow generating abilities were much
lower years ago and higher in 2001, 2002, and 2003,
though sti ll relatively low—average at best. That change,
however, drove large valuation increases and stock market
outperformance. It ’s important to understand that this
didn’t result from BMW suddenly producing products
that people began to be happy with—customers have cer-
tainly been pleased for years. The result is from a change
in ROI level, even if it is only reaching an average levelnow.The dramatic change in longer-term expectations
has driven the stock’s incredible rise.
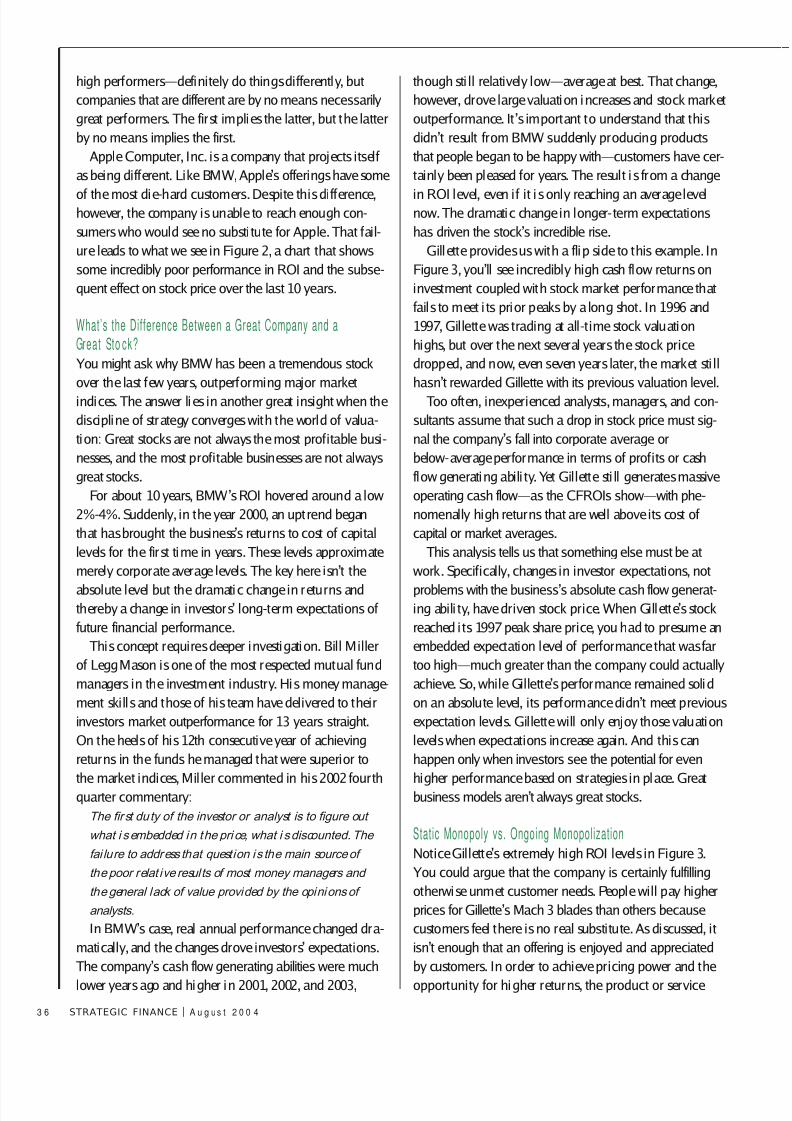
Gillette provides us with a flip side to this example. In
Figure 3, you’ll see incredibly high cash flow returns on
investment coupled with stock market performance that
fails to meet i ts prior peaks by a long shot. In 1996 and
1997, Gillette was trading at all-t ime stock valuation
highs, but over the next several years the stock price
dropped, and now, even seven years later, the market sti ll
hasn’t rewarded Gillette with its previous valuation level.
Too often, inexperienced analysts,managers, and con-
sultants assume that such a drop in stock price must sig-
nal the company’s fall into corporate average or
below-average performance in terms of profits or cash
flow generating abili ty. Yet Gillette sti ll generates massive
operating cash flow—as the CFROIs show—with phe-
nomenally high returns that are well above its cost of
capital or market averages.
This analysis tells us that something else must be at
work. Specifically, changes in investor expectations, not
problems with the business’s absolute cash flow generat-ing abili ty, have driven stock price. When Gillette’s stock
reached i ts 1997 peak share price, you had to presume an
embedded expectation level of performance that was far
too high—much greater than the company could actually
achieve. So, while Gillette’s performance remained solid
on an absolute level, its performance didn’t meet previous
expectation levels. Gillette will only enjoy those valuation
levels when expectations increase again. And this can
happen only when investors see the potential for even
higher performance based on strategies in place. Great
business models aren’t always great stocks.
Static Monopoly vs. Ongoing MonopolizationNotice Gillette’s extremely high ROI levels in Figure 3.
You could argue that the company is certainly fulfilling
otherwise unmet customer needs. People will pay higher
prices for Gillette’s Mach 3 blades than others because
customers feel there is no real substitute. As discussed, it
isn’t enough that an offering is enjoyed and appreciated
by customers. In order to achieve pricing power and the
opportunity for higher returns, the product or service
3 6 STRATEGIC FINANCE I A u g us t 2 0 0 4
8/11/2019 0804 Lit Man
http://slidepdf.com/reader/full/0804-lit-man 7/9
must be the only one that provides that particular enjoy-
ment or need fulfi llment. Gillette’s blades, among its oth-
er products, have that characteristic as its high cash flow
returns have exhibited year after year.
In fact, Gillette str ives to have product dominance on a
category-by-category basis, effectively creating monopolies
in the areas in which it competes. These economic monop-
olies are created by the uniqueness of the offerings and by
customers freely choosing those products over others.
So shouldn’t a monopoly be a great investment?
Wouldn’t an investor snatch up the chance to own part of
a business with offerings that lack substi tutes?Our
research shows that, despite monopoly-l ike cash flow
returns to the company, the company’s stock pr ice sti ll
dropped precipitously from 1996 to 2000. The stock’s
recovery over the last few years hasn’t made up for the
losses of that period.
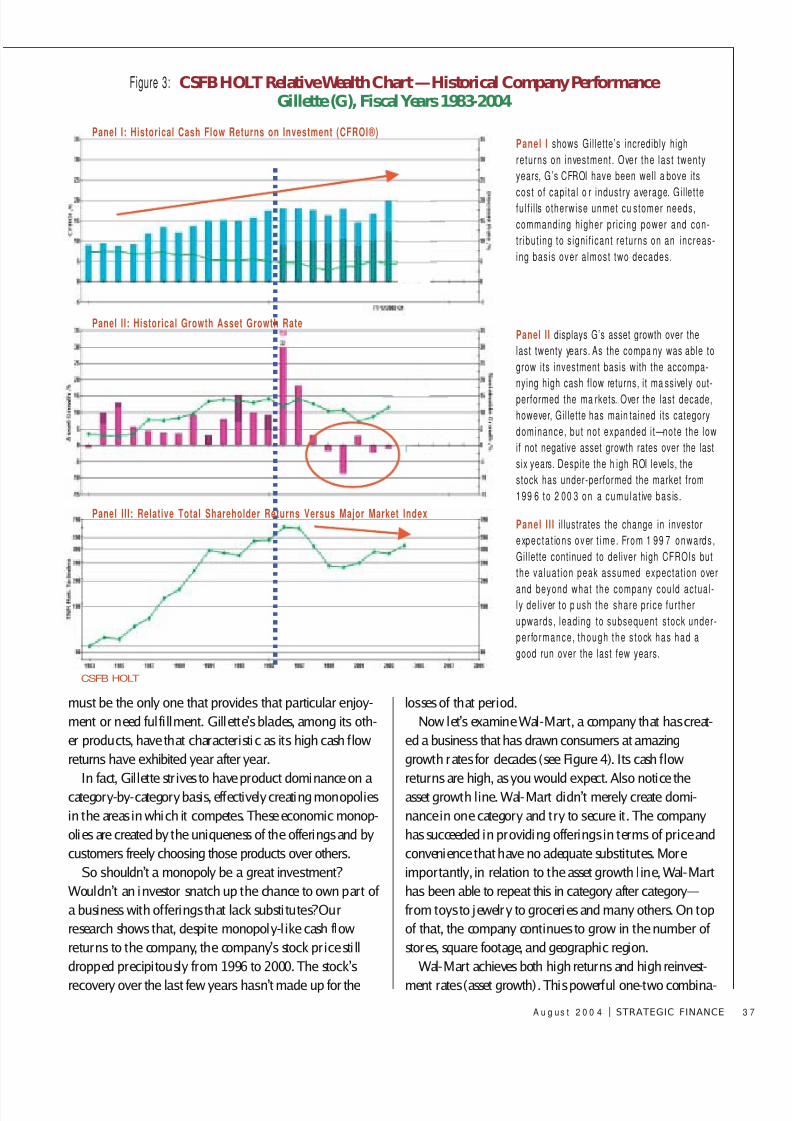
Now let’s examine Wal-Mart, a company that has creat-
ed a business that has drawn consumers at amazing
growth rates for decades (see Figure 4). Its cash flow
returns are high, as you would expect. Also notice the
asset growth line. Wal-Mart didn’t merely create domi-
nance in one category and try to secure it. The company
has succeeded in providing offerings in terms of price and
convenience that have no adequate substitutes. More
importantly, in relation to the asset growth l ine, Wal-Mart
has been able to repeat this in category after category—
from toys to jewelry to groceries and many others. On top
of that, the company continues to grow in the number of
stores, square footage, and geographic region.
Wal-Mart achieves both high returns and high reinvest-
ment rates (asset growth). This powerful one-two combina-
A u g us t 2 0 0 4 I STRATEGIC FINANCE 3 7
Panel I shows Gillette’s incredibly high
returns on investment. Over the las t twenty
years, G’s CFROI have been well a bove its
cost of capita l o r industry average. Gi l let teful f i l ls otherwise unmet cu stomer needs,
commanding higher pr ic ing power and con-
t r ibut ing to s igni f icant returns on an increas-
ing bas is over a lmost two decades.
Panel II displays G’s asset growth over the
last twenty years. As the compa ny was able to
grow its investment basis with the accompa-
nying high cash flow returns, it ma ssively out-
performed the ma rkets. Over the last decade,
however, Gillette has main tained its category
dominance, but not expanded i t—note the low
if not negative asset growth rates over the last
six years. Despite the h igh ROI levels, the
stock has under-performed the market from
199 6 to 2 00 3 on a cumula t ive bas is .
Panel I I I i l lustrates the change in investor
expec ta t ions over t ime. From 1 99 7 onwards ,
Gillette continued to deliver high CFROIs but
the valuat ion peak assumed expectat ion over
and beyond what the company could ac tual-ly del iver to p ush the share pr ice fur ther
upwards, leading to subsequent s tock under-
per fo rmance, though the s tock has had a
good run over the last few years.
Figure 3: CSFB HOLT Relative Wealth Chart —Historical Company PerformanceGillette (G),Fiscal Years 1983-2004
Panel I: Historical Cash Flow Returns on Investment (CFROI®)
Panel II: Historical Growth Asset Growth Rate
Panel III: Relative Total Shareholder Returns Versus Major Market Index
CSFBHOLT
8/11/2019 0804 Lit Man
http://slidepdf.com/reader/full/0804-lit-man 8/9
tion, together with i ts exceptional stock price performance,
supports the idea that ongoing monopolization is the key.
Why Growth Isn’t Necessarily GoodWhen examining the differences in financial performance of
companies like Wal-Mart and Gillette, some people might
overly stress the importance of revenue and asset growth in
great stock performance. Too often, companies believe that
growth is always good. Driven by metrics such as sales rev-
enue,sales per share,or customer growth rates, management
teams can do incredibly value-destroying things.
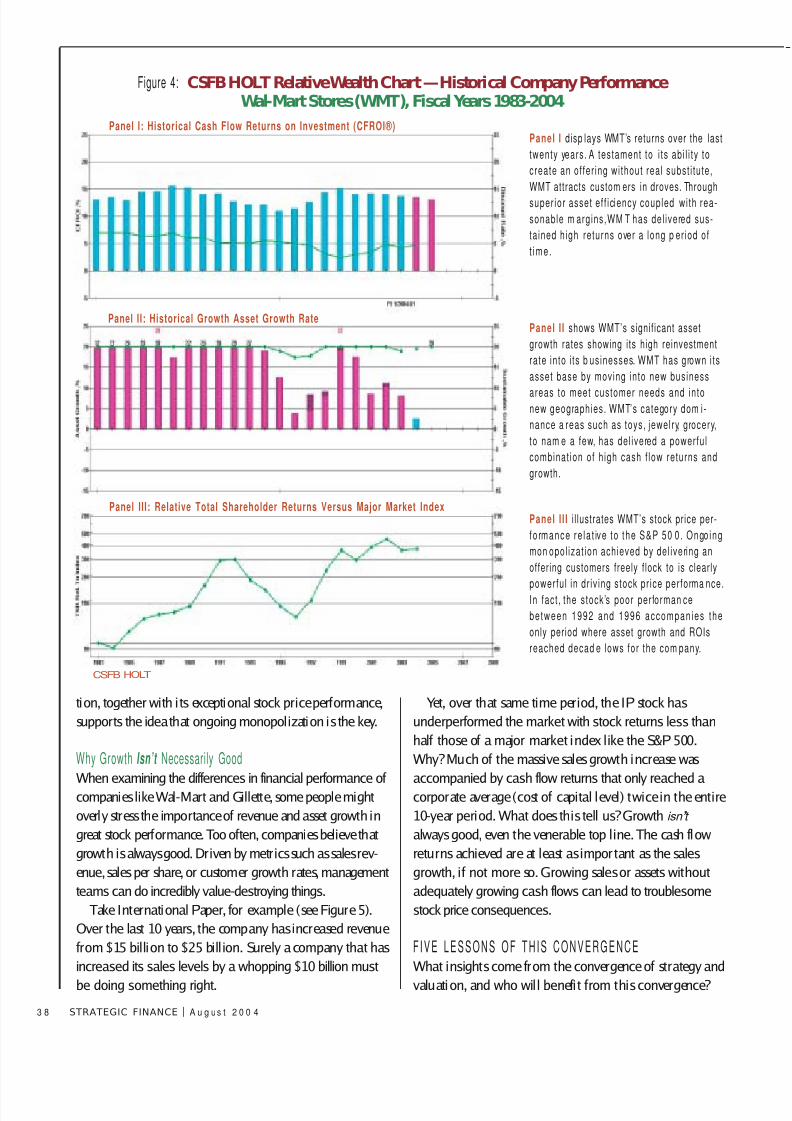
Take International Paper, for example (see Figure 5).
Over the last 10 years, the company has increased revenue
from $15 billion to $25 bill ion. Surely a company that has
increased its sales levels by a whopping $10 billion must
be doing something right.
Yet, over that same time period, the IP stock has
underperformed the market with stock returns less than
half those of a major market index like the S&P 500.
Why?Much of the massive sales growth increase was
accompanied by cash flow returns that only reached a
corporate average (cost of capital level) twice in the entire
10-year period. What does this tell us?Growth isn’t
always good, even the venerable top line.The cash flow
returns achieved are at least as impor tant as the sales
growth, if not more so. Growing sales or assets without
adequately growing cash flows can lead to troublesome
stock price consequences.
F I V E L E S S O N S O F T H I S C O N V E R G E N C EWhat insights come from the convergence of strategy and
valuation, and who wil l benefit from this convergence?
3 8 STRATEGIC FINANCE I A u g us t 2 0 0 4
Panel I disp lays WMT’s returns over the last
twenty years . A tes tament to i ts abi l i ty to
create an of fer ing without real subst i tute,
WMT attracts custom ers in droves. Through
super ior asset ef f iciency coupled with rea-
sonable m argins ,WM T has del ivered sus-
ta ined high returns over a long p er iod of
t ime.
Panel I I shows WMT’s signif icant asset
growth rates showing its high reinvestment
rate into i ts b us inesses. WMT has grown i ts
asset base by mov ing into new bus iness
areas to meet customer needs and intonew geographies . WMT’s category dom i-
nance a reas such as toys , jewelry, grocery,
to nam e a few, has del ivered a power ful
combinat ion of h igh cash f low returns and
growth.
Panel I I I i l lustrates WMT’s stock price per-
fo rmance re la t ive to the S&P 50 0. Ongo ing
mon opol izat ion achieved by del ivering an
offering customers freely f lock to is clearly
power ful in dr iv ing s tock pr ice per forma nce.In fac t , the s tock ’s poor per forman ce
between 1992 and 1996 accompan ies the
only period where asset growth and ROIs
reached decad e lows for the com pany.
Figure 4: CSFB HOLT Relative Wealth Chart —Historical Company PerformanceWal-Mart Stores (WMT),Fiscal Years 1983-2004
Panel I: Historical Cash Flow Returns on Investment (CFROI®)
Panel II: Historical Growth Asset Growth Rate
Panel III: Relative Total Shareholder Returns Versus Major Market Index
CSFBHOLT
8/11/2019 0804 Lit Man
http://slidepdf.com/reader/full/0804-lit-man 9/9
The insights are critical to investment analysts, corporate
executives and managers, consultants, and anyone else
who needs to better understand a company and its value.
Superior finance leads to superior strategy and vice ver-
sa. Knowing when to grow and when not to must dispel
old myths about the overimportance of the “top line.”
Monopoly-l ike businesses may generate high returns,but
no assumption can be made for long-term, sustained
stock price outperformance. Great companies may not be
great stocks. Being different is ancillary to—not the driver
of—successful strategy.
We must engulf ourselves in this signif icant conver-
gence of thought between valuation and strategy if we are
to move forward in our decisions regarding our business-
es. As the convergence enhances our understanding, it
should also enhance our decisions. ■
Joel Litman, CPA, is a director with CSFB HOLT at Credit
Suisse First Boston. He is Clini cal Professor of Business
Strategy in the Kell stadt Graduate School of Business at
DePaul Uni versity and one of the founders of the Center for
Strategy, Execut ion, and Valuation based in Chi cago.You
can reach Joel at j [email protected] .
Mark L. Frigo, Ph.D., CMA, CPA, is director of the Center
for Strategy, Execut ion, and Valuat ion and Eichenbuam
Foundation Di sti nguished Professor of Strategy and Leader-
ship in the Kellstadt Graduate School of Business at DePaul
University. He also is a leading expert i n strategy design
and execut ion. You can reach Mark at mfrigo@de paul.edu .
A u g us t 2 0 0 4 I STRATEGIC FINANCE 3 9
Panel I shows Internat ional Paper ’s poor
CFROI history. Over the last ten years, it
has on ly met i t s cost o f cap i ta l tw ice . I t s
cyclical return activ ity has averaged in a
low 3% to 4% range.
Panel I I displays IP’s very high asset
growth rates , ma inly through acquis i t ions.
Over the las t ten years , Internat ional Paper
increased revenues by a whopping
$1 0 b i l l ion do l la r s.
Panel I I I i l lus t rates the im por tance of gen-
erat ing a decent cash f low return when
growing sales and assets . IP’s inabi l i ty to
translate high growth into high returns – or
possibly low returns as a result of massivegrowth – explains mu ch of th e s tock ’s
underper formance. Over the las t ten years ,
IP’s share price return has been less than
ha l f tha t o f the S&P 50 0.
Figure 5: CSFB HOLT Relative Wealth Chart —Historical Company PerformanceInternational Paper (IP),Fiscal Years 1983-2004
Panel I: Historical Cash Flow Returns on Investment ( CFROI®)
Panel II: Historical Growth Asset Growth Rate
Panel III: Relative Total Shareholder Returns Versus Major Market Index
CSFBHOLT


![0804 EAV (CFA610)[1]](https://img.dokumen.tips/doc/110x75/577d39a41a28ab3a6b9a3fc6/0804-eav-cfa6101.jpg)


![Manual Type25USM 0804[1]](https://img.dokumen.tips/doc/110x75/577d24541a28ab4e1e9c33f4/manual-type25usm-08041.jpg)