Embed Size (px)
Citation preview

���
��������������� �� � ���� � ��������� � ����
� �������� ������ �������������
���������� ����������������������������������������
���������� �!"��#��"��#"!$���"$#���
%"#&""��"����'����!������
() ��#!���$#���
The final stage of geological research� which is in fact the essence of the explorationactivity for discovering the new hydrocarbons accumulations, is actually represented bydesigningthe new wells.For sure�one of the main conditionto achieve theproposed targetcould beconsideredthe well monitoring
Implementation in Romgaz of the concept known as mud loggingwasn’t so easy.Thebeginning is related to the period1989–1990, when the deepest well from TransylvanianBasinwas drilled and the first mud logging unit was rented from the offshore romaniancompany� After that successful experiment, few appraisal wellsweremonitoredin this way,followedby more and more wells� so nowadaysfor each well there is a mud logging unit,belonging to different drilling contractors or other services companies. In the last period,Romgaz set up a new department specially designedformud logging supervising.
*) +��"�"�"!��$��+��"!�#���+!"��!����
#,"�������������#
Equipped with specific devices and an experimented geological team, themud log-ging unit assures the well supervising and monitoring24 hours per day (Fig. 1).
The great advantage is represented not only bymonitoring the drilling parameters(weight on bit� rate of penetration� rotary torque� pump strokes, fluidleveletc.) which allowto createa more accurateimage of the well justfrom the drilling stageandto increase thewell security�but also by gathering a lot of geological data such as lithological description,calcimetry analysis� gas indicators and others [1]�

���
-�.)()����������������� ��!�����"
All these information correlated with the borehole geophysics can predict the produc-tion tests and thus thefuture status of the well�
The main purposesofthe mud logging unit can be summarized as follows:
# ������$����������$!$��������%��� $�""��������� ��%�$������"���"���� �����
# �����$��"%$� ����"���� �����"&'���(����!�������)���$'��
# ������$����%�$������!�$�����$"�
# !$���$)����$!$����������$��$���*����� ��� ��� �����"�
# ����������%����+���������� ��$�!�$�"���"!� �%� ���"�",��������-$������������
����$"�
The devices which compose the mud logging unit can be dividedin four main catego-ries:
# �"���� ������*� �"�
# -$������%����.���/������$����
# -$������������$����
# ��*�$�� ��!���$"%�$��%%�$��� �� �������"����������"!� �%� ���"�
We describe in this section very briefly each of this component [2].
*)() ��������������/���
The gas formation detection is essential for a complete evaluation of the formationhydrocarbons potential and for sure� for the well security. The gas is extracted from drillingmud with a degasor� installed on the gas flowing line.The gas/air mixture is then pumpedthrough thegas line to the gas detector (CROMATOGRAPH )� located insidethe geologi-cal unit. Here could be analyzed the following hydrocarbons fractions: TG (Total gas),

���
C1 (methane), C2 (ethane)� C3 (propane)� nC4 (normal butane)� iC4 (iso butane), etc.�which are displayed in percentsandrecordedby the Data Terminal computer. There is alsoan adjustable alarm system, whichwarns the geologists when a certain gas percent isex-ceeded.The gas curve is recorded on the final log� called MASTERLOG or LITHOLOG�
���� �������0�0��� ����
������1�0�2� �����
It’s one of the most frequently monitored parameters� due to the importance in detect-ing the fluid losses� theinflux into the wellbore, or in case of kick – off� because canesti-matethe magnitude.
�������1�0� �02��� ��
It has a great importance� because can help in detecting theoverpressuredformations.A higher geothermic gradientthan a normal one can be explained based on sealing� whichcan bephysical� chemical or a mixture of them.The other parameters arealso correlatedwith temperature.
����3��1�0������ 4
In order to indicate the influx of different types of fluids (gas� salt water� heavy hy-drocarbons� solids)� this parameter isvery helpful.A decreasing of density meansthat gasenters in the mud.
����5���� �� 1�202� ��6��
Knowing the wellbore geometrycan be computed the circulation time and the lag time,which represents thenecessary time for mud in order to arrive to the surface� through theannulus.When the formation fluids enter into the wellbore� the number of pump strokes isincreasingand the standpipe pressurehas also a light increasing and then decreases.
����7������8�� ��
It is an important tool which can determine the fluid influx in the wellbore. Normally�we have a progressive decreasing of the mud level equal with the volume replacedduringthe drilling process.Whenit is noticed an immediatelyincreasing of the out flowrate of themud� it indicates a fluid influx�
����9�������� ��� 4 :����� ��� 4;
When the salt waters enter into the wellbore�themudconductivity increases(theresis-tivity decreases) and the amount ofchloridesis also higher.

��0
��3� �������0��� ����
��3����� ���2��� �� ���:���;
Since the change of the bitpenetration rate, indicates the change in lithology� this pa-rameter is one of the main important. It’s also a very good tool for geological correlationand also for the other analyses, even fordetecting the overpressured formations.
��3����� � ���2��0�� �:���;
It’s a very helpful parameter� because it is mainly used for computing the normalizedrate of penetration (,,d’’ exponent).The RPM changes have an influence on the rate of pen-etration� but innormal conditions these changes are not so importantas the weight onbit.
��3�3����1 ��<� :���;
Like RPM and weight on hook (WHO)� the weight on bit (WOB) is mainly used forcomputing the normalized rate of penetration, expressed by�, d’’ exponent� which representsthevariation in rate of penetration�
��3�5����1 ��1��6:���;
The mud logging system records continuously this parameter�used for computing thedrilling string� in different conditions, when it is in the mud� above thewell bottom� or onthe well bottom�
��3�7����=�
The torque increasing can result in wear of bits or stabilizers�bit cone losses� increas-ing of weight on bit or rate of penetration�lithology change. It can also indicate possibleproblems like�,key holes’’, differential bonding,potential overpressuredzones etc.
��3�9�� ���2�2����202�2������
Very good tool in detecting the overpressuredzones� it also indicates the cleaningonthe well bottom� A pressure correctlyapplied means a proper cleaning on the bottomandtransportingthemud and cuttings to thesurface.
��5� ��02 ���
Recording thedrilling parameters against depth and also the graphical editing ofdif-ferent logsis realized withseveral computersinside the mud logging unit.
A lot of computations as�, d’’ exponent,pore pressures gradients and others are alsopossible using the available computers�
��1
��7� �������������� �����������
A proper evaluation of the formations crossed by the well is a result of a sustainedwork of thegeological team� Collecting the cuttings at each meter� they can edit a veryaccurate geological and stratigraphycalcolumn� which representsthe base for well correla-tion. Beside the geological analyses� they record drilling data� fluid parameters� monitor gasindications, which are correlate in real timewith thelithology of cuttings� cores description�open hole logs� in order to detect abnormal values of some parameters and therefore toavoid undesired problems as kick – off, fluid losses� overpressured zones�bit stuck etc.Byareal time correlation can also predict the future production tests of the well.
A geologicalassistanceserviceincludesmainly the following issues:# ,�������� ����" $�!�����% ������"��� �$�"�+�� � ��!$�"�"�����)���%����+���
����"&����� ���$���2��$�."��� � ��"�� � �$3����� /���$���""��)!��%���$�24 ������
���*���� *�"��� !�$�"��) .� !�$ ��� �"��������/� � �""�$) ��!�����"� "��������$)
"�$� ��$�"��� �
# (�� ����$)4�������$)�
# 5���$�" �!� ����)"�"�
# ����"� ����"�
# -�%%�$�����"�"%�$����$��"���$� 6"������%� �����+��� ���� ��$������"�
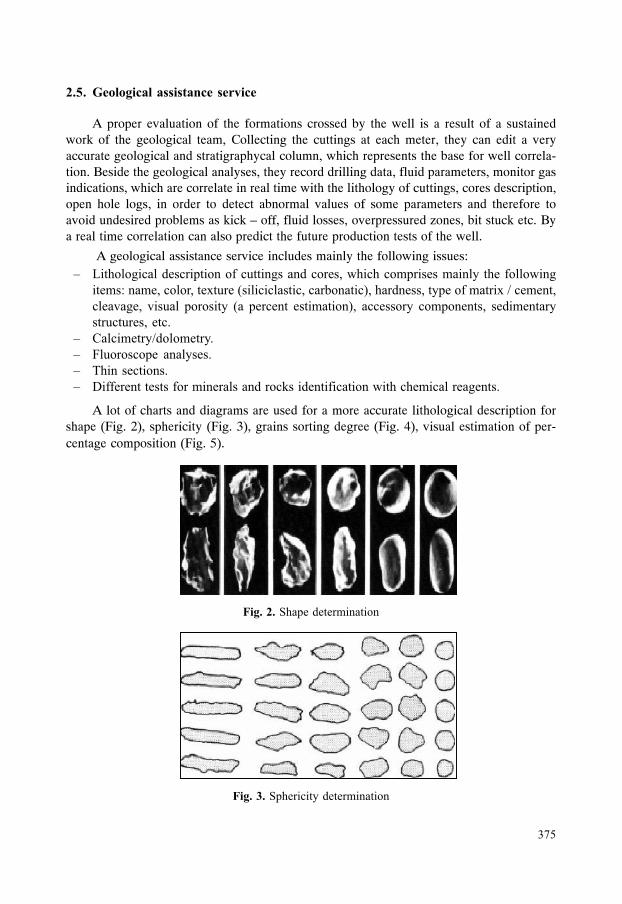
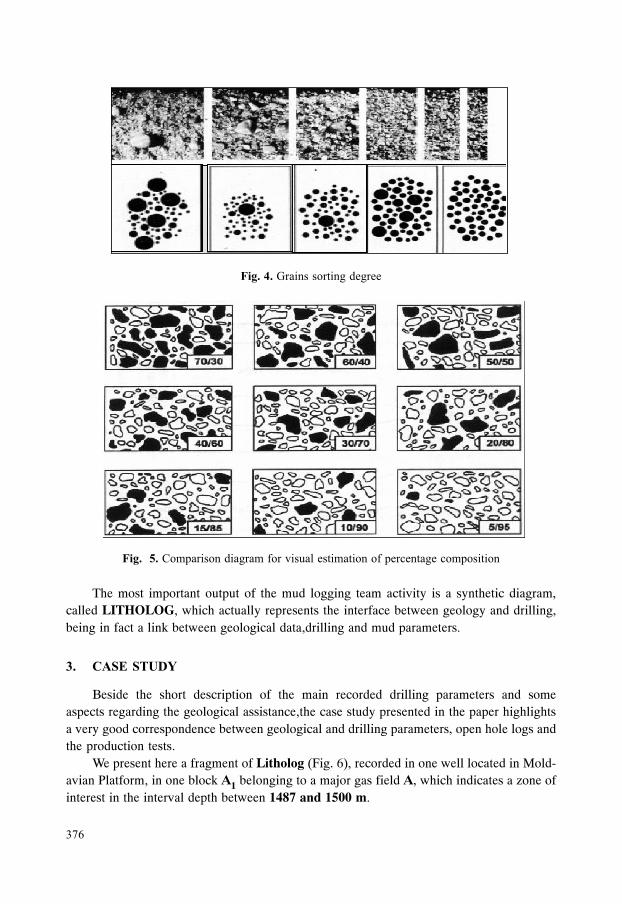
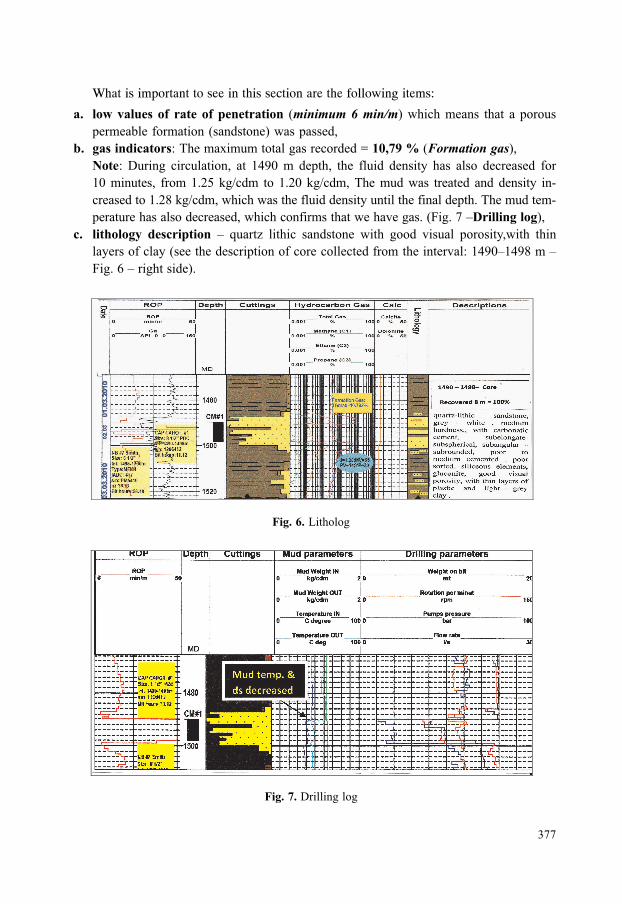
A lot of charts and diagramsare usedfor amore accurate lithological description forshape (Fig. 2), sphericity(Fig. 3),grains sorting degree (Fig. 4), visual estimation of per-centage composition (Fig. 5).
�������!�����$��������
��3��!��$� ��)����$��������
��7
-�.)!)$���""�$�������$��
-�.)")(��!�$�"������$��%�$*�"����"���������%!�$ ������ ��!�"�����
The most importantoutputof the mud logging team activity isa synthetic diagram,called LITHOLOG� whichactually represents the interface between geology anddrilling�being in fact a link between geological data�drilling and mud parameters�
#) $�+"+#��'
Beside the short description of the main recorded drilling parameters and someaspects regarding thegeological assistance�the case studypresented in the paper highlightsa very good correspondence between geological and drilling parameters, open hole logs andtheproduction tests�
We present herea fragment of Litholog (Fig. 6)� recorded in one well located in Mold-avian Platform� in oneblock A1 belonging to a major gas field A,which indicates a zone ofinterest in the interval depthbetween 1487 and 1500 m�
���
What is important to see in this section are the followingitems:
�� ��8������� �� ��� 2��� �� ��� .��������������/+�� �����" ���� � !�$��"
!�$���3��%�$������."���"����/+�"!�""���
<� �������� ���&�����2�����������"$� �$���8�>$?@A.��� ������/�
%� �& -�$��� �$ �������� �� �09:� ��!��� ��� %���� ���"��) ��" ��"� �� $��"�� %�$
�:������"� %$�����1 6�4 �� �� ���: 6�4 ���������+�" �$����� ��� ���"��) ��;
$��"�������<6�4 ���+�� �+�"���%�������"��)��������%������!������������;
!�$���$���"��"��� $��"���+�� � ��%�$�"����+���*���"�.5����#���������/�
�� �� 1���4 ������2 ��� # =��$�> ����� "���"���� +��� ���� *�"��� !�$�"��)�+��� ����
��)�$"�% ��)."�������" $�!�����% �$� ���� ���%$���������$*��&�09:#�09<�#
5���7#$����"���/�
��9�,�������
��?�-$���������

��<
Thespecialopenhole logs (Fig. 8 – Composite log)recordedin this zoneallow thefollowing qualitative interpretation:
�� ��� �� ���" ��!�� $����� ��� $� �$��� *����" �%� �$� ��+ .�$���� 1:�?@ ����"/�
+�� ����� ���"� �����$%�$������.�$� 6�/�
<� ���*����"�%$�"�"��*��) �$*�"��-,,����$�����.�!���:����/.�$� 6�/�
�� ��!�$�����3��+������"��)�������$��� �$*����� ���"� ��""� ������������� A>���
.�$� 60/�
��B�(��!�"������
These qualitative information were then confirmed by the quantitativepetrophysicalinterpretation, performed with the ELAN software. The result wasgas saturation ofmax<:B������%%� ��*�!�$�"��)�%�$�����:B�which confirms the visualporosityestima-tion from thecore description(Fig. 9).
��@�?��$�!�)"� �� ����$!$�������

��9
The final step was the production test� which confirms all the previous evaluations,because the well was perforatedon theinterval 1487.5–1501 mand theflow rateobtainedwas300.000 stcm/dayon 14mm choke – gas and condensate.
5� ��%�&'�(�%�
It’s very obvious that mud logging activity has a lot of benefits, which could be sum-marized brieflyin some main issuesas below:
# ���� ���������"��%��2�$����$%����"."���+���$"�(���'����� �/�*�$!$�""�$��>�;
��"�������$������%������""�"�!$��� ����������2!� ���6� 6#�%%�3��"�� 6��� �C
# ������%)���D�"�+�����$������!$� �""���!�""�3��>���"�% ����$�"�%�$�)�$� �$3��"
� ���������"�3�"�����$������� �$$�������3��+���������)��$���������3�$�����
���!�)"� "C
# �""�$������2����+���"� �$��)��$����$������C
# ���"�*�$������$��".����������$���������� ��!�"������/!$�*����3)���#�������
"�$*� �"� �� ������"!� ����>����*� �"���� ��!�����*� ����� $�!$�"������ �$���
����3�"�������)%�$��� �$$���+����*���������3����"�%�$�3����$�!!$�� ��%���
$�"6����)"�"����"�����������++���"C
# !$��� ����!$��� ����+��� ��"�"�3���� ���$�%�$�� $������! ����"������ ���+��� ��;
"����!$��$���
All these above considerations justify in fact the reason for which the mud loggingservice became a realnecessity, representing today in Romgaza constant requirement foreach newwell.
�) )�)%�)�
E�F '����3�$����GH�"� �������������II� �)��9<9
E�F ���������>�$ ��*�


![˘ ˇ ˆ ˙ ˝ ˛ˆ˙˝˚yadda.icm.edu.pl/yadda/element/bwmeta1.element... · finite elements. Creating the elements is commonly called meshing [5]. The degrees of freedom (DOF) of](https://img.dokumen.tips/doc/110x75/5fb0b3ba99c3803df50d0ce7/-yaddaicmeduplyaddaelement-finite-elements.jpg)