Embed Size (px)
Citation preview

UN Convention on the Rights of the ChildUnited Kingdom
Data Annex

ContentsPREFACE 15
A. Key points from the data annex 16
B. Definition of the child (article 1)18
Tables for the United Kingdom Table B1. Mid-2008 to Mid-2012 Population estimates for 0-17 year olds, by gender,
for the United Kingdom and England, Wales, Scotland and Northern Ireland.
Tables for England and WalesTable B2. Estimated resident population aged 0-15 by broad ethnic group in England
and Wales, mid-2006-2009 (experimental statistics).
C. General principles (articles 2, 3, 6 and 12) 20
C.1. Right to life, survival and development (article 6)
Tables for England and WalesTable C1.1. Deaths of those aged 19 and under as a result of illnesses, including HIV /
AIDS, malaria, tuberculosis, polio, hepatitis and diseases of the respiratory system, in England and Wales, 2007-2011.
Table C1.2. Deaths of those aged 19 and under as a result of traffic or other accidents in England and Wales, 2007 to 2011, by age-group and gender.
Table C1.3. Deaths of those aged 19 and under as a result of Homicide in England and Wales, 2007 to 2011, by age-group and gender.
Table C1.4. Deaths of those aged 19 and under as a result of Suicides (and for the 15-19 age group Event of Undetermined Intent) in England and Wales, 2007 to 2011, by age-group and gender.
Table C1.5. All deaths of those aged 19 and under in England and Wales, 2007 to 2011, by age-group and gender.
Tables for ScotlandTable C1.6. Deaths of those aged 19 and under as a result of illnesses, including HIV /
AIDS, malaria, tuberculosis, polio, hepatitis and diseases of the respiratory system, in Scotland, 2007-2011.
Table C1.7. Deaths of those aged 19 and under as a result of Accidents in Scotland, from 2007-2011, by age-group and gender.
Table C1.8. Deaths of those aged 19 and under as a result of Homicide in Scotland, from 2007-2011, by age-group and gender.
Table C1.9. Deaths of those aged 19 and under as a result of Suicides (and for the 15-19 age group Event of Undetermined Intent), in Scotland, from 2007-2011, by age-group and gender.
Tables for Northern IrelandTable C1.10. Deaths of those under 18 as a result of illnesses, including HIV / AIDS,
malaria, tuberculosis, polio, hepatitis and acute respiratory infections, in
2

Northern Ireland, 2008-2012.
Table C1.11. Deaths of those under 18 as the result of traffic or other accidents, by age and gender, Northern Ireland, 2008-2012.
Table C1.12. Deaths of those under 18 as the result of crime and other forms of violence, by age and gender, Northern Ireland, 2008-2012.
Table C1.13. Deaths of those under 18 due to suicide, by age and gender, Northern Ireland, 2008-2012.
C.2. Respect for the views of the child (article 12)
Tables for United KingdomTable C2.1. Youth Voice in the United Kingdom, 2010-2013.
Tables for Wales Table C2.2. Number of school councils in maintained primary, secondary, middle and
special schools in Wales, 2008-2009 to 2012-2013.
Tables for ScotlandTable C2.3. Number of children in uniformed voluntary organisations in Scotland for
2009-2013.
Tables for Northern IrelandTable C2.4. Number of organisations for youths (people aged 4-25), in Northern
Ireland, 2009-2011.
D. Civil rights and freedoms (articles 7, 8, 13-17, 28, para. 2, 37 (a) and 39) 35
D.1. Birth registration (article 7)
Tables for England and WalesTable D1.1. Live births occurring within/outside marriage/civil partnership by gender,
England and Wales, 2007 to 2011.Table D1.2. Live births occurring within/outside marriage/civil partnership by mothers
age 18 and under, England and Wales, 2007 to 2011.
Tables for WalesTable D1.3. Live births, Wales, 2008-2012.
Tables for ScotlandTable D1.4. Birth registrations in Scotland, 2007- 2011 and percentage registered
within 21 days. Table D1.5. Live births: occurring within/outside marriage/civil partnership by gender,
Scotland, 2007-2011.
Tables for Northern IrelandTable D1.6. Registered live births and percentage registered within 42 days, Northern Ireland, 2008-2012.
D.2. Access to appropriate information (article 17)
3

Tables for United Kingdom/ Great BritainTable D2.1. Number of public libraries available to children in the United Kingdom,
including mobile libraries, 2007/08 to 2011/12. Table D2.2. Proportion of 5-16 year olds in Great Britain who have a computer at home
and who own their own computer, 2008-2012.
Table D2.3. Proportion of 7-16 year olds in Great Britain who have access to and use the internet in their own homes and those who read a book for pleasure, 2008-12.
D.3. The right not to be subjected to torture or other cruel inhuman or degrading treatment or punishment (articles 37 (a) and 28, para. 2))
Tables for Northern IrelandTable D3.1. Training undertaken in Therapeutic Crisis Intervention and Physical
Control and Care in Northern Ireland, 2009-2013.
E. Family environment and alternative care (articles 5, 9-11, 18 (paras. 1 and 2), 19-21, 25, 27 (para. 4) and 39) 44 E.1. Family support (articles 5 and 18, paras. 1 and 2) Provision of childcare: Tables for EnglandTable E1.1 Registered childcare providers and places for children aged 8 and under in
England, at 31 March 2010 to 31 March 2013.
Tables for WalesTable E1.2. Children's day care places in Wales (childminders, full day care, sessional
day care, out of school care, crèches, open access play), 2009-2013.
Tables for ScotlandTable E1.3. Number of registered childcare services by main service type and service
status (active / inactive), in Scotland, at 31 December 2008- 2011.Table E1.4. Number of children and percentage of population aged 0-15 years old
using childcare services in Scotland during the last full week before 30 November 2008 -2011.
Tables for Northern IrelandTable E1.5. Children's Provision Industry Composition, Northern Ireland, 2012.
Children in need: Tables for EnglandTable E1.6. Number of Children in Need in England, 2010 to 2012.
Tables for WalesTable E1.7. Number of Children in Need in Wales, 2010 to 2012.
Low income and material deprivation: Tables for the United KingdomTable E1.8. Percentage of children falling below various thresholds of low income and
material deprivation, 2007/08 – 2011/12 in the United Kingdom.Table E1.9. Percentage of children falling below various thresholds of contemporary
median income, 2007/08 – 2011/12 in the United Kingdom.
4

E.2. Children without parental care (articles 9 (paras. 1-4), 21 and 25)
Number of looked after children: Tables for EnglandTable E2.1. Number of children looked after by local authorities in England at 31
March, by gender, age, category of need and ethnic origin, 2009-2013.Tables for WalesTable E2.2. Number of looked after children (except those placed with their parents) in
Wales at 31 March, 2008-2012.
Tables for ScotlandTable E2.3. Number of looked after children, by age and gender in Scotland from
2008/09 to 2011/12.
Tables for Northern IrelandTable E2.4. The Number of looked after children in Northern Ireland by age group at 31
March, 2009 – 2012.
Number of looked after children with court orders: Tables for EnglandTable E2.5. Number of looked after children with court orders, excluding those placed
with their own parents or other person with parental responsibility, in England at 31 March, by age group, 2008-2012.
Table E2.6. Number of looked after children with court orders, excluding those placed with their own parents or other person with parental responsibility, in England at 31 March, by ethnicity, 2008-2012.
Tables for WalesTable E2.7. Number of looked after children with court orders, in Wales, at 31 March,
2008-2012.
Tables for Northern IrelandTable E2.8. Number of looked after children in Northern Ireland with court orders by
age group at 31 March, 2009 – 2012.
Number of registered children’s homes: Tables for WalesTable E2.9. Number of registered children's homes in Wales, 2009-2013.
Number of looked after children by placement type: Tables for EnglandTable E2.10. Number of looked after children in foster or residential placements, in
England at 31 March, by age group, 2008-2012. Table E2.11. Number of looked after children in foster or residential placements, in
England at 31 March, by ethnicity, 2008-2012.
Tables for Scotland Table E2.12. Number of Looked After Children in Scotland from 2008/09 to 2011/12,
by placement type.
Tables for Northern IrelandTable E2.13. Looked After Children by Placement and Age Group in Northern Ireland
at 31 March, 2009, 2011 & 2012.
5

Average duration of placement: Tables for EnglandTable E2.14. Average duration of placement (days) for looked after children ceasing
foster care or residential placements during the year ending 31 March 2007-2012, in England.
Children missing from care: Tables for EnglandTable E2.15. Children missing from care for more than 24 hours in England at 31
March 2008-2012.
Tables for WalesTable E2.16. Children Missing from care for more than 24 hours in Wales at 31 March
2008-2012.
Number of children ceasing placements: Tables for EnglandTable E2.17. Number of looked after children ceasing placements in England, during
the year ending 31 March, who have returned home to live with their parents or other person with parental responsibility by age group, 2008-2012.
Table E2.18. Number of looked after children ceasing placements in England, during the year ending 31 March, who have returned home to live with their parents or other person with parental responsibility by ethnicity, 2008-2012.
Tables for WalesTable E2.19. Number and percentage of looked after children ceasing placements
during year ending 31 March who returned home to live with their parents, relatives or other person with parental responsibility, in Wales, 2008-2012.
Tables for ScotlandTable E2.20. Number of looked after children ceasing placements in Scotland during
years 2008/09 to 2011/12, by age and destination.
Tables for Northern IrelandTable E2.21. Number of looked after children ceasing placements in Northern Ireland
by age group, year ending 31 March, 2009 – 2012.
Number of children adopted: Tables for EnglandTable E2.22. Number of looked after children adopted in England in the year ending 31
March 2008-2012, by age at adoption and gender. Table E2.23. Number of looked after children adopted in England during the year
ending 31 March 2008-2012, by ethnic origin, and category of need.
Tables for ScotlandTable E2.24. Number of adoptions registered in Scotland, 2007- 2011, by age and
gender.
Tables for Northern IrelandTable E2.25. Children adopted in Northern Ireland during year ending 31 March, 2010 -
2013.
E.3. Family reunification (article 10) No data.
6

E.4. Illicit transfer and non-return (article 11)
Tables for England and WalesTable E4.1. Defendants proceeded against at the magistrates' court, found guilty and
sentenced at all courts for offences relating to trafficking of people and abduction of children in England and Wales, 2008-2012.
Tables for Northern IrelandTable E4.2. Number of children abducted from and to Northern Ireland, by place of
residence; relationship between child and perpetrator, 2008/09 to 2012/13. Table E4.3. Number of offences of child abduction recorded and detected in Northern
Ireland, 2008/09 to 2012/13.
E.5. Abuse and neglect (article 19), including physical and psychological recovery and social reintegration (article 39)
Tables for England Table E5.1. Number and percentage of children who were the subject of a child protection
plan in England at 31 March 2008 to 31 March 2012, by gender and age. Table E5.2. Number and percentage of children who were the subject of a child
protection plan in England at 31 March 2008 to 31 March 2012, by ethnicity.
Tables for WalesTable E5.3. Number of children on the child protection register, in Wales, at 31 March
2009-2013.
Tables for ScotlandTable: E5.4. Number and percentage of children registered following a case
conference by category of abuse/risk identified, in Scotland, 2007-2011.
Tables for Northern IrelandTable E5.5. Children on the Child Protection Register in Northern Ireland at 31 March,
2009 – 2012.
F. Disability, basic health and welfare (articles 6, 18 (para. 3), 23, 24, 26, 27 (paras. 1-3) and 33) 89
F.1. Children with disabilities (article 23)
Tables for Great BritainTable F1.1. Number of under-16s claiming Disability Living Allowance Benefit in Great
Britain at February, May, August and November 2008 to 2012.
Tables for England and Wales / EnglandTable F1.2. Number of 0-15 year olds with a long term health problem or disability in
England and Wales, by gender, 2011. Table F1.3. All schools: Pupils with special educational needs (SEN), England,
January 2009 to 2013. Table F1.4. All Academies: Pupils with special educational needs (SEN), England,
January 2012 and 2013. Table F1.5. Number and percentage of pupils attending special schools, England,
January 2009 to 2013.
7

Tables for WalesTable F1.6. All pupils with special educational needs (SEN) in maintained schools in
Wales, by type of school, January 2012 to 2013.
Tables for Scotland Table F1.7. Number of children attending publicly funded special schools in Scotland,
2008/09 to 2012/13.Tables for Northern IrelandTable F1.8. Number of children (includes all children with special needs) attending
special schools in Northern Ireland, 2008/09 to 2012/13.
F.2. Health and health services (article 24)
Rates of infant and under-five child mortality: Tables for England and WalesTable F2.1. Rates of infant and under-five child mortality, England and Wales, by
gender, 2007- 2011.
Tables for ScotlandTable F2.2. Number and rates of infant and under-five child mortality, Scotland, by
gender, 2007- 2011.
Tables for Northern IrelandTable F2.3. Rates of infant and under-5 child mortality in Northern Ireland, 2008-2012.
Low birthweight: Tables for England and WalesTable F2.4. Number and percentage of live births of low birthweight (less than 2,500
grams), 2008-2012, England and Wales.
Tables for ScotlandTable F2.5. Proportion of children with low birth weight (under 2,500 grams) in
Scotland, 2007-2011.
Tables for Northern IrelandTable F2.6. Proportion of children with low birth weight (<2,500 grams) in Northern
Ireland, 2010-2012.
Low Body Mass Index distribution in primary school children: Tables for ScotlandTable F2.7. Low Body Mass Index distribution Primary 1 school children in Scotland,
2007/08-2011/12.
Percentage of children immunised: Tables for United Kingdom Table F2.8. Percentage of children immunised by their 1st birthday, by country of the
UK, 2008/09-2012/13.Table F2.9. Percentage of children immunised against Measles, Mumps and Rubella
(MMR) by their 2nd and 5th birthday, by country of the UK, 2007/08-2012/13.
Rates of maternal mortality: Tables for England and WalesTable F2.10. Rates of maternal mortality due to pregnancy, childbirth and the
puerperium (ICD-10 code O00-O99) in England and Wales, 2007-2011.
8

Tables for ScotlandTable F2.11. Maternal mortality, by underlying cause, Scotland, 2007- 2011.
Tables for Northern IrelandTable F2.12. Rates of maternal mortality, in Northern Ireland, 2008-2012.
Proportion of children born in hospitals:Tables for England and WalesTable F2.13. Maternities by place of birth in England and Wales, 2007-2011. Tables for ScotlandTable F2.14. Proportion of children born in hospitals in Scotland, 2008-2012.
Tables for Northern IrelandTable F2.15. Proportion of children born in hospitals in Northern Ireland, 2008-2012.
Incidence of breastfeeding: Tables for United Kingdom/ Great Britain Table F2.16. Incidence of breastfeeding by country of the UK, 1990-2010. Table F2.17. Incidence of breastfeeding by mother's age and country of the UK, 2005
and 2010. Table F2.18. Incidence of breastfeeding by mother's ethnicity, Great Britain, 2005 and
2010. Table F2.19. Incidence of breastfeeding by mother's socio-economic classification (NS-
SEC) and country of the UK, 2005 and 2010. Table F2.20. Incidence of breastfeeding by Index of Multiple Deprivation (IMD) and
country of the UK, 2010.
Under 18 conceptions: Tables for England and WalesTable F2.21.Under 18 conceptions for England and Wales, 2007-2012.
Tables for ScotlandTable F2.22. Teenage pregnancies in Scotland by age of mother at conception, 2006-
2010.Table F2.23. Teenage pregnancies in Scotland by age group of mother at conception
and deprivation, 2006-2010.
Tables for Northern IrelandTable F2.24. The number of resident live births to mothers under 18 in Northern Ireland,
2008-2012.
Sexually transmitted infections: Tables for EnglandTable F2.25. Number of new Sexually Transmitted Infection (STI) diagnoses in MALE
under 20 year olds by age in England, 2009-2012.Table F2.26. Number of new Sexually Transmitted Infection (STI) diagnoses in
FEMALE under 20 year olds by age in England, 2009-2012.
Tables for ScotlandTable F2.27. Number of MALE under 20 year olds diagnosed at Scottish GUM clinics
affected by sexually transmitted infections in Scotland, 2005-2009. Table F2.28. Number of FEMALE under 20 year olds diagnosed at Scottish GUM
clinics affected by sexually transmitted infections in Scotland, 2005-2009.
9

Tables for Northern IrelandTable F2.29. New Episodes of Sexually Transmitted Infection diagnoses in MALE
under 20 year olds by age, Northern Ireland, 2008-2012.Table F2.30. New Episodes of Sexually Transmitted Infection diagnoses in FEMALE
under 20 year olds by age, Northern Ireland, 2008-2012.
Young carers: Tables for England and WalesTable F2.31. Number of young carers, by age, in England and Wales, 2001 and 2011. Table F2.32. Age, number and proportion of young carers in England and Wales, by
hours caring per week, 2001 and 2011.
F.3. Drug and substance abuse (article 33)
Tables for EnglandTable F3.1. Proportion of pupils in England who had taken drugs in the last year, by
gender and age, 2008-12. Table F3.2. Proportion of pupils in England who drank alcohol in the last week, by
gender and age, 2008-12.Table F3.3. Number of under-18s in England accessing specialist substance misuse
services, by gender and age, 2007-08 to 2011-12.Table F3.4. Number of under-18s in England accessing specialist substance misuse
services, by ethnicity, 2009-10 to 2011-12.Table F3.5. Number of under-18s in England accessing specialist substance misuse
services, by accommodation status, 2010-11 to 2011-12.Table F3.6. Number of under-18s in England accessing specialist substance misuse
services, by education and employment status, 2010-11 to 2011-12.
F.4. Children with incarcerated parents
Table F4.1. Number of children with parents in prison in England and Wales, 2006 and 2009.
G. Education, leisure and cultural activities (articles 28, 29, 30 and 31) 134
Levels of attainment: Tables for England Table G1. Key Stage 2 test levels of attainment in English, all schools, by gender, in
England, 2008-2012. Table G2. Attainment gap at age 11 between pupils eligible for Free School Meals and
the rest, in England, 2011-12.Table G3. GCSE and equivalent attempts and achievements, all schools in England,
2007-08 to 2011-12. Table G4. Achievements at GCSE and equivalent for pupils at the end of Key Stage 4,
in state-funded secondary schools (including Academies and CTCs) in England, by gender 2007-08 to 2011-12.
Table G5. Achievements at GCSE and equivalent for pupils at the end of Key Stage 4, in state-funded secondary schools (including Academies and CTCs) in England, by ethnicity 2007-08 to 2011-12.
10

Table G6. Achievements at GCSE and equivalent for pupils at the end of Key Stage 4, in state-funded secondary schools (including Academies and CTCs) in England, by Free School Meals (FSM) 2007-08 to 2011-12.
Table G7. Attainment gap at age 16 between free school meal pupils and the rest in England, 2010/11 to 2011/12.
Table G8. Achievements at GCSE and equivalent for pupils at the end of Key Stage 4, in state-funded secondary schools (including Academies and CTCs) in England, by first language 2007-08 to 2011-12.
Table G9. Achievements at GCSE and equivalent for pupils at the end of Key Stage 4, in state-funded secondary schools (including Academies and CTCs) in England, by special educational needs (SEN) 2007-08 to 2011-12.
Table G10. Achievements at GCSE and equivalent for pupils at the end of Key Stage 4, in state-funded secondary schools (including Academies and CTCs) in England, by disadvantage 2010-11 to 2011-12.
Tables for WalesTable G11. Percentage of pupils achieving the Core Subject Indicator (CSI) at Key
Stage 2, by gender, in Wales, 2008/09 to 2012/13.Table G12. Attainment gap at age 11 between pupils eligible for Free School Meals
and the rest, in Wales, 2011-12.Table G13. Attainment gap at key stage 4 between pupils eligible for free school meals
and those not eligible, in Wales 2010/11 to 2011/12.
Tables for ScotlandTable G14. Attainment in Scotland, 2009/10 to 2011/12.
Tables for Northern IrelandTable G15. Percentage of pupils achieving level 4 or above in Key Stage Two
Assessments in English, by gender, in Northern Ireland, 2008/09 to 2011/12.
School attendance rates: Tables for EnglandTable G16. Attendance rates for all schools in England, 2007-08 to 2011-12.Table G17. Attendance rates for primary schools in England, 2007-08 to 2011-12. Table G18. Attendance rates for secondary schools, in England, 2007-08 to 2011-12.Table G19. Attendance rates for special schools, in England, 2007-08 to 2011-12.
Tables for ScotlandTable G20. Attendance rates for primary, secondary and special schools in Scotland,
2006/07-2010/11. Tables for Northern IrelandTable G21. Attendance rates at primary schools in Northern Ireland (% of total half
days attended), 2008/09 to 2011/12. Table G22. Participation in full-time education and vocational training in schools and
FE colleges by 16 and 17 year olds in Northern Ireland, 2006/07 to 2010/11.
Pupil to teacher ratios: Tables for EnglandTable G23. Pupil to Teacher Ratios, (PTR) and Pupil to Adult Ratios, (PAR) in publicly
funded schools in England, January 2007-09 and November 2010-12.
Tables for Scotland Table G24. Pupil: teacher ratios by type of school, in Scotland, 2008- September 2012.
Tables for Northern Ireland
11

Table G25. Pupil:Teacher Ratio by type of school in Northern Ireland, 2008/09 to 2012/13.
School exclusions: Tables for EnglandTable G26. Number of permanent exclusions by type of school, in England 2007/08 to
2011/12Table G27. Number of fixed period exclusions by type of school in England, 2007/08 to
2011/12.Table G28. Exclusions from school of children who have been looked after
continuously for at least twelve months, in England, 2008-2011.Tables for WalesTable G29. Number of permanent and fixed term exclusions by school type, in Wales
2007/08 to 2011/12.Table G30. Number of exclusions from schools, by Looked After Children (LAC) status
in Wales, 2007/08 – 2011/12.Table G31. Exclusions from school of children who have been looked after
continuously for at least twelve months, in Wales, 2008-2011.Tables for Northern IrelandTable G32. Exclusions from school of children who have been looked after
continuously for at least twelve months, in Northern Ireland, 2008 – 2012.
Children in the non-formal education system: Tables for Northern IrelandTable G33. Numbers of young people in “Education Otherwise Than at School” in
Northern Ireland, 2012.
Percentage of children who attend pre-school education: Tables for England Table G34. Number and percentage of 3- and 4-year-old children taking up or
benefitting from funded early education places in England, 2009 to 2013.
Tables for ScotlandTable G35. Percentage of children who attend pre-school in Scotland, 2009-2012.
Tables for Northern IrelandTable G36. Percentage of children who attend pre-school, in Northern Ireland,
2008/09-2012/13.
Young people not in education, employment or training (NEET): Tables for United KingdomTable G37. Percentage of Young People age 16/17 in the United Kingdom who were
not in Education, Employment or Training (NEET), quarterly Spring 2012 to 2013.
H. Special protection measures (articles 22, 30, 32-36, 37 (b)-(d), 38, 39 and 40) 174
H.1. Children outside their country of origin seeking refugee protection (article 22) and internally displaced children
12

Tables for United KingdomTable H1.1. Unaccompanied Asylum Seeking Children (UASC), excluding dependants,
initial decisions received in the United Kingdom for those 17 or under, 2008-2012.
Table H1.2. Unaccompanied Asylum Seeking Children (UASC), excluding dependants, applications received in the United Kingdom for those 17 or under by gender, 2008-2012.
Table H1.3. Age disputed asylum applications received in the United Kingdom, 2008 to 2012.
H.2. Children in armed conflicts (article 38), including physical and psychological recovery and social reintegration (article 39)
Tables for United KingdomTable H2.1. Intake of under-18s into the United Kingdom regular armed forces
(including both trained and untrained personnel), 2008/09 to 2012/13.
H.3. Economic exploitation of children, including child labour (article 32)
No data.
H.4. Sexual exploitation, abuse and trafficking (articles 34 and 35)
Tables for England and WalesTable H4.1. Police recorded sexual offences in England and Wales, 2008/09 to
2012/13. Table H4.2. Offenders cautioned for sexual offences, in England and Wales, 2008/09
to 2012/13. Table H4.3. Defendants proceeded against at magistrates' courts for sexual offences,
England and Wales, 2008/09 to 2012/13. Table H4.4. Offenders found guilty of sexual offences at all courts, England and Wales,
2008/09 to 2012/13. Table H4.5. Juvenile defendants (aged 10-17) proceeded against at the magistrates'
court, found guilty and sentenced at all courts for offences relating to trafficking of people and abduction of children in England and Wales, 2008-2012.
H.5. The administration of juvenile justice (article 40)
Tables for England and WalesTable H5.1. Proportion of 10-17 year olds who have not had any contact with the
criminal justice system (as measured by a reprimand, warning or conviction) in England and Wales, 2007 to 2011.
Table H5.2. Number 10-17 year old first time entrants to the criminal justice system and rateEngland and Wales, by gender, 2008 to 2012.
Table H5.3. Number of arrests for notifiable offences by age group, England and Wales, 2007/08 - 2011/12.
Table H5.4. Percentage of persons (aged 10-17) arrested for notifiable offences by gender, England and Wales, 2007/08 to 2011/12.
Table H5.5. Juveniles sentenced to community sentences (for all offences), England and Wales, 2007/08 to 2011/12.
Table H5.6. Non-custodial and non-community sentences given to juveniles for all offences, England and Wales, 2007/08 to 2011/12.
Tables for Scotland
13

Table H5.7. Provision of legal assistance for representation in the Children’s Hearings system in Scottish Courts, 2008/09 to 2012/13.
Table H5.8. Provision of legal assistance to under 18s for representation in criminal proceedings in Scottish Courts, 2008/09 to 2012/13.
Table H5.9. Number of under 18s convicted in Scottish Courts, 2007/08 to 2011/12. Table H5.10. Number of 8-17 year olds who have committed detected crimes and
offences, in Scotland 2007/08 to 2011/12.
Tables for Northern IrelandTable H5.11. Admissions to custody, in Northern Ireland, 2008/09 to 2012/13 (including
those under the Police and Criminal Evidence Order PACE). Table H5.12. Number of persons under 18 years of age convicted of an offence and
percentage given each disposal in Northern Ireland, 2005-2009.
H.6. Children deprived of their liberty, including any form of detention, imprisonment or placement in custodial settings (article 37 (b)-(d))
Tables for England and WalesTable H6.1. Average under 18 custody population by gender, England and Wales,
2007/08 to 2011/12. Table H6.2. Average under 18 custody population by age, England and Wales,
2007/08 to 2011/12. Table H6.3. Average under 18 custody population by ethnicity, England and Wales,
2007/08 to 2011/12. Table H6.4. Average days in custody by legal basis for detention (under 18s only),
England and Wales, 2007/08 - 2011/12. Table H6.5. Population (aged 15-17) in prison establishments by sex, ethnicity and
religion, England and Wales, June 2008-2012.
Tables for ScotlandTable H6.6. Number of under 18s held in prison in Scotland, between 2007/08 and
2011/12, by gender. Table H6.7. Average length of time spent in detention (not necessarily continuously) by
under 18s, in Scotland, during 2007/08 to 2011/12. Table H6.8. Average length of time spent in detention (continuously) by under 18s, in
Scotland, during 2007/08 to 2011/12.
Tables for Northern IrelandTable H6.9. Admissions to the Juvenile Justice Centre for those children either held
under the Police and Criminal Evidence Order PACE or on pretrial detention, in Northern Ireland, 2008-2012.
Table H6.10 Number of persons under 18 years of age convicted of an offence, number sentenced to immediate custody and the average sentence length in months; in Northern Ireland, 2005-2009.
14

PREFACE
The data presented in this annex have been gathered from published sources and from relevant Government Departments in England, Wales, Scotland and Northern Ireland. The structure and content of the annex closely follows the guidance set out in the UNCRC guidelines on the inclusion of statistical information and data and we have endeavoured to provide all relevant information, where this is available.
Where national statistics are collected and published at a United Kingdom (UK) level, for example population data from the Office for National Statistics, then these are presented in this annex for the UK as a whole and for its constituent countries - England, Wales, Scotland and Northern Ireland. Some statistics are provided here for Great Britain (England, Wales and Scotland), such as income and benefits data from the Department for Work and Pensions. Many of the data tables in the annex however are presented separately for the constituent countries of the UK as each country collects its own data, for example education, childcare, health, juvenile justice. These are not always directly comparable, as the data are not collected at the same time and often use slightly different definitions.
Some countries do not collect or publish data on all of the issues covered in the annex, so for some issues, data are not available for every country of the UK. In other instances some countries have not been able to provide relevant data because their underlying sample sizes are too small.
The tables in this annex were compiled between June and September 2013 and present the latest available data at that time.
15

A. Key points from the data annex
There has been a steady increase in the size of the UK child population over the last five years, with around 400,000 more 0-18 year olds in 2012 compared to 2008.
The number of deaths as a result of traffic accidents in England & Wales has dropped by around 40 per cent, from 690 in 2007 to 402 in 2011.
There has been a small but steady drop in the number of school councils in Wales, from 1,640 in 2008-09 to 1,573 in 2012-13.
The number of teenage mothers in England & Wales has decreased by over 20 per cent between 2007 and 2011, from 25,914 to 20,215.
The number of public libraries available to children in the UK has decreased from 4,698 in 2007/08 to 4,384 in 2011/12
70 per cent of children aged 7-16 in Great Britain have access to the internet in their own room and spend on average 1.9 hours a day per day online.
The number of registered childcare services has remained broadly constant, with 10,250 providers in Scotland in 2008 and 10,159 in 2011.
The population of children looked after by local authorities in England has increased steadily from 60,900 in 2009 to 68,110 in 2013; in Wales the numbers have shown a similar trend, from 4,088 in 2008 to 5,179 in 2012; the increase in Northern Ireland has been less pronounced, from 2,463 in 2009 to 2,644 in 2012; likewise, in Scotland the numbers have increased from 15,287 in 2008/09 to 16,248 in 2011/12. (The Wales figures exclude children placed with their parents).
There has been a steady increase in the number of children adopted, from 3,180 in 2008 to 3,450 in 2012 in England; from 441 in 2007 to 496 in 2011 in Scotland; and from 50 in 2010 to 98 in 2013 in Northern Ireland.
Infant mortality rates remain low and falling across the UK.
The per cent of low birth rates is higher in England and Wales (7.1% less than 2,500 grams in 2011) than Scotland (5.0%) and Northern Ireland (6.06%).
A majority of children in the UK have completed primary immunisation sources against DTaP/IPV/Hib (95.1%), MenC (94.3%) and PCV (94.8%) by their first birthday.
Around four fifths of mothers initially breast feed in the UK (81% in 2101); rates tend to be lower among young mothers, the White ethnic group, and those from lower socio-economic classes.
There are around 178,000 young carers in England and Wales.
16

The use of drugs and alcohol is falling among young people aged 11-15 in England, from 15% using drugs in the last year in 2008 to 12% in 2012 and from 18% drinking alcohol in the last week in 2008 to 10% in 2012.
Around 85 per cent of 11 year olds in England achieve the expected level of English attainment, up four percentage points since 2008; three in five (59.4%) achieve five or more GCSES A*-C including English and Maths, up from 49.8% in 2008-09. Pupils who receive Free School Meals do markedly less well; pupils who have a first language other than English also do less well, but the gap is small.
The pupil: teacher ratio is low in Scotland (13.4 in 2012) compared to England (20.9 qualified teachers in 2012) and (17.5 in Northern Ireland 2012/13).
Around one in twenty (4.9%) 16 and 17 year olds in the UK were not in education, employment or training (NEET) in April to June 2013; this has dropped from 6.2% a year ago.
The number of applications to the UK received from Unaccompanied Asylum Seeking Children has fallen from 4,285 in 2008 to 1,168 in 2012.
The number of young people coming into contact with the criminal justice system for the first time in England and Wales has fallen by over 60% between 2008 and 2012, to 36,677; the number of under 18s convicted of an offence in Northern Ireland has fallen from 1,455 in 2005 to 1205 in 2009; likewise, the number of under 18s convicted in Scottish Courts has fallen from 7,924 in 2007-08 to 3,390 in 2011-12.
17

B. Definition of the child (article 1)
Tables for the United Kingdom
Table B1. Mid-2008 to Mid-2012 Population estimates for 0-17 year olds, by gender, for the United Kingdom and England, Wales, Scotland and Northern Ireland.
Source: ONS. Mid-2011 and 2012: http://www.ons.gov.uk/ons/publications/re-reference-tables.html?edition=tcm%3A77-319259. Mid-2002 to 2010 revised national - England and Wales: http://www.ons.gov.uk/ons/publications/re-reference-tables.html?edition=tcm%3A77-269171 . Mid 1961 to 2012 revised national – Northern Ireland: http://www.nisra.gov.uk/archive/demography/population/midyear/NI_sya(1961_2012).xls. Mid 1971-2012 unrevised UK estimates:http://www.ons.gov.uk/ons/rel/pop-estimate/population-estimates-for-uk--england-and-wales--scotland-and-northern-ireland/population-estimates-timeseries-1971-to-current-year/index.html
Year 2008 2009 2010 2011 2012United Kingdom
Total 0-17 year olds 13,116,315* 13,116,604* 13,139,793* 13,446,180 13,524,254
Gender Male 6,718,874* 6,717,265* 6,730,272* 6,888,368 6,928,099
Female 6,397,441* 6,399,339* 6,409,521* 6,557,812 6,596,155
EnglandTotal 0-17 year olds 11,202,377 11,231,596 11,279,426 11,340,751 11,423,310
Gender Male 5,730,958 5,746,172 5,775,379 5,809,027 5,851,027Female 5,471,419 5,485,424 5,504,047 5,531,724 5,572,283
WalesTotal 0-17 year olds 639,895 636,275 633,104 632,433 630,906
Gender Male 327,636 325,816 324,724 324,794 323,883
Female 312,259 310,459 308,380 307,639 307,023
ScotlandTotal 0-17 year olds 1,045,600* 1,042,400* 1,038,000* 1,042,058 1,038,464
Gender Male 535,500* 533,500* 531,000* 533,607 531,775
Female 510,300* 509,000* 506,600* 508,451 506,689
Northern IrelandTotal 0-17 year olds 429,945 430,050 430,248 430,938 431,574
Gender Male 220,395 220,448 220,516 220,940 221,414
Female 209,550 209,602 209,732 209,998 210,160
*2008, 2009, 2010 UK and Scotland figures are unrevised estimates. All other estimates are revised in light of 2011 Census.
18

Tables for England and Wales
Table B2. Estimated resident population aged 0-15 by broad ethnic group in England and Wales, mid-2006-2009 (experimental statistics).
Source: ONS http://www.ons.gov.uk/ons/taxonomy/index.html?nscl=Population+Estimates+by+Ethnic+Group#tab-data-tables
Figures in thousands
Year 2006 2007 2008 2009
All Ethnic Groups 10,231.1 10,210.4 10,219.3 10,254.6
White 8,731.3 8,664.6 8,624.6 8,607.4
Mixed 387.1 402.8 421.7 442.4
Asian or Asian British 689.2 708.2 727.5 748.4
Black or Black British 321.6 327.5 333.4 339.3
Other Ethnic Group 101.9 107.4 112.1 117.1
Note on reliability: The Population Estimates by Ethnic Group are experimental statistics, and have not been shown to meet the standards required of National Statistics.
Information on sources of uncertainty is provided in the Quality and Methodology Information (QMI) document available from this link:http://www.ons.gov.uk/ons/guide-method/method-quality/quality/quality-information/social-statistics/index.html
19

C. General principles (articles 2, 3, 6 and 12)
1. Right to life, survival and development (article 6)
Tables for England and Wales
Table C1.1. Deaths of those aged 19 and under as a result of illnesses, including HIV/ AIDS, malaria, tuberculosis, polio, viral hepatitis and diseases of the respiratory system, in England and Wales, 2007-2011.
Source: ONS http://www.ons.gov.uk/ons/rel/vsob1/mortality-statistics--deaths-registered-in-england-and-wales--series-dr-/index.html
Year 2007 2008 2009 2010 2011HIV (ICD-10 codes B20-B24) 2 3 3 2 1
Malaria (ICD-10 B50 -B541) 1 0 0 0 0
Tuberculosis(ICD-10 A15-A19 and B902)
2 2 1 4 3
Polio (ICD-10 A80) 0 0 0 0 0
Viral Hepatitis (ICD-10 B15-B19 and B94.23) 2 0 1 0 0
Diseases of the Respiratory System (ICD-10 J00-J99)
209 213 231 195 207
Total 216 218 236 201 211Gender
Male
Female
117
99
126
92
124
112
94
107
121
90Age
0-4
5-9
10-14
15-19
125
24
30
37
134
21
29
3
118
34
33
51
111
29
28
33
134
26
22
291These codes represent: Plasmodium falciparum malaria, Plasmodium vivax malaria, Plasmodium malariae malaria, other parasitologically confirmed malaria and Unspecified malaria2Sequelae of Tuberculosis3Sequelae of Viral Hepatitis
20

Table C1.2. Deaths of those aged 19 and under as a result of traffic or other accidents in England and Wales, 2007 to 2011, by age-group and gender.
Source: ONS http://www.ons.gov.uk/ons/rel/vsob1/mortality-statistics--deaths-registered-in-england-and-wales--series-dr-/index.html
Year 2007 2008 2009 2010 2011Traffic or other accidents (ICD-10 codes V01-X59, Y851 and
Y862)Total
690 653 571 479 402
Gender M F M F M F M F M F
Age Under 1s 17 9 16 11 22 16 15 10 10 8
1-4 44 18 36 28 23 33 34 26 32 18
5-9 31 14 23 13 23 15 20 11 24 9
10-14 63 28 54 27 38 23 43 16 25 19
15-19 352 104 342 103 298 80 229 75 196 61
1Sequelae of Transport Accidents2Sequelae of Other Accidents
21

Table C1.3. Deaths of those aged 19 and under as a result of Homicide in England and Wales, 2007 to 2011, by age-group and gender.
Source: ONS http://www.ons.gov.uk/ons/rel/vsob1/mortality-statistics--deaths-registered-in-england-and-wales--series-dr-/index.html
Year 2007 2008 2009 2010 2011Homicide (ICD-10 codes X85-Y09 (Assault))
Total 41 47 58 57 34
Gender M F M F M F M F M F
Age Under 1s 6 2 4 3 4 4 3 5 2 3
1-4 6 4 4 8 3 4 4 3 4 3
5-9 2 1 2 1 2 1 2 3 2 3
10-14 0 3 1 0 1 1 1 1 3 0
15-19 24 9 30 5 21 6 13 6 12 2
22

Table C1.4. Deaths of those aged 19 and under as a result of Suicides (and for the 15-19 age group Event of Undetermined Intent), in England and Wales, 2007 to 2011, by age-group and gender.
Source: ONS http://www.ons.gov.uk/ons/rel/vsob1/mortality-statistics--deaths-registered-in-england-and-wales--series-dr-/index.html
Year 2007 2008 2009 2010 2011Suicides (ICD-10 codes X60-84 and for the 15-19 age group Y10-Y34 (Event of Undetermined Intent))Total
135 138 123 112 150
Gender M F M F M F M F M F
Age Under 1s 0 0 0 0 0 0 0 0 0 0
1-4 0 0 0 0 0 0 0 0 0 0
5-9 0 0 0 0 0 0 0 0 0 0
10-14 5 2 3 5 1 1 1 1 5 4
15-19 96 32 97 33 88 33 74 36 100 41
23

Table C1.5. All deaths of those aged 19 and under in England and Wales, 2007 to 2011, by age-group and gender.
Source: ONS http://www.ons.gov.uk/ons/rel/vsob1/mortality-statistics--deaths-registered-in-england-and-wales--series-dr-/index.html 1
Year 2007 2008 2009 2010 2011All deaths (ICD-10 code A00-Y89)Total 5,794 5,691 5,542 5,202 5,032
Gender M F M F M F M F M F
Age Under 1s 1,889 1,456 1,920 1,449 1,856 1,456 1,720 1,420 1,845 1,309
1-4 339 235 284 270 245 240 271 229 278 234
5-9 182 121 180 137 147 132 157 135 162 97
10-14 226 192 190 140 195 165 180 147 163 125
15-19 797 357 779 351 778 328 601 342 557 262
1 2012 data available at the same link - we have used this for the 15.3% fall in child deaths between 2007 and 2012 noted in the Treaty specific report (p3).
24

Tables for Scotland
Table C1.6. Deaths of those aged 19 and under as a result of illnesses, including HIV / AIDS, malaria, tuberculosis, polio, hepatitis and diseases of the respiratory system, in Scotland, 2007-2011.
Source: NRShttp://www.gro-scotland.gov.uk/statistics/theme/vital-events/general/ref-tables/index.html
Year 2007 2008 2009 2010 2011HIV (ICD-10 B20-B24) 0 1 0 0 0
Malaria (ICD-10 B50, B50.0, B50.9 and B54)Tuberculosis(ICD-10 A15-A19 and B90)
0 1 1 0 0
Polio (ICD10 A80)
Hepatitis (ICD10 B15-B19 and B94.2)Diseases of the Respiratory System (ICD10 J00-J99)
17 16 19 8 15
Total 17 18 20 8 15
Gender
Male
Female
13
4
10
8
9
11
3
5
11
4Age
0-4
5-9
10-14
15-19
9
0
2
6
8
5
2
3
8
5
4
3
6
0
1
1
3
3
4
5
25

Table C1.7. Deaths of those aged 19 and under as a result of Accidents in Scotland, from 2007-2011, by age-group and gender.
Source: NRShttp://www.gro-scotland.gov.uk/statistics/theme/vital-events/general/ref-tables/index.html
Year 2007 2008 2009 2010 2011AccidentsTotal 79 70 66 55 50
Gender M F M F M F M F M F
Age Under 1s 1 3 0 0 3 2 4 0 2 1
1-4 3 2 5 3 4 1 1 1 5 1
5-9 4 1 5 2 2 2 4 0 5 0
10-14 4 2 6 2 6 1 2 0 1 1
15-19 46 13 33 14 37 8 31 12 27 7
26

Table C1.8. Deaths of those aged 19 and under as a result of Homicide in Scotland, from 2007-2011, by age-group and gender.
Source: NRShttp://www.gro-scotland.gov.uk/statistics/theme/vital-events/general/ref-tables/index.html
Year 2007 2008 2009 2010 2011HomicideTotal 9 14 8 11 10
Gender M F M F M F M F M F
Age Under 1s 0 0 0 3 0 0 1 0 0 0
1-4 0 0 2 0 0 0 0 0 0 1
5-9 0 0 2 0 0 0 2 1 0 1
10-14 1 0 0 0 0 1 0 0 1 0
15-19 8 0 3 4 6 1 6 1 7 0
27

Table C1.9. Deaths of those aged 19 and under as a result of Suicides (and for the 15-19 age group Event of Undetermined Intent), in Scotland, from 2007-2011, by age-group and gender.
Source: NRShttp://www.gro-scotland.gov.uk/statistics/theme/vital-events/general/ref-tables/index.html
Year 2007 2008 2009 2010 2011Suicides and for the 15-19 age group (Event of Undetermined Intent)Total 45 36 38 37 31
Gender M F M F M F M F M F
Age
Under 1s 0 0 0 0 0 0 0 0 0 0
1-4 0 0 0 0 0 0 0 0 0 0
5-9 0 0 0 0 0 0 0 0 0 0
10-14 2 1 2 0 2 2 0 1 0 0
15-19 31 11 26 8 25 9 24 12 17 14
Note: This is not the definition used in other NRS published suicide statistics.
28

Tables for Northern Ireland
Table C1.10. Deaths- of those under 18 as a result of illnesses, including HIV / AIDS, malaria, tuberculosis, polio, hepatitis and acute respiratory infections, in Northern Ireland, 2008-2012.
Source: NISRA http://www.nisra.gov.uk/demography/default.asp14.htm
Year 2008 2009 2010 2011 2012P
HIV/AIDS (ICD10 B20-B24)
Malaria (ICD10 B50-B54)
Tuberculosis (ICD10 A15-A19)
Hepatitis (ICD10 B15-B19)
Polio (ICD10 A80)
Acute Respiratory Infections (ICD10 J00-J99)
Total
0
0
0
0
0
14
14
0
0
0
0
0
14
14
0
0
0
0
0
5
5
0
0
0
0
0
6
6
0
0
0
0
0
6
6
Gender
Male
Female
9
5
6
8
3
2
3
3
4
2
Age 0-4
5-9
10-14
15-17
7
2
4
1
10
1
2
1
3
2
0
0
5
1
0
0
2
3
1
0
P provisional figures
29

Table C1.11. Deaths of those under 18 as the result of traffic or other accidents, by age and gender, Northern Ireland, 2008-2012.
Source: NISRA http://www.nisra.gov.uk/demography/default.asp14.htm
Year 2008 2009 2010 2011 2012P
Accidents (ICD10 V00-X59, Y85, Y86)Total 28 20 25 17 15
Gender
Male
Female
20
8
14
6
14
11
12
5
13
2
Age
0-4
5-9
10-14
15-17
4
3
1
20
4
3
4
9
6
3
7
9
3
1
4
9
2
1
1
11P provisional figures
30
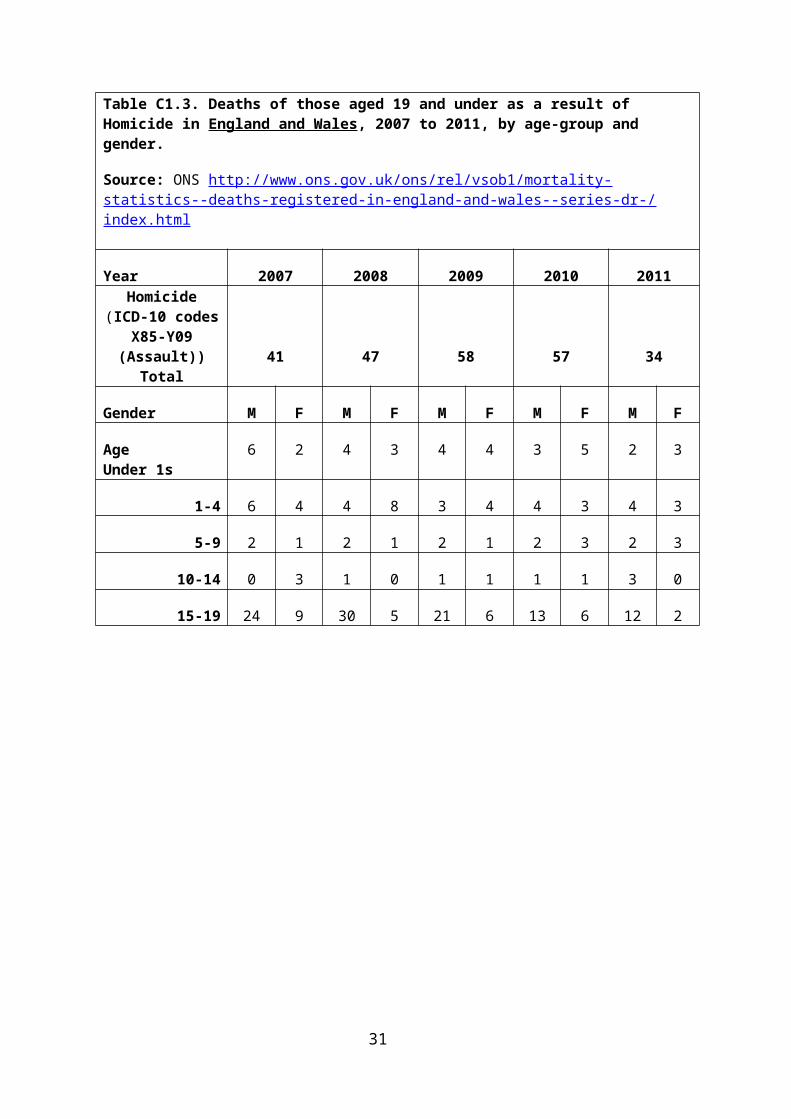
Table C1.12. Deaths of those under 18 as the result of crime and other forms of violence, by age and gender, Northern Ireland, 2008-2012.
Source: NISRA http://www.nisra.gov.uk/demography/default.asp14.htm
Year 2008 2009 2010 2011 2012P
Assault (ICD10 X85-Y09)
Total 0 8 2 1 0
Gender
Male
Female
0
0
3
5
1
1
1
0
0
0
Age
0-4
5-9
10-14
15-17
0
0
0
0
3
1
1
3
0
1
0
1
1
0
0
0
0
0
0
0P provisional figures
31

Table C1.13. Deaths of those under 18 due to suicide, by age and gender, Northern Ireland, 2008-2012.
Source: NISRA http://www.nisra.gov.uk/demography/default.asp31.htm
Year 2008 2009 2010 2011 2012P
Suicide (ICD10 X60-X84, Y10-Y34, Y87.0-2)
Total 15 8 9 14 10
Gender
Male
Female
12
3
5
3
5
4
11
3
6
4
Age
0-4
5-9
10-14
15-17
0
0
3
12
0
0
1
7
0
0
1
8
0
0
3
11
0
0
5
5P provisional figures
32

2. Respect for the views of the child (article 12)
Tables for the United Kingdom
Table C2.1. Youth Voice in the United Kingdom, 2010-2013.
Source: British Youth Council
There were approximately 19,000 youth councillors across the UK in 2010.
Across the UK the following youth voice vehicles are in place:
Over 400 youth councils in the UK UK Youth Parliament Scottish Youth Parliament Youth Assembly of Wales Northern Ireland Youth Forum 16 Young Mayor schemes
In 2012/2013 over 600,000 young people took part in youth elections.
Tables for Wales
Table C2.2. Number of school councils1 in maintained primary, secondary, middle and special schools in Wales, 2008-09 to 2012-13.
Source: Welsh Government
2008-09 2009-10 2010-11 2011-12 2012-13
Total 1,640 1,633 1,612 1,599 1,573
Primary Schools 1,373 1,367 1,347 1,335 1,311
Secondary Schools 223 223 222 221 216
Middle School - - - - 4
Special Schools 44 43 43 43 42
- No data for middle schools1Every maintained school in Wales (excluding infant schools and nurseries) have been required by law to have a school council since November 2006.
33

Tables for Scotland
Table C2.3. Number of children in uniformed voluntary organisations in Scotland for 2009-2013.*
*These data refer just to the 4 main uniformed organisations in Scotland (Girl Guides, Scouts, Boys Brigade and Girls Brigade).
Year 2009 2010 2011 2012 2013^
Total 108,655 107,613 108,811 110,798 111,443
Gender
Female 62,365 60,635 61,179 61,890 61,728
Male 46,290 46,978 47,632 48,908 49,715
^ Data for 2013 have partial figures for Girl Guides (total as at 31 July 2013) and, in the absence of a figure for Boys Brigade, we have used the same membership figure as 2012.
Tables for Northern Ireland
Table C2.4. Number of organisations for youths (people aged 4-25), in Northern Ireland, 2009-2011.
The figures provided include statutory (controlled), voluntary and uniformed youth provision. They do not include area-based (rather than unit-based) programmes (since 2010) and do not include regional youth work provision.
Source: The Youth Service for Northern Ireland – A statistical and Geographical Report of Registered Youth Service in Northern Ireland – 2011 Data Cycle http://www.ycni.org/publications/publications.html
Year 2009 2010 2011 2012 2013
Total 1,929 1,898 1,854 - -
34

D. Civil rights and freedoms (articles 7, 8, 13-17, 28, para. 2, 37 (a) and 39)
1. Birth registration (article 7)
Tables for England and Wales
Table D1.1. Live births occurring within/outside marriage/civil partnership1 by gender, England and Wales, 2007 to 2011.
Source: ONS http://www.ons.gov.uk/ons/rel/vsob1/characteristics-of-Mother-1--england-and-wales/index.html
2007 2008 2009 2010 2011
All Total 690,013 708,711 706,248 723,165 723,913
Within marriage/civil partnership
Males 197,493 198,571 195,036 197,349 195,644
Females 186,970 189,359 185,033 187,026 186,930
Total 384,463 387,930 380,069 384,375 382,574
Outside marriage/civil partnership
Males 156,995 164,392 167,099 173,617 175,330
Females 148,555 156,389 159,080 165,173 166,009
Total 305,550 320,781 326,179 338,790 341,339
1The Human Fertilisation and Embryology Act 2008 contained provisions enabling two females in a same-sex couple to register a birth from 1 September 2009 onwards. Due to the small numbers in 2009, 2010 and 2011, births registered to a same-sex couple in a civil partnership are included with marital births (417 in 2011, 335 in 2010, 22 in 2009), while births registered to a same-sex couple outside of civil partnership are included with births outside marriage (191 in 2011, 140 in 2010, 2 in 2009).
35

Table D1.2. Live births occurring within/outside marriage/civil partnership by mothers age 18 and under, England and Wales, 2007 to 2011.
Source: ONShttp://www.ons.gov.uk/ons/rel/vsob1/characteristics-of-Mother-1--england-and-wales/index.htmlhttp://www.ons.gov.uk/ons/publications/re-reference-tables.html?edition=tcm%3A77-226270http://www.ons.gov.uk/ons/publications/re-reference-tables.html?edition=tcm%3A77-39618
2007 2008 2009 2010 2011
All mothers age 18 and under Total 25,914 25,804 24,796 22,842 20,215
Within marriage/civil partnership
Gender of child M F M F M F M F M F
Age of Mother
Under 14* 1 - - - 0 1 0 0 - -
14* 3 1 - - - - 1 2 - -
15* 3 7 3 2 0 2 3 1 1 4
16 29 14 20 17 21 15 18 13 7 6
17 115 110 88 84 97 83 73 67 53 52
18 341 344 307 294 263 235 200 232 168 168
Total 968 815 717 610 459
Outside marriage/civil partnership
Under 14* 12 11 10 8 15 10 7 9 - 8
14* 96 87 113 80 68 86 103 78 - 65
15* 459 459 535 462 436 420 446 413 371 344
16 1,747 1,591 1692 1,535 1,607 1,511 1,449 1,353 1,316 1,193
17 4,165 3,798 4121 3,851 3,899 3,686 3,581 3,388 3,147 2,919
18 6,418 6,103 6573 6,009 6,317 6,024 5,866 5,539 5,266 5,034
Total 24,946 24,989 24,079 22,232 19,756
Some cells have been supressed to protect the confidentiality of individuals.* The minimum legal age for marriage is 16 years of age in England and Wales, however, it is possible to marry at younger ages in other countries.
36

Tables for Wales
Table D1.3. Live births, Wales, 2008 – 2012.
Source: https://statswales.wales.gov.uk/Catalogue/Health-and-Social-Care/Births-Deaths-and-Conceptions/Births
Year 2008 2009 2010 2011 2012
Total 35,650 34,937 35,952 35,598 35,238
Tables for Scotland
Table D1.4. Birth registrations in Scotland, 2007- 2011 and percentage registered within 21 days.
Source:http://www.gro-scotland.gov.uk/statistics/theme/vital-events/general/ref-tables/index.htmlhttp://www.gro-scotland.gov.uk/statistics/theme/vital-events/general/weekly-monthly-births-death-data/weekly/index.html
Year 2007 2008 2009 2010 2011
Number of birth registrations 57,781 60,041 59,046 58,791 58,590
Percentage registered in 21 days 96% 96% 97% 97% 97%
37

Table D1.5. Live births: occurring within/outside marriage/civil partnership by gender, Scotland, 2007-2011.
Source: NRShttp://www.gro-scotland.gov.uk/statistics/theme/vital-events/general/ref-tables/index.html
Year 2007 2008 2009 2010 2011
Total 57,781 60,041 59,046 58,791 58,590
Within marriage/civic partnership
Males 15,056 15,265 15,029 14,880 14,749
Females 14,348 14,721 14,307 14,383 13,953
Total 29,404 29,986 29,336 29,263 28,702
Outside marriage/civic partnership
Males 14,638 15,305 15,136 14,992 15,362
Females 13,739 14,750 14,574 14,536 14,526
Total 28,377 30,055 29,710 29,528 29,888
38

Tables for Northern Ireland
Table D1.6. Registered live births and percentage registered within 42 days, Northern Ireland, 2008-2012.
Source: NISRA
Year 2008 2009 2010 2011 2012P
Registered Live Births (incl. non-residents)
Percentage registered within 42 days
26,252
97.9%
25,487
98.1%
25,770
98.4%
25,733
98.4%
25,621
98.5%
P provisional figures
Note: Babies born in Northern Ireland must be registered within 42 days of the birth. Where a birth hasn’t been registered within this timeframe, General Register Office for Northern Ireland (GRONI) make contact with the parents to request that the birth be registered. This is followed up by GRONI staff to ensure all births are registered.
39

2. Access to appropriate information (article 17)
Tables for United Kingdom/ Great Britain
Table D2.1. Number of public libraries available to children in the United Kingdom, including mobile libraries, 2007/08 to 2011/12.
Source: CIPFA Public Library Statistics http://www.cipfastats.net/terms.asp
Year 2007/08 2008/09 2009/10 2010/11 2011/12
UK Total 4,698 4,666 4,612 4,597 4,384
Total service points open 10 hours or more per week
England 3,469 3,451 3,428 3,397 3,243
Wales 338 332 331 353 309
Scotland 604 598 597 595 586Northern
Ireland 129 136 126 126 127
Total 4,540 4,517 4,482 4,471 4,265
Service points open less than 10 hours per week (including mobiles)
England 96 91 73 76 77
Wales 30 28 27 25 18
Scotland 32 30 30 25 24Northern
Ireland - - - - -
Total 158 149 130 126 119
40

Table D2.2. Proportion of 5-16 year olds in Great Britain who have a computer at home and who own their own computer, 2008-2012.
Source: Childwise Monitor Trends Reports http://www.childwise.co.uk
Year 2008 2009 2010 2011 2012
Computer at home (%) 95 95 95 97 96
Owns their own computer (%) 55 59 62 74 73
41

Table D2.3. Proportion of 7-16 year olds in Great Britain who have access to and use the internet in their own homes and who read a book for pleasure, 2008-2012.
Source: Childwise Monitor Trends Reports http://www.childwise.co.uk
Year 2008 2009 2010 2011 2012
Internet access at home (%) 86% 87% 89% 91% 92%
Access internet in their own room (%) 42% 49% 53% 66% 70%
Average weekly frequency (days accessed) of Internet use (7 to 16 year olds using the Internet) 4.8 5.1 5.5 5.2 5.4
Average time (hours) spent online per day (7 to 16 year olds using the Internet) 1.7 2.0 2.0 1.8 1.9
Frequency of reading books for pleasure (%)
Every day 28 31 28 30 31
Once a week 21 20 22 21 22
Weekly or less 25 23 26 26 22
Never 19 20 18 17 18
42

3. The right not to be subjected to torture or other cruel inhuman or degrading treatment or punishment (articles 37 (a) and 28, para. 2))
Tables for Northern Ireland
Table D3.1. Training undertaken in Therapeutic Crisis Intervention and Physical Control and Care in Northern Ireland, 2009-2013.
Source: YJA Statistics and Research Branch.
Year 2009 2010 2011 2012 2013
Full TCI 8 6 3 15 3
Full PCC 8 6 3 26 6
TCI refresher 122 120 101 101 37*
PCC refresher 122 117 106 99 27*
TCI trainer revalidation 8 4 1 3 4 (Oct. ’13)
PCC trainerrevalidation 10 9 9 9 0**
* Figures up to May 2013** PCC will be replaced in 2014
Note: All staff on appointment, and as part of their induction, complete a three day TCI course (Therapeutic Crisis Intervention) and a five day PCC (Physical Control in Care).
Courses must be re-validated annually.
TCI and PCC Trainers must revalidate every three years.
TCI and PCC have been developed to complement each other. TCI is used for de-escalation and conflict resolution. PCC is only used as a last resort.
43

D. Family environment and alternative care (articles 5, 9-11, 18 (paras. 1 and 2), 19-21, 25, 27 (para. 4) and 39)
1. Family support (articles 5 and 18, paras. 1 and 2)
Provision of childcare:
Tables for England
Table E1.1. Registered childcare providers1 and places2 for children aged 8 and under in England, at 31 March 2010 to 31 March 2013.
Source: OFSTED http://www.ofsted.gov.uk/resources/registered-childcare-providers-and-places-england-december-2008-onwards
31 March 2010 31 March 2011 31 March 2012 31 March 2013
Providers Places
Providers Places
Providers Places
Providers Places
Total 93,870 1,309,856 94,939 1,300,92
9 95,992 1,310,738 95,987 1,309,33
9
Childminder
57,732 280,988 57,228 275,481 57,474 282,158 56,166 227,422
Childcare on Non-
Domestic Premises
28,820 1,027,420
29,439 1,023,602
27,942 1,026,340
27,931 1,029,219
Childcare on
Domestic Premises
104 1,448 119 1,836 140 2,240 160 2,698
Home Childcarer
7,214 - 9,153 - 10,436 - 11,730 -
1Providers are the number of providers registered on the database at the end of the relevant period. As not all providers inform Ofsted that they have ceased provision, this number is likely to be higher than the actual number of providers.
2Registered places are the number of children that may attend the provision at any one time. Registered places are not the number of places occupied, nor the number of children who may benefit from receiving places through providers offering sessions at different times of the day. Place numbers are only collected for providers on the Early Years Register. For these providers, the numbers show the total places available for children under eight. As of 1 September providers can only care for children in accordance with the requirements of the Early Years Foundation Stage. Ofsted no longer set additional conditions at registration ad will only update data on available places at inspection. Averages are used for a very small number of providers whose place numbers are not available at the time of the analysis. There are very small discrepancies in totals due to rounding.
44

Tables for Wales
Table E1.2. Children's day care places in Wales (childminders, full day care, sessional day care, out of school care, crèches, open access play), 2009-2013.
Source: http://wales.gov.uk/cssiwsubsite/newcssiw/?lang=en
Year 2009 2010 2011 2012 2013
Total 73,689 73,317 75,297 76,033 75,944
45

Tables for Scotland
Table E1.3. Number of registered childcare services by main service type and service status (active / inactive), in Scotland, at 31 December 2008- 2011.
Source: Care Inspectorate service-lists and annual return data
Year 2008 2009 2010 2011Total 10,250 10,179 10,112 10,159Childminding 6,039 6,066 6,107 6,249Children / family centre 142 131 136 142
Creche 164 152 120 109Holiday play scheme 116 99 78 61Nursery 2,464 2,476 2,478 2,458Out of school club 808 781 745 712Playgroup 486 445 416 387Other services 31 29 32 41Active - total 9,687 9,624 9,486 9,575Childminding 5,503 5,540 5,529 5,705Children / family centre 141 130 134 142
Creche 160 148 113 104Holiday play scheme 112 95 68 56Nursery 2,450 2,460 2,464 2,440Out of school club 805 778 736 706Playgroup 485 444 411 384Other services 31 29 31 38Inactive - total 563 555 626 584Childminding 536 526 578 544Children / family centre 1 1 2 0
Creche 4 4 7 5Holiday play scheme 4 4 10 5Nursery 14 16 14 18Out of school club 3 3 9 6Playgroup 1 1 5 3Other services 0 0 1 3
Note: Counts of the number of active childminding and day care services are also published by the Scottish Social Services Council (SSSC) in their Scottish Social Services Sector: Report on 2011 Workforce Data (Official Statistics). The counts may vary slightly due to differences in the way the Care Inspectorate and SSSC classify an active service. The 'main service type' is based on information supplied by day care of children services in their annual returns. If a service did not respond to an annual return in a given year then their main type of service has been estimated by using annual return information submitted in another year or from other information about the service for example their conditions of registration.
Some services provide a mixture of types of day care. For example a service where the main provision is an out of school club may also in addition provide a holiday play scheme.Other services' includes services that cannot easily be assigned to one of the categories.
46

Table E1.4. Number of children and percentage of population aged 0-15 years old using childcare services in Scotland during the last full week before 30 November 2008 – 2011.
Source: Care Inspectorate service-lists, annual return data and GRO mid-year population estimates
Year 2008 2009 2010 2011
Total 223,990 221,510 218,280 222,360Childminding 27,070 28,050 28,020 29,150Children / family centre 8,930 8,300 8,960 9,030Creche 8,430 7,720 5,620 5,300Holiday play scheme 2,440 2,010 1,260 1,010Nursery 126,720 128,510 129,630 132,030Out of school club 38,020 35,880 34,310 34,340Playgroup 11,840 10,710 9,880 9,860Other services 540 340 600 1,640
Percentage 24.5% 24.3% 23.9% 24.3%Childminding 3.0% 3.1% 3.1% 3.2%Children / family centre 1.0% 0.9% 1.0% 1.0%Creche 0.9% 0.8% 0.6% 0.6%Holiday play scheme 0.3% 0.2% 0.1% 0.1%Nursery 13.9% 14.1% 14.2% 14.5%Out of school club 4.2% 3.9% 3.8% 3.8%Playgroup 1.3% 1.2% 1.1% 1.1%Other services 0.1% 0.0% 0.1% 0.2%
Note: Children are counted once for each centre and/or childminder they attend.All figures are rounded to the nearest 10 to express the uncertainty inherent in these estimates. For this reason, totals may not exactly equal the sum of their parts. Please note – it is not appropriate to compare the number of children attending day care services disaggregated by the main type of day care over time because variation in the way service providers record information from one year to the next can lead to large misleading fluctuations in the number of children attending services. Also, year to year fluctuations in both the population and the number of services will affect the numbers attending/registered from one year to the next.
47

Tables for Northern Ireland
Table E1.5. Children's Provision Industry Composition, Northern Ireland, 2012.
Source: DHSSPS – Registered childcare providers database (2012)
ServicesNumber of
registered providersProportion of the
overall sector
Approved home child carer/ Nanny/au-pair 5 0%
Crèche 90 2%
Child-minder 3,010 74%
Day Nursery 310 8%
Out of School 206 5%
Playgroups 467 11%
Total 4,088 100%
48

Children in need:Tables for England
Table E1.6. Number of Children in Need in England1, 2010 to 2012.
Source: DfE Children in Need census https://www.gov.uk/government/publications/characteristics-of-children-in-need-in-england-year-ending-march-2012
Year 2009-10 2010-11 2011-12
Numbers of Children in Need2
Number of children starting an episode of need 377,600 393,000 395,300Rate per 10,000 children aged under 18 years3 342.9 355.8 ..Rate per 10,000 children aged under 18 years (2011 census)4 .. .. 348.5
Number of children in need throughout the year 694,000 735,500 739,300Rate per 10,000 children aged under 18 years3 630.3 665.9 ..Rate per 10,000 children aged under 18 years (2011 census)4 .. ... 651.9
Number of children ending an episode of need 318,200 359,000 369,900Rate per 10,000 children aged under 18 years3 288.9 325.0 ..Rate per 10,000 children aged under 18 years (2011 census)4 .. .. 326.2
Number of children in need at 31 March 375,900 382,400 369,400Rate per 10,000 children aged under 18 years3 341.3 346.2 ..Rate per 10,000 children aged under 18 years (2011 census)4 .. .. 325.7
1 Figures include estimates for missing data and are rounded to the nearest 100.
2 Figures have been calculated by DfE based upon all information provided in the CIN return. Children in need are those who have been referred to children's social care services, and who have been assessed, usually through an initial assessment, to be in need of social care services. A child can have more than one episode of need throughout the year but episodes should not overlap. If a child has more than one episode, then each is counted in the figures.
3 Based on the population aged 0 - 17 years, estimated at mid-2009 and mid-2010, based upon the 2001 census. Source: Population Estimates Unit, ONS: Crown Copyright.
4 Based on the population aged 0 - 17 years, estimated at mid-2011, based upon the 2011 census. Source: Population Estimates Unit, ONS: Crown Copyright. Population estimates are included in the underlying data for the publication.
49

Tables for Wales
Table E1.7. Number of Children in Need in Wales, 2010 to 2012.1,2,3
Source: Children in need census, Welsh Governmenthttp://wales.gov.uk/topics/statistics/headlines/health2013/wales-children-need-census-2012
Year 2010 2011 2012
Number of children in need at 31 March 18,865 19,710 20,240
Rate per 10,000 children aged under 18 years 300 315 3201 Figures rounded to the nearest 5.2 Figures include unborn children.3 The Census collected individual records on all children in need, including those looked after by a local authority, who had an open case with a local authority on the 31 March that had been open for the three months from 1 January to 31 March.
50

Low income and material deprivation:
Tables for United Kingdom
Table E1.8. Percentage of children falling below various thresholds of low income and material deprivation, 2007/08 – 2011/12 in the United Kingdom.
Source: DWP/ Family Resources Survey (FRS)https://www.gov.uk/government/uploads/system/uploads/attachment_data/file/206778/full_hbai13.pdf
Year 2007/08 2008/09 2009/10 2010/11 2010/11* 2011/12*Low income and
material deprivation1
PercentageNumber in millions
17%2.2
17%2.2
16%2.1
14%1.9
13%1.7
12%1.6
Severe low income and material deprivation2
PercentageNumber in millions
6%0.8
6%0.8
5%0.7
4%0.6
4%0.5
3%0.4
All childrenNumber in millions 12.8 12.8 13.0 13.0 13.0 13.1
* New questions about four additional material deprivation items for children were introduced into the 2010/11 FRS and from 2011/12 four questions from the original suite were removed. Figures from the old and new suite of questions are not comparable.
1 A family is in low income and material deprivation if they have a material deprivation score of 25 or more and a household income below 70 per cent of contemporary median income, Before Housing Costs.
2 A family is in severe low income and material deprivation if they have a material deprivation score of 25 or more and a household income below 50 per cent of contemporary median income, Before Housing Costs.
Table E1.9. Percentage of children falling below various thresholds of contemporary median income, 2007/08 – 2011/12 in the United Kingdom.
Source: DWP/ Family Resources Survey (FRS)https://www.gov.uk/government/uploads/system/uploads/attachment_data/file/206778/full_hbai13.pdf
Year 2007/08 2008/09 2009/10 2010/11 2011/12Percentage of children
Before Housing CostsBelow median
50% 12 11 10 9 960% 23 22 20 18 1770% 33 32 31 29 29
51

2. Children without parental care (articles 9 (paras. 1-4), 21 and 25)
Number of looked after children:
Tables for England
Table E2.1. Number of children looked after by local authorities in England at 31 March, by gender, age, category of need and ethnic origin, 2009-2013.
Source: Department for Education, Children Looked After by Local Authorities in England, 2013, Statistical First Releasehttps://www.gov.uk/government/publications/children-looked-after-in-england-including-adoption
Year 2009 2010 2011 2012 2013
All children looked after England at 31 March1,2,3 60,900 64,450 65,500 67,080 68,110
Rates per 10,000 children under 18 years4 54 57 58 59 60
Gender
Male 34,580 36,170 36,440 37,020 37,510
Female 26,330 28,290 29,060 30,050 30,600
Age at 31 March
Under 1 3,260 3,720 3,680 4,200 4,310
1 to 4 9,440 10,850 11,970 12,400 12,360
5 to 9 10,470 11,200 11,830 12,700 13,260
10 to 15 24,930 25,010 24,190 24,220 24,450
16 and over 12,800 13,670 13,830 13,560 13,730
Category of need5
Abuse or neglect 37,190 39,350 40,420 41,800 42,480
Child’s disability 2,220 2,200 2,180 2,300 2,260
Parental Illness or disability 2,700 2,820 2,710 2,680 2,500
Family in acute stress 5,310 5,790 5,850 6,010 6,230
Family dysfunction 6,830 8,020 8,920 9,540 10,160
Socially unacceptable behaviour 1,210 1,280 1,210 1,150 1,230
52

Low income 130 170 150 120 120
Absent parenting 5,310 4,830 4,050 3,490 3,150
Ethnic Origin
White 46,180 49,000 50,410 52,150 53,030
Mixed 5,300 5,670 5,760 6,040 6,090
Asian or Asian British 3,220 3,420 3,110 2,820 2,620
Black or Black British 4,400 4,580 4,550 4,500 4,470
Other Ethnic Groups 1,660 1,660 1,490 1,300 1,390
Other 140 130 190 270 500
1 Numbers have been rounded to the nearest 10. Percentages have been rounded to the nearest whole number.2 Figures exclude children looked after under an agreed series of short term placements.3 Historical data may differ from older publications. This is mainly due to the implementation of amendments and corrections sent by some local authorities after the publication date of previous materials.4 The rates per 10,000 children under 18 years have been derived using the mid-year population estimates for 2012 provided by the Office for National Statistics.
5 The most applicable category of the eight “Need Codes” at the time the child started to be looked after rather than necessarily the entire reason they are looked after.
53

Tables for Wales
Table E2.2. Number of Looked After Children (except those placed with their parents), in Wales, at 31st March 2008-2012.
Source: SSDA903 statistical return on children looked after http://wales.gov.uk/topics/statistics/headlines/health2012/120927/?lang=en
Year 2008 2009 2010 2011 2012
Total 4,088 4,170 4,657 4,891 5,179
Tables for Scotland
Table E2.3. Number of Looked After Children, by age and gender in Scotland from 2008/09 – to 2011/12.
Source: http://www.scotland.gov.uk/Topics/Statistics/Browse/Children/PubChildrenLookedAfter
Year 2008/2009 2009/2010 2010/2011 2011/2012
Total 15,287 15,892 16,231 16,248
Age
Under 5 Years 3,157 3,341 3,469 3,469
5 to 11 Years 5,510 5,897 6,167 6,204
12 to 15 Years 5,017 5,047 5,021 5,007
16 Years and Over 1,603 1,607 1,574 1,568
Gender
Female 6,912 7,257 7,481 7,461
Male 8,375 8,635 8,750 8,787
54

Tables for Northern Ireland
Table E2.4. The Number of Looked After Children in Northern Ireland by age group at 31 March, 2009 – 2012.
Source: ‘Children Order Statistical Tables for Northern Ireland’ and ‘Children’s Social Care Statistics for Northern Ireland’http://www.dhsspsni.gov.uk/index/stats_research/stats-cib/statistics_and_research-cib-pub/children_statistics/stats-cib-children_order.htm
Age (years)Year
2009 2010 2011 2012
Under 1 72 78534*
92
1 - 4 377 441 490
5 - 11 753 791 743 825
12 - 15 760 811 852 753
16 + 501 485 382 484
Total 2,463 2,606 2,511 2,644
Figures are recorded at 31 March*Age groups differed for 2011Figures at 31 March 2013 will be available in November 2013
55

Number of looked after children with court orders:
Tables for England
Table E2.5. Number of looked after children with court orders1, excluding those placed with their own parents or other person with parental responsibility, in England at 31 March, by age group, 2008-2012.
Source: Department for Education, Children Looked After by Local Authorities in England, 2012, Statistical First Releasehttps://www.gov.uk/government/publications/children-looked-after-by-local-authorities-in-england-including-adoption
Year 2008 2009 2010 2011 2012
Aged under 1 1,900 2,090 2,420 2,500 2,910
Aged 1-4 6,640 6,750 7,800 8,960 9,520
Aged 5-9 7,740 7,620 8,180 8,960 9,840
Aged10-15 15,400 15,120 15,300 15,430 15,860
Aged 16 and over 5,280 5,490 5,600 5,700 5,750
Total 36,970 37,080 39,310 41,550 43,8801 Includes full and interim care orders, children with placement orders, children accommodated on remand and children under protection orders.
56
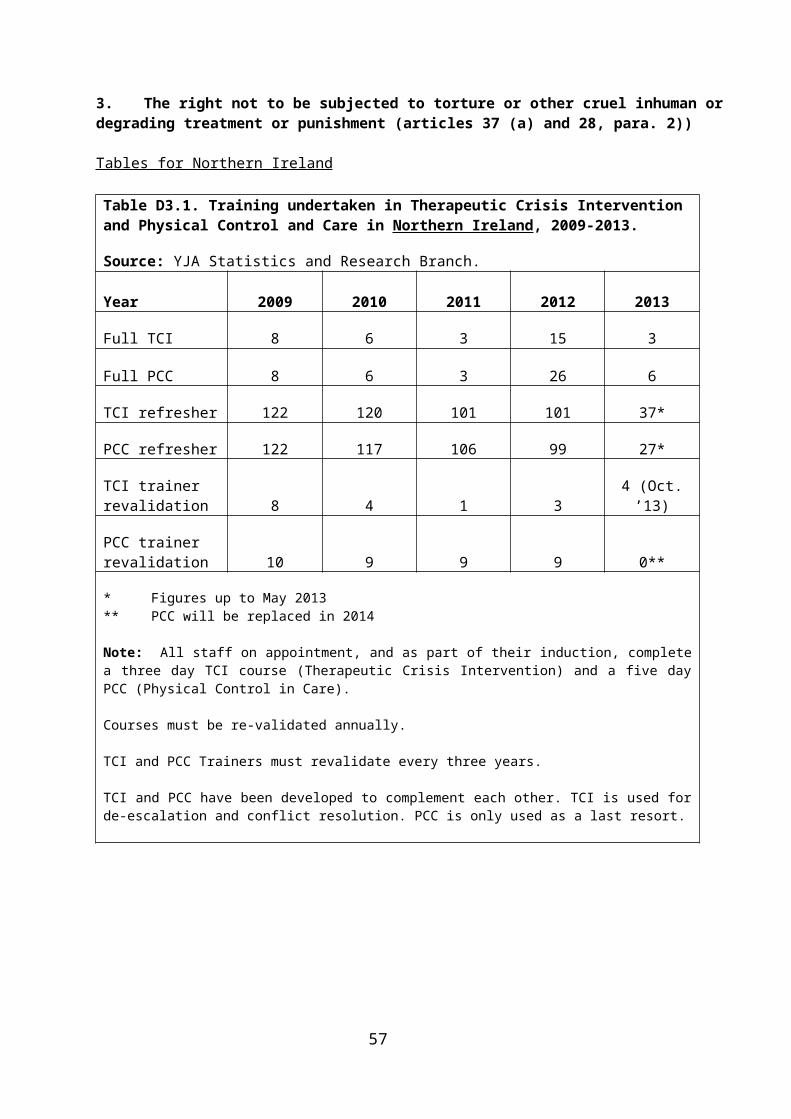
Table E2.6. Number of looked after children with court orders1, excluding those placed with their own parents or other person with parental responsibility, in England at 31 March, by ethnicity, 2008-2012.
Source: Department for Education, Children Looked After by Local Authorities in England, 2012, Statistical First Releasehttps://www.gov.uk/government/publications/children-looked-after-by-local-authorities-in-england-including-adoption
Year 2008 2009 2010 2011 2012
White 30,100 30,180 31,950 33,670 35,420
Mixed 3,710 3,630 3,820 4,030 4,250
Asian 800 810 880 950 1,030
Black 2,130 2,160 2,320 2,480 2,580
Total 36,970 37,080 39,310 41,550 43,8801 Includes full and interim care orders, children with placement orders, children accommodated on remand and children under protection orders.
Tables for Wales
Table E2.7. Number of looked after children with court orders, in Wales, at 31 March, 2008-2012.
Source: SSDA903 statistical return on children looked after http://wales.gov.uk/topics/statistics/headlines/health2012/120927/?lang=en
Year 2008 2009 2010 2011 2012
Total 3,530 3,441 3,822 4,077 4,380
57

Tables for Northern Ireland
Table E2.8. Number of Looked After Children in Northern Ireland with court orders by age group at 31 March, 2009 – 2012.
Source: ‘Children Order Statistical Tables for Northern Ireland’ and ‘Children’s Social Care Statistics for Northern Ireland’http://www.dhsspsni.gov.uk/index/stats_research/stats-cib/statistics_and_research-cib-pub/children_statistics/stats-cib-children_order.htm
YearAge (years)
TotalUnder 1 1 - 4 5 - 11 12 - 15 16 +
2009 37 234 512 489 311 1,583
2010 40 268 532 526 277 1,643
2011* 319 514 585 235 1,653
2012 53 356 622 528 317 1,876
Figures are recorded at 31 March.*Age groups differed for 2011.
58

Number of registered children’s homes:
Tables for Wales
Table E2.9. Number of registered children's homes in Wales, 2009-2013.
Source: http://wales.gov.uk/cssiwsubsite/newcssiw/?lang=en
Year 2009 2010 2011 2012 2013
Total 115 117 119 119 125
Number of looked after children by placement type:
Tables for England
Table E2.10. Number of looked after children in foster or residential placements, in England at 31 March, by age group, 2008-2012.
Source: Department for Education, Children Looked After by Local Authorities in England, 2012, Statistical First Release
https://www.gov.uk/government/publications/children-looked-after-by-local-authorities-in-england-including-adoption
2008 2009 2010 2011 2012
Aged under 1 2,570 2,910 3,340 3,340 3,800
Aged 1-4 6,220 6,860 8,230 9,160 9,680
Aged 5-9 8,300 8,660 9,460 10,120 11,140
Aged 10-15 20,010 23,420 23,550 22,890 22,990
Aged 16 and over 7,510 9,920 10,490 10,580 10,570
Total 44,610 51,780 55,090 56,090 58,170
59

Table E2.11. Number of looked after children in foster or residential placements, in England at 31 March, by ethnicity, 2008-2012.
Source: Department for Education, Children Looked After by Local Authorities in England, 2012, Statistical First Releasehttps://www.gov.uk/government/publications/children-looked-after-by-local-authorities-in-england-including-adoption
Year 2008 2009 2010 2011 2012
White 34,260 39,590 42,240 43,420 45,330
Mixed 3,990 4,470 4,890 5,170
Asian 2,030 2,560 2,670 2,470 2,300
Black 3,490 3,860 3,980 3,970 4,020
Other 840 1,300 1,360 1,330 1,350
Total 44,610 51,780 55,090 56,090 58,170
60

Tables for Scotland
Table E2.12. Number of Looked After Children in Scotland from 2008/09-2011/12, by placement type.
Source: http://www.scotland.gov.uk/Topics/Statistics/Browse/Children/PubChildrenLookedAfter
Year 2008/09 2009/10 2010/11 2011/12
Total 15,287 15,892 16,231 16,248
At home with parents 5,924 6,193 5,476 5,153
With friends/relatives 2,993 3,172 3,910 4,076
With foster carers provided by Local
Authority 3,594 3,651 3,871 3,946
With foster carers purchased by Local
Authority 905 1,046 1,197 1,333
With prospective adopters 242 299 267 262
In other community 49 51 49 45
In Local Authority home 611 620 615 564
In voluntary home 138 82 88 90
In residential school 598 471 460 451
In secure accommodation 102 82 86 95
Crisis care 18 17 13 14
Other residential 113 208 199 219
Gender F M F M F M F M
Total 6,912 8,375 7,257 8,635 7,481 8,750 7,461 8,787
At home with parents 2,609 3,315 2,716 3,477 2,484 2,992 2,316 2,837
With friends/relatives 1,476 1,517 1,576 1,596 1,900 2,010 1,973 2,103
With foster carers provided by Local
Authority 1,768 1,826 1,801 1,850 1,911 1,960 1,912 2,034
61

With foster carers purchased by Local
Authority 373 532 436 610 507 690 583 750
With prospective adopters 107 135 158 141 138 129 125 137
In other community 29 20 24 27 23 26 23 22
In Local Authority home 274 337 291 329 279 336 263 301
In voluntary home 57 81 34 48 29 59 37 53
In residential school 129 469 93 378 91 369 97 354
In secure accommodation 36 66 32 50 33 53 38 57
Crisis care 10 8 9 8 5 8 7 7
Other residential 44 69 87 121 81 118 87 132
Age 2008/09 2009/10 2010/11 2011/12
Under 5 Years Total 3,157 3,341 3,469 3,469
At home with parents 996 1,166 1,108 1,050
With friends/relatives 810 800 974 993
With foster carers provided by Local
Authority 1,030 1,011 1,053 1,127
With foster carers purchased by Local
Authority 164 157 148 134
With prospective adopters 141 191 153 151
In other community * 9 * *
In Local Authority home * 0 17 *
In voluntary home * 0 0 *
In residential school 0 0 * *
In secure accommodation 0 0 0 *
Other residential 10 7 8 5
62

5 to 11 Years Total 5,510 5,897 6,167 6,204
At home with parents 2,021 2,204 1,982 1,951
With friends/relatives 1,380 1,546 1,853 1,901
With foster carers provided by Local
Authority 1,443 1,435 1,525 1,499
With foster carers purchased by Local
Authority 416 459 533 610
With prospective adopters 93 105 105 101
In other community * 8 * *
In Local Authority home 41 49 56 29
In voluntary home 27 22 18 20
In residential school 67 48 64 56
In secure accommodation * 0 * *
Other residential 13 21 23 33
12 to 15 Years Total 5,017 5,047 5,021 5,007
At home with parents 2,301 2,245 1,922 1,761
With friends/relatives 654 664 873 947
With foster carers provided by Local
Authority 818 906 941 974
With foster carers purchased by Local
Authority 256 344 405 456
With prospective adopters 6 * 6 9
In other community 8 * 7 7
In Local Authority home 390 404 383 358
In voluntary home 73 36 52 48
In residential school 379 302 283 276
63

In secure accommodation 68 47 51 51
Other residential 64 94 98 120
16 Years and Over Total 1,603 1,607 1,574 1,568
At home with parents 606 578 464 391
With friends/relatives 149 162 210 235
With foster carers provided by Local
Authority 303 299 352 346
With foster carers purchased by Local
Authority 69 86 111 133
With prospective adopters * * * *
In other community 31 * 31 32
In Local Authority home 179 167 159 175
In voluntary home 37 24 18 *
In residential school 152 121 109 118
In secure accommodation * 35 * 41
Other residential 44 103 83 75
64

Tables for Northern Ireland
Table E2.13. Looked After Children by Placement and Age Group in Northern Ireland at 31 March, 2009, 2011 & 2012.A, B
Source: ‘Children Order Statistical Tables for Northern Ireland’ and ‘Children’s Social Care Statistics for Northern Ireland’http://www.dhsspsni.gov.uk/index/stats_research/stats-cib/statistics_and_research-cib-pub/children_statistics/stats-cib-children_order.htm
2009Age (years)
TotalUnder 1 1 - 4 5 - 11 12 - 15 16 +Residential Care 8 13 23 137 127 308Foster Care 40 255 492 395 197 1,379Placed with Family 22 105 220 196 130 673Other 2 4 18 32 47 103Total 72 377 753 760 501 2,463
2011 Age (years)Total0 – 4* 5 - 11 12 - 15 16 +
Residential Care 3 7 130 99 239Foster Care 438 627 590 207 1,862Placed with Family 56 75 88 39 258Other 24 27 44 37 132Total 534 743 852 382 2,511
2012 Age (years)TotalUnder 1 1 - 4 5 - 11 12 - 15 16 +
Residential Care 0 5 13 104 109 231Foster Care 76 389 647 560 274 1,946Placed with Family 11 60 113 64 47 295Other 5 36 52 25 54 172Total 92 490 825 753 484 2,644A Figures are recorded at 31 March.B Figures for 2010 were not available in this format.*Age groups differed for 2011.
65

Average duration of placement:
Tables for England
Table E2.14. Average duration of placement (days) for looked after children ceasing foster care or residential placements during the year ending 31 March 2007-2012, in England.1,2
Source: Department for Education, Children Looked After by Local Authorities in England, 2012, Statistical First Release
https://www.gov.uk/government/publications/children-looked-after-by-local-authorities-in-england-including-adoption
2008 2009 2010 2011 2012Average duration of placement in days 712 612 530 448 341
Note: This table gives figures for placements ceasing during the year and therefore differs from other tables which give figures for the number of children ceasing to be looked after.
1 Figures exclude children looked after under an agreed series of short term placements.
2 Placement may cease but child could continue to be looked after if a child’s placement changes..
66

Children missing from care:
Tables for England
Table E2.15. Children Missing from care for more than 24 hours in England at 31 March 2008-2012.
Source: DfE SSDA903 https://www.gov.uk/government/publications/children-looked-after-by-local-authorities-in-england-including-adoption
Years ending 31 March 2008 to 2012 2008 2009 2010 2011 2012
numbers
All children looked after at 31 March 59,380 60,910 64,460 65,520 67,050
Missing - Absent for more than 24 hours
from agreed placement 130 120 110 120 140
In refuge (section 51 of Children Act, 1989) x x x x x
Whereabouts known (not in refuge) 40 30 30 30 30
Whereabouts unknown 100 90 90 90 110
x Figures not shown in order to protect confidentiality.
There is known to be an issue with the quality of data on children recorded as being missing from their agreed placement for a period of 24 hours or more. Comparisons with other data sources, including numbers of missing children reported to the police, indicate that the figures presented may be an undercount of the true figure and should be treated with caution. Work is currently being undertaken to look at improving the quality of the data returned by local authorities in this area in future.
67

Tables for Wales
Table E2.16. Children Missing from care for more than 24 hours in Wales at 31 March 2008-2012.
Source: SSDA903 statistical return on children looked after, Welsh Government http://wales.gov.uk/topics/statistics/headlines/health2012/120927/?lang=en
Years ending 31 March 2008 to 2012 2008 2009 2010 2011 2012
All children looked after at 31 March 4,627 4,655 5,137 5,390 5,724
Missing - Absent for more than 24 hours from agreed placement * * * * *
* Figures less than 5 not shown in order to protect confidentiality
68

Number of children ceasing placements:
Tables for England
Table E2.17. Number of looked after children ceasing placements in England, during the year ending 31 March, who have returned home to live with their parents or other person with parental responsibility by age group1,2,3, 2008-2012.
Source: Department for Education, Children Looked After by Local Authorities in England, 2012, Statistical First Release
https://www.gov.uk/government/publications/children-looked-after-by-local-authorities-in-england-including-adoption
Year 2008 2009 2010 2011 2012
Number of children who ceased to be looked after and returned home to live with parents or other person with parental responsibility:
Aged under 1 850 860 820 890 870
Aged 1-4 2,050 2,230 2,230 2,430 2,320
Aged 5-9 1,590 1,620 1,730 1,860 1,830
Aged 10-15 4,180 3,910 3,960 3,920 3,750
Aged 16 and over 870 870 1,130 1,330 1,390
Total 9,530 9,500 9,870 10,430 10,160
1 Figures have been rounded to the nearest 10.2 Only the last occasion on which a child ceased to be looked after in the year has been counted.3 Figures exclude children looked after under an agreed series of short term placements.
69

Table E2.18. Number of looked after children ceasing placements in England, during the year ending 31 March, who have returned home to live with their parents or other person with parental responsibility by ethnicity.
Source: Department for Education, Children Looked After by Local Authorities in England, 2012, Statistical First Releasehttps://www.gov.uk/government/publications/children-looked-after-by-local-authorities-in-england-including-adoption
Year 2008 2009 2010 2011 2012
Number of children who ceased to be looked after and returned home to live with parent or other person with parental responsibility:
White 6,770 6,560 6,700 7,070 7,010
Mixed 810 730 840 910 880
Asian 520 650 700 630 660
Black 1,190 1,220 1,230 1,360 1,170
Other 240 330 400 460 430
Total 9,530 9,500 9,870 10,430 10,160
70

Tables for Wales
Table E2.19. Number and percentage of looked after children ceasing placements during year ending 31 March who returned home to live with their parents, relatives or other person with parental responsibility, in Wales, 2008-2012.
Source: SSDA903 statistical return on children looked after http://wales.gov.uk/topics/statistics/headlines/health2012/120927/?lang=en
Year 2008 2009 2010 2011 2012
Total 684 (48.0%)
725 (45.9%)
797 (50.5%)
806 (49.3%)
850 (51.4%)
71

Tables for Scotland
Table E2.20. Number of Looked After Children ceasing placements in Scotland during years 2008/09-2011/12, by age and destination.
Source: http://www.scotland.gov.uk/Topics/Statistics/Browse/Children/PubChildrenLookedAfter
Year 2008/2009 2009/2010 2010/2011 2011/2012
Total 4,394 4,504 4,611 4,768Home with (biological)
parents 2,797 2,794 2,766 3,254Home with newly adopted
parents 204 218 264 272Friends/
Relatives 499 532 603575
Own tenancy / independent living 97 98 133 111
Supported accommodation / Semi-
independent living 128 159 152 151Former foster carers 71 84 55 63
In residential care 30 38 28 46Homeless 25 23 25 26In custody 19 18 15 17
Other 205 224 157 186Not known 319 316 413 67
Gender F M F M F M F M
Total 2,000 2,394 2,064 2,440 2,113 2,498 2,265 2,503Home with (biological)
parents 1,255 1,542 1,265 1,529 1,237 1,529 1,541 1,713Home with newly adopted
parents 102 102 105 113 138 126 142 130Friends/
Relatives 232 267 251 281 285 318 268 307Own tenancy /
independent living 57 40 53 45 79 54 59 52Supported
accommodation / Semi-independent living 61 67 85 74 76 76 71 80
Former foster carers 31 40 41 43 27 28 39 24In residential care 11 19 13 25 10 18 17 29
Homeless 14 11 7 16 11 14 10 16Other 91 133 100 142 68 104 88 115
Not known 146 173 144 172 182 231 30 37
72

Age 2008/09 2009/10 2010/11 2011/12
Under 5 Years Total 899 893 983 1,051Home with (biological)
parents 540 536 562 717Home with newly adopted
parents 153 143 176 174Friends
/Relatives 107 108 135 107Own tenancy /
independent living 0 * * 0Supported
accommodation / Semi-independent living 0 * * *
Former foster carers 13 7 12 5In residential care * 0 0 *
Homeless * 0 0 0Other 38 36 22 35
Not known 47 59 74 9
5 to 11 Years Total 1,079 1,110 1,272 1,357Home with (biological)
parents 741 704 836 1,002Home with newly adopted
parents 47 68 84 92Friends
/Relatives 170 172 216 198Own tenancy /
independent living 00 0
0Supported
accommodation / Semi-independent living 0 0 0 0
Former foster carers 11 12 7 7In residential care * 0 * *
Homeless * 0 * *Other 34 56 24 40
Not known 75 98 102 14
12 to 15 years Total 1,016 1,053 1,001 1,008Home with (biological)
parents 773 801 743 843Home with newly adopted
parents * * * *Friends
/Relatives 93 115 111 112Own tenancy /
independent living * * * 0Supported
accommodation / Semi-independent living * * * 0
Former foster carers 9 10 * *In residential care 5 5 5 7
Homeless 0 * 0 0
73

Other 42 37 41 27Not known 88 75 90 10
16 to 17 Years Total 1,282 1,352 1,261 1,241Home with (biological)
parents 723 741 612 679Home with newly adopted
parents * * 0 *Friends
/Relatives 121 133 136 147Own tenancy /
independent living 81 77 114 81
Supported accommodation / Semi-
independent living 105 136 131 129Former foster carers 28 * 25 32
In residential care * 25 17 27Homeless 22 19 20 25
Other 88 99 71 87Not known 94 82 135 *
18 Years and Over Total 118 96 94 111Home with (biological)
parents 20 12 13 13Home with newly adopted
parents 0 0 0 *Friends
/Relatives * * * 11Own tenancy /
independent living 15 19 16 30Supported
accommodation / Semi-independent living 20 18 18 21
Former foster carers 10 18 8 14In residential care 6 8 5 5
Homeless * * * *Other 22 14 14 14
Not known 15 2 12 2
74

Tables for Northern Ireland
Table E2.21. Number of Looked After Children ceasing placements in Northern Ireland by age group, year ending 31 March, 2009 – 2012.
Source: ‘Children Order Statistical Tables for Northern Ireland’ and ‘Children’s Social Care Statistics for Northern Ireland’http://www.dhsspsni.gov.uk/index/stats_research/stats-cib/statistics_and_research-cib-pub/children_statistics/stats-cib-children_order.htm
YearAge (years)
TotalUnder 1 1 - 4 5 - 11 12 - 15 16 +
2009 31 226 211 153 300 921
2010 34 156 265 182 271 908
2011 168* 198 180 291 837
2012 15 138 145 157 290 745
Figures are recorded at 31 March.*Age groups differed for 2011.
75

Number of children adopted:
Tables for England
Table E2.22. Number of looked after children adopted in England during the year ending 31 March 2008-2012, by age at adoption and gender.
Source: Department for Education, Children Looked After by Local Authorities in England, 2012, Statistical First Releasehttps://www.gov.uk/government/publications/children-looked-after-by-local-authorities-in-england-including-adoption
Year 2008 2009 2010 2011 2012
All looked after children who were adopted during the year ending 31 March 3,180 3,330 3,200 3,090 3,450
Gender
Male 1,640 1,680 1,640 1,580 1,740
Female 1,540 1,640 1,560 1,510 1,710
Age group
Under 1 110 80 70 60 70
Aged 1-4 2,230 2,380 2,250 2,210 2,550
Aged 5-9 690 770 770 730 740
Aged 10-15 120 80 100 90 80
Aged 16 and over 20 10 10 - 10
Average age (yrs:mths) 3:11 3:9 3:11 3:10 3:8
76

Table E2.23. Number of looked after children adopted in England during the year ending 31 March 2008 - 2012, by ethnic origin, and category of need.1,2
Source: Department for Education, Children Looked After by Local Authorities in England, 2012, Statistical First Release https://www.gov.uk/government/publications/children-looked-after-by-local-authorities-in-england-including-adoption
Year 2008 2009 2010 2011 2012All looked after children who were adopted during the year ending 31 March 3,180 3,330 3,200 3,090 3,450
Ethnicity
White 2,640 2,730 2,670 2,600 2,930
Mixed 330 410 350 320 330
Asian or Asian British 60 70 50 60 60
Black or Black British 110 100 100 80 90
Other ethnic groups 30 20 20 20 30
Other* - - 10 20 20
Category of Need3
Abuse or neglect 2,330 2,410 2,250 2,220 2,490
Child's disability 20 20 20 10 10
Parents illness or disability 160 130 120 130 130
Family in acute stress 220 260 280 240 220
Family dysfunction 300 360 370 360 460
Socially unacceptable behaviour - 10 10 10 20
Low income 10 - - - 10
Absent parenting 140 140 140 110 110* "Other" comprises of information refused or not yet available which were collected for the first time in 2009.
1 Numbers have been rounded to the nearest 10. Percentages have been rounded to the nearest whole number.2 Historical data may differ from older publications. This is mainly due to the implementation of amendments and corrections sent by some local authorities after the publication date of previous materials.3 The most applicable category of the eight “Need Codes” at the time the child started to be looked after rather than necessarily the entire reason they are looked after.
77

Tables for Scotland
Table E2.24. Number of adoptions registered, in Scotland, 2007- 2011, by age and gender.
Source: http://www.gro-scotland.gov.uk/statistics/theme/vital-events/general/ref-tables/index.html
Year 2007 2008 2009 2010 2011
All ages 441 418 455 466 496Male 229 200 250 216 227
Female 212 218 205 250 269Age Months
less than 6 M 1 - 2 1 3F 1 - 1 4 4
6 - 8 M 1 2 3 2 2F - 1 3 3 1
9 - 11 M 2 4 3 3 4F 4 2 4 10 7
12 - 17 M 8 14 16 14 3F 12 7 4 12 12
18 - 23 M 11 12 14 6 12F 8 17 13 21 20
Years2 M 46 21 37 26 37
F 30 34 31 30 413 - 4 M 50 50 59 55 60
F 33 50 43 54 655 - 9 M 70 62 81 78 79
F 71 57 64 81 7210 - 14 M 30 24 32 26 14
F 36 41 26 23 3315 - 17 M 10 11 3 5 13
F 17 9 16 12 14Changes that have occurred over the above reporting period: These figures are taken from annual published tables for the individual years. Since the 2008 table was published, the total for that year has been revised to 421, but the age breakdowns have not been reproduced.
78

Tables for Northern Ireland
Table E2.25. Children adopted in Northern Ireland during year ending 31 March, 2010 – 2013.A
Source: ‘Children Adopted from Care in Northern Ireland’ and NI Guardian ad Litem Agency (NIGALA).
YearCategory of Adoption
Adopted from Care
Step Parent Adoption
Inter Country Adoption
Adoption Abroad
2010 50 B 31 7 1
2011 66 C 28 4 0
2012 60 B 21 6 0
2013 88 B,P 23 6 1
A All figures are taken from NIGALA reports unless otherwise indicated.B Figure is taken from ‘Children Adopted from Care in Northern Ireland’ (based on the
statistical return AD1) and may differ slightly from NIGALA figures due to categorisation.C The AD1 statistical return was not collected this year and the figure is therefore taken from
NIGALA reports. This includes the category ‘Adopted by relatives’.P Provisional figures.
79

3. Family reunification (article 10)
No data.
80

4. Illicit transfer and non-return (article 11)
Tables for England and Wales
Table E4.1. Defendants proceeded against at the magistrates' court, found guilty and sentenced at all courts for offences relating to trafficking of people and abduction of children in England and Wales, 2008-2012. 1,2,5,6
Source: Justice Statistics Analytical Services - Ministry of Justice.Abduction
of Children4 Outcome 20086 2009 2010 2011 2012
Proceeded against 144 171 155 206 204Found Guilty 87 84 110 113 135
Sentenced 85 86 106 111 132Absolute discharge - - 1 1 3
Conditional discharge 20 15 11 16 17Fine 1 4 4 1 6
Community sentence 21 25 23 30 32Suspended Sentence 18 17 18 19 19Otherwise dealt with 1 5 2 5 1
Immediate custody 24 20 47 39 54Trafficking of People3 Outcome 20086 2009 2010 2011 2012
Proceeded against 61 47 30 21 29Found Guilty 24 25 16 8 12
Sentenced 24 25 16 8 12Absolute discharge - - - - -
Conditional discharge - - - - -Fine - - - - -
Community sentence - - - - -Suspended Sentence 1 2 1 - -Otherwise dealt with - - - - -
Immediate custody 23 23 15 8 12'-' = Nil1 The figures given in the table relate to persons for whom these offences were the principal offences for which they were dealt with. When a defendant has been found guilty of two or more offences it is the offence for which the heaviest penalty is imposed. Where the same disposal is imposed for two or more offences, the offence selected is the offence for which the statutory maximum penalty is the most severe.
2 Every effort is made to ensure that the figures presented are accurate and complete. However, it is important to note that these data have been extracted from large administrative data systems generated by the courts and police forces. As a consequence, care should be taken to ensure data collection processes and their inevitable limitations are taken into account when those data are used.
3 The figures for 'Trafficking of people' relate to multiple offences including - Trafficking into the UK for sexual exploitation, Trafficking within the UK for sexual exploitation, Trafficking out of the UK for sexual exploitation, Trafficking people into the UK for the purpose of exploitation, Trafficking people within the UK for the purpose of exploitation, Trafficking people out of the UK.4 The figures for 'Abduction of Children' relate to multiple offences including: - Abduction of child by parent, - Abduction of child by other persons, - Taking, keeping, inducing, assisting or inciting a child away from the person having responsibility forcare under a care order, emergency protection order or police protection- Obstructing an authorised person recovering a child5 The number of offenders sentenced can differ from those found guilty as it may be the case that adefendant found guilty in a particular year, and committed for sentence at the Crown Court, may be
81

sentenced in the following year.
6 Excludes data for Cardiff magistrates' court for April, July and August 2008.
82

Tables for Northern Ireland
Table E4.2. Number of children abducted from and to Northern Ireland, by place of residence; relationship between child and perpetrator, 2008/09 to 2012/13.
Source: PSNI Statistics Branch
Based on the offences of child abduction (by parent etc) and child abduction (by other person), there were 10 such offences recorded between 2008/09 and 2012/13 where the child was abducted from Northern Ireland. In each case the offence recorded was one of child abduction (by parent etc).
Table E4.3. Number of offences of child abduction recorded and detected in Northern Ireland, 2008/09 to 2012/13.
Source: PSNI Statistics Branch
Year 2008/09 2009/10 2010/11 2011/12 2012/13
AO: Attempted Offence
SO: SubstantiveOffence AO SO AO SO AO SO AO SO AO SOChild abduction (by parent etc)1
Recorded 1 3 1 2 1 1 0 4 2 7
Detected2 0 2 0 2 0 1 0 3 0 4Child abduction (by other person)
Recorded 24 9 24 9 12 10 26 8 19 15
Detected2 1 4 1 3 1 5 2 6 2 6
1 This includes parent, guardian or person with either a residence order or custody over the child.2 All detections were by means of charge/summons. The figures refer to offences detected in each financial year; the offence may have been reported in a different financial year to that in which it was detected.
83

5. Abuse and neglect (article 19), including physical and psychological recovery and social reintegration (article 3)
Tables for England
Table E5.1. Number and percentage of children who were the subject of a child protection plan in England at 31 March 2008 to 31 March 20121 by gender and age.
Source: DfEhttps://www.gov.uk/government/organisations/department-for-education/series/statistics-children-in-need
http://webarchive.nationalarchives.gov.uk/20130423140808/http:/www.education.gov.uk/researchandstatistics/statistics/allstatistics/a00196158/referrals-assessments-and-children-who-are-the-sub
http://webarchive.nationalarchives.gov.uk/20130423140808/http://www.education.gov.uk/researchandstatistics/statistics/allstatistics/a00195890/referrals-assessments-and-children-who-are-the-sub
2008 2009 2010 2011 2012
All categories of abuse N* % N* % N % N % N %
All Children 29,200 100 34,100 100 39,100 100 42,710 100 42,850 100Unborn/
unknown gender2 420 14.4 560 1.6 660 1.7 860 2.0 990 2.3
Total Male 14,700 50.3 17,100 50.1 19,800 50.7 21,420 50.2 21,370 49.9
Under 1 1,900 6.5 2,100 6.2 2,300 5.9 2,360 5.5 2,430 5.7
1-4 4,700 16.1 5,600 16.4 6,400 16.3 6,980 16.3 6,790 15.8
5-9 4,100 14.0 4,900 14.4 5,800 14.9 6,130 14.3 6,310 14.7
10-15 3,800 13.0 4,300 12.6 5,000 12.8 5,510 12.9 5,450 12.7
16 and over 390 1.3 260 0.8 330 0.8 430 1.0 390 0.9
Unknown age - - - - - - 10 0.0 - -
Total Female 14,000 47.9 16,400 48.1 18,600 47.6 20,430 47.8 20,490 47.8
Under 1 1,700 5.8 2,100 6.2 2,100 5.4 2,200 5.2 2,330 5.4
1-4 4,200 14.4 5,100 15.0 5,900 15.2 6,430 15.1 6,280 14.7
5-9 3,800 13.0 4,500 13.2 5,100 13.0 5,850 13.7 5,930 13.8
84

10-15 3,800 13.0 4,30012.6
5,000 12.8 5,360 12.5 5,380 12.5
16 and over 460 1.6 330 1.0 450 1.2 580 1.4 570 1.3
Unknown age - - - - - - 10 0.0 - -
1If a child is the subject of more than one child protection plan during the year, each will be counted.2Includes children of indeterminate gender.*Numbers are rounded to the nearest 100.
85

Table E5.2. Number and percentage of children who were the subject of a child protection plan in England at 31 March 2008 to 31 March 2012, by ethnicity.
Source: DfEhttps://www.gov.uk/government/organisations/department-for-education/series/statistics-children-in-need
http://webarchive.nationalarchives.gov.uk/20130423140808/http:/www.education.gov.uk/researchandstatistics/statistics/allstatistics/a00196158/referrals-assessments-and-children-who-are-the-sub
http://webarchive.nationalarchives.gov.uk/20130423140808/http://www.education.gov.uk/researchandstatistics/statistics/allstatistics/a00195890/referrals-assessments-and-children-who-are-the-sub
2008 2009 2010 2011 2012
All categories of abuse N* % N* % N % N % N %
All Children 29,200 100.0 34,100 100.0 39,100 100.0 42,710 100.0 42,050 100.0
White1 23,100 79.0 26,600 78.0 29,900 76.5 32,820 76.8 32,540 75.9
Mixed2 2,200 7.0 2,800 8.0 3,200 8.2 3,240 7.6 3,390 7.9Asian or Asian
British3 1,400 5.0 1,700 5.0 2,100 5.5 2,280 5.3 2,320 5.4Black or Black
British4 1,700 6.0 1,800 5.0 2,200 5.6 2,310 5.4 2,090 4.9
Other Ethnic Groups5 450 2.0 610 2.0 540 1.4 530 1.2 530 1.2
Refused/Not obtained - - 50 - 1,100 1.4 1,530 3.6 1,980 4.5
Missing/Unknown6 420 1.0 560 2.0 20 - 0 0.0 - -
1White comprises of White British, White Irish, Traveller of Irish Heritage, Any Other White background and Gypsy/Roma.2Mixed comprises of White and Black Caribbean, White and Black African, White and Asian, Any other Mixed background.3Asian or Asian British comprises of Indian, Pakistani, Bangledeshi, and Any other Asian background.4Black or Black British comprises of Caribbean, African or Any other Black background5Other Ethnic Groups comprises of Chinese and Any other ethnic group.6Includes unborn children who should be categorised as 'Not obtained’.*Numbers are rounded to the nearest 100.
86

Tables for Wales
Table E5.3. Number of children on the child protection register, in Wales, at 31 March 2009-2013.
Source: http://wales.gov.uk/topics/statistics/headlines/health2013/referrals-assessments-social-services-children-2012-13/?lang=en
Year 2009 2010 2011 2012 2013
Total 2,511 2,728 2,881 2,885 2,952
Tables for Scotland
Table: E5.4. Number and percentage of children registered following a case conference by category of abuse/risk identified, in Scotland, 2007-2011.
Source: http://www.scotland.gov.uk/Topics/Statistics/Browse/Children/PubChildProtection
Year 2007 2008 2009 2010 2011
Total 3,148 2,814 3,628 3,551 3,884
Physical Injury 778 715 876 798 772
Sexual abuse 270 189 229 257 302
Emotional abuse 550 615 877 910 1,040
Physical neglect 1,520 1,255 1,625 1,577 1,646
Failure to thrive 7 8 14 3 1
Unknown/Data not provided 23 32 7 6 123
87

Tables for Northern Ireland
Table E5.5. Children on the Child Protection Register in Northern Ireland at 31 March , 2009 – 2012.
Source: ‘Children Order Statistical Tables for Northern Ireland’ and ‘Children’s Social Care Statistics for Northern Ireland’http://www.dhsspsni.gov.uk/index/stats_research/stats-cib/statistics_and_research-cib-pub/children_statistics/stats-cib-children_order.htm
Year
Category of Abuse
TotalNeglect, Physical Abuse
and Sexual Abuse
Neglect and
Physical Abuse
Neglect and
Sexual Abuse
Physical and
Sexual Abuse
Neglect Only
Physical Abuse Only
Sexual Abuse Only
Emotional Abuse Only
2009 72 367 89 74 706 618 242 320 2,488
2010 69 368 78 70 682 627 208 264 2,357
2011 28 391 58 73 654 675 227 295 2,401
2012 31 373 51 59 585 610 141 277 2,127
88

F. Disability, basic health and welfare (articles 6, 18 (para. 3), 23, 24, 26, 27 (paras. 1-3) and 33)
1. Children with disabilities (article 23)
Tables for Great Britain
Table F1.1. Number of under-16s claiming Disability Living Allowance Benefit in Great Britain at February, May, August and November 2008 to 2012.
Source: DWP http://www.nomisweb.co.uk/
Year 2008 2009 2010 2011 2012Great Britain
February 302,510 314,450 325,680 333,160 342,690
May 306,210 317,850 328,390 335,260 346,690
August 308,680 320,150 330,490 337,730 348,750
November 311,110 323,460 331,150 338,940 351,250England
February 258,320 269,020 279,240 286,440 295,010
May 261,540 272,060 281,740 288,340 298,530
August 263,730 274,160 283,700 290,520 300,400
November 265,940 277,220 284,640 291,730 302,720Wales
February 17,960 18,630 19,020 19,060 19,300
May 18,180 18,770 18,970 19,070 19,490
August 18,320 18,790 19,020 19,190 19,470
November 18,480 18,910 18,950 19,190 19,580Scotland
February 26,240 26,810 27,420 27,660 28,380
May 26,500 27,040 27,670 27,840 28,670
August 26,630 27,210 27,780 28,020 28,890
November 26,680 27,330 27,580 28,020 28,940
89

Tables for England and Wales
Table F1.2. Number of 0-15 year olds with a long term health problem or disability1 in England and Wales, by gender, 2011.
Source: ONS (Census 2011) http://www.nomisweb.co.uk/
Day-to-day activities
limited a lot
Day-to-day activities
limited a little
Day-to-day activities not
limited
All persons
Total 0-15 year olds 164,695 234,510 10,179,927 10,579,132
Males 105,484 143,499 5,168,379 5,417,362
Females 59,211 91,011 5,011,548 5,161,770
Total 0-15 year olds 154,534 220,263 9,648,039 10,022,836
Males 98,940 134,807 4,897,928 5,131,675
Females 55,594 85,456 4,750,111 4,891,161
Total 0-15 year olds 10,161 14,247 531,888 556,296
Males 6,544 8,692 270,451 285,687
Females 3,617 5,555 261,437 270,609
1 The 2011 Census question that this data relates to is: ‘Are your day-to-day activities limited because of a health problem or disability which has lasted, or is expected to last, at least 12 months?’
90

Table F1.3. All schools: Pupils with special educational needs (SEN) in England, January 2009 to 2013.
Source: DfE School Census https://www.gov.uk/government/publications/special-educational-needs-in-england-january-2013
2009 2010 2011 2012 2013
All schools
Pupils with SEN1,2 1,672,610 1,704,980 1,673,895 1,618,340 1,545,610
Pupils on roll3 8,092,280 8,098,360 8,123,865 8,178,200 8,249,810
Incidence %* 20.7 21.1 20.6 19.8 18.7
1 Includes pupils with a statement of special educational needs, at School Action and School Action Plus.2 Includes pupils who are sole or dual main registrations.3 All pupils on school register at the time of the census. * Incidence of pupils - the number of pupils with SEN expressed as a proportion of the number of pupils on roll.
91

Table F1.4. Academies: Pupils with special educational needs (SEN), in England, January 2012 and 2013.
Source: DfE School Census https://www.gov.uk/government/publications/special-educational-needs-in-england-january-2012 , https://www.gov.uk/government/publications/special-educational-needs-in-england-january-2013
2012 Number on Roll Pupils with SEN Incidence %
Total Primary Academies 113,040 19,295 17.1
Total Secondary Academies 1,249,865 241,045 19.3
Total Special Academies 1,795 1,795 100
2013 Number on Roll Pupils with SEN Incidence %
Total Primary Academies 308,235 54,190 17.6
Total Secondary Academies 1,684,305 307,455 18.3
Total Special Academies 7,100 7,020 98.9
92

Table F1.5. Number and percentage of pupils attending special schools, in England, January 2009 to 2013.
Source: DfE School Census https://www.gov.uk/government/publications/special-educational-needs-in-england-january-2013
2009 2010 2011 2012 2013
Number of pupils across all schools 8,092,280 8,098,360 8,123,865 8,178,200 8,249,810
Number of pupils attending
All special schools 92,270 93,230 94,275 95,915 98,595
Maintained special schools 87,615 88,690 89,860 91,590 94,350
Non-maintained special schools 4,655 4,540 4,415 4,325 4,245
% of pupils attending
All special schools* 1.1 1.2 1.2 1.2 1.2
Maintained special schools* 1.1 1.1 1.1 1.1 1.1
Non-maintained special schools* 0.1 0.1 0.1 0.1 0.1
*The number of pupils in special schools expressed as a percentage of the number of pupils across all schools (includes maintained and direct grant nursery schools, maintained primary and secondary schools, city technology colleges, academies, special schools, pupil referral units and independent schools).
93

Tables for Wales
Table F1.6. All pupils with special educational needs (SEN)1 in maintained schools in Wales, by type of school, January 2012 to 2013.
Source: Welsh Government Pupil-Level Annual School Census (PLASC) http://wales.gov.uk/topics/statistics/headlines/schools2013/school-census-results-2013/?lang=en
2012 Primary Middle Secondary Special Total
Pupils with SEN 56,758 . 41,830 4,254 102,842
Pupils on roll 262,144 . 198,015 4,254 465,943
Incidence %* 21.7 . 21.1 100.0 22.1
2013 Primary Middle Secondary Special Total
Pupils with SEN 56,915 820 41,545 4,319 103,599
Pupils on roll 264,186 3,648 191,279 4,321 463,434
Incidence %* 21.5 22.5 21.7 100.0 22.4
* Incidence of pupils - the number of pupils with SEN expressed as a proportion of the number of pupils on roll.
. Not applicable.
1Includes School Action, School Action Plus and pupils with statements of special educational needs.
94

Tables for Scotland
Table F1.7. Number of children attending publicly funded special schools in Scotland, 2008/09 to 2012/13.
Source: Scottish pupil census http://www.scotland.gov.uk/Topics/Statistics/Browse/School-Education/Summarystatsforschools
Year 2008/09 2009/10 2010/11 2011/12 2012/13Total 6,756 6,673 6,800 6,973 6,976Gender
Male Female
4,6412,115
4,5752,098
4,6902,110
4,8112,162
4,8442,132
Age1
45678
910111213
141516
171819
Other
6218325337391
419437539602631
704729690
499185
30
14
10234323352356
440460471666662
661745588
488178
25
14
10270337343376
370453480540741
724860657
437165
30
7
*273359365386
407389493563638
814906718
471157
25
*
*342355370374
388417399587662
697971770
454154
25
*
EthnicityWhite - BritishWhite – Other2
Minority ethnic groupings3
Not known / not disclosed
5,656147374
283
5,541172404
275
5,648179427
283
5,827223473
174
5,856217484
163
Disability(assessed and/or declared)4 3,393 3,464 n/a 4,744 4,793
1Age is at 28 February.2White-Other includes White-Gypsy/Traveller, White-Other, White-Irish and White- Polish3Minority ethnic group includes all categories other than White-Scottish, White Other British and White-Other.4Additional Support Needs total includes some pupils with disabilities but this is not displayed
95

separately due to incomplete data.Tables for Northern Ireland
Table F1.8. Number of children (includes all children with special needs) attending special schools in Northern Ireland, 2008/09 to 2012/13.
Source: NI school census http://www.deni.gov.uk/index/facts-and-figures-new/education-statistics/32_statistics_and_research-numbersofschoolsandpupils_pg.htm
Year 2008/09 2009/10 2010/11 2011/12 2012/13Total 4,598 4,443 4,458 4,549 4,653Gender
Male Female
3,1661,432
3,0371,406
3,0351,423
3,1331,416
3,2121,441
Age1
23456789
1011121314151617
18 & over
25117232269238237277357401388374341368426243173132
42139228241236230241294359387406372339367220196146
42175215250232239249270289377403412381337233187167
26189262249
255241255270288337400409415383213196161
16156311282245264274275284333367408411418258176175
EthnicityWhite2
other4,503
954,336107
4,331127
4,402147
4,488165
Disability n.a. 1,513 1,773 1,891 2,026Location: Urban/Rural area 3
UrbanRural
4,056542
3,922521
4,082376
4,153396
4,276377
ReligionProtestant
CatholicOther
1,7621,966870
1,7061,870867
1,7191,862877
1,7241,949906
1,7662,021866
1Age is at 1 July.2Excluding Irish Travellers.3Based on location of school attended.
96

2. Health and health services (article 24)
Rates of infant and under-five child mortality:
Tables for England and Wales
Table F2.1. Rates of infant and under-five child mortality, England and Wales, by gender, 2007- 2011.
Source: ONShttp://www.ons.gov.uk/ons/rel/vsob1/child-mortality-statistics--childhood--infant-and-perinatal/index.html
http://www.ons.gov.uk/ons/rel/vsob1/mortality-statistics--childhood--infant-and-perinatal--england-and-wales--series-dh3-/no--40--2007/index.html
Year 2007 2008 2009 2010 2011
Infant Total Rate per 1,000 live births 4.7 4.6 4.5 4.3 4.2
Male 5.2 5.1 4.9 4.6 4.7
Female 4.2 4.1 4.1 3.9 3.6
Age 1-4 Total Rate per 100,000 population of the same age 22 19 18 17 16
Male 25 19 18 18 18
Female 19 20 18 16 15
97
Tables for Scotland
Table F2.2. Number and rates of infant and under-five child mortality, Scotland, by gender, 2007- 2011.
Source: ONShttp://www.gro-scotland.gov.uk/statistics/theme/vital-events/general/ref-tables/index.html
Year 2007 2008 2009 2010 2011
Infant Total Number 272 253 235 218 238
Male 154 140 142 119 139
Female 118 113 93 99 99
Infant Total Rate per 1,000 live births 4.7 4.2 4.0 3.7 4.1
Male 5.2 4.6 4.7 4.0 4.6
Female 4.2 3.8 3.2 3.4 3.5
Age 1-4 Total Number 51 39 41 42 37
Male 25 22 21 23 19
Female 26 17 20 19 18
Age 1-4 Total Rate per 100,000 population of the same age
23.4 17.5 17.9 17.9 15.5
Male 22.3 19.2 17.9 19.2 15.6
Female 24.5 15.7 17.9 16.6 15.4
98

Tables for Northern Ireland
Table F2.3. Rates of infant and under-5 child mortality in Northern Ireland, 2008-2012.
Source: NISRA http://www.nisra.gov.uk/demography/default.asp9.htm
Year 2008 2009 2010 2011 2012P
Infant Mortality
Infant Deaths (under 1) 123 130 146 110 90Live Births (including non-
residents) 26,252 25,487 25,770 25,733 25,621Infant mortality rate (infant
deaths per 1,000 live births) 4.7 5.1 5.7 4.3 3.5
Under-5 Childhood Mortality
Childhood Deaths (under 5) 145 153 165 128 100
MYE Population (under 5)117,855 120,954 123,590 126,094 127,324
Mortality rate (per 100,000 population under 5) 123 126.5 133.5 101.5 78.5
Mortality rate (per 1,000 population under 5) 1.23 1.26 1.34 1.20 0.79
P provisional data
99

Low birthweight:
Tables for England and Wales
Table F2.4. Number and percentage of live births of low birthweight (less than 2,500 grams), 2008-2012, England and Wales 1 .
Source: ONS http://www.ons.gov.uk/ons/rel/vsob1/characteristics-of-birth-1--england-and-wales/index.html
Year 2008 2009 2010 2011 2012N % N % N % N % N %
England and Wales birthweight (grams)
Under 1,500 8,495 1.2 8,365 1.2 8,631 1.2 8,405 1.2 8,045 1.1
1,500-1,999 10,059 1.4 10,064 1.4 9,980 1.4 10,047 1.4 10,102 1.4
2,000-2,499 31,870 4.5 31,919 4.5 31,612 4.4 32,327 4.5 32,771 4.5
England birthweight (grams)
Under 1,500 8,044 1.2 7,936 1.2 8,171 1.2 7,982 1.2 7,569 1.1
1,500-1,999 9,507 1.4 9,546 1.4 9,461 1.4 9,542 1.4 9,578 1.4
2,000-2,499 30,282 4.5 30,294 4.5 30,067 4.4 30,816 4.5 31,164 4.5
Wales birthweight (grams)
Under 1,500 430 1.2 401 1.1 442 1.2 404 1.1 459 1.3
1,500-1,999 538 1.5 509 1.5 507 1.4 500 1.4 514 1.5
2,000-2,499 1,568 4.4 1,603 4.6 1,530 4.3 1,499 4.5 1,592 4.5
UK data discontinued in 2008.
*Includes births to women whose usual residence is outside England and Wales.**All weights' includes births where the birthweight was not stated.
100

Tables for Scotland
Table F2.5. Proportion of children with low birth weight (under 2,500 grams) in Scotland, 2007-2011.
Source: ISD Scotland SMR02. Publication link: http://www.isdscotland.org/Health-Topics/Maternity-and-Births/Births/
Financial Year 2007 2008 2009 2010 2011Total (Singleton live births)Number 2,928 3,119 3,055 2,885 2,803Total (proportion of all singletons live births) % 5.5 5.6 5.4 5.1 5.0Scottish Index of Multiple Deprivation (SIMD) quintiles
1 – most deprivedNumber 1,048 1,040 1,060 911 868
1 – most deprived% of low bw babies 35.8 33.3 34.7 31.6 31.0
2Number 664 742 658 670 684
2% of low bw babies 22.7 23.8 21.5 23.2 24.4
3Number 482 488 596 462 492
3% of low bw babies 16.5 15.7 19.5 16 17.6
4Number 392 425 353 456 458
4% of low bw babies 13.4 13.6 11.6 15.8 16.3
5 – least deprivedNumber 320 399 374 366 267
5 – least deprived% of low bw babies 10.9 12.8 12.2 12.7 9.5
101
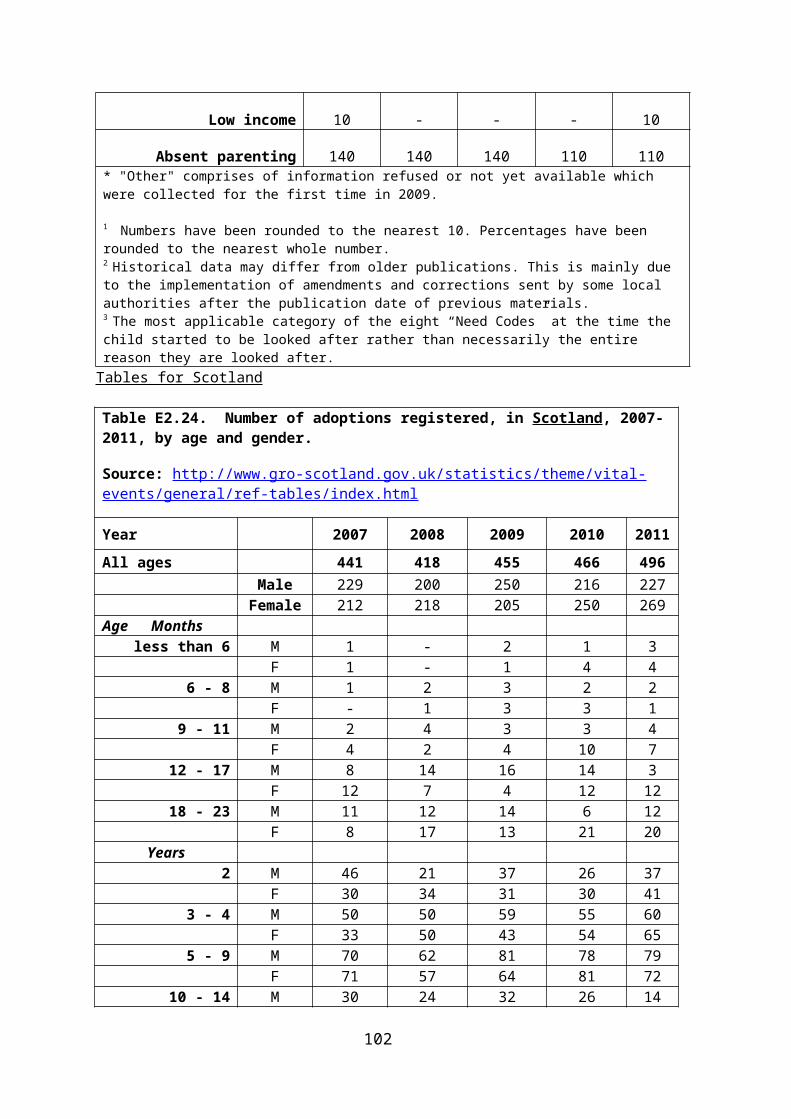
Tables for Northern Ireland
Table F2.6. Proportion of children with low birth weight (<2,500 grams) in Northern Ireland, 2010-2012.
Year 2010 2011 2012
Total 1,571 (25,983) 1,569 (25,384) 1, 542 (25,465)6.44% 6.18% 6.06%
Location:Urban 6.11% 6.75% 7.95%Rural 5.27% 5.11% 3.82%
Deprivation Level1 7.24% 7.74% 5.39%
2 5.53% 6.33% 5.78%
3 6.37% 5.59% 5.80%4 5.07% 5.45% 6.51%5 4.28% 5.28% 6.01%
102

Low Body Mass Index distribution in primary school children:
Tables for Scotland
Table F2.7. Low Body Mass Index distribution Primary 1 school children in Scotland, 2007/08 - 2011/12.
Source: Source : ISD Scotland, CHSP School November 2012 http://www.isdscotland.org/Health-Topics/Child-Health/
Year 2007/08 2008/09 2009/10 2010/11 2011/12Number of children measured in participating NHS Boards 28,251 34,463 40,191 41,191 52,139P1 At risk of underweight (%) (BMI<=2nd centile) 1.7 1.8 1.6 1.8 1.2
GenderBoys – Number measured in participating NHS Boards 14,420 17,572 20,589 21,069 26,638Boys - At risk of underweight (%) 1.9 2.1 1.8 2.1 1.6Girls – Number measured in participating NHS Boards 13,831 16,891 19,602 20,122 25,501Girls - At risk of underweight (%)) 1.5 1.4 1.3 1.5 0.9
Scottish Index of Multiple Deprivation (SIMD) quintilesSIMD 1 (Most Deprived)– Number measured in participating NHS Boards 6,180 6,992 7,581 7,721 12,055At risk of underweight (%) 2.0 2.2 1.7 2.0 1.3SIMD 2
– Number measured in participating NHS Boards 6,120 7,444 8,110 8,332 10,382
At risk of underweight (%) 1.8 1.6 1.6 1.6 1.5SIMD 3– Number measured in participating NHS Boards 5,591 7,041 8,357 8,675 9,957At risk of underweight (%) 1.7 1.7 1.6 1.9 1.2SIMD 4– Number measured in participating NHS Boards 5,181 6,880 8,471 8,779 10,251At risk of underweight (%) 1.5 1.5 1.3 1.5 0.9SIMD 5 (Least Deprived)– Number measured in participating NHS Boards 4,980 5,918 7,533 7,569 9,356At risk of underweight (%) 1.4 2.0 1.6 2.0 1.2
Significant changes that have occurred over the above reporting period:The number of NHS Boards participating in these statistics increased from ten in school year 2007/08 to all fourteen in 2001/12. This has resulted in an increase in the proportion of children in Primary 1 across Scotland included in the BMI statistics, from approximately 54% in 2007/08 to 92% in 2011/12.
103

Percentage of children immunised:
Tables for United Kingdom
Table F2.8. Percentage of children immunised by their 1st birthday, by country of the UK, 2008/09 - 2012/13.
Source: HPA, COVER http://www.hscic.gov.uk/searchcatalogue?q=title:+NHS+Immunisation+statistics&area=&size=10&sort=Relevance
Year 2008/09 2009/10 2010/11 2011/12 2012/13
Number of children aged 1 (thousands) (=100%)United Kingdom 772.8 783.7 793.8 805.5 810.5
England 654.2 664.8 674.5 686.2 691.0Northern Ireland 24.9 25.0 25.0 25.4 25.1
Scotland 58.8 59.3 59.3 58.5 59.0Wales 34.9 34.7 35.0 35.4 35.4
Percentage Immunised by their 1st birthday
United KingdomDTaP/IPV/Hib* 92.8 94.1 94.5 95.0 95.1
MenC 92.0 93.3 93.8 94.3 94.3PCV 92.0 93.5 94.1 94.6 94.8
EnglandDTaP/IPV/Hib* 92.0 93.6 94.2 94.7 94.7
MenC 91.2 92.7 93.4 93.9 93.9PCV 91.3 92.9 93.6 94.2 94.4
Northern IrelandDTaP/IPV/Hib* 97.3 97.8 97.5 97.6 97.6
MenC 97.0 97.5 97.2 97.2 97.4PCV 96.8 97.5 97.3 97.4 97.5
ScotlandDTaP/IPV/Hib* 97.1 97.4 97.0 97.4 97.4
MenC 96.7 97.0 96.5 96.8 96.9PCV 96.8 97.2 97.0 97.4 97.4
WalesDTaP/IPV/Hib* 95.7 96.2 96.0 96.4 96.5
MenC 95.2 95.9 95.4 96.1 96.1PCV 95.2 96.0 95.7 95.8 95.9
- Data not available.* Diphtheria, Tetanus, Polio, Pertussia (Whooping Cough), Haemophilus Influenzae.
104

Table F2.9. Percentage of children immunised against Measles, Mumps and Rubella (MMR) by their 2nd and 5th birthday, by country of the UK, 2008/09-2012/13.
Source: HPA, COVER http://www.hscic.gov.uk/searchcatalogue?q=title:+NHS+Immunisation+statistics&area=&size=10&sort=Relevance
2008-09 2009-10 2010-11 2011-12 2012-13
Number of children aged 1 (thousands) (=100%)
United Kingdom 772.8 783.7 793.8 805.5 810.5
England 654.2 664.8 674.5 686.2 691.0
Northern Ireland 24.9 25.0 25.0 25.4 25.1
Scotland 58.8 59.3 59.3 58.5 59.0
Wales 34.9 34.7 35.0 35.4 35.4
United Kingdom% Immunised by
their 2nd birthday – 1st dose 85.8 88.9 89.7 91.6 92.7
% Immunised by their 5th birthday
– 1st dose 89.7 91.7 92.5 93.4 94.3% Immunised by
their 5th birthday – 1st and 2nd dose 79.2 83.6 85.0 86.5 88.2
England% Immunised by
their 2nd birthday – 1st dose 84.9 88.2 89.1 91.2 92.3
% Immunised by their 5th birthday
– 1st dose 88.9 91.0 91.9 92.9 93.9% Immunised by
their 5th birthday – 1st and 2nd dose 78.0 82.7 84.2 86.0 87.7
Northern Ireland% Immunised by
their 2nd birthday – 1st dose 901.6 92.2 92.9 93.3 95.6
% Immunised by their 5th birthday
– 1st dose 95.6 96.0 96.7 96.7 97.0% Immunised by
their 5th birthday – 1st and 2nd dose 88.9 89.9 91.3 91.2 90.9
105

Scotland% Immunised by
their 2nd birthday – 1st dose 92.5 93.7 93.2 94.3 95.1
% Immunised by their 5th birthday
– 1st dose 95.3 96.2 96.1 96.6 96.9% Immunised by
their 5th birthday – 1st and 2nd dose 86.0 89.7 89.9 90.2 92.1
Wales% Immunised by
their 2nd birthday – 1st dose 88.2 92.2 91.5 92.7 94.6
% Immunised by their 2nd birthday
– 1st dose 91.0 93.4 94.4 94.6 95.8% Immunised by
their 5th birthday – 1st and 2nd dose 82.1 86.1 86.9 87.1 89.6
106

Rates of maternal mortality:
Tables for England and Wales
Table F2.10. Rates of maternal mortality due to pregnancy, childbirth and the puerperium1 (ICD-10 code O00-O99) in England and Wales, 2007-2011.
Source: ONS http://www.ons.gov.uk/ons/rel/vsob1/mortality-statistics--deaths-registered-in-england-and-wales--series-dr-/index.html
Pregnancy,childbirth andthe puerperium
2007 2008 2009 2010 2011
Death rates per million population
Total 12 13 18 10 12
0-5 - - - -
5-14 - - - -
15-24 2 3 4 1 2
25-34 5 5 7 7 6
35-44 5 4 5 2 3
45-54 1 1 - 1
55 and over - 1 - -1The state of a woman during childbirth or immediately thereafter. The approximate six-week period lasting from childbirth to the return of normal uterine size.
107

Tables for Scotland
Table F2.11. Maternal mortality, by underlying cause, Scotland, 2007- 2011.
Source:http://www.gro-scotland.gov.uk/statistics/theme/vital-events/general/ref-tables/index.html
Number of deaths
Year 2007 2008 2009 2010 2011
Pregnancy, childbirth and the puerperium (O00-O99) 8 5 6 3 5
By cause:Oedema, proteinuria and hypertensive
disorders in pregnancy, childbirth and the puerperium (O10-O16)
1 0 0 0 0
Other maternal disorders predominantly related to pregnancy (O20-O29)
2 0 0 0 0
Maternal care related to the fetus and amniotic cavity and possible delivery
problems (O30-O48)1 1 0 0 0
Complications predominantly related to the puerperium (O85-O92)
0 0 1 0 3
Other obstetric conditions, not elsewhere classified (O94-O99)
4 4 5 3 2
Rates per 100,000 births
Year 2007 2008 2009 2010 2011
Pregnancy, childbirth and the puerperium (O00-O99)
13.8 8.3 10.2 5.1 8.5
Underlying cause:Oedema, proteinuria and hypertensive
disorders in pregnancy, childbirth and the puerperium (O10-O16)
1.7 - - - -
Other maternal disorders predominantly related to pregnancy (O20-O29)
3.5 - - - -
Maternal care related to the fetus and amniotic cavity and possible delivery
problems (O30-O48)1.7 1.7 - - -
Complications predominantly related to the puerperium (O85-O92)
- - 1.7 - 5.1
Other obstetric conditions, not elsewhere classified (O94-O99)
6.9 6.7 8.5 5.1 3.4
Tables for Northern Ireland
108

Table F2.12. Rates of maternal mortality, in Northern Ireland, 2008-2012.
Source: NISRA
2008 2009 2010 2011 2012P
Number of deaths 0 5 0 0 0
Rate per 100,000 population 0 0.28 0 0 0
Rate per 100,000 live births (including non residents) 0 19.62 0 0 0
P provisional data
Proportion of children born in hospitals:
Tables for England and Wales
Table F2.13. Maternities1 by place of birth in England and Wales, 2007-2011.
Source: ONShttp://www.ons.gov.uk/ons/rel/vsob1/characteristics-of-birth-2--england-and-wales/index.htmlhttp://www.ons.gov.uk/ons/rel/vsob1/birth-statistics--england-and-wales--series-fm1-/index.html
Year 2007 2008 2009 2010 2011
TOTAL Maternities 682,999 701,297 698,324 715,467 716,040
Maternities in NHS establishments2 659,028 676,680 675,193 693,327 694,773
Maternities in Non-NHS establishment3 3,265 3,327 2,868 2,758 2,801
At Home4 19,594 20,247 19,159 18,155 17,200
Elsewhere5 1,112 1,133 1,104 1,227 1,2661 The figures for maternities refer to pregnancies resulting in live births and/or stillbirths.2NHS establishments – generally hospitals, maternity units and maternity wings3Non-NHS establishments – including private maternity units, military hospitals, private hospitals and communal establishments.4At home – denoting the usual place of residence of the mother.5Elsewhere – including all locations not covered above: most of these are at a private residence not that of the mother, or are on the way to a hospital.
Tables for Scotland
109

Table F2.14. Proportion of children born in hospitals in Scotland, 2008-2012.
Source: NRS Birth Records – information provided on request
Year 2008 2009 2010 2011 2012
Hospital 59,163 58,175 57,969 57,788 57,303
Other 878 871 822 802 725
Total 60,041 59,046 58,791 58,590 58,028
% in hospital 98.5 98.5 98.6 98.6 98.8
Tables for Northern Ireland
Table F2.15. Proportion of children born in hospitals in Northern Ireland, 2008-2012.
Source: NISRA http://www.nisra.gov.uk/demography/default.asp8.htm
Year 2008 2009 2010 2011 2012P
Resident Live Births
Number born in Hospital
Percentage
25,631
25,532
99.6%
24,910
24,815
99.6%
25,315
25,203
99.6%
25,273
25,184
99.6%
25,269
25,179
99.6%
P provisional figures
110

Incidence of breastfeeding:
Tables for the United Kingdom/ Great Britain
Table F2.16. Incidence of breastfeeding by country of the United Kingdom, 1990-2010.
Source: HSCIC http://www.hscic.gov.uk/article/2021/Website-Search?productid=9569&q=Infant+breastfeeding+statistics&sort=Relevance&size=10&page=1&area=both#top
Year 1990 1995 2000 2005 2010
% who breastfed initially
UK 62 66 69 76 81
England - - - 78 83
Wales - - - 67 71
England and Wales 64 68 71 77 82
Scotland 50 55 63 70 74
Northern Ireland 36 45 54 63 64
Weighted bases: All Stage 1 mothers
UK 5,533 5,181 9,492 12,290 15,722
England n/a n/a n/a 6,075 7,335
Wales n/a n/a n/a 2,135 2,633
England and Wales 4,942 4,598 5,441 8,210 9,959
Scotland 1,981 1,863 2,274 2,194 3,108
Northern Ireland 1,497 1,476 1,778 1,886 2,650
111

Table F2.17. Incidence of breastfeeding by mother's age and country of the United Kingdom, 2005 and 2010.
Source: HSCIC http://www.hscic.gov.uk/article/2021/Website-Search?productid=9569&q=Infant+breastfeeding+statistics&sort=Relevance&size=10&page=1&area=both#top
UK England Wales Scotland Northern Ireland
Year 2005
%
2010
%
2005
%
2010
%
2005
%
2010
%
2005
%
2010
%
2005
%
2010
%
All mothers 76 81 78 83 67 71 70 74 63 64
Under 20 51 58 54 61 42 50 40 39 35 34
20-24* 67 68 69 70 58 57 59 61 49 48
25-29 76 83 78 85 71 73 70 76 63 62
30+ 84 87 85 89 76 81 78 82 70 74
Weighted bases: All Stage 1 mothers
All mothers
12,290 15,722 6,075 7,335 2,135 2,633 2,194 3,108 1,886 2,650
Under 20
905 838 436 381 205 188 180 187 118 130
20-24 2,397 2,891 1,193 1,349 495 576 386 543 316 418
25-29 3,179 4,380 1,572 2,033 540 818 568 870 497 755
30+ 5,774 7,541 2,861 3,537 883 1,035 1,044 1,502 948 1,341
* In the 2010 IFS Early Results report, published in June 2011, it was reported that incidence of breastfeeding among mothers in this group increased since 2005 in all age groups, but the difference for mothers in the 20-24 age group was not significant. The report can be found at: http://www.ic.nhs.uk/pubs/infantfeeding10
112

Table F2.18. Incidence of breastfeeding by mother's ethnicity, Great Britain, 2005 and 2010.
Source: HSCIChttp://www.hscic.gov.uk/article/2021/Website-Search?productid=9569&q=Infant+breastfeeding+statistics&sort=Relevance&size=10&page=1&area=both#top
% who breastfed initially 2005 2010
All mothers 77 82
White 74 79
Mixed 84 89
Asian or Asian British 94 95
Black or Black British 96 96
Chinese or other ethnic group 93 97
Weighted bases: All Stage 1 mothers in Great Britain
All mothers 10,404 15,239
White 9,023 12,455
Mixed 182 264
Asian or Asian British 635 1,098
Black or Black British 352 637Chinese or other ethnic
group 132 191
113

Table F2.19. Incidence of breastfeeding by mother's socio-economic classification (NS-SEC) and country of the United Kingdom, 2005 and 2010.
Source: HSCIC http://www.hscic.gov.uk/article/2021/Website-Search?productid=9569&q=Infant+breastfeeding+statistics&sort=Relevance&size=10&page=1&area=both#top
UK England Wales Scotland Northern Ireland
Year 2005
%
2010
%
2005
%
2010
%
2005
%
2010
%
2005
%
2010
%
2005
%
2010
%
All mothers 76 81 78 83 67 71 70 74 63 64
Managerial & professional 88 90 89 91 84 85 84 86 80 81
Intermediate occupations 77 80 80 81 72 73 72 72 58 59
Routine & manual 65 74 67 76 55 63 56 65 49 56
Never worked 65 71 68 74 41 47 52 56 37 30
Unclassified 71 80 73 82 62 62 [53] 68 [64] 63
Weighted bases: All Stage 1 mothers
All mothers 12290 15722 6075 7335 2135 2633 2194 3108 1886 2650
Managerial & professional 4463 5443 2216 2520 667 890 807 1162 723 969
Intermediate occupation 2536 3089 1240 1437 467 491 472 641 406 544
Routine & manual 4047 4257 1970 1962 826 800 750 896 625 731
Never Worked868 1584 455 771 116 240 117 210 85 191
Unclassified 376 1349 195 646 58 213 48 199 47 216
114

Table F2.20. Incidence of breastfeeding by Index of Multiple Deprivation (IMD) and country of the United Kingdom, 2010.
Source: HSCIC http://www.hscic.gov.uk/article/2021/Website-Search?productid=9569&q=Infant+breastfeeding+statistics&sort=Relevance&size=10&page=1&area=both#top
% who breastfed initially
Country
UK England Wales Scotland Northern Ireland
All mothers 81 83 71 74 64
1 – Most deprived 73 76 60 60 49
2 79 81 67 72 60
3 84 86 73 76 66
4 86 87 78 81 74
5 – Least deprived 89 89 85 88 79
Weighted bases: All Stage 1 mothers in Great Britain
All mothers 15,722 7,335 2,633 3,108 2,650
1 – Most deprived 4,379 2,086 695 767 579
2 3,498 1,638 596 649 592
3 2,882 1,324 535 599 558
4 2,562 1,170 428 582 527
5 – Least deprived 2,381 1,106 380 509 395
115

Under 18 conceptions:
Tables for England and Wales
Table F2.21. Under 18 conceptions for England and Wales, 2007-2012.
Source: http://www.ons.gov.uk/ons/rel/vsob1/conception-statistics--england-and-wales/2012/2012-conceptions-statistical-bulletin.html
Year 2007 2008 2009 2010 2011 2012
Total 42,988 41,361 38,259 34,633 31,051 27,834
Rate (a) 41.6 39.9 37.2 34.3 30.9 27.9
(a) Rate per 1,000 female residents aged 15-17.
Tables for Scotland
Table F2.22. Teenage pregnancies in Scotland by age of mother at conception, 2006-2010.
Source: (NRS) registered births and stillbirths & Notifications (to the Chief Medical Officer for Scotland) of abortions performed under the Abortion Act 1967. http://www.isdscotland.org/Health-Topics/Maternity-and-Births/Teenage-Pregnancy/
Year 2006 2007 2008 2009 2010
AgeAged under 16Number 757 731 709 631 616
Aged under 16
Rate as percentage of female population aged 13-15 8.0 7.8 7.8 7.1 7.1
<18 Number 3,872 4,019 3,841 3,496 3,260
Aged under 18
Rate as percentage of female population aged 15-17 41.1 42.1 40.3 37.3 35.9
<20 Number 9,222 9,362 8,888 8,419 7,931
Aged under 20
Rate as percentage of female population aged 15-19 57.7 58.4 55.7 52.9 50.2
116

Table F2.23. Teenage pregnancies in Scotland by age group of mother at conception and deprivation, 2006-2010
Source: NRS registered births and stillbirths & Notifications (to the Chief Medical Officer for Scotland) of abortions performed under the Abortion Act 1967
Number Deprivation Quintile Age and year
Total 1 - Most Deprived
2 3 4 5 - Least Deprived
<202010 7,931 2,949 1,945 1,368 981 6802009 8,419 3,063 2,033 1,438 1,145 7252008 8,888 3,313 2,213 1,472 1,118 7622007 9,362 3,624 2,256 1,485 1,143 8382006 9,222 3,658 2,211 1,516 1,082 743<182010 3,260 1,232 777 580 404 2672009 3,496 1,267 812 614 495 2982008 3,841 1,399 996 630 476 3352007 4,019 1,626 971 588 455 3702006 3,872 1,549 915 634 450 322<162010 616 242 139 114 72 492009 631 233 157 113 79 482008 709 268 177 112 88 612007 731 295 182 110 85 57
Rates Deprivation Quintile Age and year
Total 1 - Most Deprived
2 3 4 5 - Least Deprived
<202010 50.2 90.5 61.9 44.7 32.2 20.62009 52.9 91.7 63.9 46.7 37.6 22.22008 55.7 96.3 69.2 48.0 36.7 23.82007 58.4 103.2 70.5 48.9 37.8 25.82006 57.7 102.7 69.5 50.5 36.3 22.8<182010 35.9 65.4 44.0 33.0 22.6 14.12009 37.3 64.6 44.0 33.7 27.0 15.72008 40.3 68.9 53.1 33.8 25.7 17.52007 42.1 78.9 51.8 31.7 24.7 19.32006 41.1 74.8 49.3 35.2 25.0 16.9<162010 7.1 13.7 8.4 6.7 4.1 2.72009 7.1 12.8 9.3 6.5 4.5 2.62008 7.8 14.3 10.2 6.3 4.9 3.32007 7.8 15.1 10.0 6.0 4.6 3.02006 8.0 14.9 9.9 6.8 4.3 3.5<20 includes all pregnancies in women aged under 20. The rate is calculated using the female population aged 15-19.<18 includes all pregnancies in women aged under 18. The rate is calculated using the female population aged 15-17.<16 includes all pregnancies in women aged under 16. The rate is calculated using the female population aged 13-15.
Tables for Northern Ireland
117

Table F2.24. The number of resident live births to mothers under 18 in Northern Ireland, 2008-2012.
Source: NISRA http://www.nisra.gov.uk/demography/default.asp8.htm
Year 2008 2009 2010 2011 2012P
Number of resident live births to mothers under 18
Percentage
398
1.6%
383
1.5%
358
1.4%
324
1.3%
291
1.2%
P provisional figures.
118

Sexually transmitted infections:
Tables for England
Table F2.25. Number of new Sexually Transmitted Infection (STI) diagnoses in MALE under 20 year olds by age in England, 2009-2012.Source: Public Health England http://www.hpa.org.uk/webc/HPAwebFile/HPAweb_C/1215589013908
Year 2009 2010 2011 2012All new STIs (excluding chlamydia)
<15 43 42 47 5415-19 12,710 12,203 12,254 11,385
Chlamydia*<15 - - - 85
15-19 - - - 15,113
Gonorrhoea<15 4 3 2 5
15-19 1,059 1,090 1,242 1,337
Syphilis<15 0 0 0 0
15-19 50 51 68 51
Herpes<15 1 1 5 6
15-19 624 717 729 730
Warts<15 5 11 7 13
15-19 4,143 4,135 4,111 3,735
* 2012 data for chlamydia are not comparable to data from previous years.
Note: Chlamydia data from 2012 include community data from the new surveillance system, CTAD. The introduction of CTAD has resulted in a change in the number of chlamydia diagnoses from community services.
Table F2.26. Number of new Sexually Transmitted Infection (STI) diagnoses in FEMALE under 20 year olds by age in England, 2009-2012.
119

Source: Public Health England http://www.hpa.org.uk/webc/HPAwebFile/HPAweb_C/1215589013908
Year 2009 2010 2011 2012
All new STIs (excluding chlamydia)<15 295 268 285 239
15-19 19,879 20,258 20,601 19,466
Chlamydia*<15 - - - 868
15-19 - - - 42,555
Gonorrhoea<15 36 32 41 46
15-19 1,593 1,755 1,836 2,077
Syphilis<15 0 0 1 1
15-19 44 28 19 22
Herpes<15 47 41 54 39
15-19 2,883 3,239 3,425 3,404
Warts<15 116 96 88 58
15-19 10,067 9,691 9,577 8,511
* 2012 data for chlamydia are not comparable to data from previous years.
Note: Chlamydia data from 2012 include community data from the new surveillance system, CTAD. The introduction of CTAD has resulted in a change in the number of chlamydia diagnoses from community services.
120

Tables for Scotland
Table F2.27. Number of MALE under 20 year olds diagnosed at Scottish GUM clinics affected by sexually transmitted infections in Scotland, 2005-2009.
Source: ISD Scotland - ISD(D)5. http://www.isdscotland.org/Health-Topics/Sexual-Health/Annual-Report/
Year 2005 2006 2007 2008 2009
Acute STIs
Infectious syphilis 6 12 9 10 6
Gonorrhoea 72 85 87 92 82
Chlamydia 748 794 835 916 820
Genital herpes, first episode 38 39 47 52 58
Genital warts, first episode 441 499 499 563 493
NSGI(non-chlamydial) 206 190 190 221 258
Trichomoniasis 2 2 * * *
HIV infection, newly diagnosed 1 * * * *
Other acute STI 87 88 80 117 96
Other STI's
Other acquired syphilis 1 * * *
Congenital syphilis * * * * *
Genital herpes, recurrence 4 6 10 5 10
Genital warts, recurrence/re-
registered 89 106 115 167 156
Other STI * * * * *
Total 1,695 1,821 1,872 2,143 1,979
121

Table F2.28. Number of FEMALE under 20 year olds diagnosed at Scottish GUM clinics affected by sexually transmitted infections in Scotland, 2005-2009.
Source: ISD Scotland - ISD(D)5. http://www.isdscotland.org/Health-Topics/Sexual-Health/Annual-Report/
Year 2005 2006 2007 2008 2009
Acute STIs
Infectious syphilis 2 1 * * 10
Gonorrhoea 53 72 91 108 75
Chlamydia 1,669 1,855 2,045 2,123 1,844
Genital herpes, first episode 200 186 170 199 177
Genital warts, first episode 925 987 1,103 1,095 973
NSGI(non-chlamydial) 77 62 72 63 49
Trichomoniasis 15 21 9 17 8
HIV infection, newly diagnosed * 1 * * *
Other acute STI 65 69 67 76 69
Other STI's
Other acquired syphilis * 1 * * *
Congenital syphilis * * * * *
Genital herpes, recurrence 35 39 47 41 43
Genital warts, recurrence/re-registered 173 226 299 305 237
Other STI * * * * *
Total 1,545 1,665 755 4,027 1,641
122

Tables for Northern Ireland
Table F2.29. New Episodes of Sexually Transmitted Infection diagnoses in MALE under 20 year olds by age, Northern Ireland, 2008-2012.
Source:http://www.publichealth.hscni.net/sites/default/files/directorates/files/Number%20of%20new%20episodes%202003-2012.pdf
Year 2008 2009 2010 2011 2012
Chlamydia 93 113 105 104 85<16 * 0 * 0 0
16-19 93 113 105 104 85
Gonorrhoea 15 19 12 17 *<16 0 0 0 * 0
16-19 15 19 12 17 *
Syphiliis * 0 0 * *<16 0 0 0 0 0
16-19 * 0 0 * *
Herpes 11 7 10 5 10<16 0 0 0 0 0
16-19 11 7 10 5 10
Warts 100 95 107 104 88<16 * * * * 0
16-19 100 95 107 104 88
* Data is confidential. Cells with a value between 1 and 4 will now be anonymised with an asterisk. In addition, where the anonymised cell can be deduced from the totals, the next smallest cells will also be anonymised.
Significant changes that have occurred over the above reporting period:This information is due to be recalculated following a review of the selected conditions reported to bring Northern Ireland in line with England, i.e. at present on uncomplicated genital Chlamydia cases are counted but in England they include all genital Chlamydia diagnosis. This may result in the figures published increasing slightly.
Table F2.30. New Episodes of Sexually Transmitted Infection (STI) diagnoses in FEMALE under 20 year olds, by age, Northern Ireland, 2008-2012.
Source:http://www.publichealth.hscni.net/sites/default/files/directorates/files/
123

Number%20of%20new%20episodes%202003-2012.pdf
Year 2008 2009 2010 2011 2012
Chlamydia 243 244 192 200 173<16 * 8 * 9 *
16-19 243 236 192 191 173
Gonorrhoea 5 8 9 15 22<16 0 0 * * *
16-19 5 8 9 15 22
Syphiliis 0 0 0 * 0<16 0 0 0 0 0
16-19 0 0 0 * 0
Herpes 58 43 57 77 44<16 * * * 6 5
16-19 58 43 57 71 39
Warts 253 217 230 245 210
<16 * * * * 1016-19 253 217 230 245 200
* Data is confidential. Cells with a value between 1 and 4 will now be anonymised with an asterisk. In addition, where the anonymised cell can be deduced from the totals, the next smallest cells will also be anonymised.
Significant changes that have occurred over the above reporting period:This information is due to be recalculated, following a review of the selected conditions reported to bring Northern Ireland in line with England, i.e. at present on uncomplicated genital Chlamydia cases are counted but in England they include all genital Chlamydia diagnosis. This may result in the figures published increasing slightly.
124

Young carers:
Tables for England and Wales
F2.31. Number of young carers1 in England and Wales, by age, 2001 and 2011.
Source: ONS http://www.ons.gov.uk/ons/rel/census/2011-census-analysis/provision-of-unpaid-care-in-england-and-wales--2011/sty-unpaid-care.html http://www.ons.gov.uk/ons/rel/census/2011-census/detailed-characteristics-for-local-authorities-in-england-and-wales/sty-unpaid-care.html
Becker, S. (2004) Carers. In Research Matters. August special issue.http://lboro.ac.uk/microsites/socialsciences/ycrg/youngCarersDownload/YCReport2004[1].pdf
2001
N
2001
%
2011
N
2011
%
Total Age 0-17 149,942 100 177,918 100
Gender
Male 81,842 46%
Female 96,076 54%
Age
0-4 0 0 0 0
5-7 5,485 4 9,985 6
8-9 7,834 5 12,148 7
10-14 62,661 42 72,266 41
15 21,402 14 23,848 13
16-17 52,580 35 59,671 34
1 Includes children and young people under 18-years-old (aged 5 to 17), who provided unpaid care for family members, friends, neighbours or others because of long-term physical or mental ill-health, disability, or problems relating to old age.
125

F2.32. Age, number and proportion of young carers in England and Wales, by hours caring per week, 2001 and 2011.
Source: ONS http://www.ons.gov.uk/ons/rel/census/2011-census/detailed-characteristics-for-local-authorities-in-england-and-wales/sty-unpaid-care.html
Becker, S. (2004) Carers. In Research Matters. August special issue.http://lboro.ac.uk/microsites/socialsciences/ycrg/youngCarersDownload/YCReport2004[1].pdf
ProvidesUnpaid Care
Total1-19 hours 20-48 hours 50+ hours
2011 Census
Total Age 0-17 177,918 42,768 19,422 15,728
0-4 0 0 0 0
5-7 9,985 7,177 1,166 1,642
8-9 12,148 9,424 1,204 1,520
10-14 72,266 59,262 7,043 5,961
15 23,848 19,596 2,489 1,763
16-17 59,671 47,309 7,520 4,842
All % 100 80 11 9
2001 Census
Total Age 0-17 149,942 125,676 13,313 10,953
0-4 0 0 0 0
5-7 5,485 4,161 512 729
8-9 7,834 6,361 610 863
10-14 62,661 53,710 4,609 3,254
15 21,402 18,265 1,865 1,272
16-17 52,580 43,179 5,717 3,884
All % 100 84 9 7
126

3. Drug and substance abuse (article 33)
Tables for England
Table F3.1. Proportion of pupils in England who had taken drugs in the last year, by gender and age, 2008-12.
Source: HSCIC http://www.natcen.ac.uk/series/survey-of-smoking-drinking-and-drug-use-among-young-people-in-england
Year 2008%
2009%
2010%
2011%
2012%
All Total
Unweighted base
15
7,285
15
7,100
12
6,825
12
6,028
12
6,990
11 years 4 5 5 3 4
12 years 5 7 4 3 4
13 years 13 10 8 9 9
14 years 19 19 14 14 13
15 years 29 30 25 23 24
Boys Total
Unweighted base
16
3,659
16
3,520
13
3,401
13
2,922
12
3,456
11 years 5 5 4 2 4
12 years 6 7 4 3 6
13 years 14 10 9 10 9
14 years 19 19 16 16 13
15 years 30 32 27 26 24
Girls Total
Unweighted base
14
3,626
14
3,580
12
3,424
11
3,106
12
3,534
11 years 2 4 5 3 4
12 years 5 6 5 4 3
13 years 13 10 8 9 9
14 years 18 18 13 13 14
15 years 28 27 24 21 23
127

Table F3.2. Proportion of pupils in England who drank alcohol in the last week, by gender and age, 2008-12.
Source: HSCIC http://www.natcen.ac.uk/series/survey-of-smoking-drinking-and-drug-use-among-young-people-in-england
Age 2008%
2009%
2010%
2011%
2012%
All Total
Unweighted base
18
7,478
18
7,595
13
7,017
12
6,435
10
7,311
11 years 3 3 1 1 1
12 years 5 6 3 2 2
13 years 14 12 9 7 6
14 years 24 25 15 15 12
15 years 38 38 30 28 25
Boys
Unweighted base
18
3,798
19
3,812
13
3,531
12
3,155
11
3,639
11 years 3 3 2 2 1
12 years 6 7 3 3 3
13 years 15 12 9 7 6
14 years 24 25 15 15 12
15 years 38 39 29 29 25
Girls
Unweighted base
17
3,680
17
3,783
13
3,486
12
3,280
10
3,672
11 years 2 2 1 0 1
12 years 4 4 3 2 1
13 years 13 12 9 7 7
14 years 25 24 16 15 11
15 years 37 37 30 27 26
128

Table F3.3. Number of under-18s in England accessing specialist substance misuse services, by gender and age, 2007-08 to 2011-12.
Source: National Treatment Agency (NTA) http://www.nta.nhs.uk/statistics.aspx
2007-08 2008-09 2009-10 2010-11 2011-12
Under-18 Total 23,905 24,053 23,528 21,955 20,688
Gender
Male 14,629 14,007 13,329
Female 8,699 7,948 7,359
Age
<12 227 193 155 128 110
12 years 467 442 385 315 323
13 years 1,476 1,500 1,396 1,234 1,129
14 years 3,466 3,550 3,300 3,092 3,009
15 years 5,658 5,574 5,770 5,445 5,097
16 years 5,987 6,133 5,823 5,657 5,297
17 years 6,624 6,663 6,701 6,084 5,723
129

Table F3.4 Number of under-18s in England accessing specialist substance misuse services, by ethnicity, 2009-10 to 2011-12.
Source: National Treatment Agency (NTA) http://www.nta.nhs.uk/statistics.aspx
2009-101 2010-11 2011-12
Under-18 Total 23,528 21,955 20,688
Ethnicity
White British 19,739 18,400 16,930
White Irish 145 147 134
White Other 331 347 379
White & Black Caribbean 620 578 582
White & Black African 89 109 113
White and Asian 168 139 123
Other Mixed 308 309 273
Indian 119 118 126
Pakistani 238 197 226
Bangladeshi 165 188 188
Other Asian 187 109 216
Caribbean 432 344 410
African 222 216 276
Other Black 244 253 286
Chinese 8 5 6
Other 190 173 186
1No ethnicity breakdowns for this data prior to 2009-10.
130

Table F3.5. Number of under-18s in England accessing specialist substance misuse services, by accommodation status, 2010-11 to 2011-12.
Source: National Treatment Agency (NTA) http://www.nta.nhs.uk/statistics.aspx
2010-111 2011-12
Under-18 Total 21,955 20,688
Accommodation Status
Living with parents or other relatives 16,686 16,004
Independent – settled accommodation 783 706
Independent – unsettled / housing problem 578 437
Independent – no fixed abode 193 148
Looked after child in care 1,714 1,177
Looked after child living independently 187 190
YP supported housing 789 1,106
Young offender in secure care 130 127
1 No accommodation status breakdown for this data prior to 2010-11.
131

Table F3.6. Number of under-18s in England accessing specialist substance misuse services, by education and employment status, 2010-11 to 2011-12.
Source: National Treatment Agency (NTA) http://www.nta.nhs.uk/statistics.aspx
2010-111 2011-12
Under-18 Total 21,955 20,688
Education and Employment Status
Mainstream education 7,152 6,897
Alternative education 2,707 2,631
Temporarily excluded 132 103
Permanently excluded 198 119
Persistent absentee 286 233
Apprenticeship / training 765 824
Employed 361 311
Not in education or employment 2,796 2,802
Economically inactive caring role 28 15
Economically inactive health issue 26 22
1 No education and employment status for this data prior to 2010-11.
132

4. Children with incarcerated parents
Tables for England and Wales
Table F4.1. Number of children with parents in prison in England and Wales, 2006 and 2009.
Source: MoJ – Williams, K., Papadopoulou, V., & Booth, N (2012) Prisoners’ childhood and family backgrounds: Results from the Surveying Prisoner Crime Reduction (SPCR) longitudinal cohort study of prisoners.https://www.gov.uk/government/uploads/system/uploads/attachment_data/file/162361/prisoners-childhood-family-backgrounds.pdf.pdf
Ministry of Justice (MoJ) figures show that at the end 30 June 2006 there were 75,542 prisoners aged 18 and over in prison establishments. This includes prisoners serving sentences of more than four years and on remand. Data from the 2005/06 Surveying Prisoner Crime Reduction Study (SPCR) published in March 2012 show that prisoners aged 18 and over have an average of 1.14 children. This results in a total estimate of approximately 86,000 children with a parent imprisoned in 2006 (These estimates assume that long-term and remand prisoners had the same average number of children as prisoners sentenced up to four years).
Based on the number of unique persons estimated to have been in prison in 2009, and the average number of children reported by prisoners in the SPCR sample (1.14 children), it is estimated that approximately 200,000 children had a parent in prison at some point in 2009. In terms of the number of children with a parent in prison at a single point in time, approximately 90,000 children had a parent in prison at the end of June 2009.
133

G. Education, leisure and cultural activities (articles 28, 29, 30 and 31)
Levels of attainment:
Tables for England
Table G1. Key Stage 2 test levels of attainment in English1, all Schools2, by gender, in England, 2008-2012.3
Source: DfEhttps://www.gov.uk/government/publications/national-curriculum-assessments-at-key-stage-2-in-england-academic-year-2011-to-2012
Year 2008 2009 2010* 2011 2012**
Total number of eligible pupils (thousands) 596.0 579.5 422.2 554.5 542.3
% at Level 4 or above 81 80 80 82 85
GenderMale 77 75 75 77 82
Female 86 85 85 86 89
% at Level 5 or above 30 29 33 29 38
GenderMale 23 23 26 23 31
Female 36 36 40 36 441 In 2012, English was calculated from reading test results and writing teacher assessment rather than from reading and writing tests as in previous years. English in 2012 is, therefore, not comparable to previous years.
2The England all schools figures include those independent schools who chose to take part in Key Stage 2 assessments.
3 Figures for 2012 are based on revised data. Figures for all other years are based on final data.
* The state-funded school participation rate in 2010 was 74% due to industrial action.
** In 2012, English was calculated from reading test results and writing teacher assessment rather than from reading and writing tests as in previous years. English in 2012 is, therefore, not comparable to previous years.
134

Table G2. Attainment gap1 at age 11 between pupils eligible for Free School Meals and the rest2, in England, 2011-12.3
Source: DfE National Pupil Database http://www.education.gov.uk/researchandstatistics/statistics/keystatistics/b00214299/attainment-gap-at-ages-11-16-and-19
Coverage: State-funded schools (including Academies and CTCs) in England
Year 2011 2012
Number of eligible pupils
Percentage of pupils
achieving level 4 or above in English and Mathematics
Number of eligible pupils
Percentage of pupils
achieving level 4 or above in English and Mathematics
Pupils eligible for Free School
Meals 100,107 57.9 97,859 65.7
All other pupils4 446,748 77.9 438,605 82.5
Attainment gap5,6
20.0 percentage points
16.8 percentage points
1 Comparisons are made for the percentage of pupils achieving the expected level in both English and maths (level 4 or above).2 In 2012, English was calculated from reading test results and writing teacher assessment rather than from reading and writing tests as in previous years. English in 2012 is, therefore, not comparable to previous years.3 Figures for 2011 are based on final data, 2012 figures are based on revised data.4 Includes pupils for whom free school meal eligibility could not be determined.5 Figures are calculated using unrounded data.6 The attainment gap is calculated from the percentage of all other pupils (those known not to be eligible for free school meals or with an unclassified status) achieving level 4 or above in both English and mathematics minus the percentage of pupils known to be eligible for free school meals achieving level 4 or above in both English and mathematics.
135

Table G3. GCSE and equivalent attempts and achievements, all schools1 in England, 2007-08 to 2011-12.
Source: DfE https://www.gov.uk/government/publications/revised-gcse-and-equivalent-results-in-england-academic-year-2011-to-2012
Year
Pupils at end Key Stage 4*
2007-08 2008-09 2009-10 2009-10****
2010-11 2011-12
Total number of pupils** 653,083 634,496 639,263 639,263 627,093 621,357
% obtaining
5+ GCSEs A*-C or equivalent 65.3 70.0 75.3 75.4 79.6 81.8
5+ GCSEs A*-C or equivalent inc. English & mathematics GCSEs*** 47.6 49.8 53.4 53.5 59.0 59.4
5+ GCSEs A*-G or equivalent 91.6 92.3 92.8 92.9 93.6 94.0
5+ GCSEs A*-G or equivalent inc. English & mathematics GCSEs*** 87.4 88.3 88.7 88.8 92.2 92.4
Any passes**** 98.6 98.9 99.0 99.1 99.3 99.5
1 Includes pupils in state-funded schools, independent schools, independent special schools, non-maintained special schools, hospital schools and alternative provision including pupil referral units.*From 2003/04 this includes attempts in entry level qualifications which do not contribute towards A*-C or A*-G thresholds.**Number of pupils on roll aged 15 at the start of the academic year or at the end of Key Stage 4.***From 2009/2010 iGCSEs, accredited at time of publication, have been counted as GCSE equivalents and also as English & mathematics GCSEs. Also provided are 2009/10 figures without iGCSEs to be consistent with earlier years’ data.****From 2003/04 this includes attempts in entry level qualifications which do not contribute towards A*-C or A*-G thresholds.
136
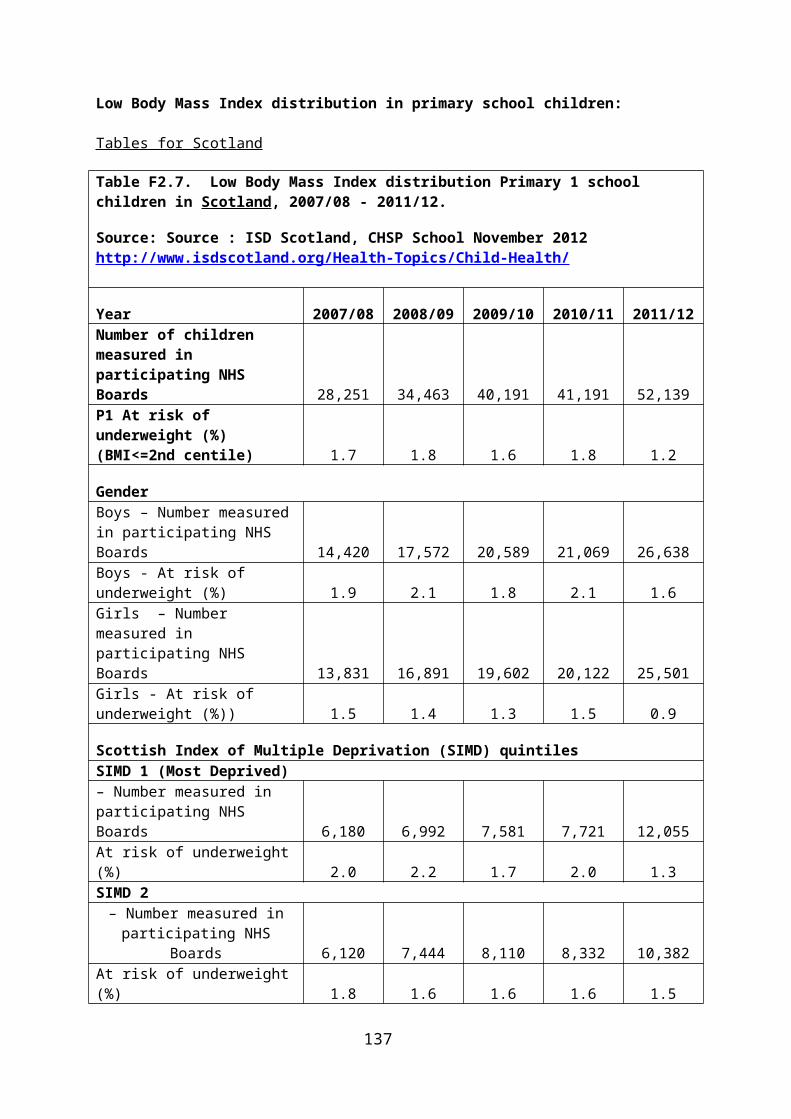
Table G4. Achievements at GCSE and equivalent for pupils at the end of Key Stage 4, in state-funded secondary schools (including Academies and CTCs) in England, by gender 2007-08 to 2011-12.1,2
Source: DfE https://www.gov.uk/government/publications/gcse-and-equivalent-attainment-by-pupil-characteristics-in-england
Year 2007-08
%
2008-09
%
2009-10
%
2010-11
%
2011-12
%
5+ GCSEs A*-C or equivalent
All pupils 64.4 69.8 76.1 80.5 83.0
Male 60.1 65.8 72.4 77.1 79.8
Female 68.8 73.9 79.9 84.0 86.3
5+ GCSEs A*-C or equivalent including English & mathematics GCSEs
All pupils 48.2 50.7 55.1 58.2 58.8
Male 44.2 47.1 51.5 54.6 54.2
Female 52.3 54.4 58.9 61.9 63.6
5+ GCSEs A*-G or equivalent
All pupils 92.4 93.5 94.7 95.2 95.6
Male 90.8 92.0 93.4 94.1 94.7
Female 94.1 95.1 95.9 96.2 96.7
5+ GCSEs A*-G or equivalent including English & mathematics GCSEs
All pupils 90.9 92.0 93.3 93.9 94.2
Male 89.1 90.4 92.0 92.7 93.1
Female 92.8 93.7 94.7 95.1 95.4
1Figures for 2007-08 – 2009-10 are based on final data. 2011-12 figures are based on revised data.
2 From 2009-10 iGCSEs accredited at the time of publication, have been counted as GCSE equivalents and also as English and Mathematics GCSEs.
137

Table G5. Achievements at GCSE and equivalent for pupils at the end of Key Stage 4, in state-funded secondary schools (including Academies and CTCs) in England, by ethnicity 2007-08 to 2011-12.
Source: DfE https://www.gov.uk/government/publications/gcse-and-equivalent-attainment-by-pupil-characteristics-in-england
Year 2007-08
%
2008-09
%
2009-10
%
2010-11
%
2011-12
%
5+ GCSEs A*-C or equivalent
All pupils 64.4 69.8 76.1 80.5 83.0
White 64.4 69.6 75.9 80.1 82.7
Mixed 63.7 69.7 76.5 80.7 83.1
Asian 67.5 72.8 79.6 84.3 86.0
Black 58.9 67.0 74.4 80.3 82.0
Chinese 84.9 87.5 90.3 92.7 93.1
5+ GCSEs A*-C or equivalent including English & mathematics GCSEs
All pupils 48.2 50.7 55.1 58.2 58.8
White 48.4 50.7 55.1 58.0 58.6
Mixed 47.4 51.3 55.0 58.5 59.8
Asian 50.9 53.1 58.4 61.8 62.7
Black 40.7 44.5 49.3 54.4 54.6
Chinese 69.9 71.6 75.5 78.6 76.4
5+ GCSEs A*-G or equivalent
All pupils 92.4 93.5 94.7 95.2 95.6
White 92.3 93.4 94.6 95.0 95.5
Mixed 91.6 93.1 94.1 94.7 95.0
Asian 94.9 95.4 96.0 96.7 97.0
Black 92.7 94.3 95.0 95.7 96.0
Chinese 96.6 96.4 97.5 97.9 97.6
138

5+ GCSEs A*-G or equivalent including English & mathematics GCSEs
All pupils 90.9 92.0 93.3 93.9 94.2
White 90.8 91.9 93.2 93.8 94.2
Mixed 90.1 91.6 92.6 93.5 93.8
Asian 93.5 93.9 94.7 95.4 95.7
Black 91.0 92.5 93.4 94.3 94.2
Chinese 94.9 95.1 96.3 96.9 96.0
139

Table G6. Achievements at GCSE and equivalent for pupils at the end of Key Stage 4, in state-funded secondary schools (including Academies and CTCs) in England, by Free School Meals (FSM) 2007-08 to 2011-12.
Source: DfE https://www.gov.uk/government/publications/gcse-and-equivalent-attainment-by-pupil-characteristics-in-england
Year 2007-08
%
2008-09
%
2009-10
%
2010-11
%
2011-12
%
5+ GCSEs A*-C or equivalent
All pupils 64.4 69.8 76.1 80.5 83.0
FSM 41.0 48.9 58.6 64.7 68.9
All other pupils 67.7 72.8 78.8 83.1 85.3
5+ GCSEs A*-C or equivalent including English & mathematics GCSEs
All pupils 48.2 50.7 55.1 58.2 58.8
FSM 23.8 26.6 31.2 34.6 36.3
All other pupils 51.7 54.3 58.8 62.0 62.6
5+ GCSEs A*-G or equivalent
All pupils 92.4 93.5 94.7 95.2 95.6
FSM 82.3 84.7 87.4 88.1 89.0
All other pupils 93.9 94.8 95.8 96.3 96.8
5+ GCSEs A*-G or equivalent including English & mathematics GCSEs
All pupils 90.9 92.0 93.3 93.9 94.2
FSM 79.3 81.5 84.5 85.4 85.9
All other pupils 92.6 93.6 94.7 95.3 95.6
140

Table G7. Attainment gap1 at age 162 between free school meal pupils and the rest3 in England, 2010/11 to 2011/12.4
Source: DfE National Pupil Database and Key Stage 4 attainment data
http://www.education.gov.uk/researchandstatistics/statistics/keystatistics/b00214299/attainment-gap-at-ages-11-16-and-19
Coverage: State-funded schools (including Academies and CTCs) in England
Year 2010/11 2011/12
Number of
eligiblepupils
Percentage of pupils
achieving an A*-C
grade in English andmathematics
GCSEs
Number of
eligiblepupils
Percentage of pupils
achieving an A*-C
grade in English andmathematics
GCSEs
Pupils eligible for free school
meals79,168 35.1 80,190 36.8
All other pupils3 487,759 62.5 481,125 63.0
Attainment gap5,6
27.4 percentage
points
26.2 percentage
points
1 Comparisons are made using the percentage of pupils achieving an A*-C grade in Englishand mathematics GCSEs.2 Pupils at the end of Key Stage 4 in each academic year.3 Includes pupils for whom free school meal eligibility could not be determined.4 Figures for 2010/11 are based on final data, 2011/12 figures are based on revised data.5 Figures are calculated using unrounded data.6 The attainment gap is calculated from the percentage of all other pupils (those known not to be eligible for free school meals or with an unclassified status) achieving an A*-C grade in English and mathematics GCSEs, minus the percentage of pupils known to be eligible for free school meals achieving an A*-C grade in English and mathematics GCSEs.
141

Table G8. Achievements at GCSE and equivalent for pupils at the end of Key Stage 4, in state-funded secondary schools (including Academies and CTCs) in England, by first language 2007-08 to 2011-12.
Source: DfE https://www.gov.uk/government/publications/gcse-and-equivalent-attainment-by-pupil-characteristics-in-england
Year 2007-08
%
2008-09
%
2009-10
%
2010-11
%
2011-12
%
5+ GCSEs A*-C or equivalent
All pupils 64.4 69.8 76.1 80.5 83.0
English* 64.6 69.9 76.1 80.4 83.0Other than
English** 62.6 68.7 76.0 80.9 82.6
Unclassified*** 56.8 65.8 78.0 81.6 82.4
5+ GCSEs A*-C or equivalent including English & mathematics GCSEs
All pupils 48.2 50.7 55.1 58.2 58.8
English* 48.5 51.1 55.5 58.5 59.2Other than
English** 45.1 47.7 52.4 55.8 56.2
Unclassified*** 42.0 47.7 52.3 59.1 58.5
5+ GCSEs A*-G or equivalent
All pupils 92.4 93.5 94.7 95.2 95.6
English^ 92.4 93.5 94.7 95.2 95.7Other than
English** 92.6 93.7 94.6 95.2 95.5
Unclassified*** 86.7 91.8 95.3 94.5 96.0
5+ GCSEs A*-G or equivalent including English & mathematics GCSEs
All pupils 90.9 92.0 93.3 93.9 94.2
English1 90.9 92.1 93.4 94 94.4Other than
English2 90.6 91.5 92.5 93.4 93.4
Unclassified3 84.9 89.9 93.5 93 93.8
1Includes ‘Not known but believed to be English’.2Includes ‘Not known but believed to be other than English’.3Includes pupils for whom ethnicity or first language was not obtained, refused or could not be determined.
142

Table G9. Achievements at GCSE and equivalent for pupils at the end of Key Stage 4, in state-funded secondary schools (including Academies and CTCs) in England, by Special Educational Needs (SEN) 2007-08 to 2011-12.
Source: DfE https://www.gov.uk/government/publications/gcse-and-equivalent-attainment-by-pupil-characteristics-in-england
Year 2007-08
%
2008-09
%
2009-10
%
2010-11
%
2011-12
%
5+ GCSEs A*-C or equivalent
All pupils* 64.4 69.8 76.1 80.5 83.0No identified
SEN 74.6 80.2 85.7 88.9 90.1
All SEN pupils 27.1 36.2 46.9 53.9 58.2
5+ GCSEs A*-C or equivalent including English & mathematics GCSEs
All pupils* 48.2 50.7 55.1 58.2 58.8No identified
SEN 57.8 61.3 66.5 69.5 69.2
All SEN pupils 13.2 16.5 20.4 22.1 22.4
5+ GCSEs A*-G or equivalent
All pupils* 92.4 93.5 94.7 95.2 95.6No identified
SEN 97.2 97.9 98.4 98.6 98.7
All SEN pupils 75.1 79.5 83.1 84.4 85.0
5+ GCSEs A*-G or equivalent including English & mathematics GCSEs
All pupils* 90.9 92.0 93.3 93.9 94.2No identified
SEN 96.3 97.2 97.9 98.1 98.1
All SEN pupils 71.2 75.2 79.3 80.6 80.8
*Includes pupils for whom free school meal eligibility, SEN provision or SEN primary need could not be determined.
143

Table G10. Achievements at GCSE and equivalent for pupils at the end of Key Stage 4, in state-funded secondary schools (including Academies and CTCs) in England, by disadvantage 2010-11 to 2011-12.
Source: DfE https://www.gov.uk/government/publications/gcse-and-equivalent-attainment-by-pupil-characteristics-in-england
2010-11%
2011-12%
5+ GCSEs A*-C or equivalent
All pupils 80.5 83.0
Disadvantaged pupils 65.6 70.3
All other pupils 85.2 87.3
5+ GCSEs A*-C or equivalent including English & mathematics GCSEs
All pupils 58.2 58.8
Disadvantaged pupils 36.1 38.5
All other pupils 65.1 65.7
5+ GCSEs A*-G or equivalent
All pupils 95.2 95.6
Disadvantaged pupils 88.6 89.9
All other pupils 97.2 97.6
5+ GCSEs A*-G or equivalent including English & mathematics GCSEs
All pupils 93.9 94.2
Disadvantaged pupils 86.1 87.2
All other pupils 96.4 96.6
144

Tables for Wales
Table G11. Percentage of pupils achieving the Core Subject Indicator (CSI) at Key Stage 2, by gender, in Wales, 2008/09 to 2012/13.
Source: Welsh Government National Data Collection
2008/09 2009/10 2010/11 2011/12 2012/13
All Pupils
Total Pupils 34,700 33,674 32,516 31,983 31,034
No. of pupils achieving the
CSI 26,731 26,320 26,014 26,410 26,172
% of pupils achieving the
CSI 77.0 78.2 80.0 82.6 84.3
Boys
Total Boys 17,791 17,264 16,696 16,481 16,004
No. of boys achieving the
CSI 12,921 12,837 12,727 13,080 13,023
% of boys achieving the
CSI 72.6 74.4 76.2 79.4 81.4
Girls
Total Girls 16,909 16,410 15,820 15,502 15,030
No. of girls achieving the
CSI 13,810 13,483 13,287 13,330 13,149
% of girls achieving the
CSI 81.7 82.2 84.0 86.0 87.5
145

Table G12. Attainment gap1 at age 11 between pupils eligible for Free School Meals and the rest, in Wales, 2011-12.
Source: Welsh Government http://wales.gov.uk/topics/statistics/headlines/schools2013/academic-achievement-entitlement-free-school-meals-2012/?lang=en
Coverage: Maintained schools in Wales
Year 2011 2012
Number of eligible pupils
Percentage of pupils
achieving the Core Subject
Indicator2
Number of eligible pupils
Percentage of pupils
achieving the Core Subject
Indicator2
Pupils eligible for Free School Meals 6,485 63.6 6,241 66.7
All other pupils 25,903 84.2 25,566 86.7
Attainment gap3,4 20.6 percentage points 20.0 percentage points
1. Comparisons are made for the percentage of pupils achieving the Core Subject Indicator.2. The Core Subject Indicator represents the percentage of pupils achieving level 4 or above in English or Welsh (first language), mathematics and science teacher assessments in combination.3. Figures are calculated using unrounded data.4. The attainment gap is calculated from the percentage of all other pupils (those known not to be eligible for free school meals) achieving the Core Subject Indicator minus the percentage of pupils known to be eligible for free school meals achieving the Core Subject Indicator.
146

Table G13. Attainment gap at Key Stage 4 between pupils eligible for free school meals and those not eligible, in Wales 2010/11 to 2011/12.
Source: Welsh Examinations database, and PLASC (Pupil level annual school census) held by the Welsh Government.
http://wales.gov.uk/statistics-and-research/examination-results/?lang=en#/statistics-and-research/examination-results/?tab=previous&lang=en
http://wales.gov.uk/statistics-and-research/academic-achievement-free-school-meals/?lang=en
Year 2010/11 2011/12
Number of
pupils
Percentage of pupils
achieving an A*-C
in Maths and English/Welsh
GCSEs
Number of
eligiblepupils
Percentage of pupils
achieving an A*-C
in Maths and English/Welsh
GCSEs
Pupils eligible for free school meals 5,366 22.8 5,186 23.9
All other pupils 28,979 56.4 28,584 57.0
Attainment gap 33.6 percentage points 33.2 percentage points
Note: Calculations done on unrounded figures.Pupils were aged 15 at the start of the academic year.
147

Tables for Scotland
Table G14. Attainment in Scotland, 2009/10 to 2011/12.
Year
Percentage of the S4 year group achieving:English and
Maths at SCQF level 3
5+ Awards at SCQF level 3
5+ Awards at SCQF level 4
5+ Awards at SCQF level 5
(e.g. Standard Grade
Foundation)
(e.g. Standard Grade
Foundation)(e.g. Standard Grade General)
(e.g. Standard Grade Credit)
or better or better or better or better
2009/10
Total 92.9 92.4 78.3 36.1Male 92.3 91.8 75.6 31.8
Female 93.4 92.9 81.1 40.5
2010/11
Total 93.2 92.7 78.8 36.4Male 92.8 92.3 76.6 32.4
Female 93.7 93.1 81.1 40.6
2011/12
Total 94.1 93.9 80.2 37.4Male 93.6 93.4 77.6 32.8
Female 94.7 94.5 82.9 42.2
Note: Attainment by the end of S4 is calculated as a percentage of the S4 year group of that same year.
148

Tables for Northern Ireland
Table G15. Percentage of pupils achieving level 4 or above in Key Stage Two Assessments in English, by gender, in Northern Ireland, 2008/09 to 2011/12.
Source: CCEA
2008/09 2009/10 2010/11 2011/12
All Pupils
Total Pupils 23,244 23,012 21,972 19,744
No. of pupils achieving level 4 or above 18,616 18,734 18,096 16,351
% of pupils achieving level 4 or above 80.1 81.4 82.4 82.8
Boys
Total Boys 11,757 11,744 11,228 10,111
No. of boys achieving level 4 or above 8,875 9,054 8,774 7,912
% of boys achieving level 4 or above 75.5 77.1 78.1 78.3
Girls
Total Girls 11,487 11,268 10,744 9,633
No. of girls achieving level 4 or above 9,741 9,680 9,322 8,439
% of girls achieving level 4 or above 84.8 85.9 86.8 87.6
149

School attendance rates:
Tables for England
Table G16. Attendance rates for all schools in England, 2007-08 to 2011-12.
Source: DFEhttps://www.gov.uk/government/publications/pupil-absence-in-schools-in-england-including-pupil-characteristics
Year 2007-08 2008-09 2009-10 2010-11 2011-12
All Schools
Number of day pupils of compulsory school age 6,244,890 6,182,245 6,163,875 6,160,830 6,184,740
Number of pupil enrolments 6,478,155 6,408,545 6,387,685 6,382,835 6,411,085
Overall attendance 93.7 93.7 94.0 94.2 94.9
Total absence 6.3 6.3 6.0 5.8 5.1
Authorised absence 5.3 5.2 5.0 4.7 4.1
Unauthorised absence 1.0 1.1 1.0 1.1 1.0
150

Table G17. Attendance rates for primary schools in England, 2007-08 to 2011-12.
Source: DFEhttps://www.gov.uk/government/publications/pupil-absence-in-schools-in-england-including-pupil-characteristics
Year 2007-08 2008-09 2009-10 2010-11 2011-12
Primary Schools
Number of day pupils of compulsory school age 3,263,380 3,231,375 3,232,455 3,255,995 3,307,100
Number of pupil enrolments 3,412,005 3,375,830 3,374,040 3,392,330 3,453,445
Overall attendance 94.7 94.7 94.8 95.0 95.6
Total absence 5.3 5.3 5.2 5.0 4.4
Authorised absence 4.7 4.7 4.5 4.3 3.7
Unauthorised absence 0.6 0.6 0.7 0.7 0.7
151

Table G18. Attendance rates for secondary schools, in England, 2007-08 to 2011-12.
Source: DFEhttps://www.gov.uk/government/publications/pupil-absence-in-schools-in-england-including-pupil-characteristics
Year 2007-08 2008-09 2009-10 2010-11 2011-12
Secondary Schools
Number of day pupils of compulsory school age 2,910,515 2,879,555 2,859,695 2,832,395 2,803,860
Number of pupil enrolments 2,988,750 2,954,325 2,934,805 2,911,100 2,878,120
Overall attendance 92.6 92.8 93.1 93.5 94.1
Total absence 7.4 7.2 6.9 6.5 5.9
Authorised absence 5.9 5.8 5.4 5.1 4.6
Unauthorised absence 1.5 1.5 1.4 1.4 1.3
152

Table G19. Attendance rates for special schools, in England, 2007-08 to 2011-12.
Source: DFEhttps://www.gov.uk/government/publications/pupil-absence-in-schools-in-england-including-pupil-characteristics
Year 2007-08 2008-09 2009-10 2010-11 2011-12
Special Schools
Number of day pupils of compulsory school age 70,995 71,315 71,725 72,435 73,780
Number of pupil enrolments 77,400 78,385 78,840 79,405 79,520
Overall attendance 89.4 89.3 89.7 90.0 90.4
Total absence 10.6 10.7 10.3 10.0 9.6
Authorised absence 8.4 8.6 8.3 8.0 7.6
Unauthorised absence 2.2 2.1 2.0 2.9 2.0
153

Tables for Scotland
Table G20. Attendance rates for primary, secondary and special schools in Scotland, 2006/07-2010/11.
Year 2006/07 2007/08 2008/09 2009/10 2010/11
Total 93.3 93.2 93.3 93.2 93.1
Gender:Male 93.3 93.3 N/A 93.3 93.2
Female 93.2 93.1 N/A 93.1 93
Age:Primary 95.3 95.1 N/A 94.9 94.8
Secondary 90.6 90.9 N/A 91.2 91.1Special 91.2 91.2 N/A 90.6 90
Ethnicity:White UK 93 93 94 93 93
White Other 93 92 92 92 91
Mixed 94 93 94 93 93
Asian Indian 93 93 93 93 93Asian Pakistani 92 92 92 92 92
Asian Bangladeshi 92 91 91 92 91
Asian Chinese 96 96 96 96 96Asian other 93 93 93 93 93
Black Caribbean 92 93 93 93 93Black African 95 95 95 95 95
Black Other 92 93 93 92 92
Occupational Traveller(1) 89 90 90 88 89
Gypsy traveller(1) 78 77 78 76 76Other traveller(1) 81 81 84 82 81
Other 92 91 92 92 91
Not disclosed/ not known 92 92 93 92 93
DisabilityASN - mainstream
schools 90.7 90.9 90.7 90.2 90.8No ASN -
mainstream schools 93.4 93.4 93.5 93.4 93.4
154

Location: Urban/Rural areaLarge cities 92.5 92.5 92.7 92.7 92.5Other urban 93.2 93.2 93.4 93.2 93.1
Accessible towns 93.7 93.7 93.8 93.7 93.6Remote towns 93.5 93.5 93.6 93.4 93.3
Accessible rural 94.4 94.4 94.4 94.1 94Remote rural 94.2 94.2 94.2 93.8 93.7
Significant changes that have occurred over the above reporting period: These data are now only collected every 2 years. The next collection will be December 2013.
155

Tables for Northern Ireland
Table G21. Attendance rates at primary schools in Northern Ireland (% of total half days attended), 2008/09 to 2011/12.
Source: http://www.deni.gov.uk/index/facts-and-figures-new/education-statistics/32_statistics_and_research_-_statistics_on_education-pupil_attendance.htm
Year 2008/09 2009/10 2010/11 2011/12
Total 94.9 94.7 94.9 95.2
Gender Male = 94.8
Female = 94.9
Male = 94.7
Female = 94.8
Male = 94.8
Female = 94.9
Male = 95.2
Female = 95.3
Age Year 1 = 94.3
Year 2 = 94.7
Year 3 = 95.1
Year 4 = 95.2
Year 5 = 95.1
Year 6 = 95.1
Year 7 = 94.9
Year 1 = 94.1
Year 2 = 94.6
Year 3 = 94.9
Year 4 = 95.0
Year 5 = 94.9
Year 6 = 94.9
Year 7 = 94.9
Year 1 = 94.3
Year 2 = 94.7
Year 3 = 95.0
Year 4 = 95.1
Year 5 = 95.1
Year 6 = 95.1
Year 7 = 94.8
Year 1 = 94.5
Year 2 = 95.0
Year 3 = 95.4
Year 4 = 95.6
Year 5 = 95.5
Year 6 = 95.5
Year 7 = 95.3
Ethnicity White = 95.1
Minority ethnic group = 92.5
Traveller = 68.0
White = 94.9
Minority ethnic group = 92.6
Traveller = 71.0
White = 95.0
Minority ethnic group = 92.7
Traveller = 70.0
White = 95.4
Minority ethnic group = 93.4
Traveller = 71.2
Disability N/A N/A N/A N/A
Location: Urban/Rural area (based on school location)
Urban = 94.4
Rural = 95.8
Urban = 94.3
Rural = 95.5
Urban = 94.4
Rural = 95.7
Urban = 94.8
Rural = 96.0
Religion N/A N/A N/A N/A
Deprivation Level
% of pupils in school entitled to
Free School Meals – overall attendance rate
0.00 to 9.99% = 96.1
10.00 to 19.99% = 95.0
% of pupils in school entitled to
Free School Meals – overall
attendance rate
0.00 to 9.99% = 96.0
10.00 to 19.99% = 94.8
% of pupils in school entitled to
Free School Meals – overall attendance rate
0.00 to 9.99% = 96.2
10.00 to 19.99% = 95.4
% of pupils in school entitled to
Free School Meals – overall attendance rate
0.00 to 9.99% = 96.6
10.00 to 19.99% = 96.0
156

20.00 to 29.99% = 94.2
30.00 to 39.99% = 93.3
40.00 to 49.99% = 92.7
50% or more = 91.5
20.00 to 29.99% = 94.3
30.00 to 39.99% = 93.2
40.00 to 49.99% = 92.9
50% or more = 91.6
20.00 to 29.99% = 94.5
30.00 to 39.99% = 93.9
40.00 to 49.99% = 93.1
50% or more = 92.2
20.00 to 29.99% = 95.3
30.00 to 39.99% = 94.7
40.00 to 49.99% = 94.0
50% or more = 93.0
157
Table G22. Participation in full-time education and vocational training in schools and FE colleges by 16 and 17 year olds in Northern Ireland, 2006/07 to 2010/11.
Year 2006/07 2007/08 2008/09 2009/10 2010/11
Total 89.9% 87.9% 86.8% 86.1% 90.0%
Gender
Male
Female
85.0%
95.1%
83.7%
92.3%
82.6%
91.1%
83.6%
88.8%
88.0%
92.1%
Age
16
17
92.9%
86.9%
90.6%
85.2%
91.0%
82.4%
89.3%
83.0%
93.8%
86.3%Significant changes that have occurred over the above reporting period:
This data series stopped being produced in 2010/11. Figures beyond that year are no longer available.
158

Pupil to teacher ratios:
Tables for England
Table G23. Pupil to Teacher Ratios, (PTR) and Pupil to Adult Ratios, (PAR) in publicly funded schools in England, January 2007- 2009 and November 2010 - 2012.
Source: DfE School Census for pupils and teachers (excluding overall teachers) up to January 2010, School Workforce Census (for November 2010 to 2012 teachers and overall teachers) and 618g survey for pre November 2010 (overall teachers). https://www.gov.uk/government/publications/school-workforce-in-england-november-2012
January November
Year 2007 2008 2009 2010 20115 20125,6
Local Authority Maintained NurseryPTR (Qualified teachers) within- schools1,2 16.8 16.3 16.5 16.1 16.7 16.5PTR (Qualified and unqualified teachers) within-schools1,2 .. .. .. .. 16.2 15.9PAR within- schools3 5.2 4.9 4.8 .. 5.1 4.9
Local Authority Maintained PrimaryPTR (Qualified teachers) within- schools1,2 21.9 21.6 21.4 20.9 21.0 20.9PTR (Qualified and unqualified teachers) within-schools1,2 .. .. .. .. 20.5 20.5PAR within schools3 12.4 12.0 11.6 .. 11.7 11.5
Primary AcademiesPTR (Qualified teachers) within- schools1,2 .. .. .. .. 21.9 21.4PTR (Qualified and unqualified teachers) within-schools1,2 .. .. .. .. 21.3 20.6PAR within-schools3 .. .. .. .. 12.5 11.7
Total Publicly Funded Nursery and PrimaryPTR (Qualified teachers) within- schools1,2 .. .. .. .. 21.0 20.9PTR (Qualified and unqualified teachers) within-
.. .. .. .. 20.520.5
159

schools1,2
PAR within-schools3 .. .. .. .. 11.7 11.4
Local Authority Maintained SecondaryPTR (Qualified teachers) within- schools1,2 16.5 16.2 15.9 15.6 15.5 15.4PTR (Qualified and unqualified teachers) within-schools1,2 .. .. .. .. 15.0 14.9PAR within-schools3 11.4 11.0 10.7 .. 10.6 10.5
Secondary AcademiesPTR (Qualified teachers) within- schools1,2 .. .. .. .. 15.6 15.5PTR (Qualified and unqualified teachers) within-schools1,2 .. .. .. .. 14.8 14.8PAR within-schools3 .. .. .. .. 10.6 10.6
Total Publicly Funded SecondaryPTR (Qualified teachers) within- schools1,2 .. .. .. .. 15.6 15.5PTR (Qualified and unqualified teachers) within-schools1,2 .. .. .. .. 14.9 14.9PAR within-schools3 .. .. .. .. 10.6 10.5
Publicly Funded Special5
PTR (Qualified teachers) within- schools1,2 6.4 6.3 6.3 6.4 6.3 6.3PTR (Qualified and unqualified teachers) within-schools1,2 .. .. .. .. 5.9 5.8PAR within-schools3 2.2 2.1 2.0 .. 2.1 2.1
Total AcademiesPTR (Qualified teachers) within- schools1,2 15.1 14.7 14.2 15.9 15.9 16.1PTR (Qualified and unqualified teachers) within-schools1,2
.. .. .... 15.2 15.3
PAR within schools3
.. .. .... 10.7 10.6
160

Total Publicly FundedOverall PTR (Qualified Teachers)2,4 .. .. .. .. 17.8 17.7Overall PTR(Qualified and unqualified teachers-within schools2,4 .. .. .. .. 17.2 17.2PAR within-schools3 .. .. .. .. 10.5 10.3
1 The within-school PTR (Qualified) is calculated by dividing the total FTE number of pupils on roll in schools by the total FTE number of qualified teachers regularly employed in schools. The within-school PTR (Qualified and unqualified) is calculated by dividing the total FTE number of pupils on roll in schools by the total FTE number of qualified and unqualified teachers regularly employed in schools.
2 For statistical purposes only, pupils who do not attend both morning and afternoon at least five days a week are regarded as part-time. Each part-time pupil is treated as 0.5 FTE.
3 The PAR is calculated by dividing the total FTE number of pupils on roll in schools by the total FTE number of all teachers and support staff employed in schools, excluding administrative and clerical staff.
4 The overall PTR is based on the total FTE number of pupils on roll in local authority maintained nursery, primary and secondary schools and the FTE of all teachers in these schools (including: centrally employed; occasional teachers; those on employment based routes to QTS; others without QTS, those on paid absence and any replacements). The teacher numbers are from the 618g survey.
5 Includes academies from 2011.
6 November 2012 figures are calculated using the most current figures e.g. January 2013 pupil numbers and November 2012 teacher numbers.
161

Tables for Scotland
Table G24. Pupil: Teacher ratios by type of school, in Scotland, 2008- September 2012.
Year 2008 2009 2010 2011 2012
Total 12.9 13.2 13.3 13.4 13.4
Age:
Primary 15.7 15.8 15.8 16 16.3
Secondary 11.7 11.9 12.1 12.3 12.2
Special 3.2 3.4 3.6 3.5 3.4
Tables for Northern Ireland
Table G25. Pupil: Teacher ratio by type of school in Northern Ireland, 2008/09 to 2012/13.
Source (including link to published data where appropriate): http://www.deni.gov.uk/index/facts-and-figures-new/32_statistical_publications-indexofstatisticalpublications_pg/32_statistical_publications_pressreleases_pg/32_statistical_publications_pupil_teacher_ratios_pg.htm
Year 2008/09 2009/10 2010/11 2011/12 2012/13
School Type
Nursery 25.4 25.7 25.5 25.4 25.6
Primary 20.4 20.4 20.2 20.5 21.2
Secondary (excluding grammar) 14.0 14.3 14.2 14.3 14.7
Grammar 15.1 15.1 15.3 15.6 16.2
Post-primary total 14.5 14.6 14.7 14.8 15.3
Special 6.0 5.9 6.0 6.0 6.0
All grant-aided schools total 16.7 16.8 16.8 16.9 17.5
162

School Exclusions:
Tables for England
Table G26. Number of permanent exclusions by type of school, in England 2007/08 to 2011/12.
Source: DfE School Census https://www.gov.uk/government/publications/permanent-and-fixed-period-exclusions-from-schools-in-england-2011-to-2012-academic-year
Year 2007/08 2008/09 2009/10 2010/11 2011/12All schoolsNumber of permanent exclusions 8,130 6,550 5,740 5,080 5,170Percentage of permanent exclusions7 100 100 100 100 100Percentage of school population 8 0.11 0.09 0.08 0.07 0.07
State-funded primary schools 1, 2
Number of permanent exclusions 960 720 620 610 690Percentage of permanent exclusions6 12 11 11 12 13Percentage of school population7 0.02 0.02 0.02 0.01 0.02
State-funded secondary schools1,3
Number of permanent exclusions 7,000 5,700 5,020 4,370 4,390Percentage of permanent exclusions6 86 87 87 86 85Percentage of school population7 0.21 0.17 0.15 0.13 0.14
Special schools4
Number of permanent exclusions 170 120 100 110 80Percentage of permanent exclusions6 2 2 2 2 2Percentage of school population7 0.19 0.13 0.11 0.12 0.09
1 Includes middle schools as deemed.2 Includes all primary academies, including free schools.3 Includes data for both city technology colleges and all secondary academies, including all through academies and free schools. Information is as reported by schools.4 Includes maintained special schools, non-maintained special schools and special academies. Excludesgeneral hospital schools.5 Figures relating to permanent exclusions for the years 1997/98 to 2009/10 are estimates based onincomplete pupil-level data.6 The number of permanent exclusions expressed as a percentage of the total number.7 The number of permanent exclusions expressed as a percentage of the number (headcount) of all pupils (excluding dually registered pupils) in January each year.
163
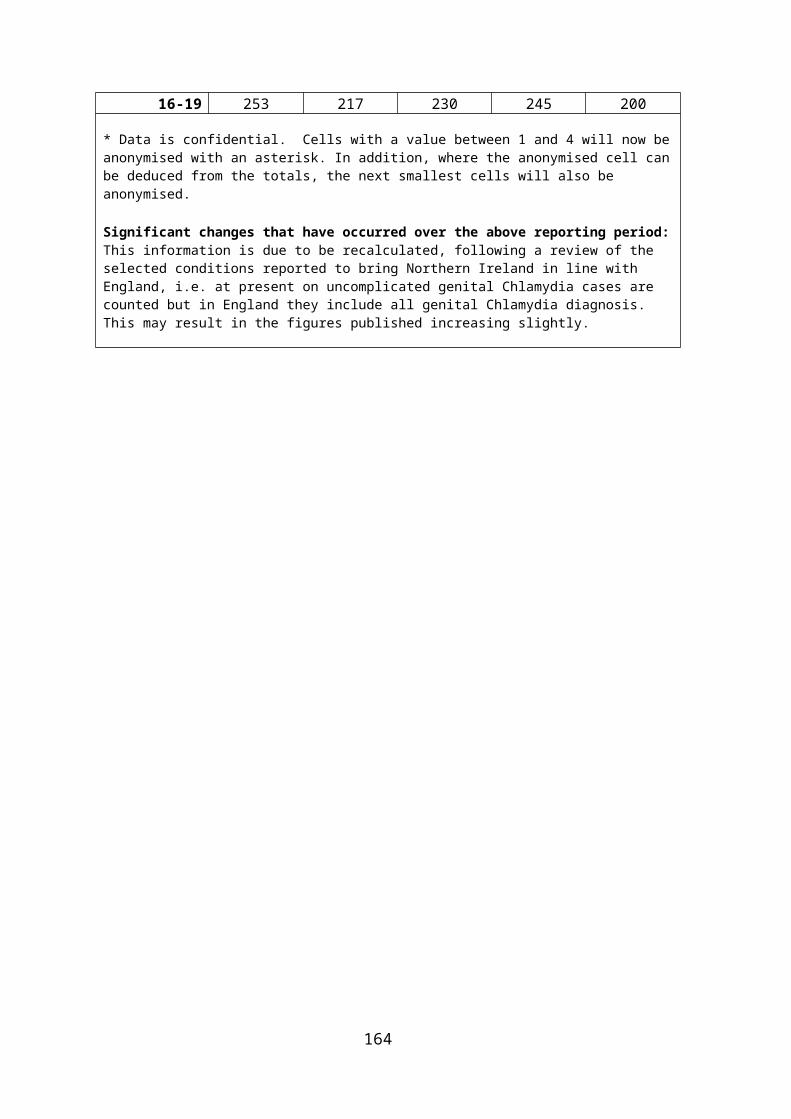
Table G27. Number of fixed period exclusions by type of school in England, 2007/08 to 2011/12.
Source: DfE termly exclusions survey and school censushttps://www.gov.uk/government/publications/permanent-and-fixed-period-exclusions-from-schools-in-england-2011-to-2012-academic-year
Year 2007/08 2008/09 2009/10 2010/11 2011/12All schoolsNumber of fixed period exclusions 383,830 363,280 331,380 324,110 304,370Percentage of fixed period exclusions5 100 100 100 100 100Percentage of school population9 5.14 4.89 4.46 4.34 4.05
State-funded primary schools 1,2
Number of fixed period exclusions 43,290 39,510 37,210 37,790 37,790Percentage of fixed period exclusions5 11 11 11 12 12Percentage of school population6 1.06 0.97 0.91 0.91 0.90
State-funded secondary schools 1,3
Number of fixed period exclusions 324,180 307,840 279,260 271,980 252,210Percentage of fixed period exclusions5 84 85 84 84 83Percentage of school population6 9.86 9.41 8.59 8.40 7.85
Special schools4
Number of fixed period exclusions 16,350 15,930 14,910 14,340 14,370Percentage of fixed period exclusions5 4 4 5 4 5Percentage of school population6 18.31 17.71 16.46 15.66 15.39
1 Includes middle schools as deemed.2 Includes all primary academies, including free schools.3 Includes city technology colleges and all secondary academies, including all through academies andfree schools.4 Includes maintained special schools and special academies. Non maintained special schools areincluded from 2006/07. Excludes general hospital schools.5 The number of fixed period exclusions expressed as a percentage of the total number.6 The number of fixed period exclusions expressed as a percentage of the number (headcount) of allpupils (excluding dually registered pupils) in January each year.
164

Table G28. Exclusions from school of children who have been looked after continuously for at least twelve months, in England, 2008-2011.1,2,3
Source: DfE https://www.gov.uk/government/publications/outcomes-for-children-looked-after-by-local-authorities-in-england-31-march-2011
Year 2008 2009 2010 2011Number of children looked after at 31 March who had been looked after for at least twelve months4 43,670 42,910 44,240 46,110
Of these:
Number eligible for full-time schooling5 26,970 26,180 26,180 26,780
Percentage of children permanently excluded 0.4 0.4 0.3 0.3
Percentage of children with at least one fixed term
exclusion 14.2 13.8 13.1 12.4
1 Children looked after continuously for at least twelve months as at 31 March excluding those children in respite care. Only children who are matched into the CLA-NPD dataset are included.2 Includes children looked after who attend primary, secondary and special schools. Includes pupils attending CTCs or academies.3 Exclusion information is collected from primary and secondary schools, CTCs and academies, maintained and non-maintained special schools. This is then matched via the NPD.4 The total number of children looked after continuously for at least twelve months as at 31 March regardless of age (only those for whom it has been possible to match school census data). 5 The number of children looked after continuously for at least twelve months as at 31 March aged between 5 and 15 (only those for whom it has been possible to match school census data).
National data have been rounded to the nearest 10.
165

Tables for Wales
Table G29. Number of permanent and fixed term exclusions by school type, in Wales 2007/08 to 2011/12.
Source: Welsh Government http://wales.gov.uk/statistics-and-research/exclusions-schools/?lang=en.
Year 2007/08 2008/09 2009/10 2010/11 2011/12
Permanent exclusionsPrimary schools 21 14 19 14 8Secondary schools 212 194 163 142 92Special schools * * * * * Pupil referral units * * * * *Total 241 213 185 158 102
Fixed-term exclusionsPrimary schools 1,829 1,775 1,892 1,870 1,809Secondary schools 16,189 15,415 14,835 14,821 14,234Special schools 424 498 431 542 502Pupil referral units 786 1,346 1,120 1,065 963Total 19,228 19,034 18,278 18,298 17,508
Table G30. Number of exclusions from schools, by Looked After Children (LAC) statusa in Wales, 2007/08 – 2011/12.
Source: Welsh Government http://wales.gov.uk/statistics-and-research/exclusions-schools/?lang=en
Year 2007/08 2008/09 2009/10 2010/11 2011/12
Permanent exclusionsKnown to be LAC 8 8 8 8 *
All exclusions 241 213 185 158 102
Fixed-term exclusionsKnown to be LAC 786 760 851 1,051 893
All exclusions 19,228 19,034 18,278 18,298 17,508
a Pupils who were recorded as being looked after by the local authority at the time of the exclusion. The duration of their care under the local authority is not known.
166

Table G31. Exclusions from school of children who have been looked after continuously for at least twelve months, in Wales, 2008-2011.
Source: Performance management of children's services (PM1) data collection, Welsh Governmenthttps://statswales.wales.gov.uk/Catalogue/Health-and-Social-Care/Social-Services/Childrens-Services/Service-Provision/SchoolExclusionsOfChildrenLookedAfter-by-LocalAuthority-Measure
Year 2008 2009 2010 2011Number of children looked after at 31 March who had been looked after for at least twelve months 3,730 3,555 3,675 4,025
Of these:
Number eligible for full-time schooling 1 2,605 2,720 2,740 2,870
Percentage of children permanently excluded 0.4 0.2 0.1 0.1
Percentage of children with at least one fixed term
exclusion 9.4 9.4 9.9 10.6
Figures rounded to the nearest 5.
1 The number of children looked after continuously for at least twelve months as at 31 March aged between 5 and 15.
167

Tables for Northern Ireland
Table G32. Exclusions from school of children who have been looked after continuously for at least twelve months, in Northern Ireland, 2008 – 2012.1
Source: DHSSPShttp://www.dhsspsni.gov.uk/index/stats_research/stats-cib/statistics_and_research-cib-pub/children_statistics/stats_and_research_cib_children_in_care.htm
Year 2008 2009 2010 2011 2012
Number of children looked after at 30 September who had been looked after for at least twelve months2 1,626 1,653 1,675 1,838 1,878
Of these:
Number eligible for full-time schooling3 1,267 1,282 1,297 1,377 1,398
Of these:
Percentage of children permanently excluded 1% 1% 1% 1% 1%
Percentage of children with at least one fixed term exclusion
(suspension) 8% 8% 10% 8% 8%
1Children looked after continuously for at least twelve months as at 30 September excluding those children in respite care.2The total number of children looked after continuously for at least 12 months as at 30 September regardless of age.3The number of children looked after continuously for at least twelve months as at 30 September aged between 5 and 15.
168

Children in the non-formal education system:
Tables for Northern Ireland
Table G33. Numbers of young people in “Education Otherwise Than at School” in Northern Ireland, 2012.
Source: Education and Library Boards
Year 2009 2010 2011
2012Position at
October 2012 2013
Total - - - 587 -
Gender - - -
403 Male
184 Female
-
Location: Urban/Rural area
- - -
BELB 140
SELB 115
WELB 100
SEELB 74
NEELB 158
-
169

Percentage of children who attend pre-school education:
Tables for England
Table G34. Number and percentage of 3- and 4-year-old children taking up or benefitting from funded early education places1,2 in England, 2009 to 2013.
Source: DfE Early Years Census (EYC), School Census (SC), and School Level Annual School Census (SLASC)https://www.gov.uk/government/publications/provision-for-children-under-5-years-of-age-in-england-january-2013Position in January each yearAll types of providers Year 2009 2010 2011 2012 2013
Total 3 and 4 year olds
Number taking up early education places 3 1,223,730 1,259,750 1,294,920 1,343,690 1,365,640Percentage of population4 100 100 100 101 102Actual number benefitting from funded early education5 1,158,760 1,186,370 1,224,470 1,264,420 1,283,500Percentage of population4 95 94 94 95 96
3 year olds
Number taking up early education places3 602,840 621,000 639,150 672,460 672,880Percentage of population6 98 97 97 100 101Actual number benefitting from funded early education5 563,440 585,480 604,320 625,440 625,310Percentage of population6 92 91 92 93 94
4 year olds
Number taking up early education places3 620,900 638,750 655,760 671,230 692,760Percentage of population7 103 104 102 102 103Actual number benefitting from funded early education5 595,310 600,890 620,150 638,970 658,190Percentage of population7 98 97 96 97 98
1 Count of children aged 3 and 4 at 31 December in the previous calendar year.2 Numbers of 3- and 4-year-olds in schools may include some 2-year-olds.3 Any child attending more than one provider may have been counted twice.4 Numbers of 3- and 4-year-olds taking up places expressed as a percentage of the 3- and 4-year-old population.5 Any child attending more than one provider will have only been counted once.6 Numbers of 3-year-olds taking up places expressed as a percentage of the 3-year-old population.7 Numbers of 4-year-olds taking up places expressed as a percentage of the 4-year-old population.
170

Tables for Scotland
Table G35. Percentage of children who attend pre-school in Scotland, 2009-2012.
Source: Pre-school censushttp://www.scotland.gov.uk/Topics/Statistics/Browse/Children/Pubs-Pre-SchoolEducation
Year Jan2009
Jan2010
Sept2010
Sept2011
Sept2012
Total 95.7 96.3 97.1 99.5 96.1
Age 3 (ante pre-school) 93.3 94.6 98.0 100.7 98.0
Age 4 (pre-school) 97.7 97.8 96.6 98.9 95.1
Base (Unweighted)
Year
Total children of pre-school
ageJan 2009 97,200Jan 2010 99,690
Sept 2010 83,870Sept 2011 86,220Sept 2012 86,199
Significant changes that have occurred over the above reporting period:
Date of collection moved from January to September in 2010.
Children become eligible for pre-school education the term after their third birthday, with the pre-school intakes being divided into cohorts of a year (each including those with birthdays between 1 March and end February). As the three pre-school terms start in September, January and April, data collected at January will count pre-schools at a point where they have three-year olds with birthdays from the previous March to the start of January (so ten of a potential twelve months) in attendance. When data is collected in September, only children with birthdays from March to start September (six months) would be eligible to attend. The uptake rate for three year-olds (ante-pre-school) has been estimated for all collections from 2009 to 2012, but the data from September 2010 will be slightly less robust.
171

Tables from Northern Ireland
Table G36. Percentage of children who attend pre-school, in Northern Ireland, 2008/09 – 2012/13.
Source: DE
Year 2008/09 2009/10 2010/11 2011/12 2012/131
Total - - - - 99.9%
1Figure relates to percentage of children whose parents engaged fully with the admissions process and who were offered a place.
172

Young people not in education, employment or training (NEET):
Tables for United Kingdom
Table G37. Percentage of Young People age 16/17 in the United Kingdom who were not in Education, Employment or Training (NEET), quarterly Spring 2012 to 2013.
Source: ONS quarterly estimates of young people who are NEET, UK widehttp://www.ons.gov.uk/ons/rel/lms/young-people-not-in-education--employment-or-training--neets-/august-2013/statistical-bulletin.html
Last five quarters
Apr-Jun 2012
%
July-Sep 2012
%
Oct-Dec 2012
%
Jan-Mar 2013
%
Apr-Jun 2013
%
July-Sept 2013
%
Oct-Dec 2013
%
Total 6.2 4.5 4.6 5.2 4.9 4.0 4.5
Gender
Men
Women
7.3
5.1
5.6
3.4
5.6
3.5
6.0
4.4
5.0
4.7
4.2
3.8
5.4
3.7
Base (Unweighted): around 700 per quarter.
173

H. Special protection measures (articles 22, 30, 32-36, 37 (b)-(d), 38, 39 and 40)
1. Children outside their country of origin seeking refugee protection (article 22) and internally displaced children
Tables for United Kingdom
Table H1.1. Unaccompanied Asylum Seeking Children (UASC), excluding dependants, initial decisions received in the United Kingdom for those 17 or under, 2008-2012.
Source: Home Office https://www.gov.uk/government/organisations/home-office/series/immigration-statistics-quarterly-release
Year 2008 2009 2010 2011 2012Total initial decisions 17 or under 2,673 2,700 1,688 959 591
Grants of asylum 285 298 264 196 160Grants of
Humanitarian Protection (HP)1 14 19 11 6 3
Grants of Discretionary Leave
(DL)2 1,789 1,937 1,096 603 332
Grants of UASC leave, applicant3 - - - - -Grants of Family
Life4 Leave to Remain (LTR)4,
Private Life5 LTR, or Leave Outside of
The Rules (LOTR) - - - - -
Total Grants 2,088 2,254 1,371 795 495
Certified refusals 8 3 4 0 1
Other refusals 402 341 280 135 85
3rd country6 refusals 94 82 26 27 10Non-compliance7
refusals 81 20 7 2 0
Total refusals 585 446 317 164 96
Is leave granted to a person who is not a refugee under the Refugee Convention but who would, if removed, face in the country of return a real risk to life or person arising from the death penalty; unlawful killing; torture or inhuman or degrading treatment or punishment; or serious and individual threat by
174

reason of indiscriminate violence in situations of international or internal armed conflict. If a person has been refused asylum they may still be considered for this status. Humanitarian protection is normally granted for a period of five years, after which the person can apply for indefinite leave to remain. A person who is granted humanitarian protection is allowed to work and has access to public funds.2 May be considered for an individual who is not accepted as being in need of international protection (i.e. asylum or humanitarian protection (HP)) but who is able to demonstrate particularly compelling reasons why removal would not be appropriate. Discretionary Leave is normally granted for a period of three years. Further leave may be granted, subject to a review of the individual’s circumstances.3 Discretionary leave may also be granted if, for example, the applicant is an Unaccompanied Asylum-Seeking Child (UASC) who is not considered to be in need of international protection but who cannot be removed because adequate reception arrangements in their country are not available. For UASCs, DL can be granted for three years or up until they are aged 17½, whichever comes first.4 Family Life (10 year route): Partners and parents who apply in the UK and are granted leave to remain on a 10 year route to settlement on the basis of their family life where the provisions in Appendix FM including EX.1. in the Immigration Rules apply.5 Leave to remain (LTR) is permission to stay in the UK either temporarily (limited leave to remain) or permanently (indefinite leave to remain). Persons who are granted leave to remain in the UK because they have established a private life in the UK. In order to be eligible to apply for leave to remain on the basis of private life in the UK, the applicant must:• Have at least 20 years‟ continuous residence in the UK (lawful or unlawful); or• Be under the age of 18 and have continuously resided in the UK for at least seven years and it would not be reasonable to expect them to leave the UK; or• Be aged 18 or over but under 25, and have spent at least half their life continuously residing in the UK; or• Be aged 18 or over, have continuously resided in the UK for less than 20 years, but have no ties (including social, cultural or family) with their country of origin.6 Third Country, or safe third country, is a country of which the applicant is not a national or citizen and in which a person’s life or liberty is not threatened by reason of race, religion, nationality, membership of a particular social group or political opinion. It is also one from which a person would not be sent to another State in contravention of his rights under the 1951 Convention. Most Third Country cases are those which come under the arrangements provided by the Dublin Convention or the Dublin II Regulation (the “Dublin arrangements”). Asylum claims may be refused without substantive consideration of the application if the applicant can be returned to a safe third country.7 Non-compliance grounds signify a failure to cooperate with the process to examine and decide the asylum claim within a reasonable period. This includes refusals for failure to respond to invitations to interview to establish identity.
175

Table H1.2. Unaccompanied Asylum Seeking Children (UASC), excluding dependants, applications received in the United Kingdom for those 17 or under by gender, 2008-2012.
Source: Home Office https://www.gov.uk/government/organisations/home-office/series/immigration-statistics-quarterly-release
Year 2008 2009 2010 2011 2012
Total 4,285 3,174 1,717 1,398 1,168
Male under 14 322 247 113 101 72
Male 14 and 15 938 786 313 278 239
Male 16 and 17 1,717 1,219 666 541 471
Male age unknown 776 557 306 229 179
Total Male 3,753 2,809 1,398 1,149 961
Female under 14 59 44 40 14 19
Female 14 and 15 98 73 78 45 34
Female 16 and 17 297 196 160 143 116Female age
unknown 3 5 4 2 4
Total Female 529 360 315 247 203
176

Table H1.3. Age disputed asylum applications1 received in the United Kingdom, 2008 to 2012.
Source: Home Office https://www.gov.uk/government/organisations/home-office/series/immigration-statistics-quarterly-release
Year 2008 2009 2010 2011 2012
Total Applications 1,401 1,129 489 374 328
Applications received from ports 135 91 43 28 22
Application received in-country 1,266 1,038 446 346 306
1When an asylum applicant’s claim to be a child is doubted and they have little or no evidence to support their claimed age, the UK Border Agency will conduct an initial age assessment. Applicants whose physical appearance/demeanour very strongly suggests that they are significantly over 18 years of age will be treated as adults until there is credible documentary or other persuasive evidence to demonstrate the age claimed. All other applicants will be afforded the benefit of doubt and treated as children until an assessment of their age has been completed.
177

2. Children in armed conflicts (article 38), including physical and psychological recovery and social reintegration (article 39)
Tables for United Kingdom
Table H2.1. Intake of under-18s into the United Kingdom regular armed forces (including both trained and untrained personnel1), 2008/09 to 2012/13.
Source: Ministry of Defence, Defence Statistics.http://www.dasa.mod.uk/applications/newWeb/www/index.php?page=48&thiscontent=280&pubType=1&date=2013-05-23&PublishTime=08:30:00
Year 2008/09 2009/10 2010/11 2011/12 2012/13
Number of recruited under-18s 5,820 4,530 2,690 3,050 2,460
% of total intake 27.0 21.2 21.1 20.6 17.1
This comprises new entrants, re-entrants, direct trained entrants and intake from the reserves.
178

3. Economic exploitation of children, including child labour (article 32)
No data.
179

4. Sexual exploitation, abuse and trafficking (articles 34 and 35)
Tables for England and Wales
Table H4.1. Police recorded sexual offences in England and Wales, 2008/09 to 2012/13.
Source: Office for National Statisticshttp://www.ons.gov.uk/ons/rel/crime-stats/crime-statistics/period-ending-march-2013/index.html
Year 2008/09 2009/10 2010/11 2011/12 2012/13
Total 50,185 53,006 53,940 52,760 53,540
Data as at March.
Table H4.2. Offenders cautioned for sexual offences, in England and Wales, 2008/09 to 2012/13.
Source: Ministry of Justice Criminal Justice Statisticshttps://www.gov.uk/government/publications/criminal-justice-statistics-in-england-and-wales-earlier-editions-in-the-series
https://www.gov.uk/government/publications/criminal-justice-statistics-quarterly-march-2013
Year 2008/09 2009/10 2010/11 2011/12 2012/13
Total 1,632 1,432 1,433 1,485 1,497
Data as at March.
180

Table H4.3. Defendants1 proceeded against at magistrates' courts for sexual offences, England and Wales, 2008/09 to 2012/13.
Source: Ministry of Justice Criminal Justice Statisticshttps://www.gov.uk/government/publications/criminal-justice-statistics-in-england-and-wales-earlier-editions-in-the-series
https://www.gov.uk/government/publications/criminal-justice-statistics-quarterly-march-2013
Year 2008/092 2009/10 2010/11 2011/12 2012/13
Total 8,505 9,765 10,424 10,084 9,055
Data as at March.1Including those of unknown sex and "other defendants" i.e. companies, public bodies, etc.2Excludes data for Cardiff magistrates' court for April, July and August 2008.
Table H4.4. Offenders1 found guilty of sexual offences at all courts, England and Wales, 2008/09 to 2012/13.
Source: Ministry of Justice Criminal Justice Statisticshttps://www.gov.uk/government/publications/criminal-justice-statistics-in-england-and-wales-earlier-editions-in-the-series
https://www.gov.uk/government/publications/criminal-justice-statistics-quarterly-march-2013 (tables Q4a,Q4b, Q4d)
Year 2008/09 2009/10 2010/11 2011/12 2012/13Total 1 5.041 5.29 5.960 5.998 5.498Gender Male 4.949 5.216 5.869 5.916 5.423
Female 0.084 0.068 0.081 0.072 0.061Age 10-11 0.008 0.005 0.001
12-14 0.159 0.131 0.08115-17 0.362 0.358 0.28618-20 0.501 0.484 0.44121+ 4.901 4.964 4.675
Ethnicity White 4.464 4.368 4.030Black 0.423 0.425 0.426Asian 0.434 0.497 0.421Other 0.166 0.159 0.147Unknown 0.454 0.502 0.474
Data as at March.1Includes males, females, persons where sex 'not stated' and other offenders, i.e. companies, public bodies etc.
181

Table H4.5. Juvenile defendants (aged 10-17) proceeded against at the magistrates' court, found guilty and sentenced at all courts for offences relating to trafficking of people and abduction of children in England and Wales, 2008-2012. 1,2,3,4
Source: Justice Statistics Analytical Services - Ministry of Justice.Year 2008 2009 2010 2011 2012
Abduction of children*Proceeded
against 11 14 5 7 5
Found Guilty 4 10 1 4 3Sentenced 4 10 1 4 3
Absolute discharge - - - - 1
Conditional discharge 2 1 - - -
Fine - - - - -Community
sentence 1 7 - 4 2
Otherwise dealt with - 1 - - -
Immediate custody 1 1 1 - -
Trafficking of people**Proceeded
against - - - - -
Found Guilty - - - - -Sentenced - - - - -
* The figures for 'Abduction of Children' relate to multiple offences including:- Abduction of child by parent,- Abduction of child by other persons,- Taking, keeping, inducing, assisting or inciting a child away from the person having responsibility for care under a care order, emergency protection order or police protection- Obstructing an authorised person recovering a child
** The figures for 'Trafficking of people' relate to multiple offences including - Trafficking into the UK for sexual exploitation, Trafficking within the UK for sexual exploitation, Trafficking out of the UK for sexual exploitation, Trafficking people into the UK for the purpose of exploitation, Trafficking people within the UK for the purpose of exploitation, Trafficking people out of the UK.
1The figures given in the table relate to persons for whom these offences were the principal offences for which they were dealt with. When a defendant has been found guilty of two or more offences it is the offence for which the heaviest penalty is imposed. Where the same disposal is imposed for two or more offences, the offence selected is the offence for which the statutory maximum penalty is the most severe.2 Every effort is made to ensure that the figures presented are accurate and complete. However, it is important to note that these data have been extracted from large administrative data systems generated by the courts and police forces. As a consequence, care should be taken to ensure data collection processes and their inevitable limitations are taken into account when those data are used.3The number of offenders sentenced can differ from those found guilty as it may be the case that a defendant found guilty in a particular year, and committed for sentence at the Crown Court, may be sentenced in the following year.4Excludes data for Cardiff magistrates' court for April, July and August 2008.
182

5. The administration of juvenile justice (article 40)
Tables for England and Wales
Table H5.1. Proportion of 10-17 year olds who have not had any contact with the criminal justice system (as measured by a reprimand, warning or conviction) in England and Wales, 2007 to 2011.
Source: MoJ
Year 2007 2008 2009 2010 2011
Total population aged 10-17 years* 5,166,267 5,147,618 5,107,919 5,064,581 5,021,870
Average number of offenders aged 10-17
years over the year who had had at least
one conviction, reprimand or warning** 286,515 279,483 253,082 213,082 171,277
% 10-17 year olds not offending 94.5 94.6 95.0 95.8 96.6
* http://www.ons.gov.uk/ons/publications/re-reference-tables.html?edition=tcm%3A77-269171
**These are unpublished figures that have been obtained directly from MoJ.
183

Table H5.2. Number 10-17 year old first time entrants to the criminal justice system and rate young people aged 10-17 receiving their first reprimand, warning or conviction per 100,000 10-17 year olds in the population, in England and Wales, by gender, 2008 to 2012.
Source: MoJ Table 2.2 and 2.7 Supplementary tables https://www.gov.uk/government/publications/youth-justice-statistics
12 month period to the end of March
2008 2009 2010 2011 2012
Number of 10-17 year old first time entrants to the criminal justice system - all offences 100,393 80,329 62,555 45,910 36,677
Males 67,941 54,354 42,064 32,830 27,188
Females 32,081 25,652 20,223 12,835 9,271
Rate of young people aged 10-17 receiving their first reprimand, warning or conviction per 100,000 10-17 year olds in the population 1,862 1,507 1,192 889 710
Males 2,453 1,988 1,563 1,240 1,027
Females 1,224 988 790 510 368
184

Table H5.3. Number of arrests for notifiable offences by age group, England and Wales, 2007/08 - 2011/12.
Source: Home Office. Arrests figures are published annually in the National statistics online release, ‘Police powers and procedures, England and Wales' release; the latest of which (2011/12) is available here: https://www.gov.uk/government/publications/police-powers-and-procedures-in-england-and-wales-201112/police-powers-and-procedures-in-england-and-wales-2011-12.
Year 2007/08 2008/09 2009/10 2010/11 2011/12
Age group:
under 10 yrs 163 83 38 23 42
10 - 17 yrs 315,403 273,269 241,459 210,877 167,995
18 - 20 yrs 223,622 219,308 208,165 199,203 172,302
21 yrs & over 931,649 965,659 934,110 950,597 893,951
age unknown 4,429 3,820 1,550 1,265 738
Total 1,475,266 1,462,139 1,385,322 1,361,965 1,235,028
185

Table H5.4. Percentage of persons (aged 10-17) arrested for notifiable offences by gender, England and Wales, 2007/08 to 2011/12.
Source:Section 1.3 Arrests, table A.03 2010-11 and 2011-12: https://www.gov.uk/government/publications/police-powers-and-procedures-in-england-and-wales-201112/police-powers-and-procedures-in-england-and-wales-2011-12
2009-10 taken from 2010-11 publication:https://www.gov.uk/government/publications/police-powers-and-procedures-england-and-wales-2010-to-2011-second-edition
2008-09 taken from 2009-10 publication: https://www.gov.uk/government/uploads/system/uploads/.../hosb0711.pdf
2007-08 data taken from Police Powers and Procedures 2008-09: http://webarchive.nationalarchives.gov.uk/20110218135832/http://rds.homeoffice.gov.uk/rds/stats-release.html
Year 2007/08 2008/09 2009/10 2010/11 2011/12
Total (%) 5.8 5.0 4.5 3.9 3.2
Gender Male 8.9 7.8 7.0 6.3 5.1
Female 2.4 2.1 1.8 1.5 1.1
Table H5.5. Juveniles sentenced to community sentences (for all offences), England and Wales, 2007/08 to 2011/121.
Source: Ministry of Justice, Table Q5.7. Data to March 2012. https://www.gov.uk/government/publications/criminal-justice-statistics-in-england-and-wales-earlier-editions-in-the-series
Year 2007/08 2008/09 2009/10 2010/11 2011/12
Total 64,865 59,127 52,772 46,961 39,118
1 Excludes data for Cardiff magistrates' court for April, July and August 2008.
186

Table H5.6. Non-custodial and non-community sentences given to juveniles for all offences, England and Wales, 2007/08 to 2011/121.
Source: Ministry of Justice, Criminal Justice Statistics. Table Q5.7 Data to March 2012.
https://www.gov.uk/government/publications/criminal-justice-statistics-in-england-and-wales-earlier-editions-in-the-series
Year 2007/08 2008/09 2009/10 2010/11 2011/12
Total 24,670 22,241 21,132 20,886 16,292
1 Excludes data for Cardiff magistrates' court for April, July and August 2008.
187

Tables for Scotland
Table H5.7. Provision of legal assistance for representation in the Children’s Hearings system in Scottish Courts, 2008/09 to 2012/13.
Source: Scottish Legal Aid Board Annual Reports: http://www.slab.org.uk/about-us/what-we-do/annual-report/
Year 2008/2009 2009/2010 2010/2011 2011/2012 2012/2013
Total 4,571 4,606 4,710 4,934 5,006
Cost of representation
(£000) 3,784 4,511 4,581 4,497 4,913
188

Table H5.8. Provision of legal assistance to under 18s for representation in criminal proceedings in Scottish Courts, 2008/09 to 2012/13.
Source: Unpublished operational data.
Year 2008/2009 2009/2010 2010/2011 2011/2012 2012/2013
Total 9,785 9,112 7,490 6,480 4,504
Gender
Female 1,299 1,251 933 858 651
Male 8,320 7,766 6,519 5,620 3,852
Gender not available 166 95 38 2 1
Age
12-15 388 326 261 218 133
16 4,002 3,462 2,772 2,492 1,688
17 5,395 5,324 4,457 3,770 2,683
Type of proceedings
ABWOR 3,087 3,312 2,617 2,025 1,431
Summary 5,352 4,575 3,822 3,321 2,259
Solemn 1,346 1,225 1,051 1,134 814
Significant changes that have occurred over the above reporting period: The summary (i.e. non-jury) criminal justice system in Scotland has undergone an extensive and far-reaching programme of reform since 2007. The principal aim of the reforms is that fewer cases go to court needlessly and more are dealt with by non-court actions, where it is more appropriate to do so. There has also been a nationwide reduction in crime levels.
189

Table H5.9. Number of under 18s convicted in Scottish Courts, 2007/08 to 2011/12.
Source: Scottish Government Criminal Proceedings database (related statistical publication: http://www.scotland.gov.uk/Topics/Statistics/Browse/Crime-Justice/PubCriminalProceedings)
Year 2007/08 2008/09 2009/10 2010/11 2011/12
Total 7,924 6,678 5,280 4,120 3,390
Gender
Male 7,057 5,871 4,565 3,652 2,978
Female 867 807 715 468 412
Age
under 16 159 124 106 67 47
16 2,202 1,890 1,407 1,053 915
17 5,563 4,664 3,767 3,000 2,428
Significant changes that have occurred over the above reporting period: The summary (i.e. non-jury) criminal justice system in Scotland has undergone an extensive and far-reaching programme of reform since 2007. The principal aim of the reforms is that fewer cases go to court needlessly and more are dealt with by non-court actions, where it is more appropriate to do so.
Table 5.10. Number of 8-17 year olds who have committed detected crimes and offences, in Scotland 2007/08 to 2011/12.
Source: Scottish Policing Performance Framework: http://www.scotland.gov.uk/publications/2012/11/1397
Year 2007/08 2008/09 2009/10 2010/11 2011/12
Total n/a 53,946 49,344 41,476 37,779
190

Tables for Northern Ireland
Table H5.11. Admissions to custody, in Northern Ireland, 2008/09 to 2012/13 (including those under the Police and Criminal Evidence Order PACE).
Source: PSNI Statistics Branch
Year 2008/09 2009/10 2010/11 2011/12 2012/13
PACE Detention – number of
persons arrested 27,095 27,907 26,921 26,904 25,258
Table H5.12. Number of persons under 18 years of age convicted of an offence and percentage given each disposal in Northern Ireland, 2005-2009.
Source: Department of Justice NI
Year 2005 2006 2007 2008 2009
Total 1,455 1,273 1,222 1,487 1,205
Immediate custody 144 89 118 111 90
Suspended custody 72 32 47 44 46
Supervision in Community 443 370 162 234 180
Fine 348 243 201 240 174
Conditional discharge 299 206 158 203 190
Other 77 44 65 40 40
Youth Conference
Order 72 289 471 615 485
This is the most recent data currently available. Data is provided on offenders aged 10 to 17 convicted in court and is based on the principal offence rule: Only the most serious offence for which an offender is convicted is included.
191
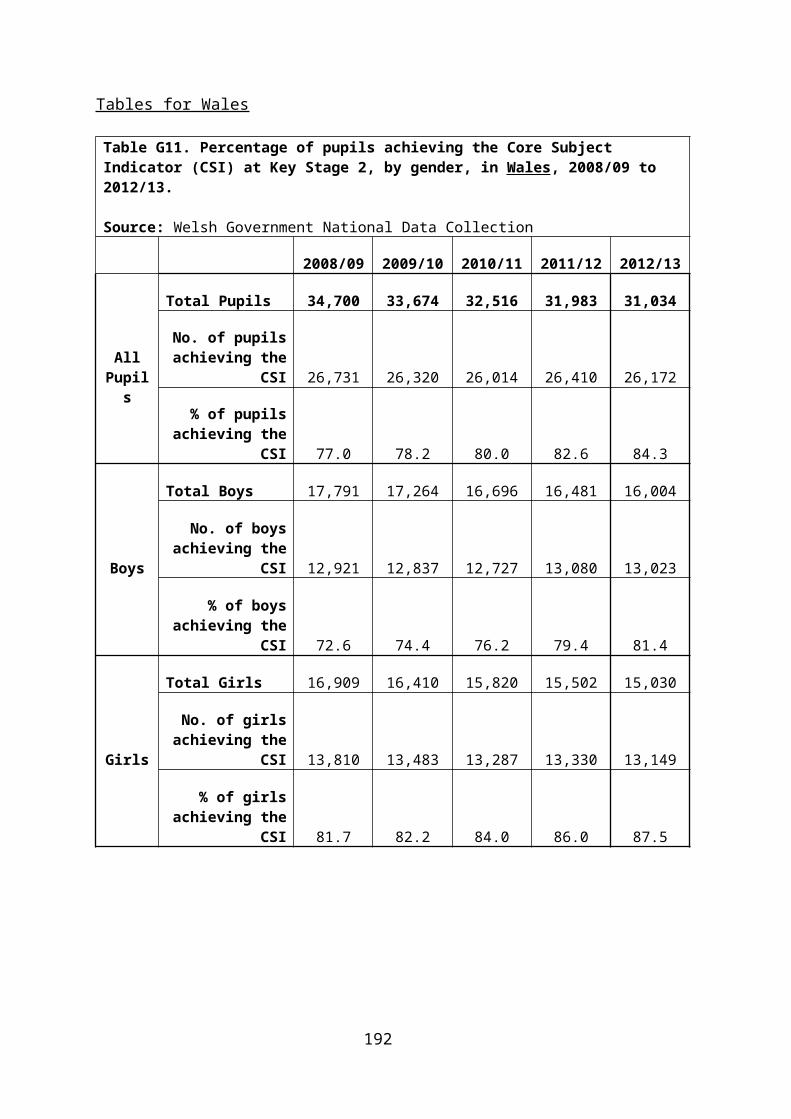
6. Children deprived of their liberty, including any form of detention, imprisonment or placement in custodial settings (article 37 (b)-(d))
Tables for England and Wales
Table H6.1. Average under 18 custody population by gender, England and Wales, 2007/8 to 2011/12.Source: Ministry of Justice Youth Justice Statistics https://www.gov.uk/government/publications/youth-justice-statistics
Year 2007/08 2008/09 2009/10 2010/11 2011/12
Total 2,932 2,881 2,418 2,040 1,963
Gender - Male 2,716 2,689 2,271 1,933 1,854
Female 216 192 147 106 109
Table H6.2. Average under 18 custody population by age, England and Wales, 2007/8 to 2011/12.
Source: Ministry of Justice Youth Justice Statistics (Table 7.6 of Supplementary tables) https://www.gov.uk/government/publications/youth-justice-statistics
Year 2007/08 2008/09 2009/10 2010/11 2011/12
Total 2,932 2,881 2,418 2,040 1,963
Age 11/12 . 4 6 5 3
13 . 30 24 19 14
14 . 135 102 75 72
15 . 387 323 264 242
16 . 824 679 592 557
17 . 1,501 1,284 1,085 1,076
. data not available
192

Table H6.3. Average under 18 custody population by ethnicity, England and Wales, 2007/08 to 2011/12.
Source: Ministry of Justice Youth Justice Statistics (Table 7.6 of Supplementary tables) https://www.gov.uk/government/publications/youth-justice-statistics
Year 2007/08 2008/09 2009/10 2010/11 2011/12
Total 2,932 2,881 2,418 2,040 1,963
Ethnicity Asian 108 138 142 129 131
Black 399 402 340 351 308
Mixed 206 188 168 123 119
Other 11 4 4 3 3
White 2,087 1,909 1,641 1,303 1,216
Not known 121 242 123 131 186
Table H6.4. Average days in custody by legal basis for detention (under 18s only), England and Wales, 2007/08- 2011/12.
Source: Ministry of Justice Youth Justice Statistics https://www.gov.uk/government/publications/youth-justice-statistics
Average number of days: Table Ch7.9 Using Average for year
Year 2007/08 2008/09 2009/10 2010/11 2011/12
Legal basis for detention
Detention and Training Order (DTO) 107 106 109 111 107
Remand 36 42 44 41 42
S90/91/226/228 combined 341 367 349 374 353
Overall Average (days) 76 81 80 78 77
193

Table H6.5. Population (aged 15-17) in prison establishments by sex, ethnicity and religion, England and Wales, June 2008-2012.
Source: Ministry of Justice Offender Management Statistics. Annual Tables - Offender management caseload statistics: https://www.gov.uk/government/publications/offender-management-statistics-quarterly--2
https://www.gov.uk/government/publications/offender-management-statistics-quarterly-earlier-editions
Year 2008 2009 2010 2011 2012Total 2,527 2,120 1,656 1,581 1,282Gender
Male2,456 2,063 1,628 1,558 1,258
Female 70 57 28 23 24Ethnicity
White. . . . 736
Mixed . . . . 126Asian or Asian
British. . . . 92
Black or Black British
. . . . 283
Chinese or other ethnic group
. . . . 15
Not stated . . . . 1Unrecorded . . . . 29
ReligionAnglican
. . . . 81
Free Church . . . . 8Roman
Catholic. . . . 162
Other Christian
. . . . 167
Muslim . . . . 235Hindu . . . . 0
Sikh . . . . 4Buddhist . . . . 2
Jewish . . . . 0Other religious group . . . . 7
Non recognised
. . . . 0
No religion . . . . 554Not recorded 62
. data not available.
194

195

Tables for Scotland
Table H6.6. Number of under 18s held in prison, in Scotland, between 2007/08 and 2011/12, by gender.
Source: Scottish Government Justice Analytical Services
Year 2007/08 2008/09 2009/10 2010/11 2011/12
Total 222 204 205 157 128
Male 211 192 190 150 124
Female 11 12 15 7 4
Table H6.7. Average length of time spent in detention (not necessarily continuously), in Scotland, by under 18s during 2007/08 to 2011/12.
Source: Scottish Government Justice Analytical Services
Year 2007/08 2008/09 2009/10 2010/11 2011/12
Total (days) 96 89 98 97 83
Table H6.8. Average length of time spent in detention (continuously) by under 18s, in Scotland, during 2007/08 to 2011/12.
Source: Scottish Government Justice Analytical Services
Year 2007/08 2008/09 2009/10 2010/11 2011/12
Total (days) 61 61 69 68 56
196

Tables for Northern Ireland
Table H6.9. Admissions to the Juvenile Justice Centre for those children either held under the Police and Criminal Evidence Order PACE or on pretrial detention, in Northern Ireland, 2008-2012.
Source: YJA Statistics and Research Branch http://www.youthjusticeagencyni.gov.uk/document_uploads/SB_4_2012_-_YJA_Provisional_Workload_Statistics_April-December2012.pdf
Year 2008 2009 2010 2011 2012(provisional)
Total 238 321 397 366 371
Gender M – 207F – 31
M – 276F – 45
M – 331F – 66
M – 313F – 53
M – 338F – 33
Age 10-13 – 914 – 2115 – 6316 – 12317+ – 22
10-13 – 614 – 5915 – 9316 – 12417+ – 39
10-13 – 1414 – 2815 – 10216 – 15617+ – 97
10-13 – 2314 – 3415 – 6316 – 13317+ – 113
10-13 – 2114 – 3515 – 7316 – 8317+ – 159
Ethnicity White – 171Other – 9Unknown – 58
White – 295Other – 5Unknown – 21
White – 387Other – 8Unknown – 2
White – 353Other – 11Unknown – 2
White – 357Other – 12Unknown – 2
Disability Yes – 6No – 100Unknown – 132
Yes – 16No – 254Unknown – 51
Yes – 50No – 332Unknown – 15
Yes – 58No – 300Unknown – 8
Yes – 61No – 302Unknown – 8
Location: Urban/Rural area
Unavailable Unavailable Unavailable Unavailable Unavailable
Religion Protestant – 83Catholic – 144Other – 9None/Unknown - 2
Protestant – 126Catholic – 186Other – 2None/Unknown - 7
Protestant – 148Catholic – 236Other – 7None/Unknown - 6
Protestant – 145Catholic – 211Other – 2None/Unknown - 8
Protestant – 154Catholic – 195Other – 6None/Unknown - 16
Other meaningful sub-group e.g. Deprivation Level
None None None None None
Note: These figures are based on initial admissions into the JJC i.e. new admissions excluding internal changes of status such as PACE to remand. The section 75 information is self-reported by the individual young person on admission and therefore may be misrepresentative.
Significant changes that have occurred over the above reporting period:Since November 2012 legislation was put in place that all 17 year old offenders are admitted to Woodlands Juvenile Justice Centre rather than Hydebank Wood Young Offenders Centre.
197

Table H6.10. Number of persons under 18 years of age convicted of an offence, number sentenced to immediate custody and the average sentence length in months; in Northern Ireland, 2005-2009.
Source: DOJ sentencing data sets. Data included are for those sentenced to custody probation, Juvenile Justice Centre or Young Offender Centre, age 10 to 17 at the time of conviction.
Year 2005 2006 2007 2008 2009
Total number of persons age 10-17 convicted in court 1,455 1,273 1,222 1,487 1,205
Total Number of persons age 10-17 sentenced to immediate custody 144 89 118 111 90
Average sentence length 6 months 6 months 5 months 5 months 6 months
Significant changes that have occurred over the above reporting period: From 2005 to 2006, data came from the PSNI’s Integrated Crime Information System (ICIS). From 2007 to 2009 data came reported here are based on data from the Criminal Records Viewer (CRV). As data for 2005/06 are not from the same source as 2007-09 they should not be directly compared.
Note: Data is provided on offenders aged 10 to 17 convicted in court and is based on the principal offence rule: Only the most serious offence for which an offender is convicted is included.
The average number of months is based on where the custodial sentence value was known. In 2009 one person received a life sentence, and datasets do not specify the tariff set.
198


![Plasmodium—a brief introduction to the parasites causing ......phylogenetically very close to P. vivax and P. malariae, respectively [30]. Malaria and Plasmodium biology Life cycle](https://img.dokumen.tips/doc/110x75/610eb1edfcd97e3d9b5ded0b/plasmodiumaa-brief-introduction-to-the-parasites-causing-phylogenetically.jpg)