Embed Size (px)
Citation preview

Lean Design Research

About DialexaWe are not in the business of normal. Dialexa
is the only technology product development
company with the competence and vision to
help you launch any product, on any
platform, from idea to execution. No matter
how difficult the problem, no matter how
uncharted the waters, we will work alongside
you to create products that users love.
From Idea to Execution - End-to-End Product Development
Innovation & Product Consulting
Design
Software Development
Hardware Engineering
Product Launch & Growth Hacking
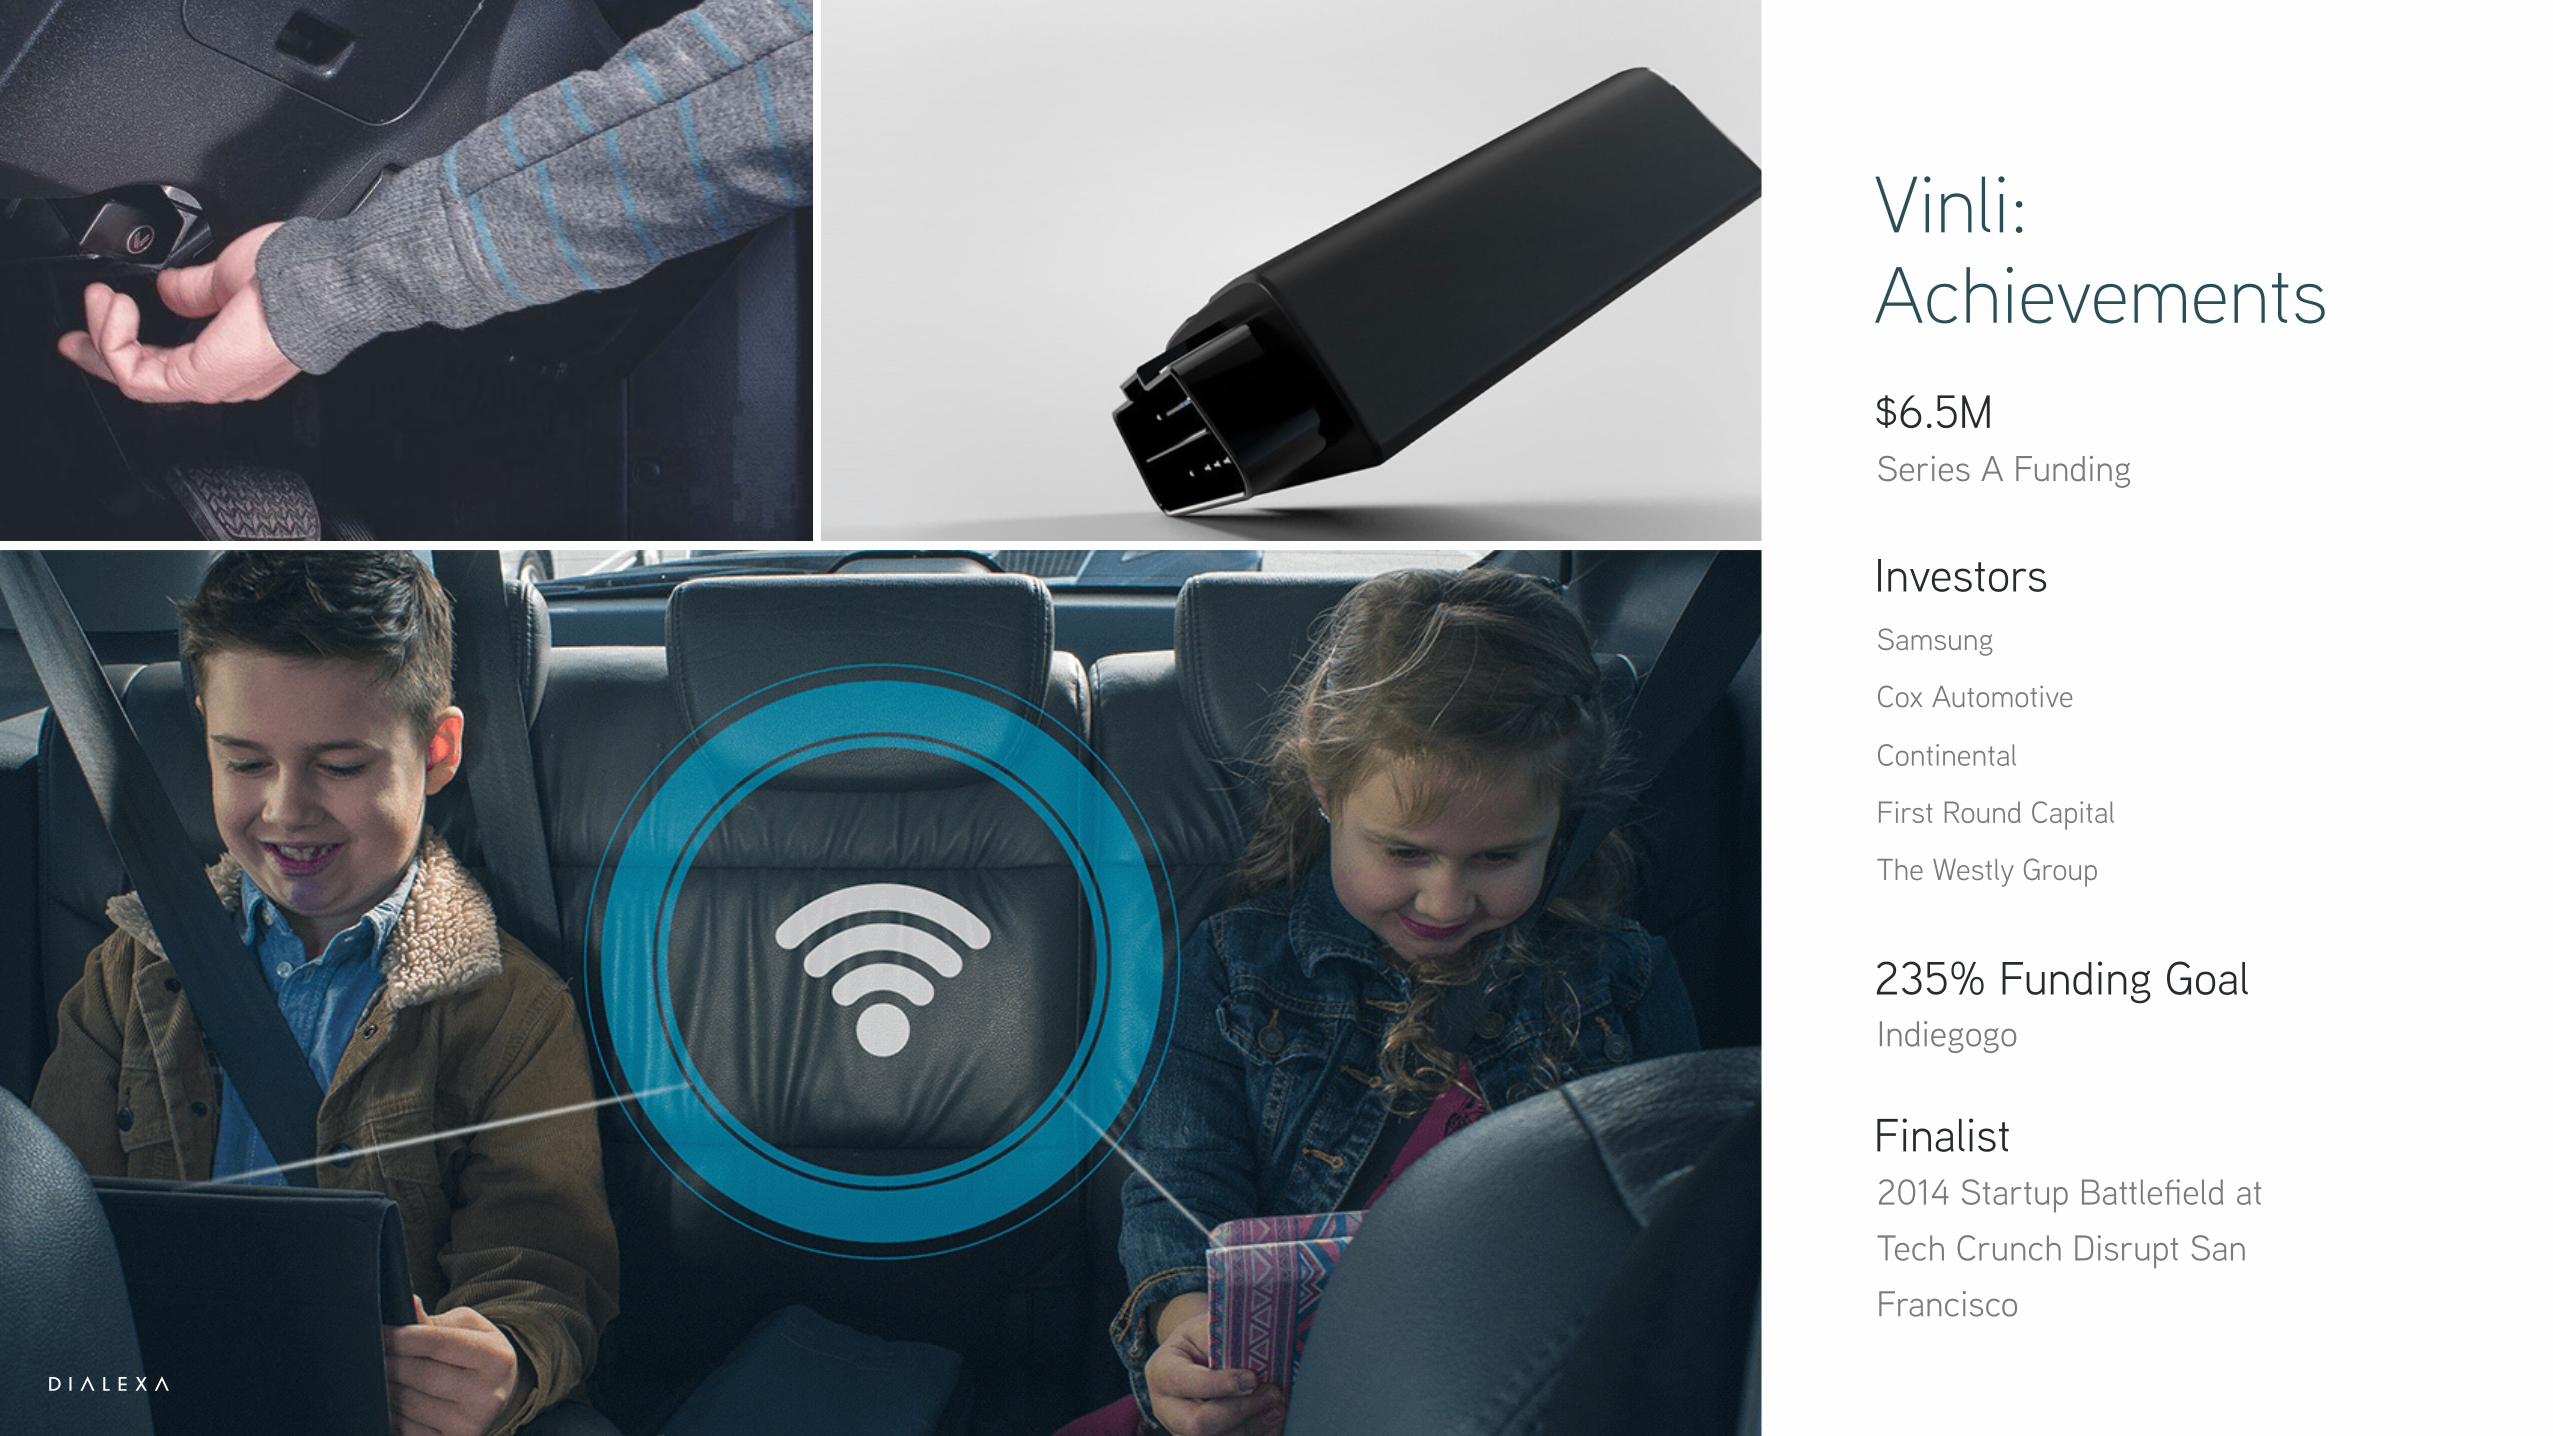
Vinli: Achievements
Finalist 2014 Startup Battlefield at Tech Crunch Disrupt San
Francisco
235% Funding GoalIndiegogo
Investors
Samsung
Cox Automotive
Continental
First Round Capital
The Westly Group
$6.5MSeries A Funding
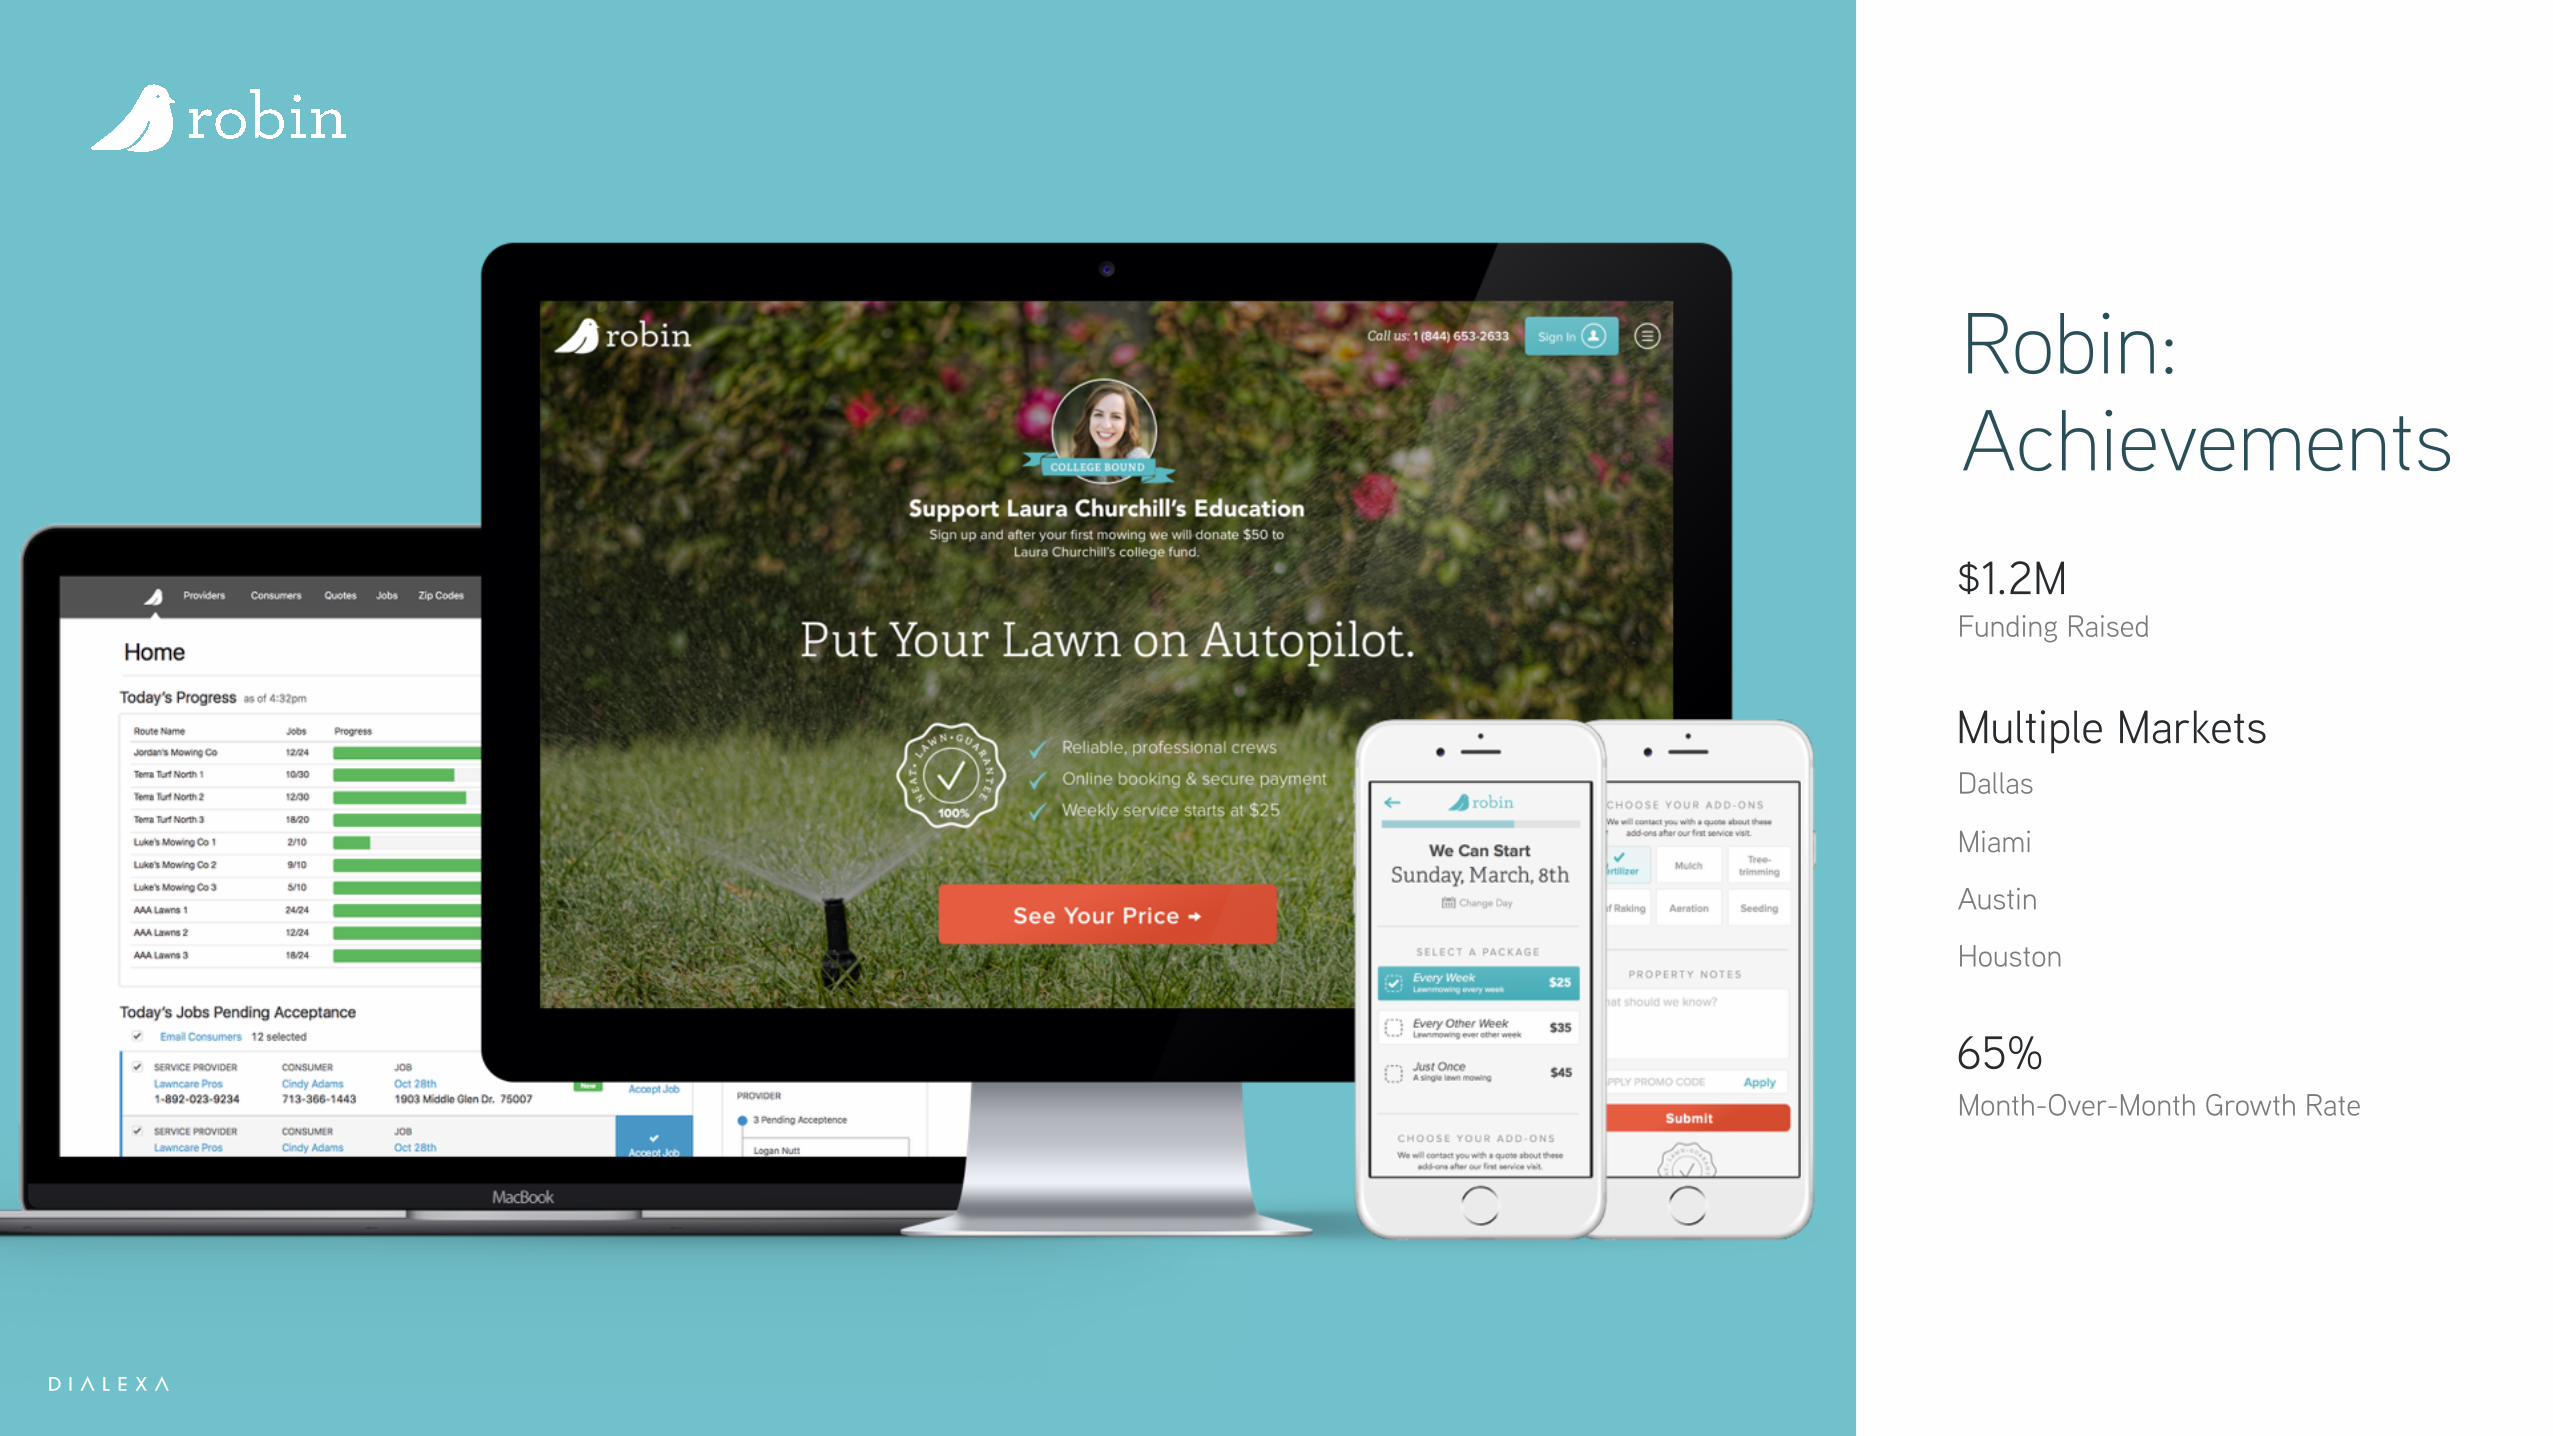
Robin:
Achievements
$1.2MFunding Raised
Multiple MarketsDallas
Miami
Austin
Houston
65% Month-Over-Month Growth Rate
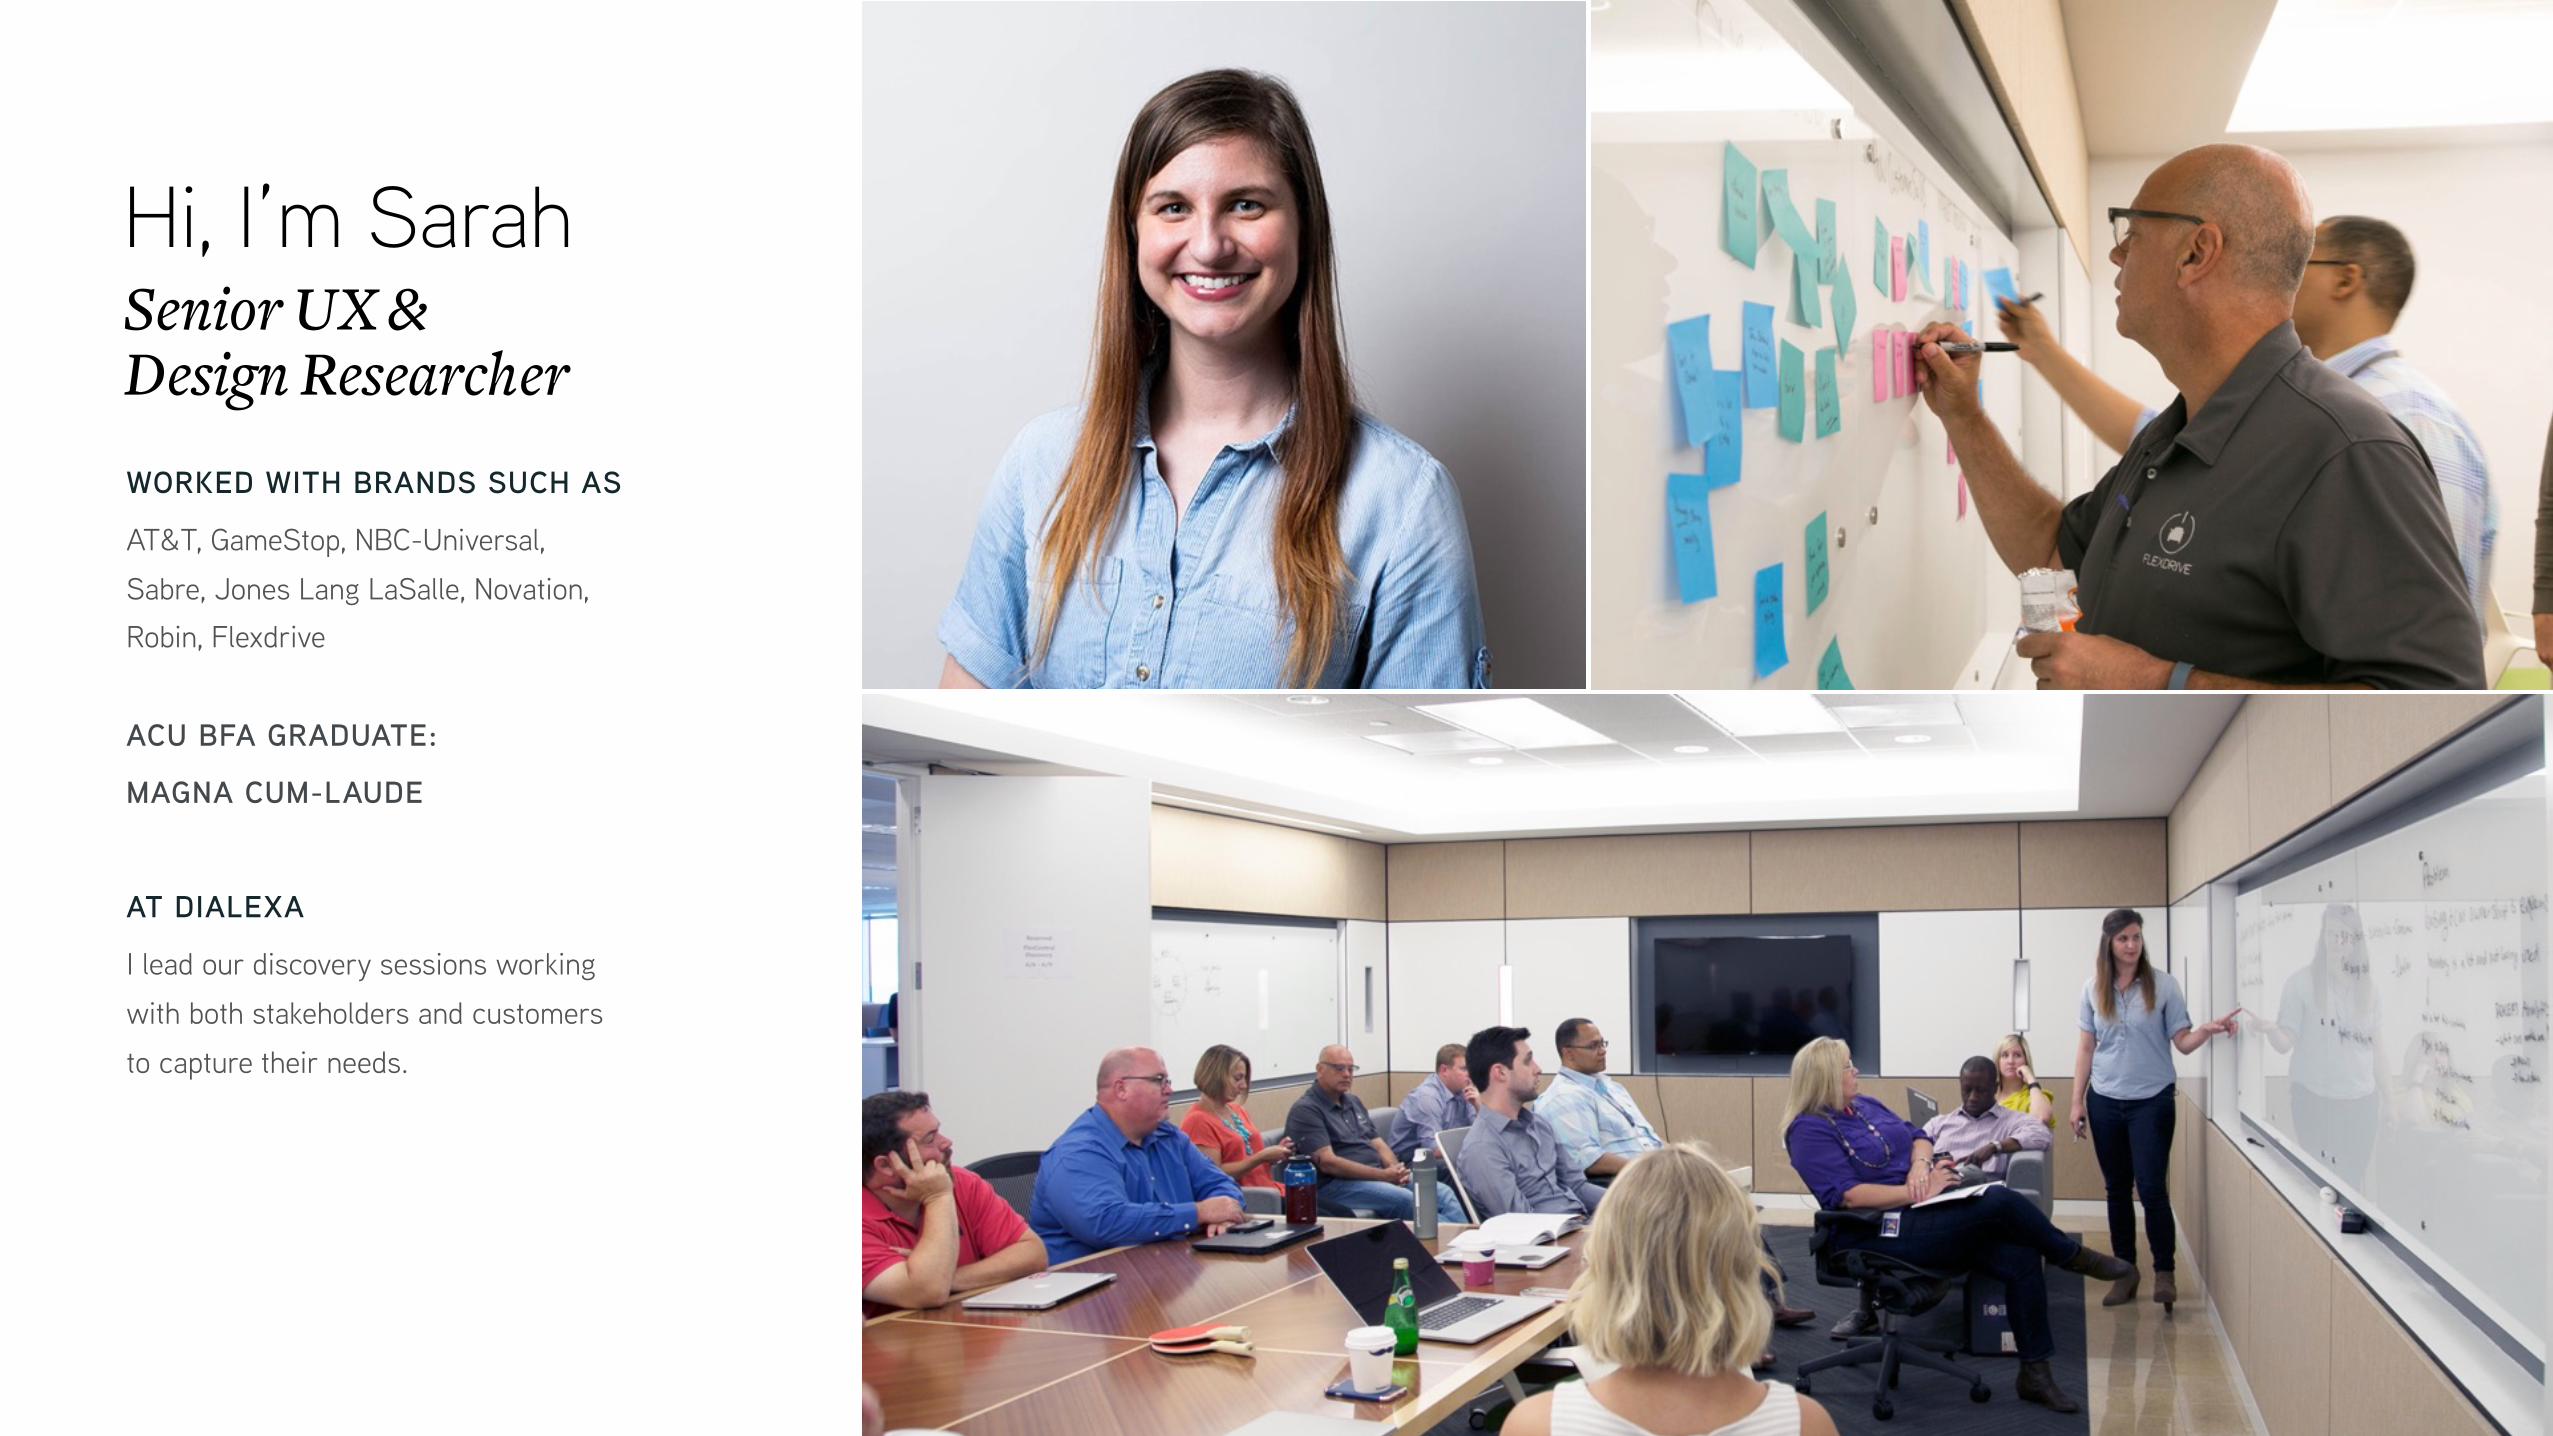
Hi, I’m Sarah Senior UX & Design Researcher
WORKED WITH BRANDS SUCH AS
AT&T, GameStop, NBC-Universal,
Sabre, Jones Lang LaSalle, Novation,
Robin, Flexdrive
ACU BFA GRADUATE:
MAGNA CUM-LAUDE
AT DIALEXA
I lead our discovery sessions working
with both stakeholders and customers
to capture their needs.

Design ResearchA brief overview

Ethnographyinvestigates not only what consumers say they do, but what they actually do.
Place Picture Here
- Ethnography in The Field of Design by Christina Wasson
Design Thinkinggetting beyond the assumptions that block effective solutions.-IDEO & ACCUMEN Human Centered Design Course

Take this with youBut wait it’s dangerous out there
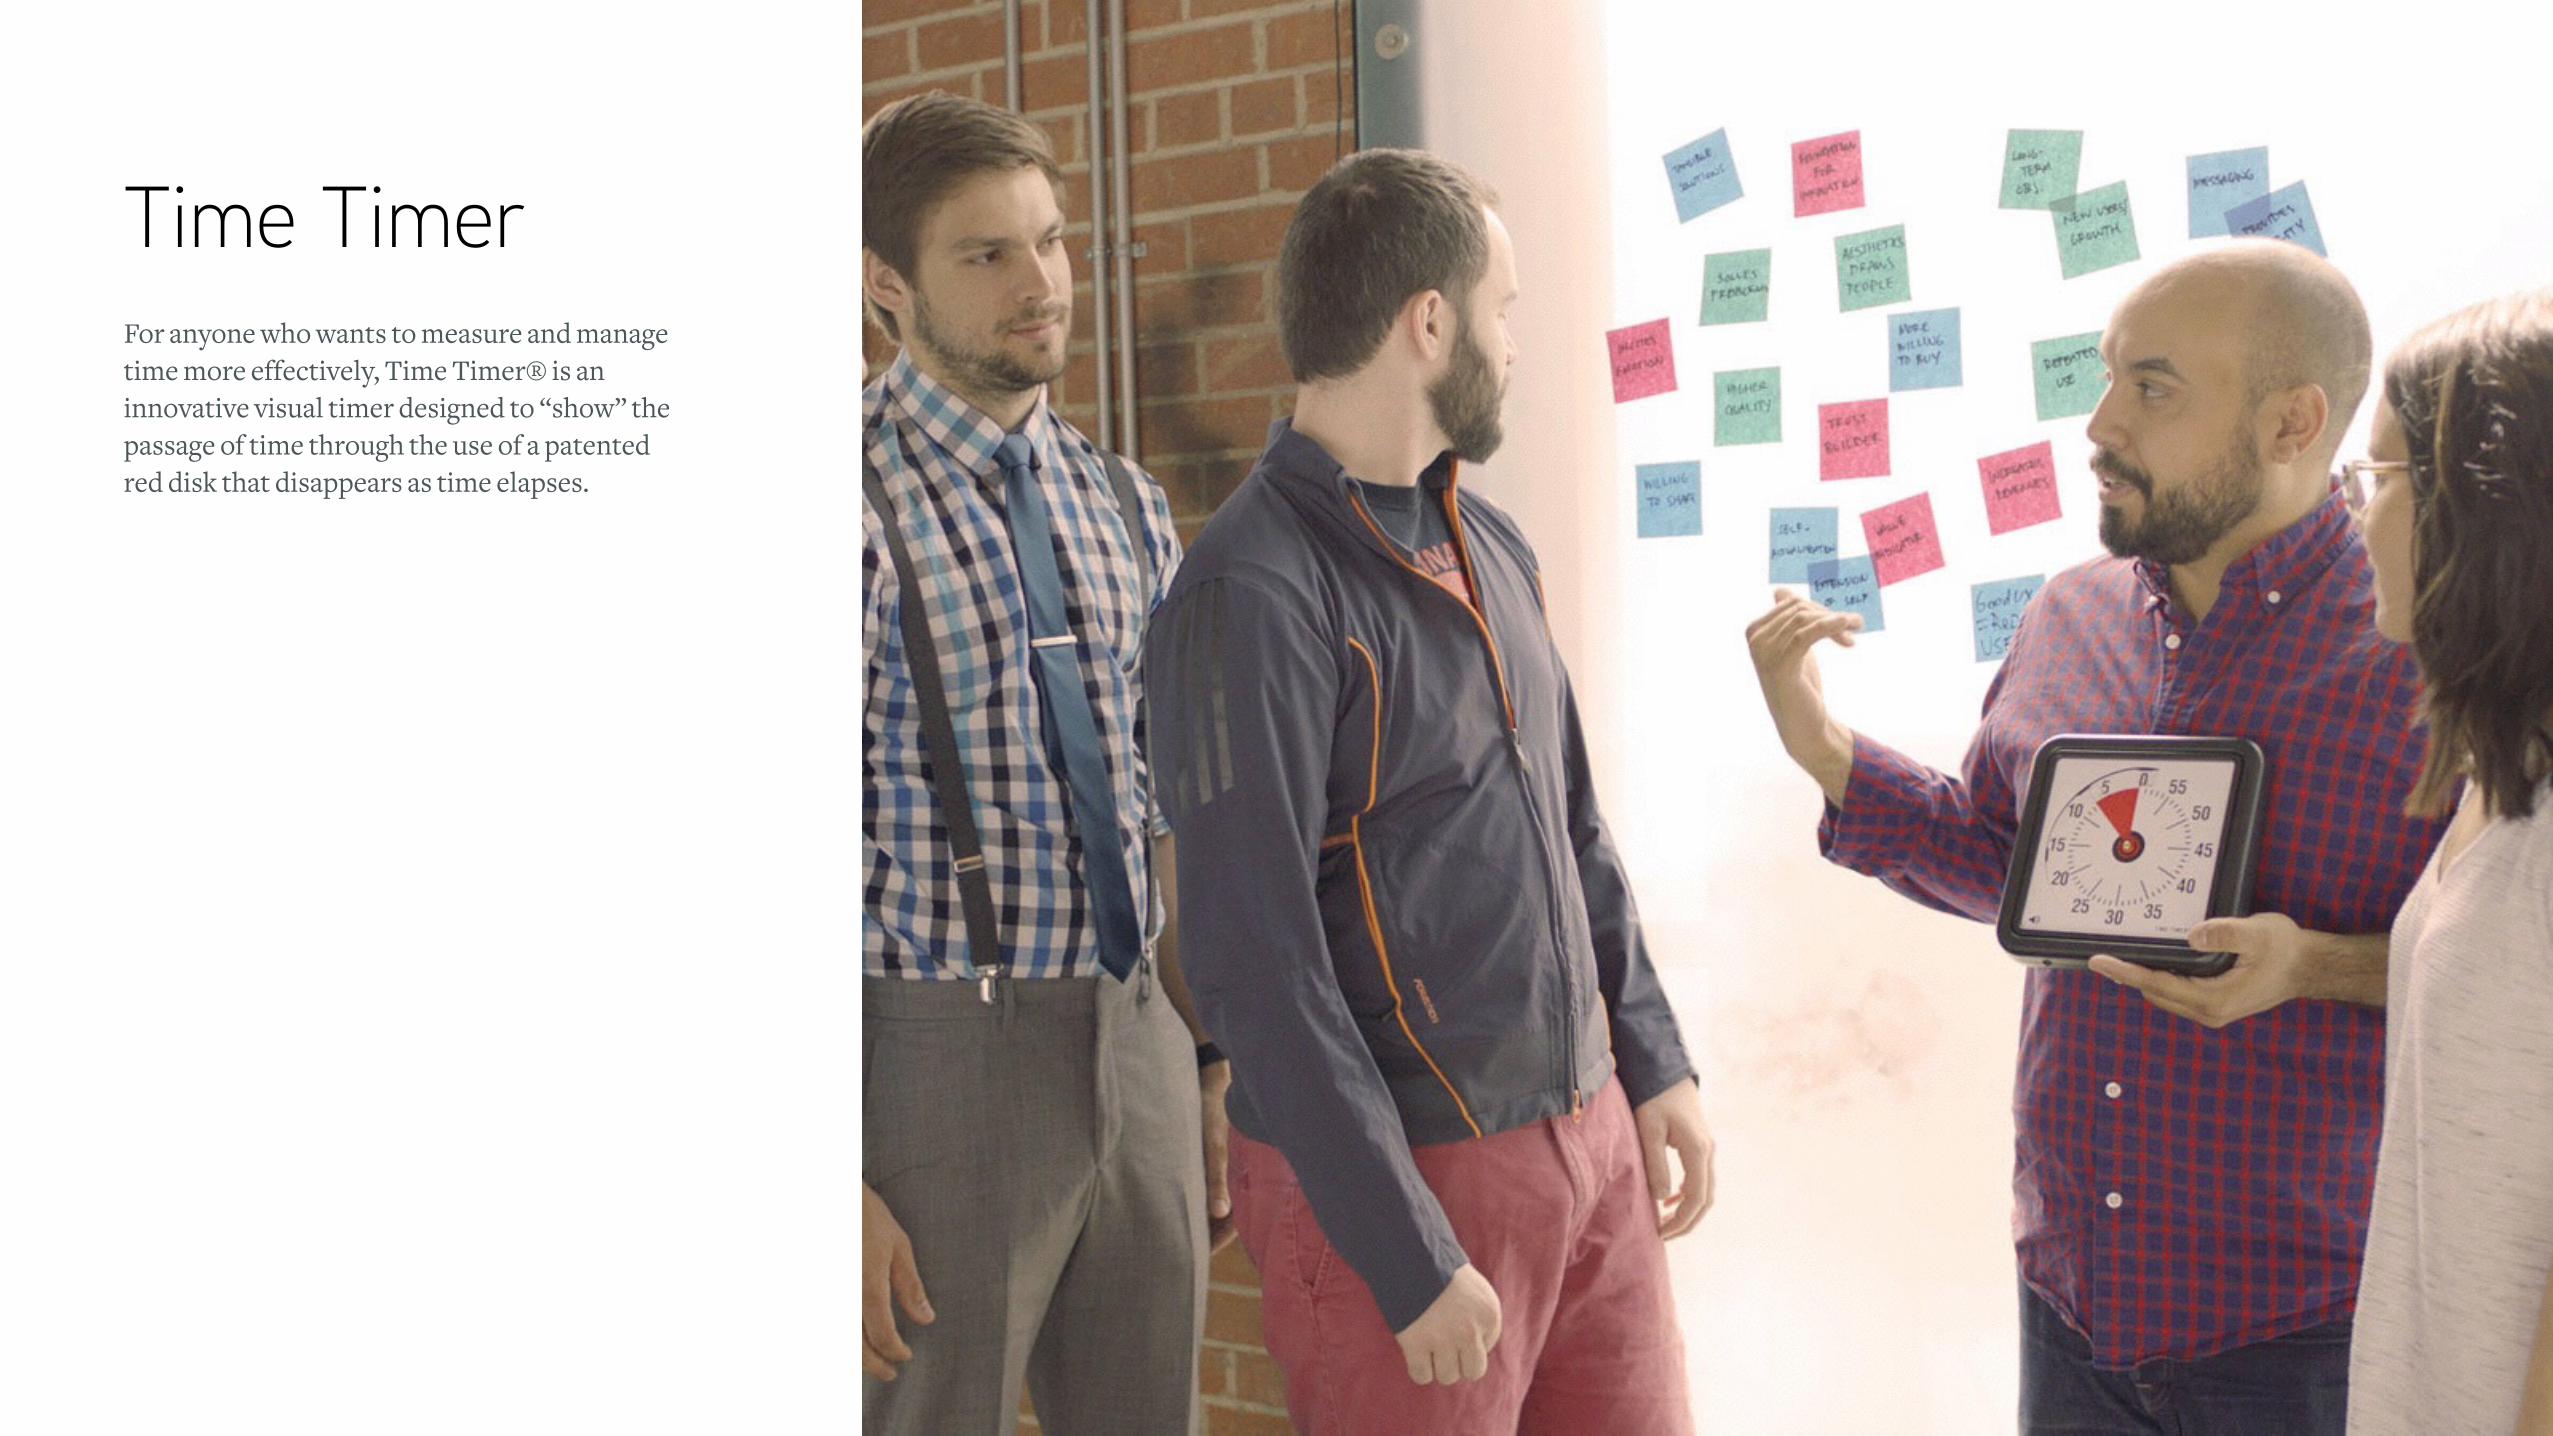
Time TimerFor anyone who wants to measure and manage time more effectively, Time Timer® is an innovative visual timer designed to “show” the passage of time through the use of a patented red disk that disappears as time elapses.
Place Picture Here
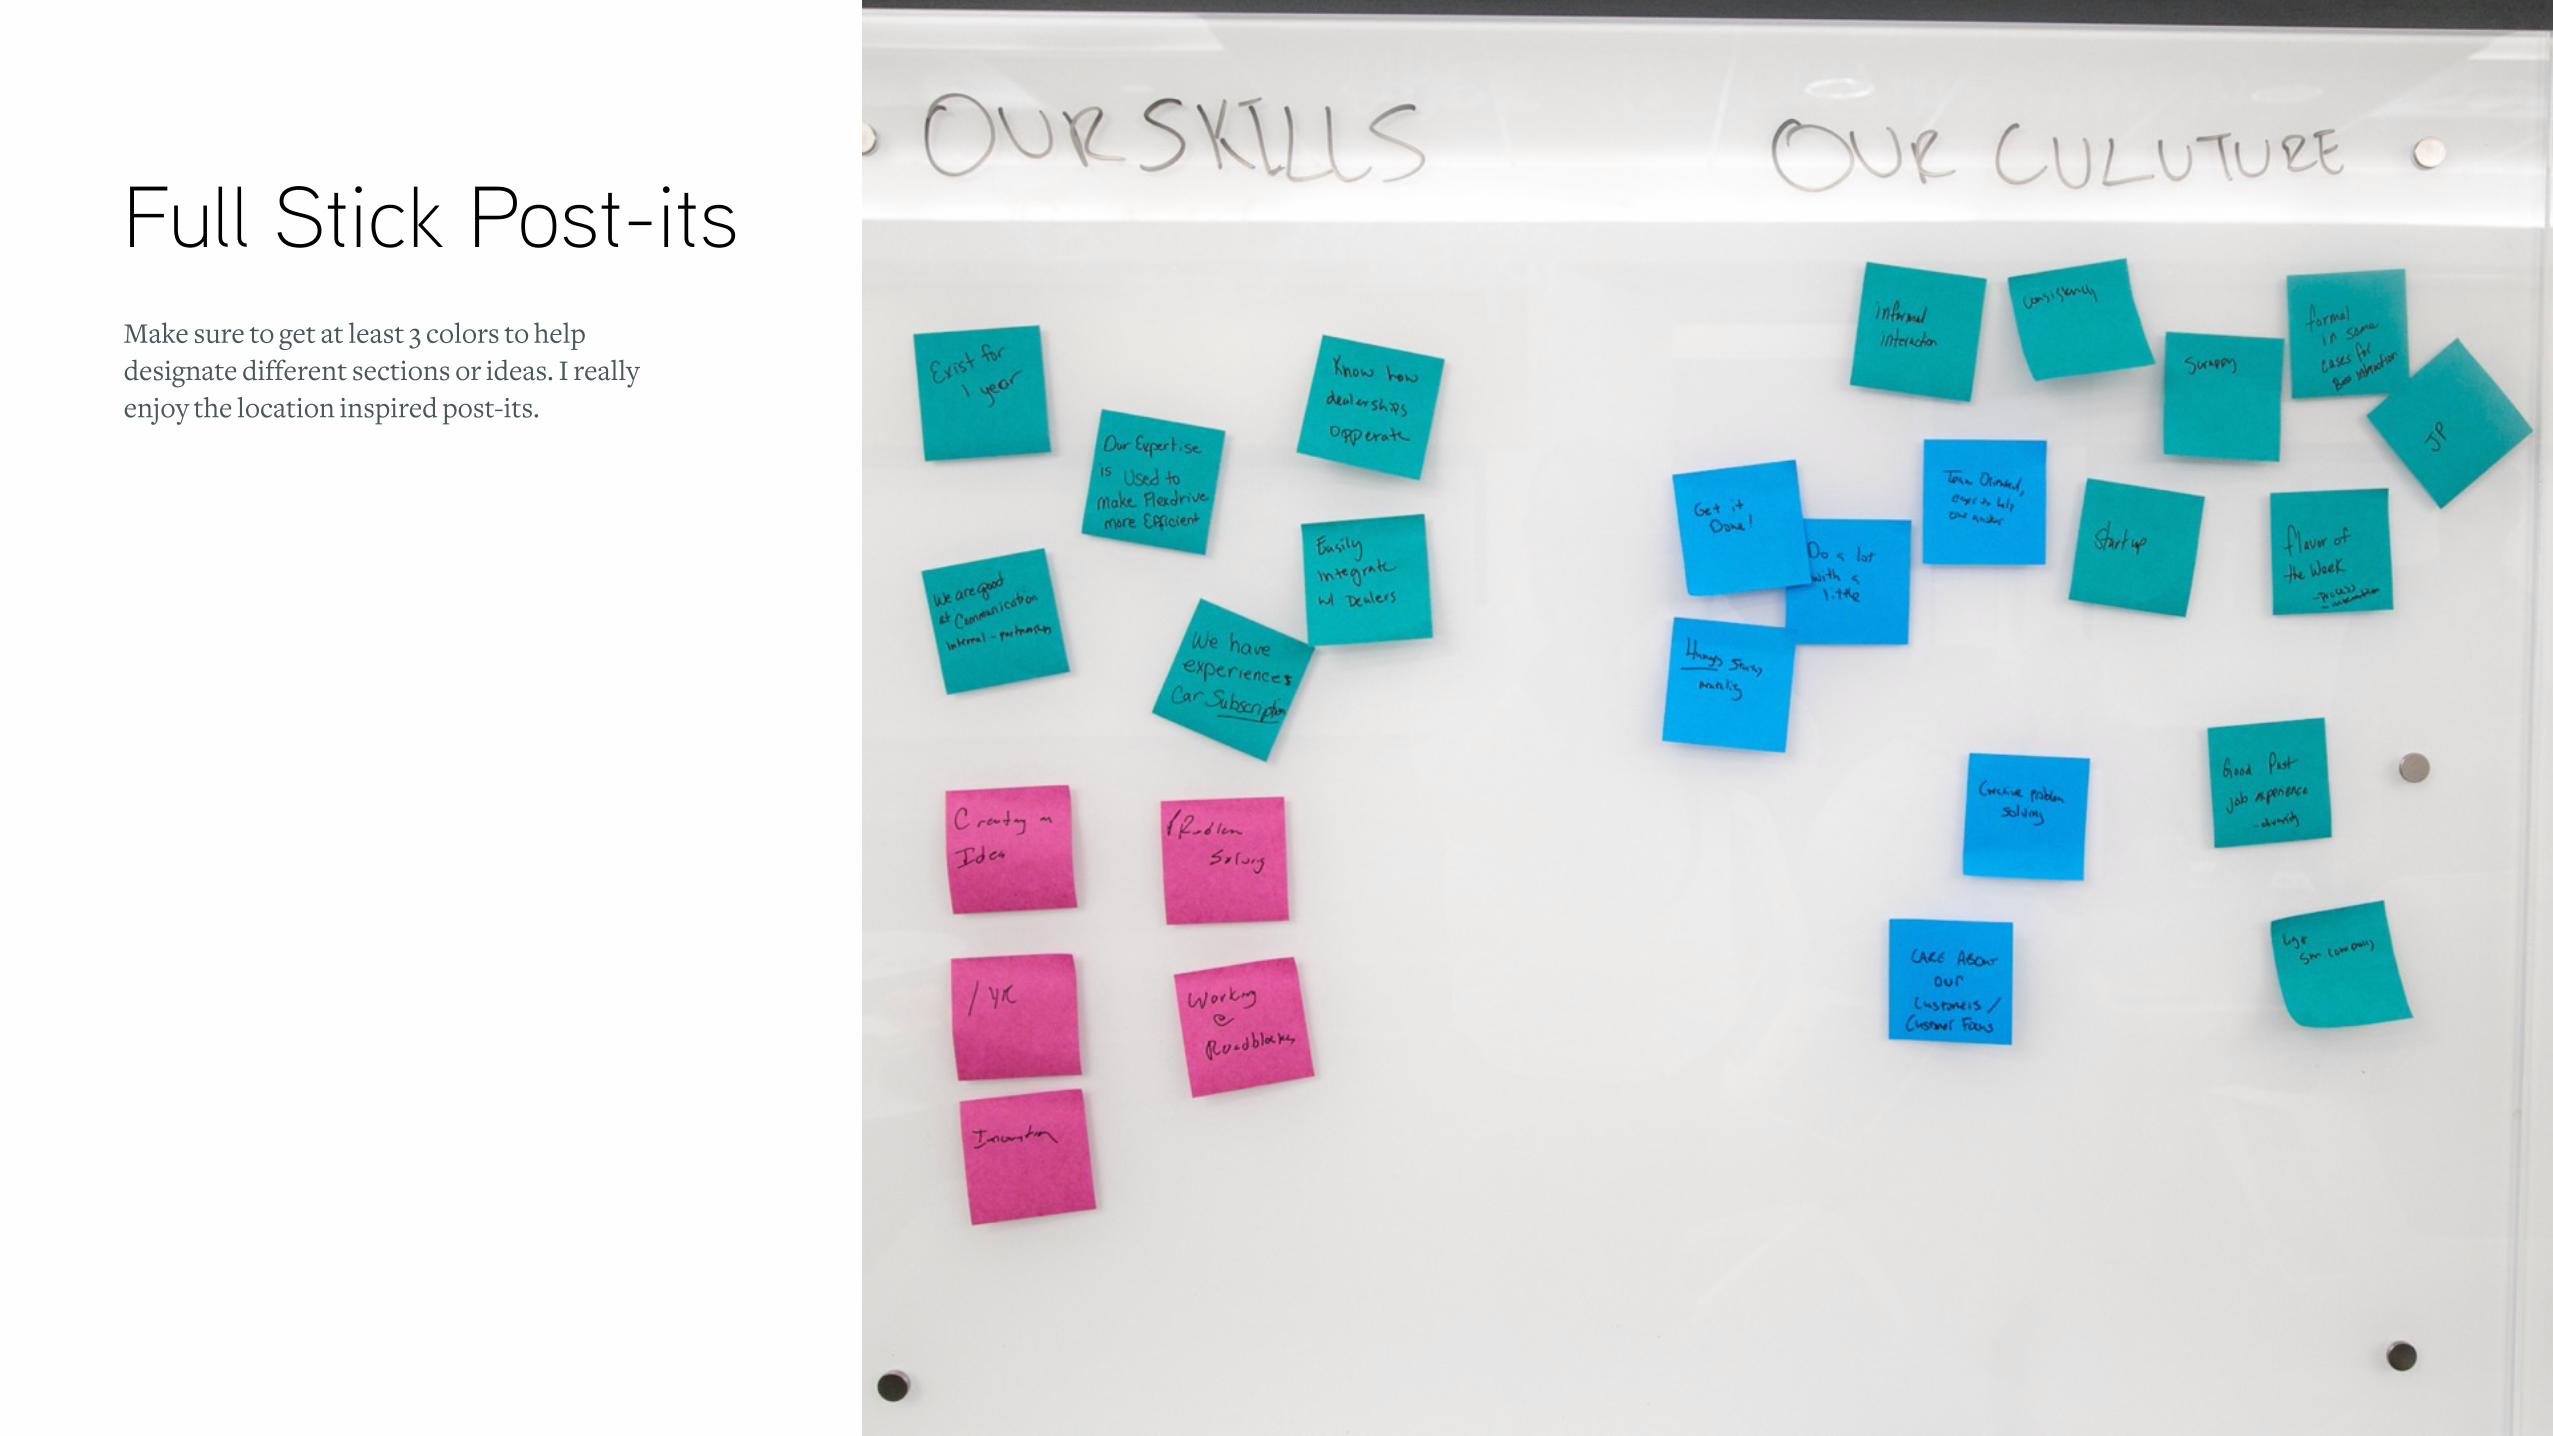
Full Stick Post-its
Place Picture Here
Make sure to get at least 3 colors to help designate different sections or ideas. I really enjoy the location inspired post-its.
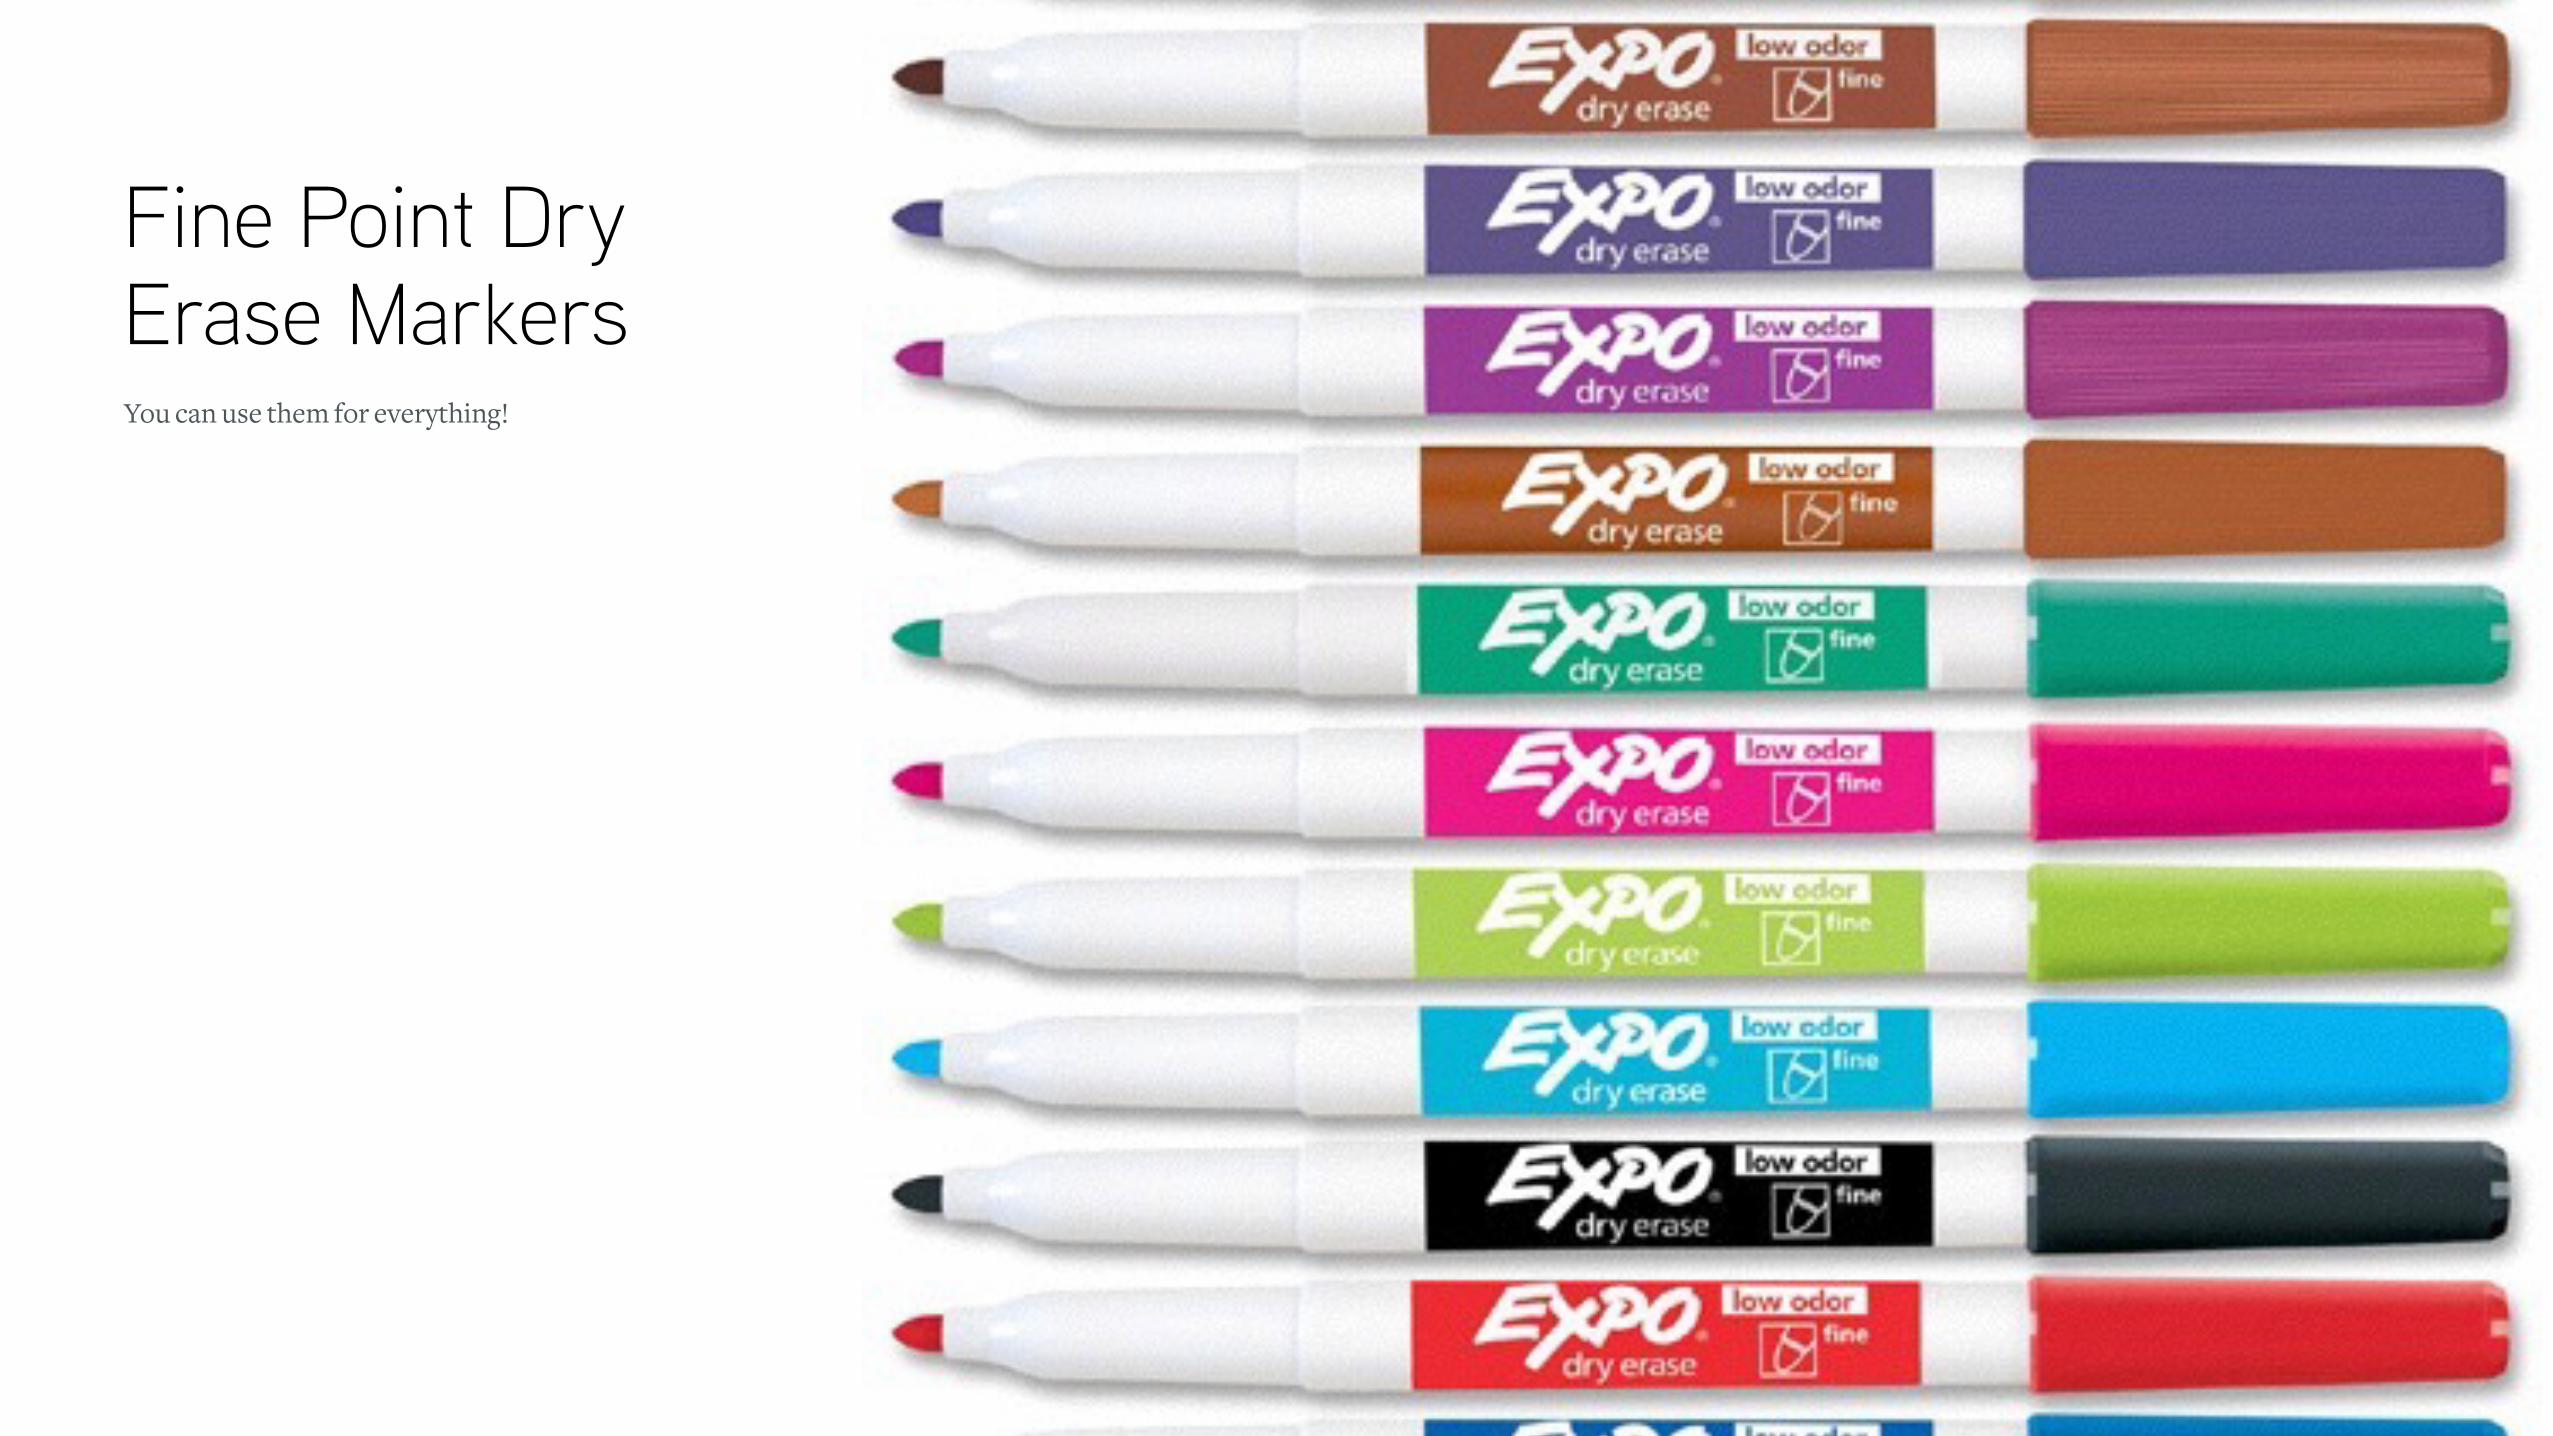
Fine Point Dry Erase MarkersYou can use them for everything!
Place Picture Here
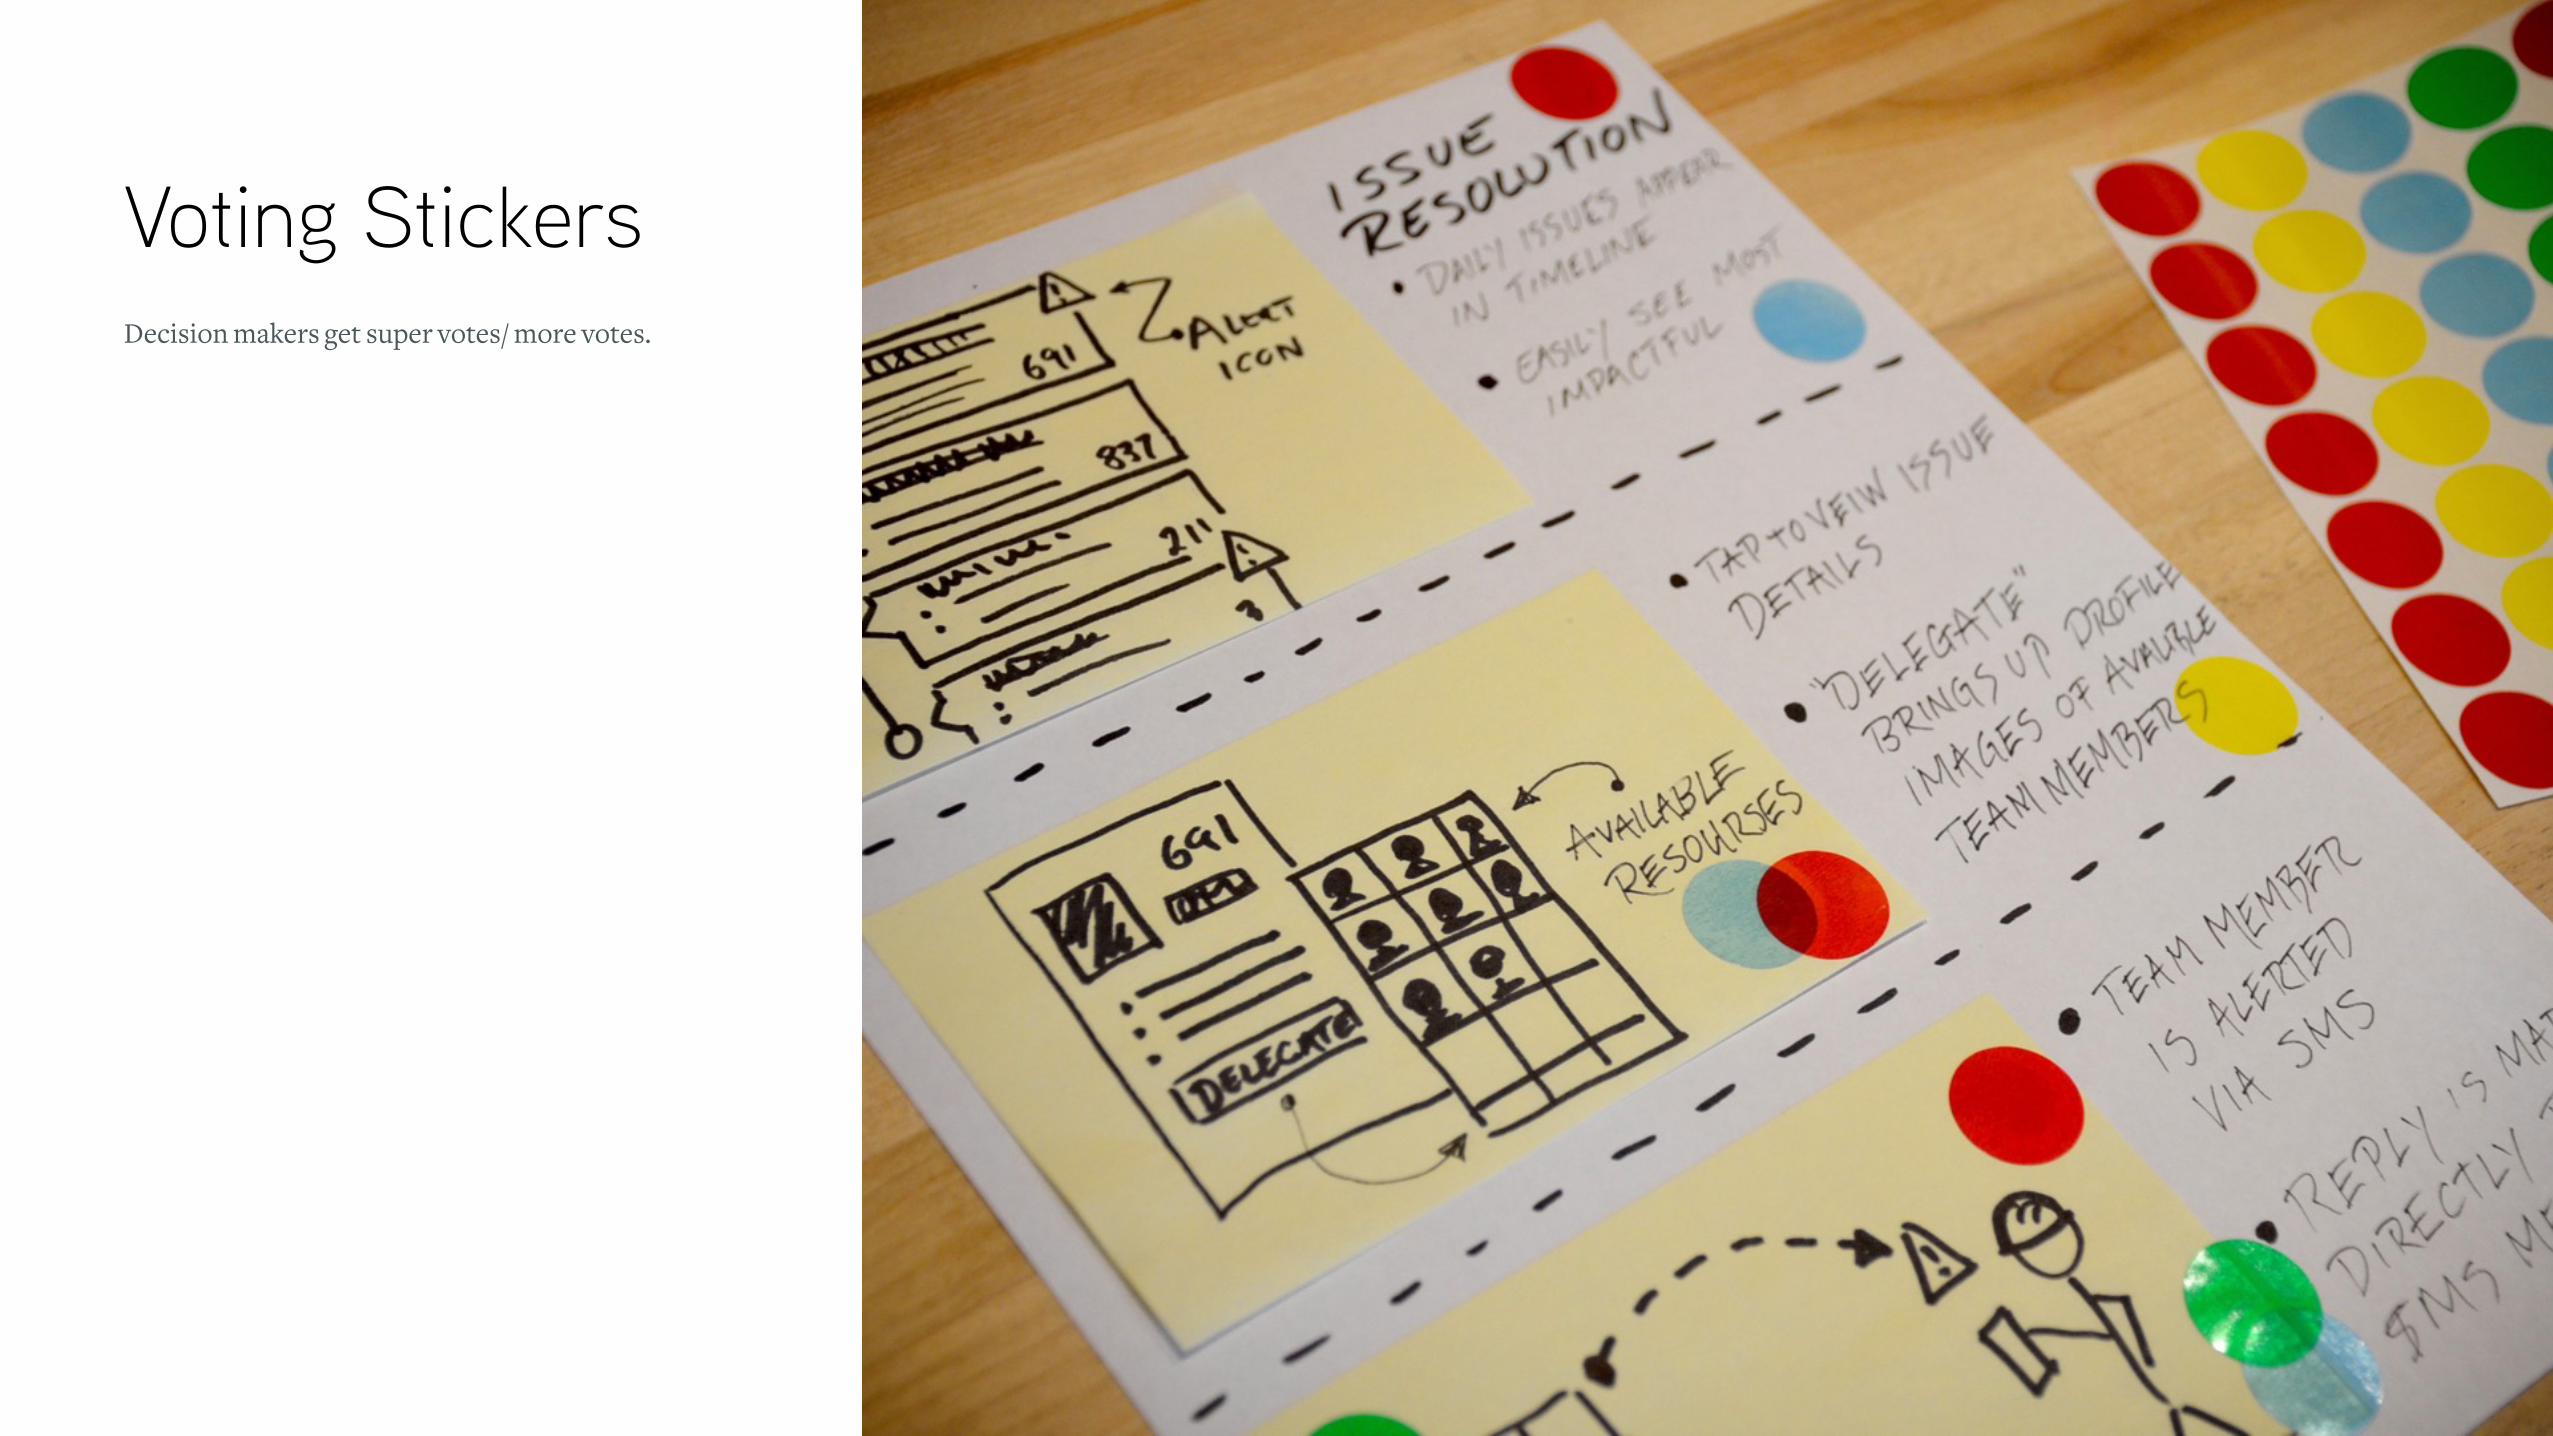
Voting Stickers
Place Picture Here
Decision makers get super votes/ more votes.

Snacks
Place Picture Here
I’ve made people miss the food trucks, the snacks kept them from revolting against me.
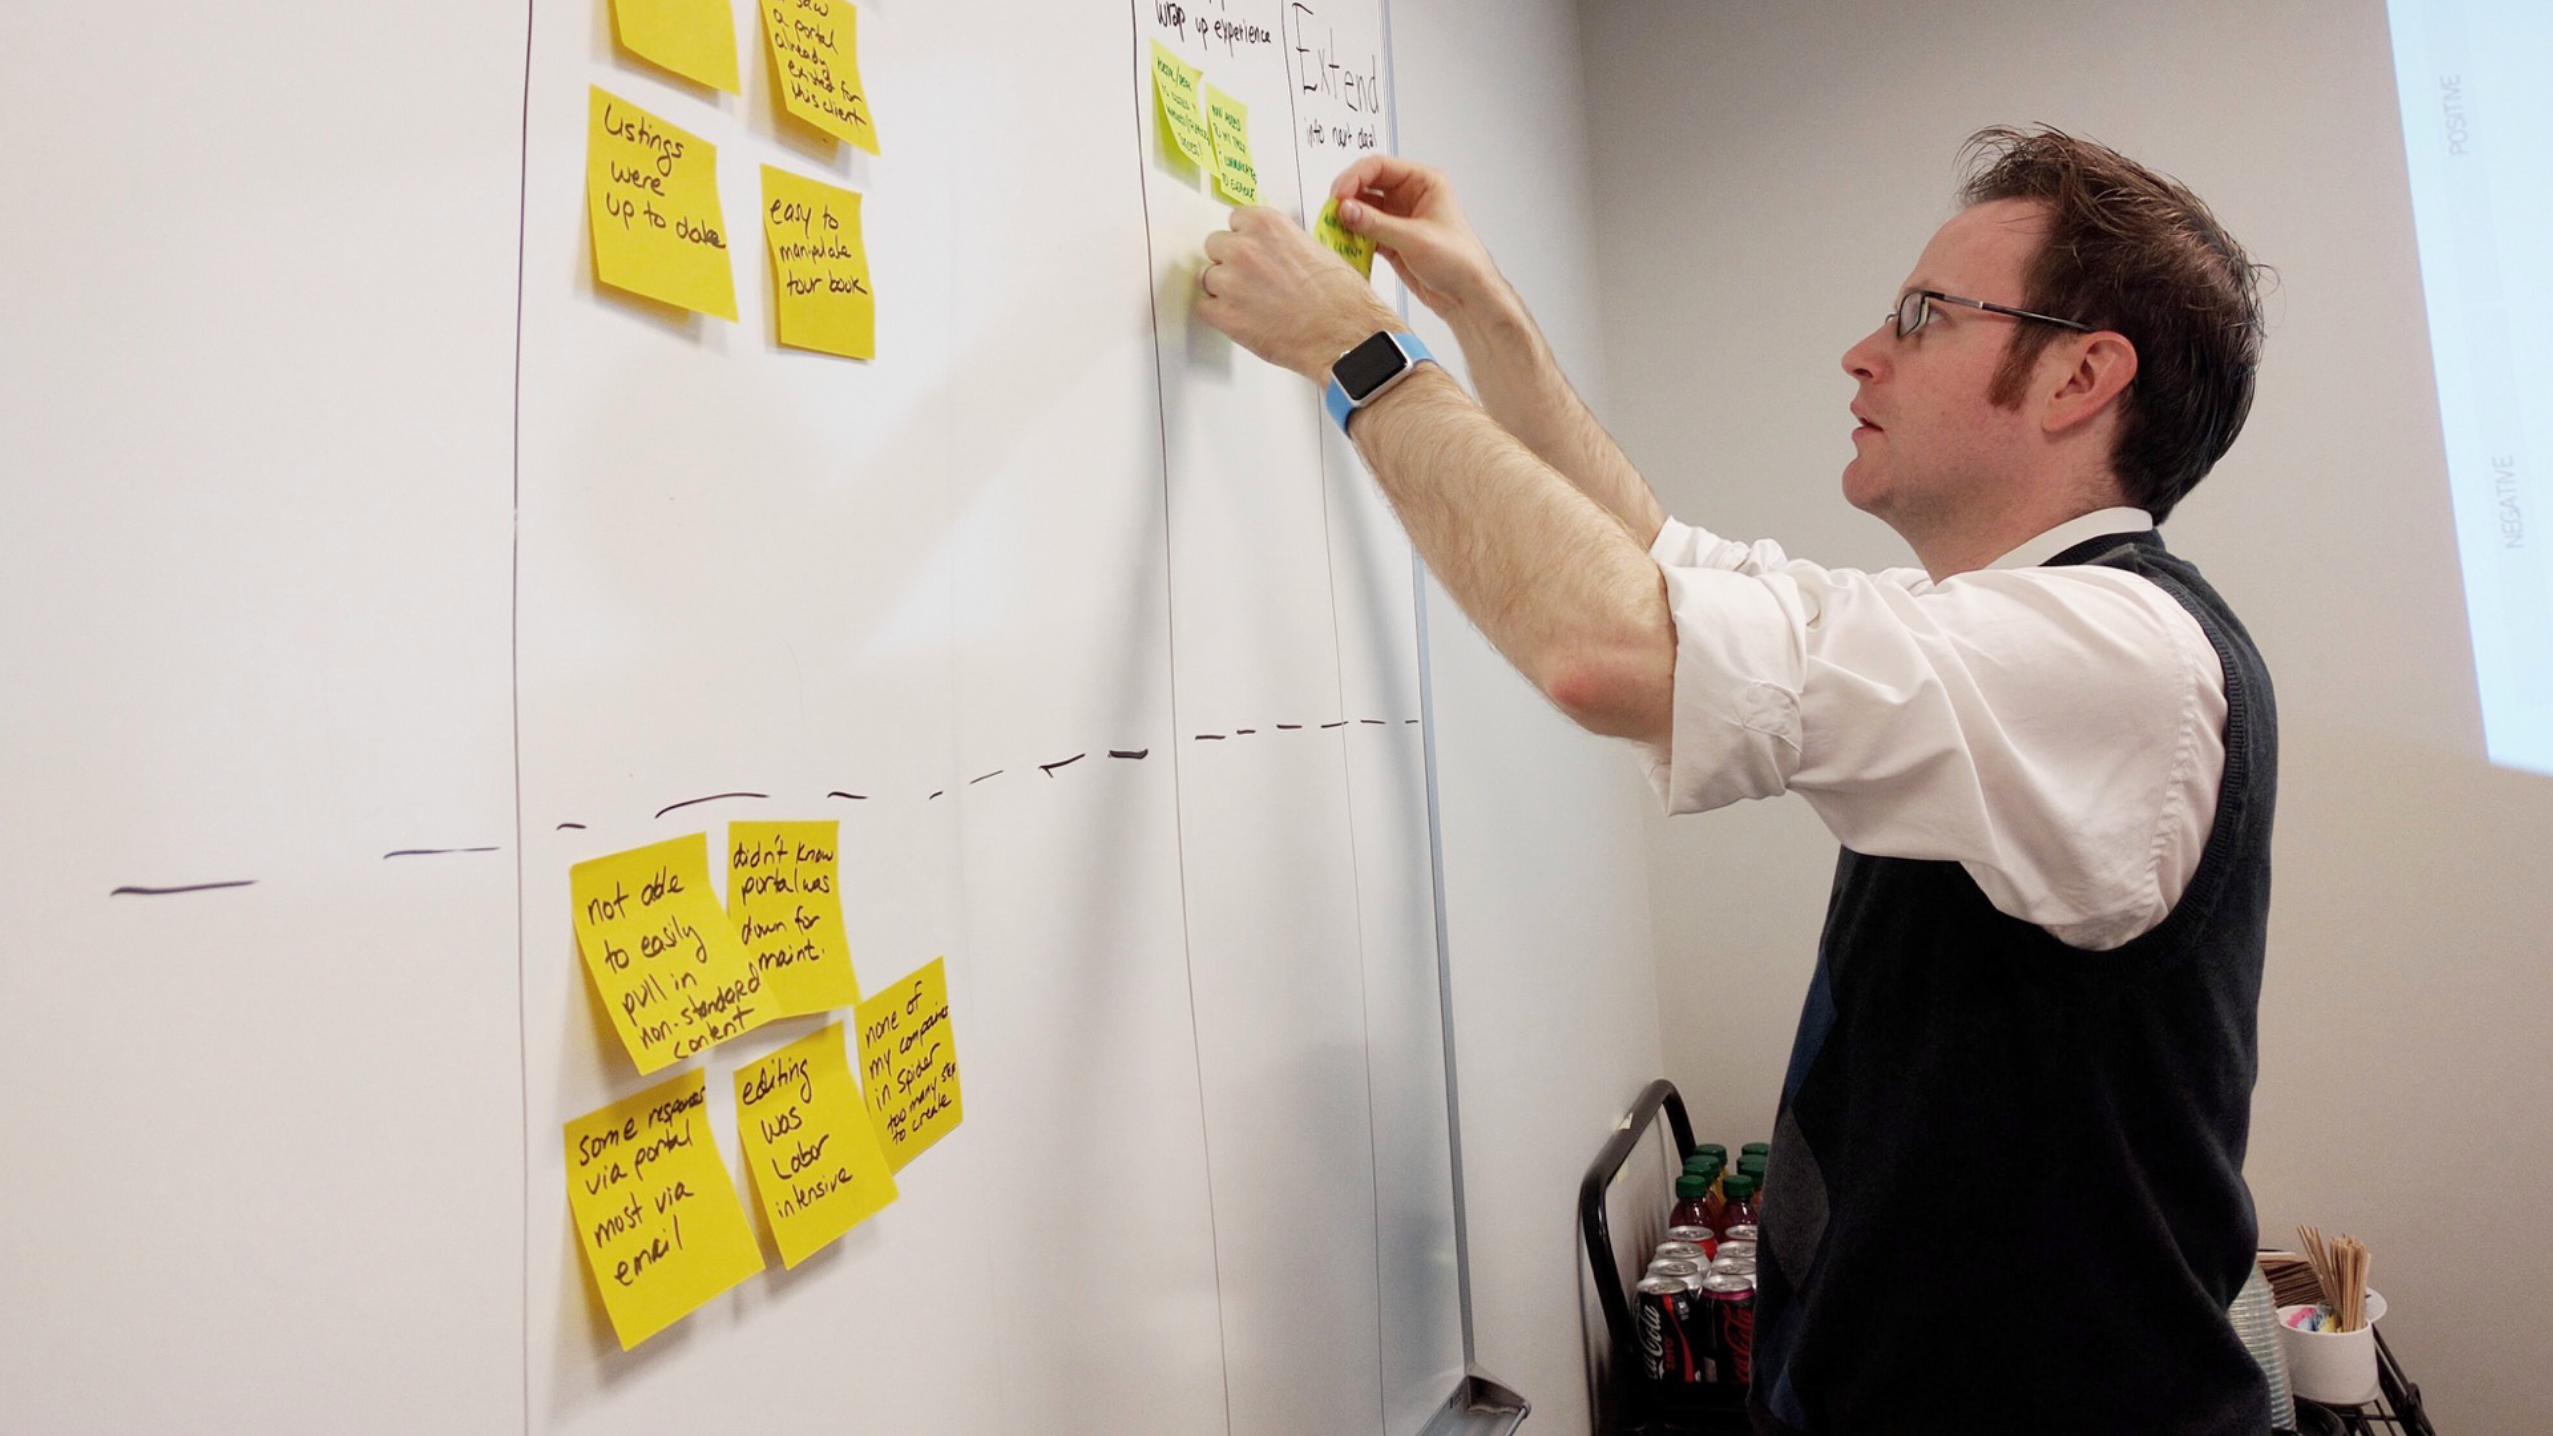
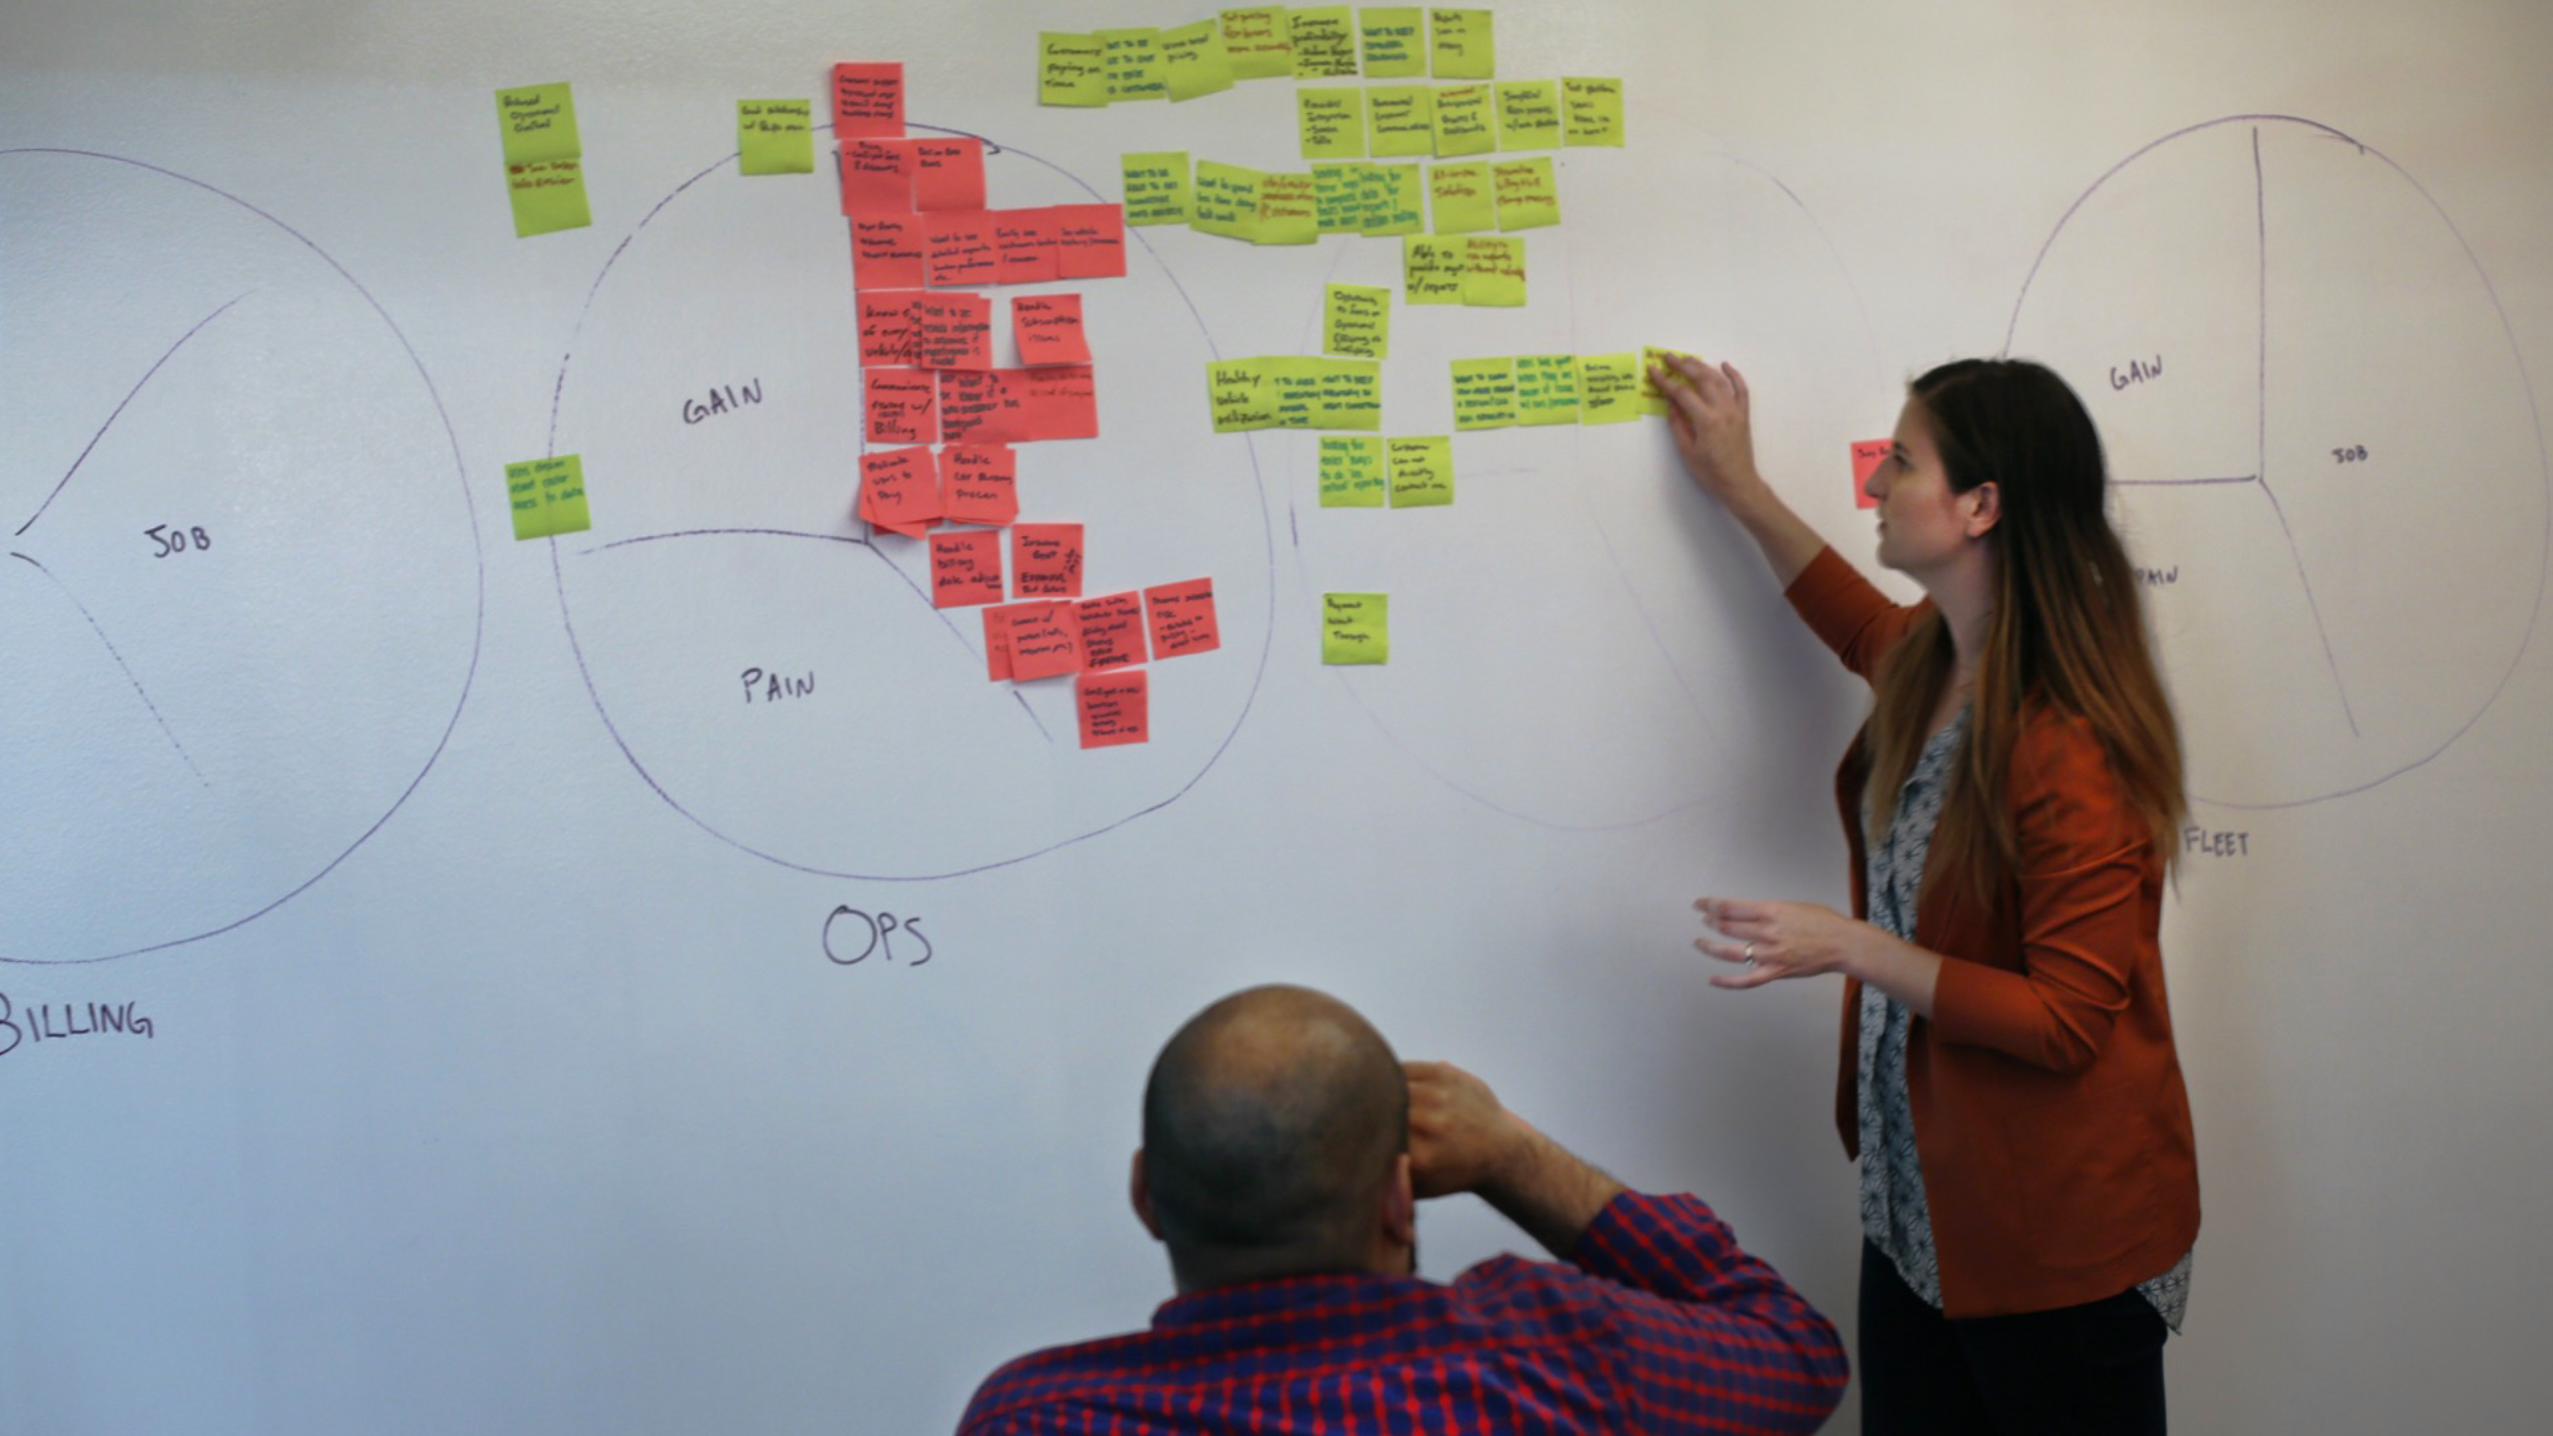
Tools & Methods to Start WithDiscovery / Kick Off
Stakeholder & Customer InterviewsTalk to people

Place Picture Here
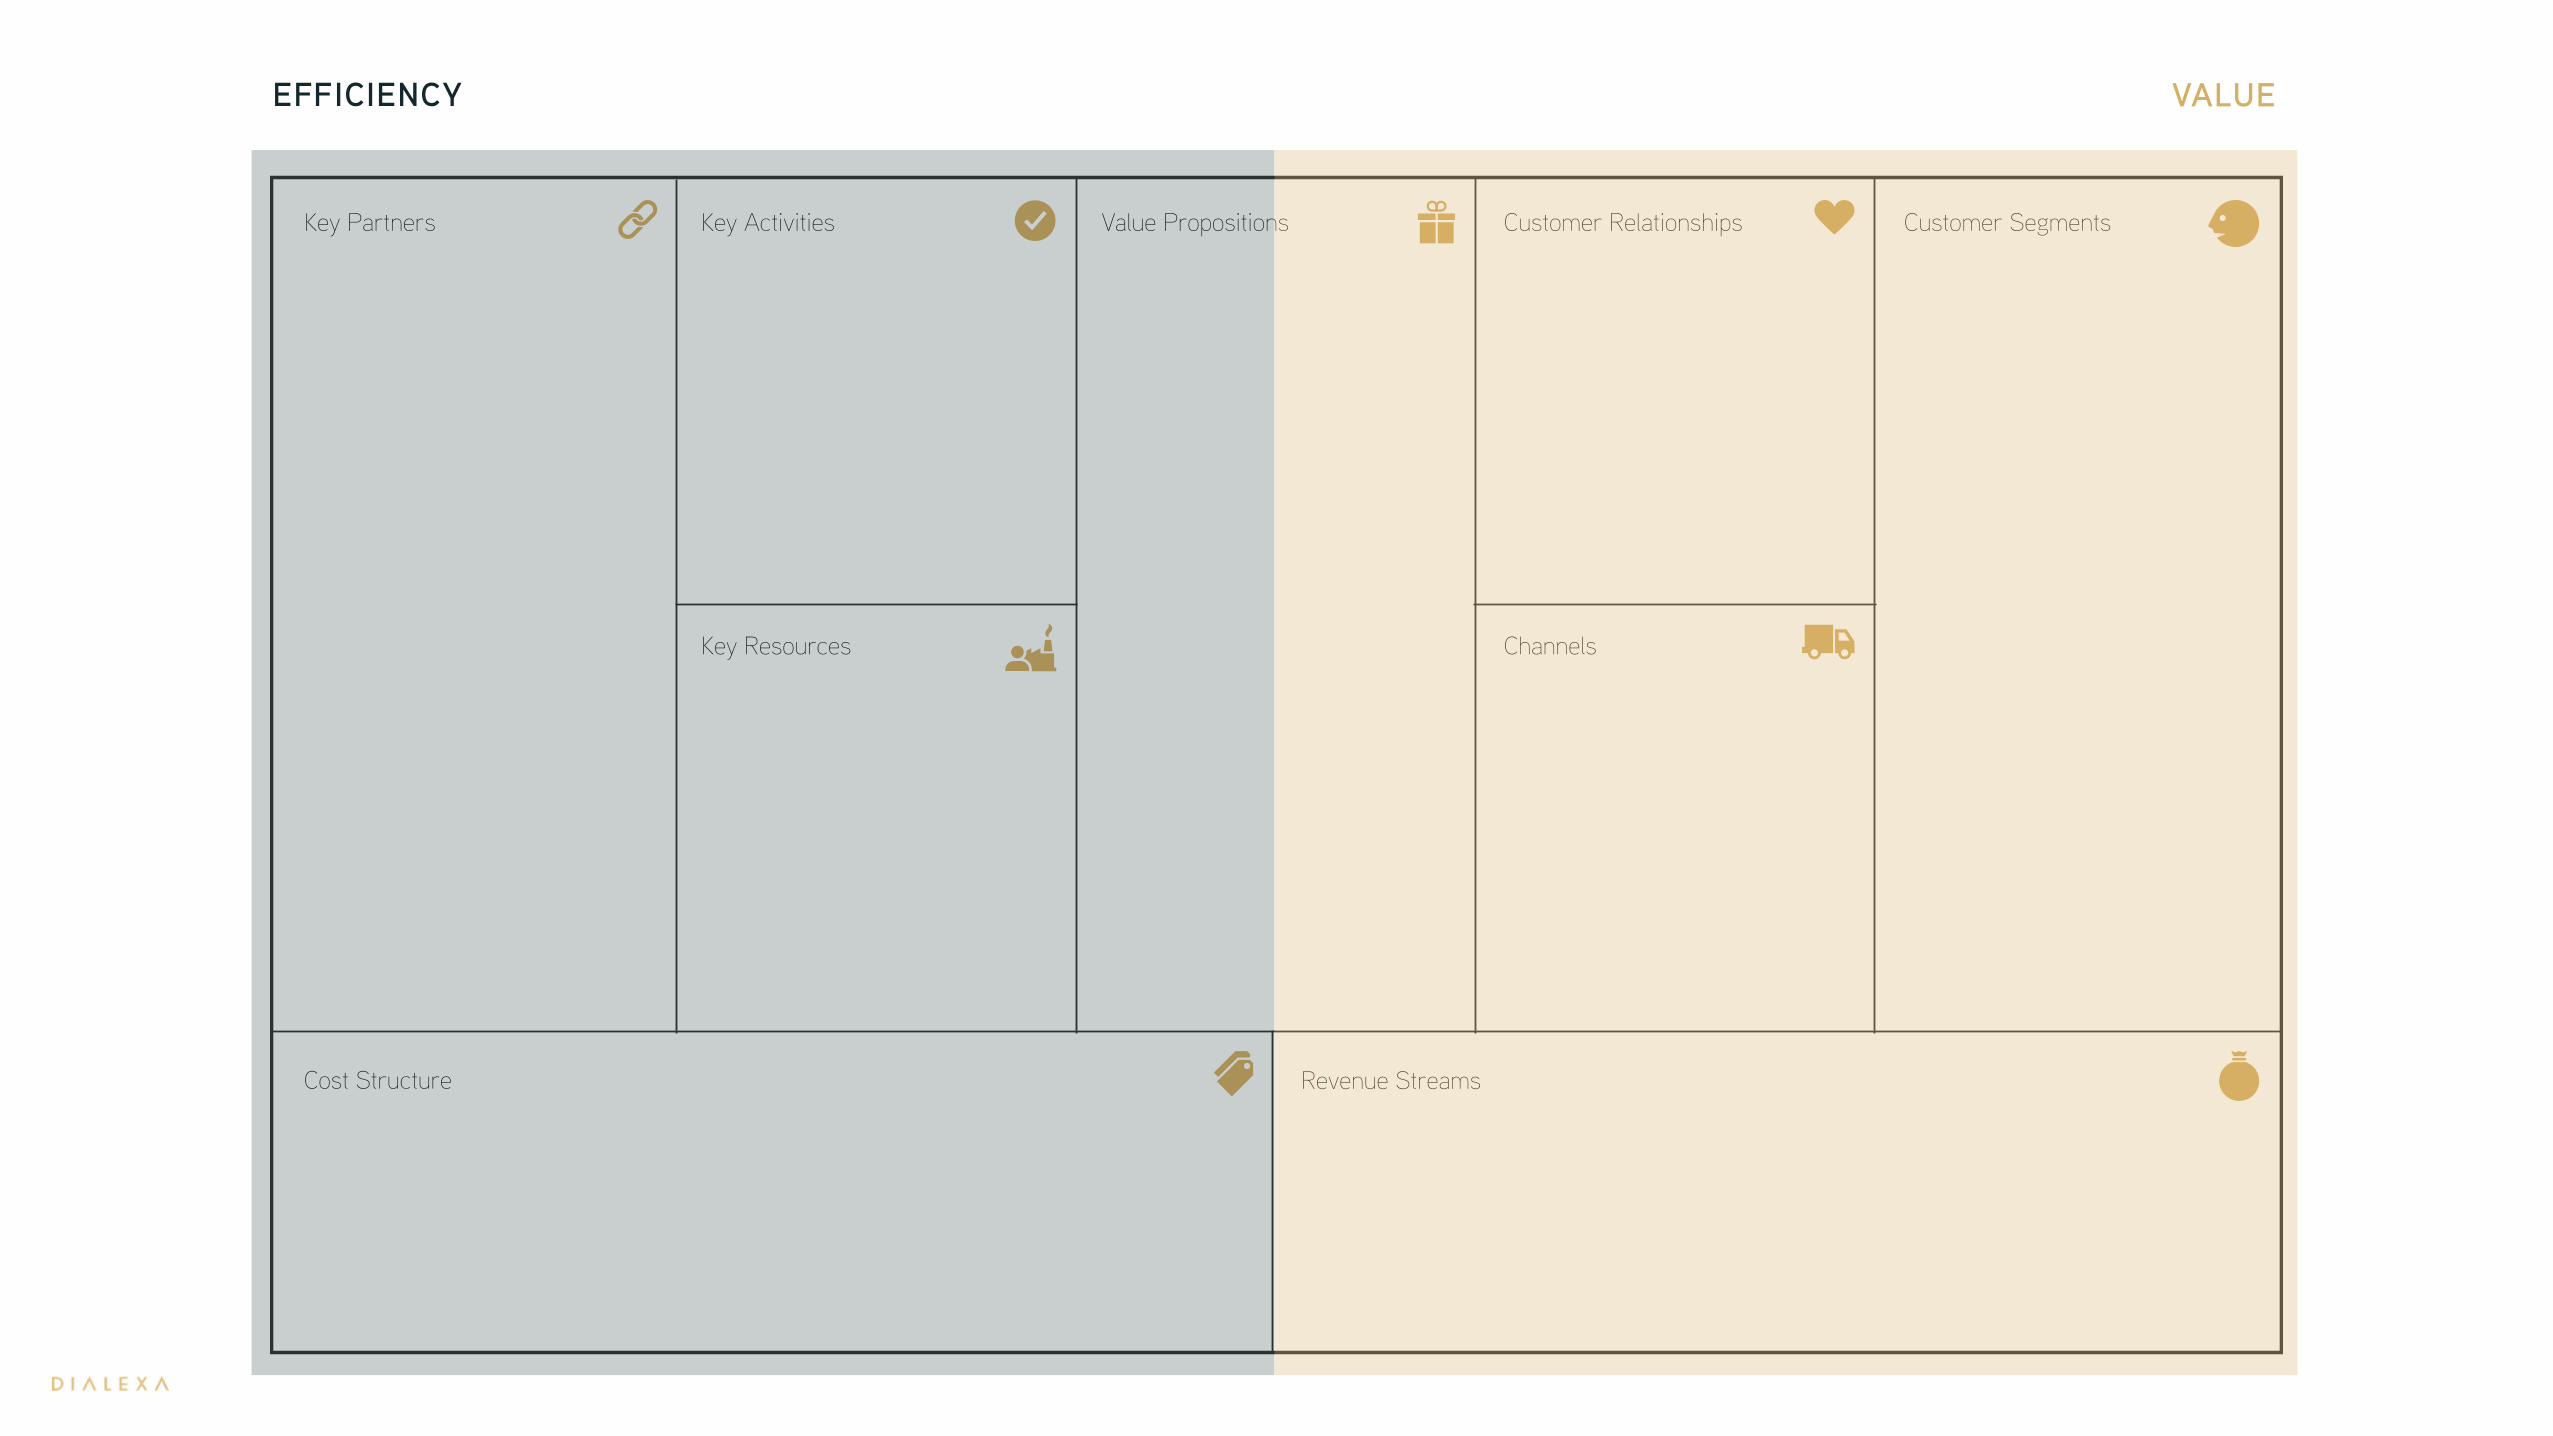
Business Model CanvasBy Alexander Osterwalder
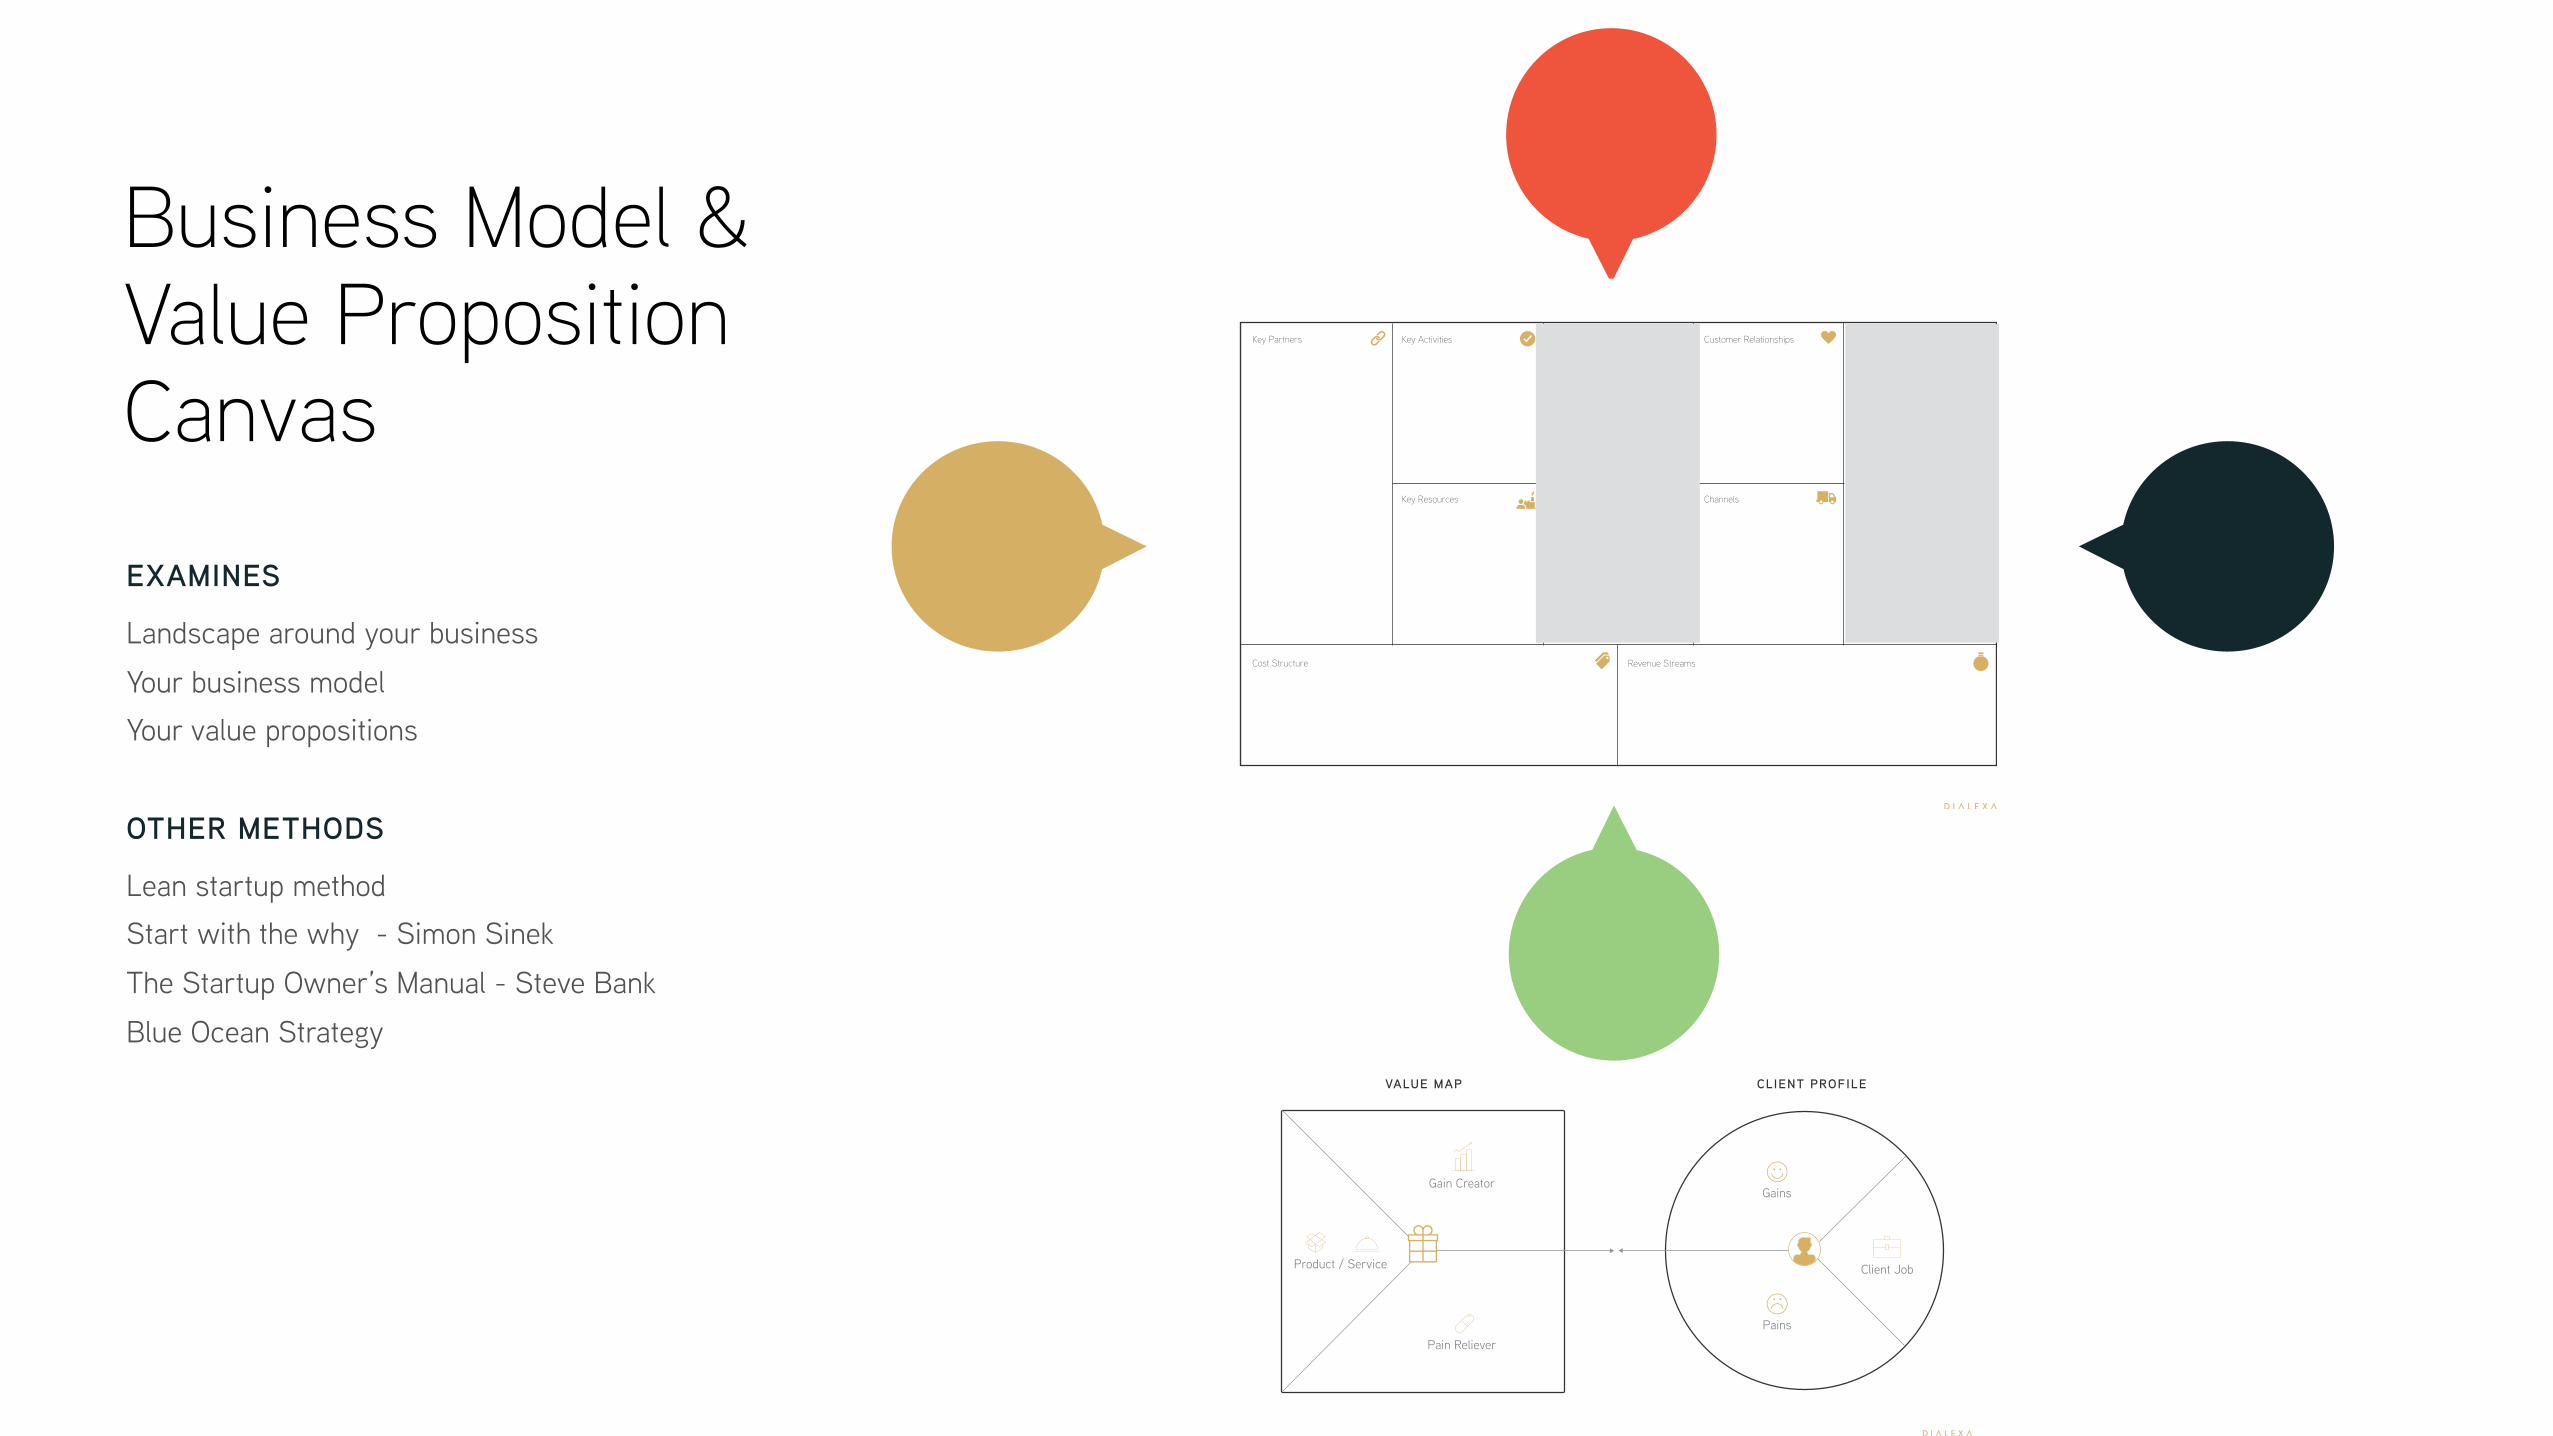
Business Model & Value Proposition Canvas
EXAMINES
Landscape around your business
Your business model
Your value propositions
OTHER METHODS
Lean startup method
Start with the why - Simon Sinek
The Startup Owner’s Manual - Steve Bank
Blue Ocean Strategy
The Business Model Canvas
Revenue Streams
Customer SegmentsValue PropositionsKey ActivitiesKey Partners
Cost Structure
Customer Relationships
Designed by: Date: Version:Designed for:
ChannelsKey Resources
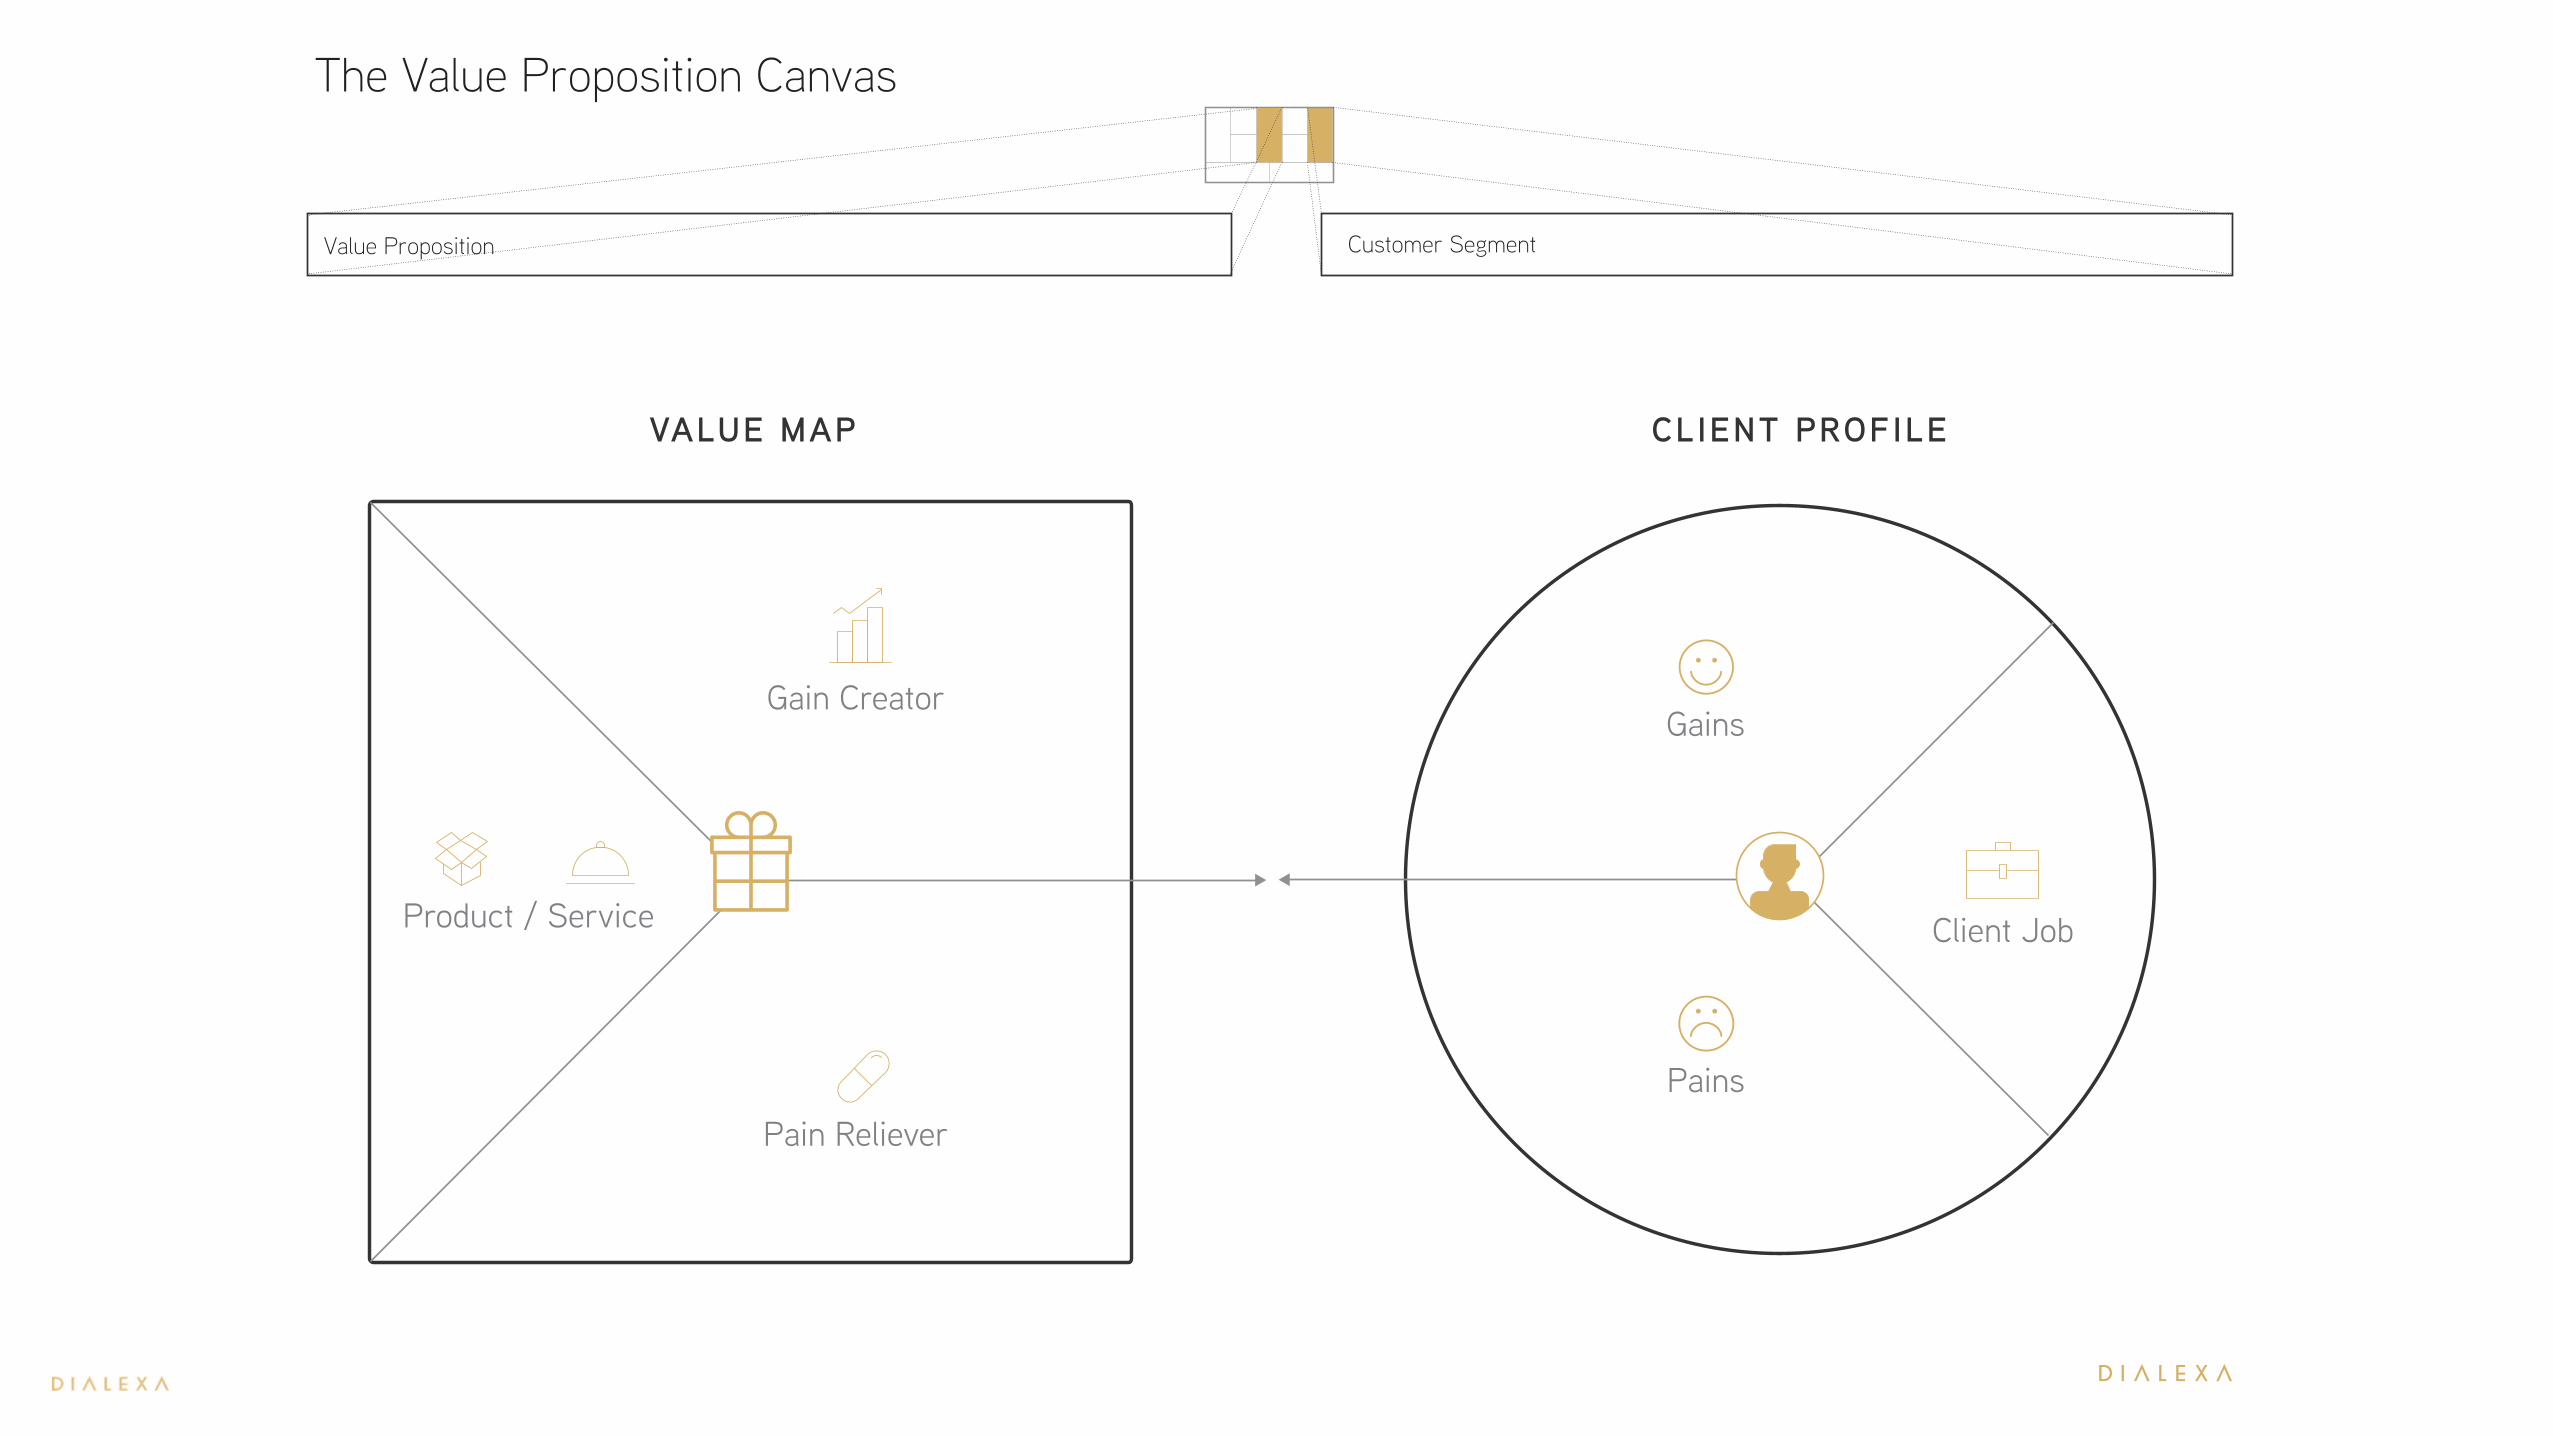
Value Proposition Customer Segment
The Value Proposition Canvas
VALUE MAP
Gain Creator
Product / Service
CLIENT PROFILE
Pain Reliever
Gains
Pains
Client Job
Place Picture Here
The Business Model Canvas
Revenue Streams
Customer SegmentsValue PropositionsKey ActivitiesKey Partners
Cost Structure
Customer Relationships
Designed by: Date: Version:Designed for:
ChannelsKey Resources
EFFICIENCY VALUE
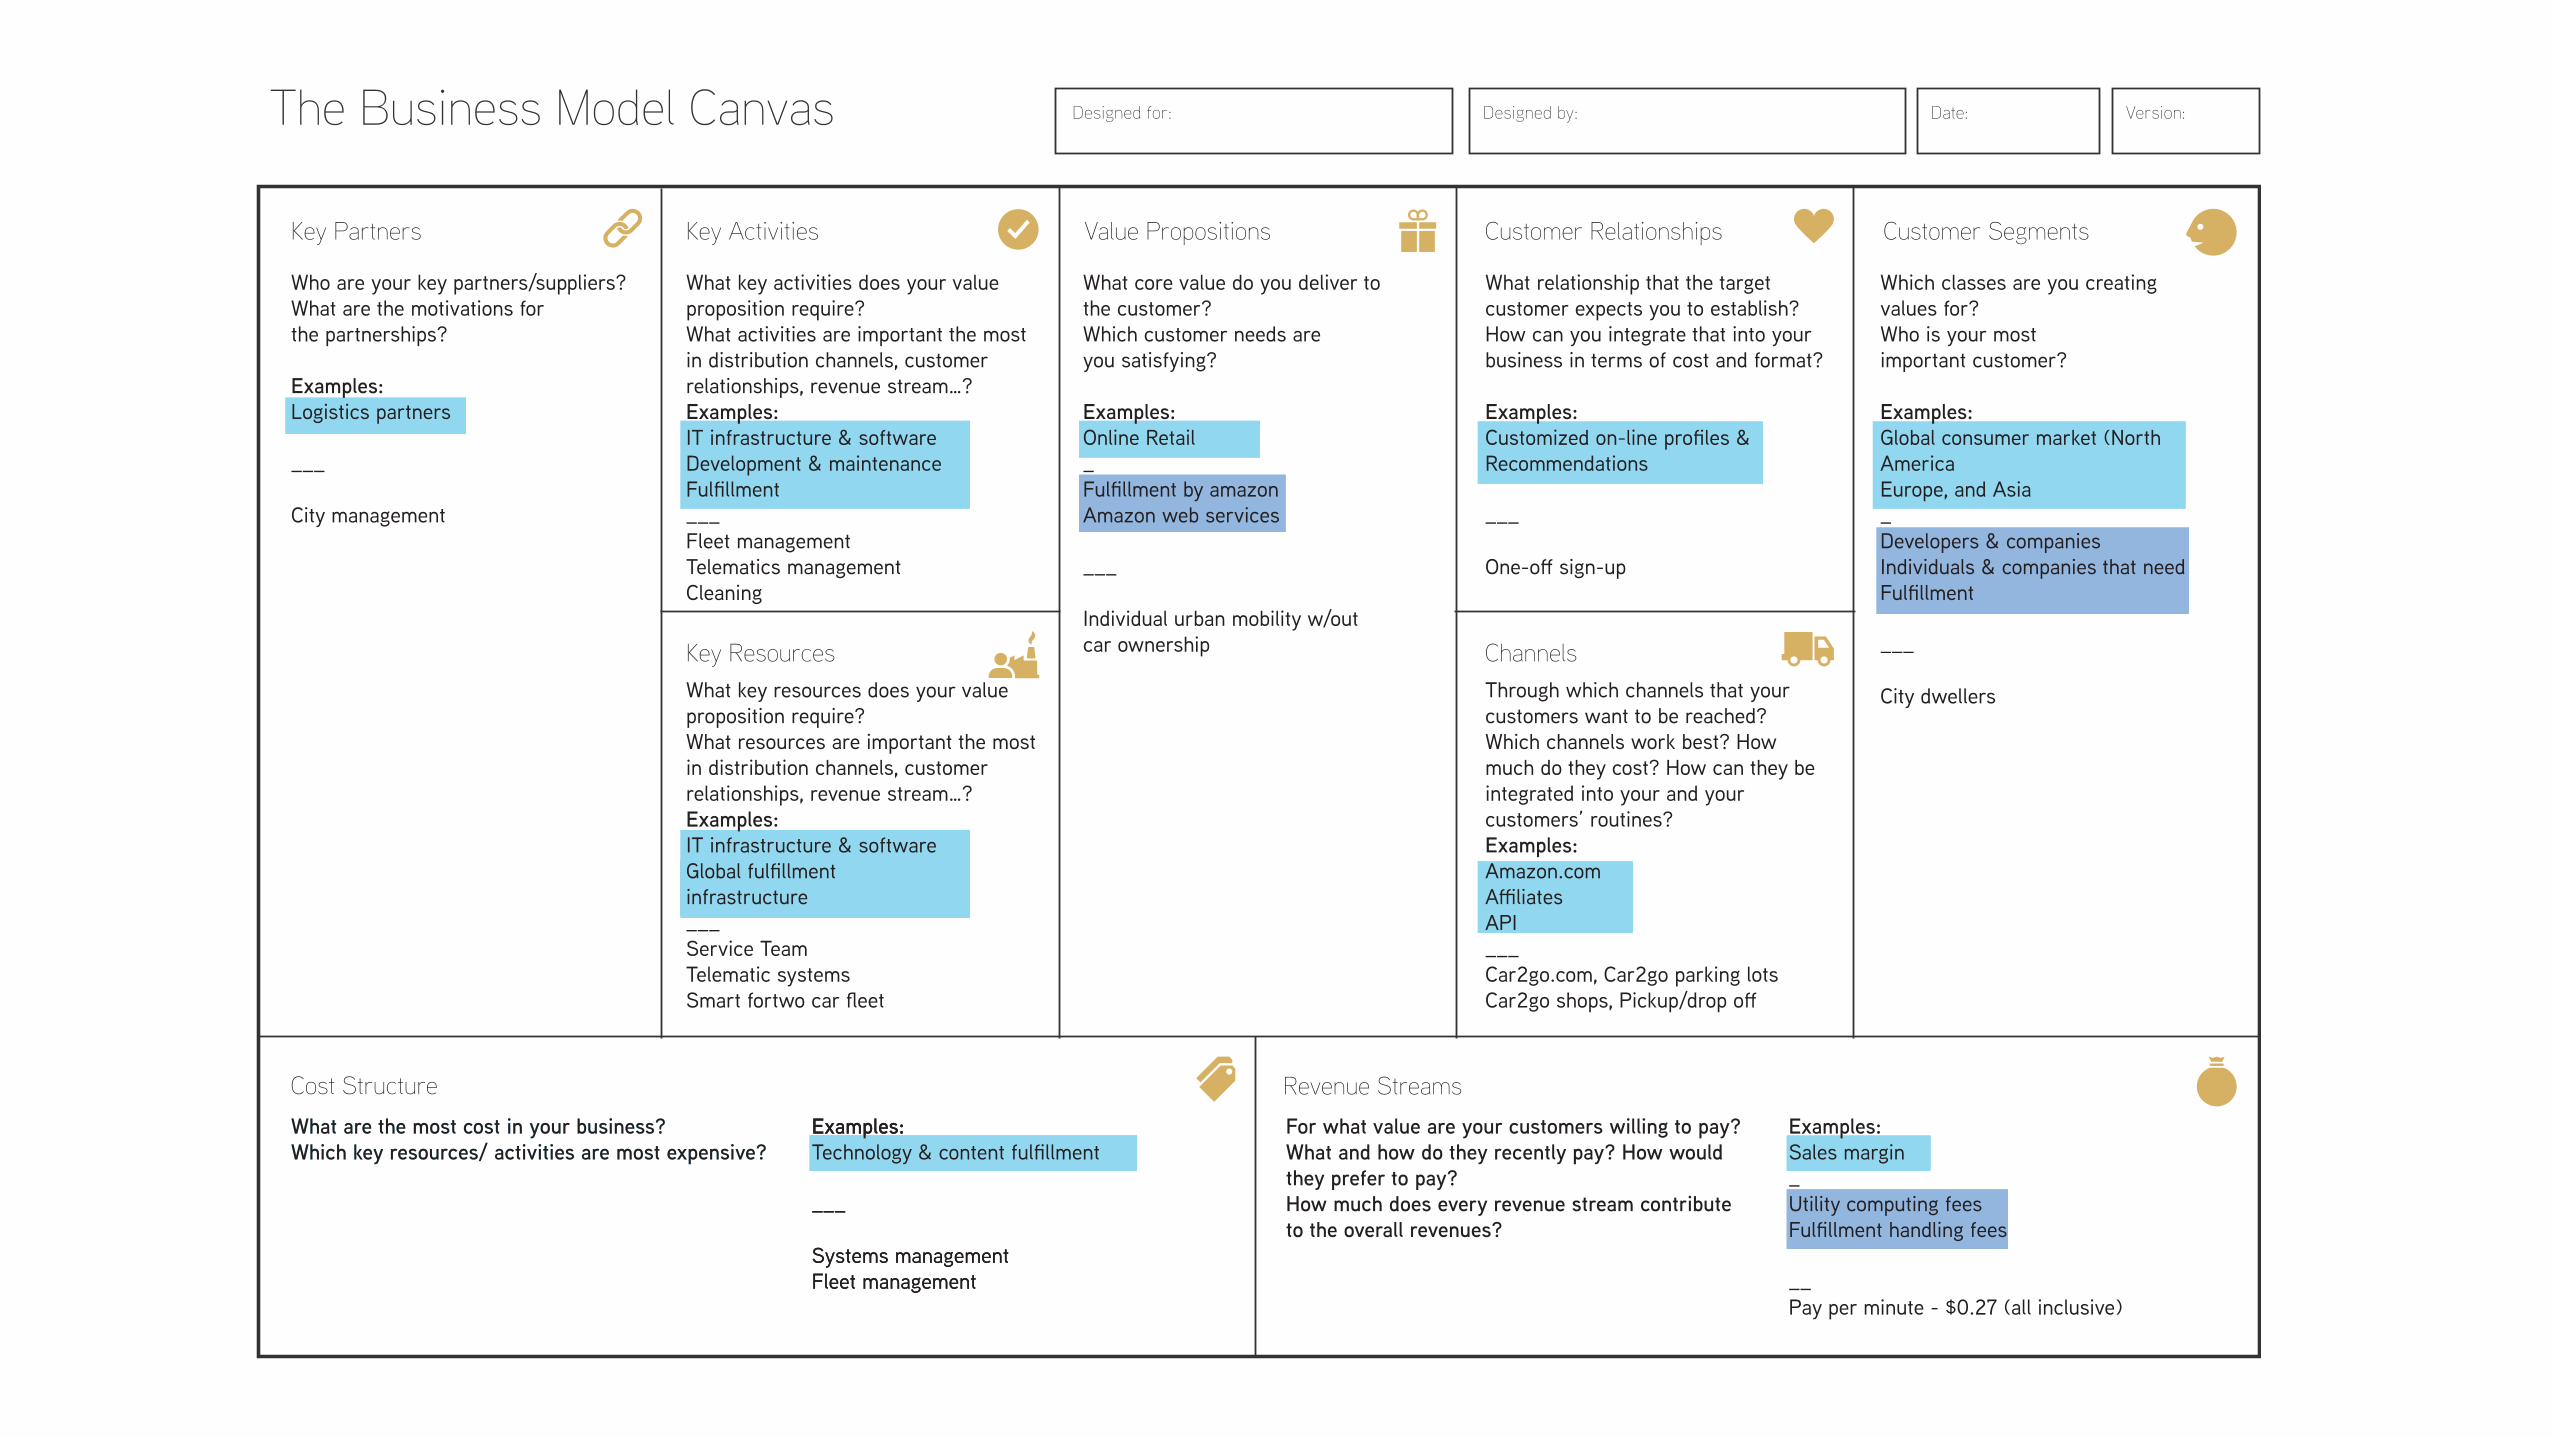
The Business Model Canvas
Revenue Streams
Customer SegmentsValue PropositionsKey ActivitiesKey Partners
Cost Structure
Customer Relationships
Designed by: Date: Version:Designed for:
ChannelsKey Resources
Who are your key partners/suppliers?What are the motivations for the partnerships?
Examples: Logistics partners
___ City management
Examples: Technology & content fulfillment
___
Systems managementFleet management
Examples: Sales margin_Utility computing feesFulfillment handling fees
__Pay per minute - $0.27 (all inclusive)
What key activities does your value proposition require?What activities are important the most in distribution channels, customer relationships, revenue stream…?Examples: IT infrastructure & softwareDevelopment & maintenanceFulfillment___Fleet management Telematics managementCleaning
What core value do you deliver to the customer?Which customer needs are you satisfying?
Examples: Online Retail_Fulfillment by amazonAmazon web services
___
Individual urban mobility w/outcar ownership
What relationship that the target customer expects you to establish?How can you integrate that into your business in terms of cost and format?
Examples: Customized on-line profiles & Recommendations
___
One-off sign-up
What key resources does your value proposition require?What resources are important the most in distribution channels, customer relationships, revenue stream…?Examples: IT infrastructure & software Global fulfillmentinfrastructure___Service TeamTelematic systemsSmart fortwo car fleet
Through which channels that your customers want to be reached?Which channels work best? How much do they cost? How can they be integrated into your and your customers’ routines?Examples: Amazon.com AffiliatesAPI___Car2go.com, Car2go parking lotsCar2go shops, Pickup/drop off
Which classes are you creating values for?Who is your most important customer?
Examples: Global consumer market (North AmericaEurope, and Asia_Developers & companiesIndividuals & companies that need Fulfillment
___
City dwellers
What are the most cost in your business?Which key resources/ activities are most expensive?What are the most cost in your business?Which key resources/ activities are most expensive?
For what value are your customers willing to pay?What and how do they recently pay? How would they prefer to pay?How much does every revenue stream contribute to the overall revenues?
Examples: Technology & content fulfillment
___
Systems managementFleet management
Which key resources/ activities are most expensive?Which key resources/ activities are most expensive?

Value Prop CanvasBy Alexander Osterwalder
Value Proposition Customer Segment
The Value Proposition Canvas
VALUE MAP
Gain Creator
Product / Service
CLIENT PROFILE
Pain Reliever
Gains
Pains
Client Job
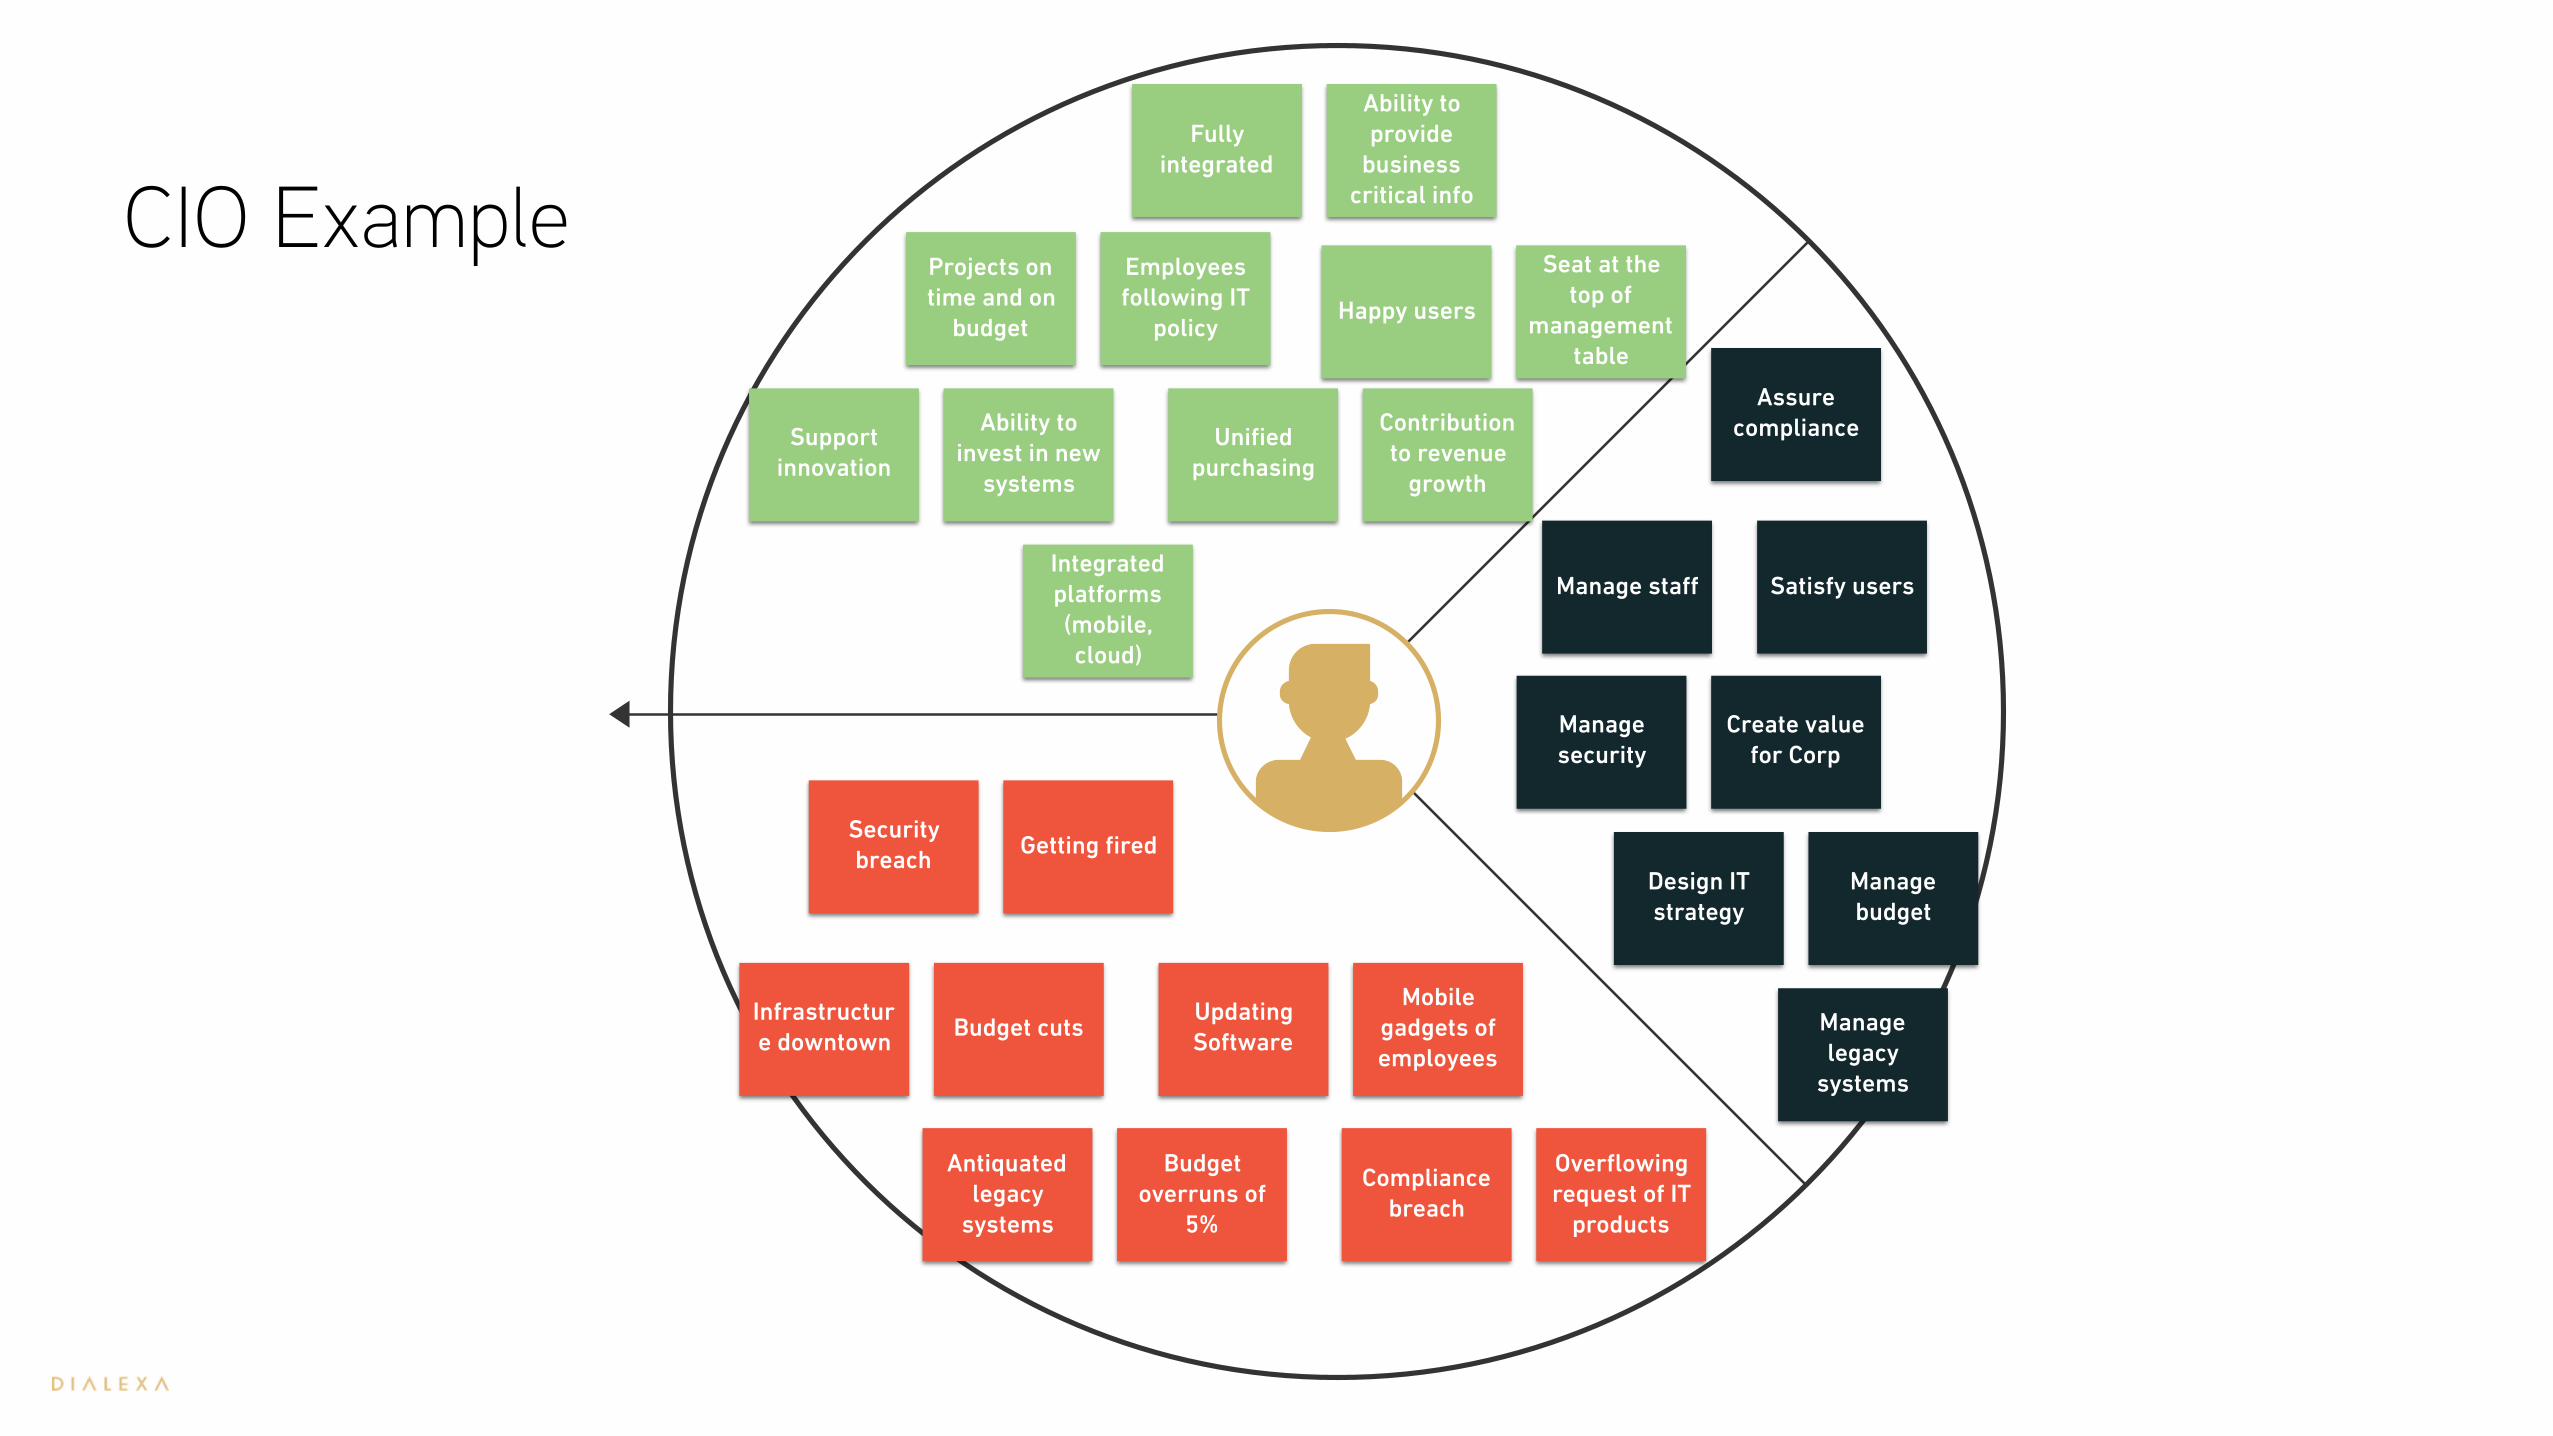
The Value Proposition Canvas
Customer (Segment) Profile:
Pains
Gains
CustomerJob(s)
Manage security
Assure compliance
Manage staff Satisfy users
Create value for Corp
Design IT strategy
Manage budget
Manage legacy
systems
Fully integrated
Ability to provide
business critical info
Support innovation
Ability to invest in new
systems
Integrated platforms (mobile, cloud)
Happy users
Seat at the top of
management table
Projects on time and on
budget
Employees following IT
policy
Unified purchasing
Contribution to revenue
growth
Infrastructure downtown
Budget cutsUpdating Software
Mobile gadgets of employees
Security breach
Getting fired
Antiquated legacy
systems
Budget overruns of
5%
Compliance breach
Overflowing request of IT
products
CIO Example
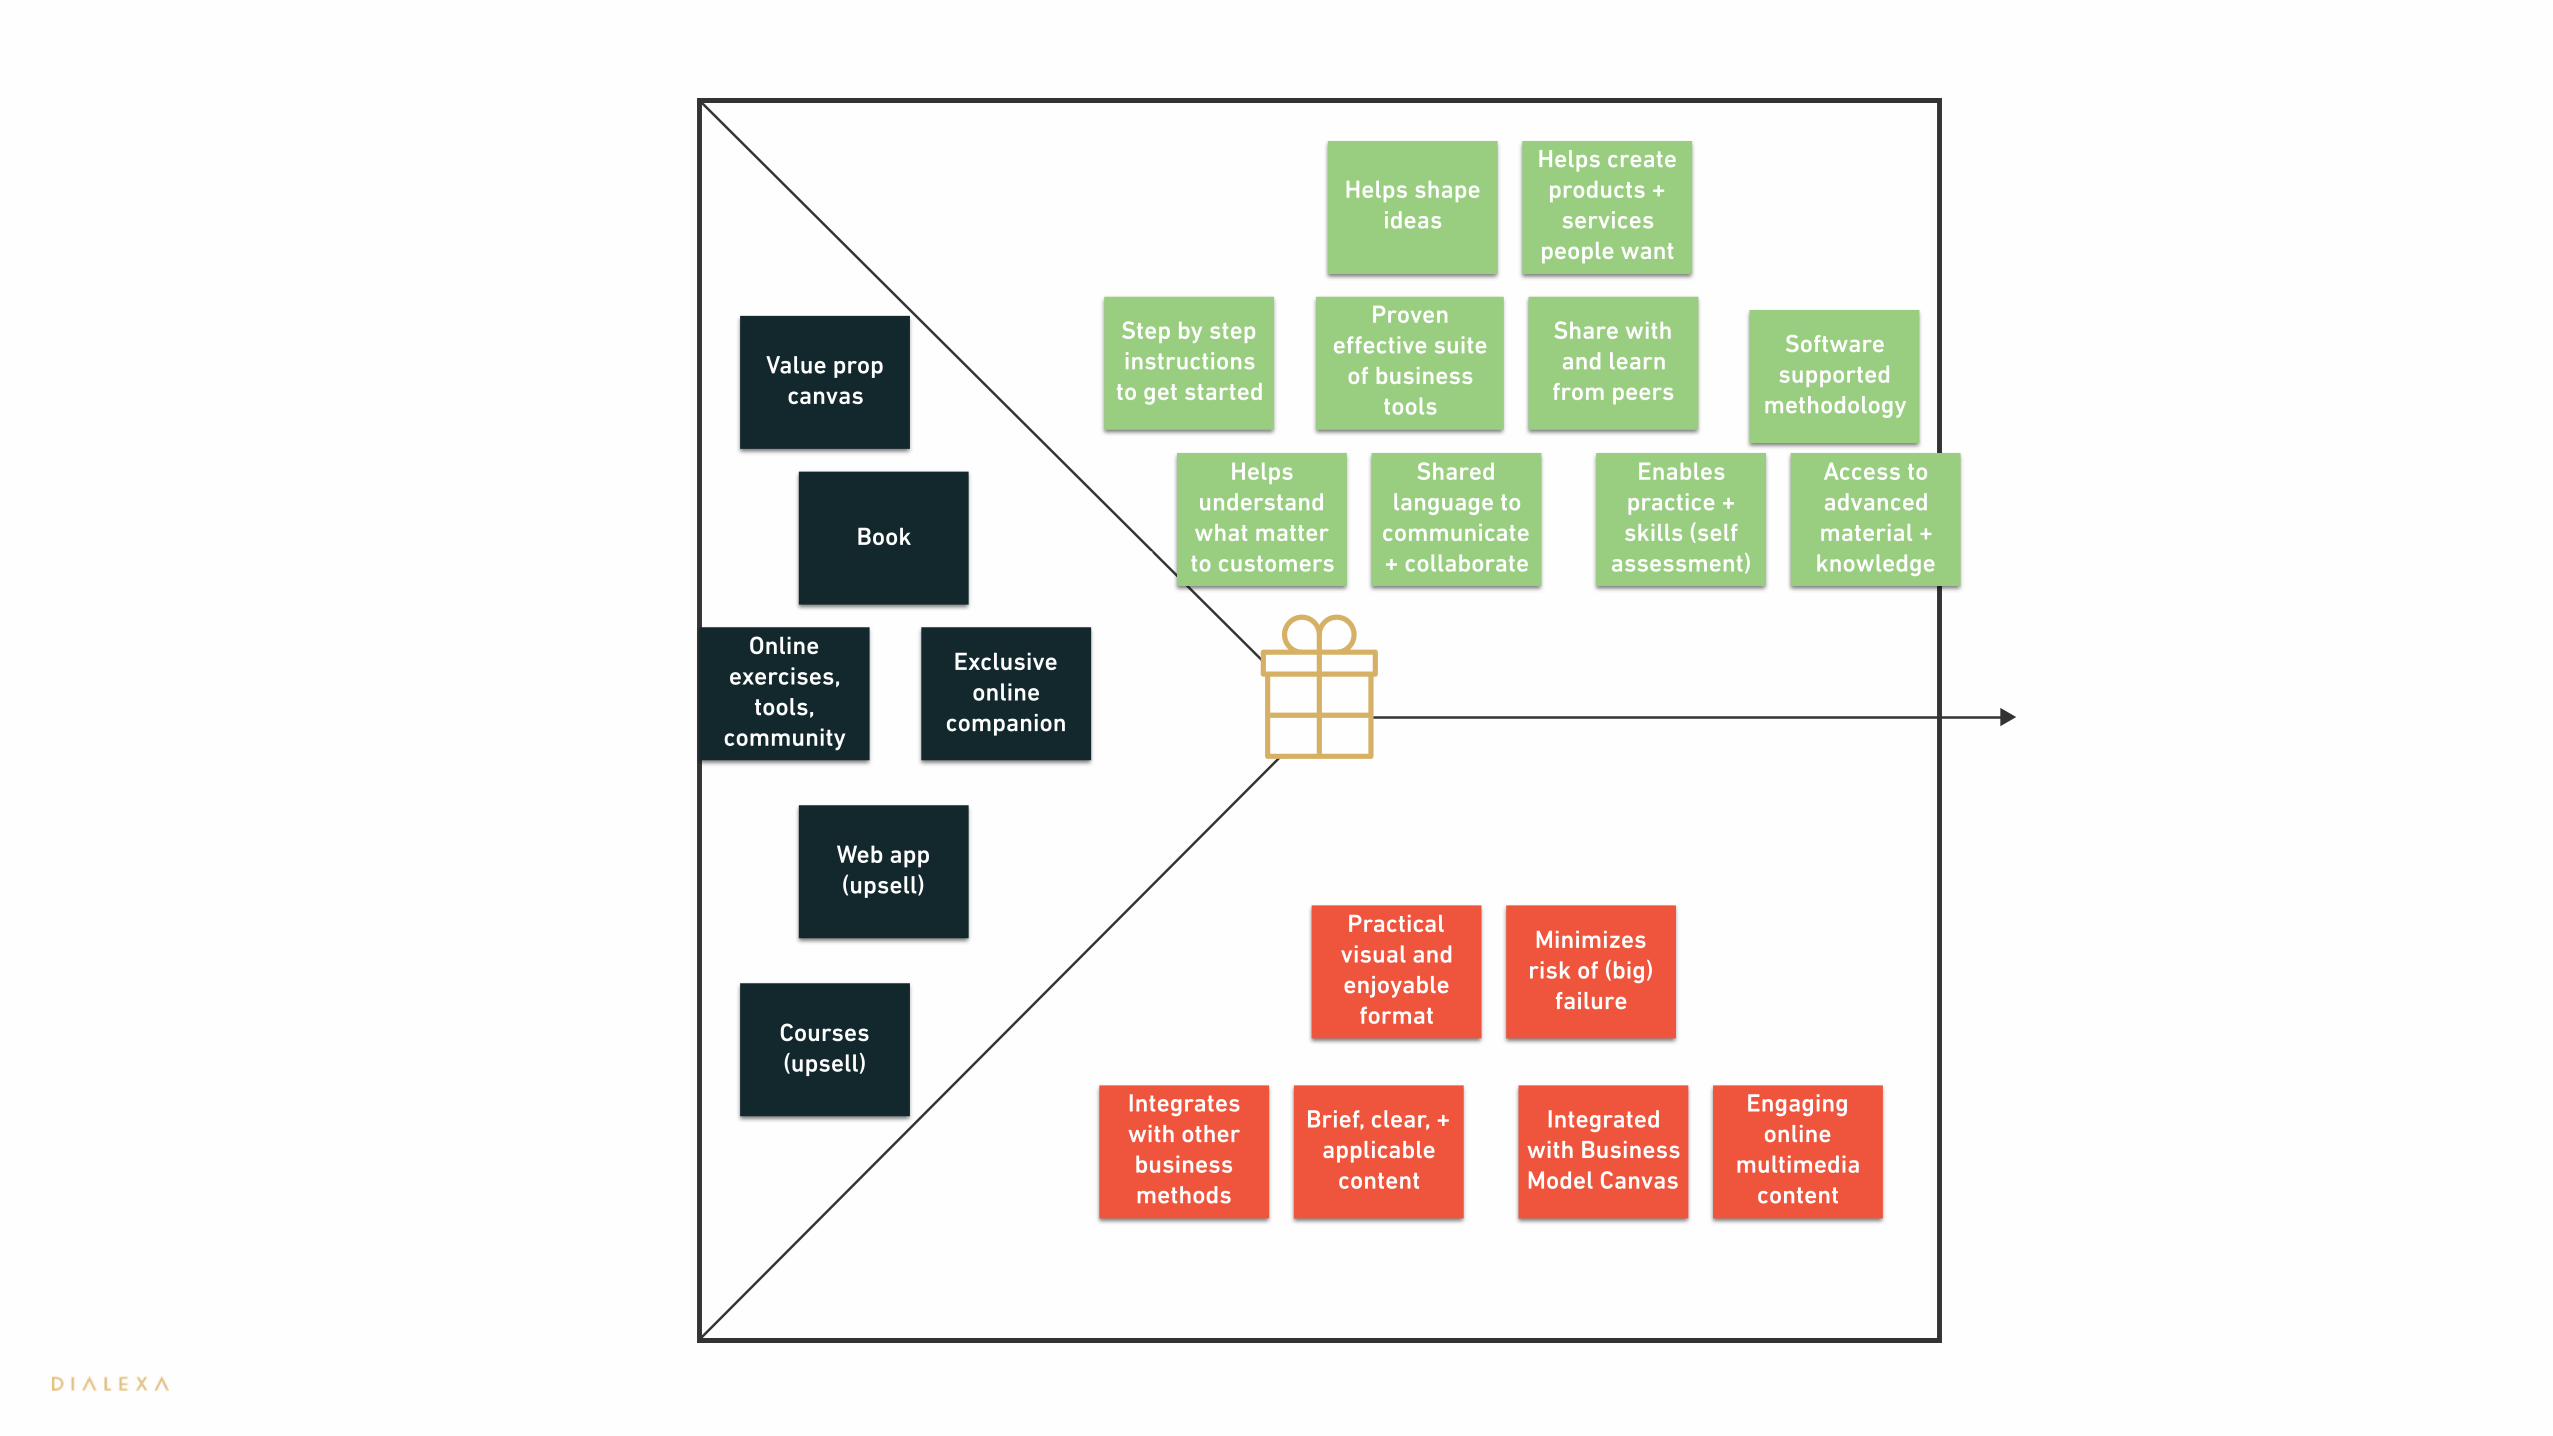
The Value Proposition Canvas
Value (Proposition) Map:
Gain Creator
Product / Service
Pain Reliever
Web app (upsell)
Value prop canvas
Exclusive online
companion
Book
Online exercises,
tools, community
Courses (upsell)
Helps shape ideas
Helps create products +
services people want
Helps understand what matter to customers
Shared language to
communicate + collaborate
Software supported
methodology
Step by step instructions
to get started
Proven effective suite
of business tools
Share with and learn
from peers
Enables practice + skills (self
assessment)
Access to advanced material + knowledge
Integrates with other business methods
Brief, clear, + applicable
content
Integrated with Business Model Canvas
Engaging online
multimedia content
Practical visual and enjoyable
format
Minimizes risk of (big)
failure
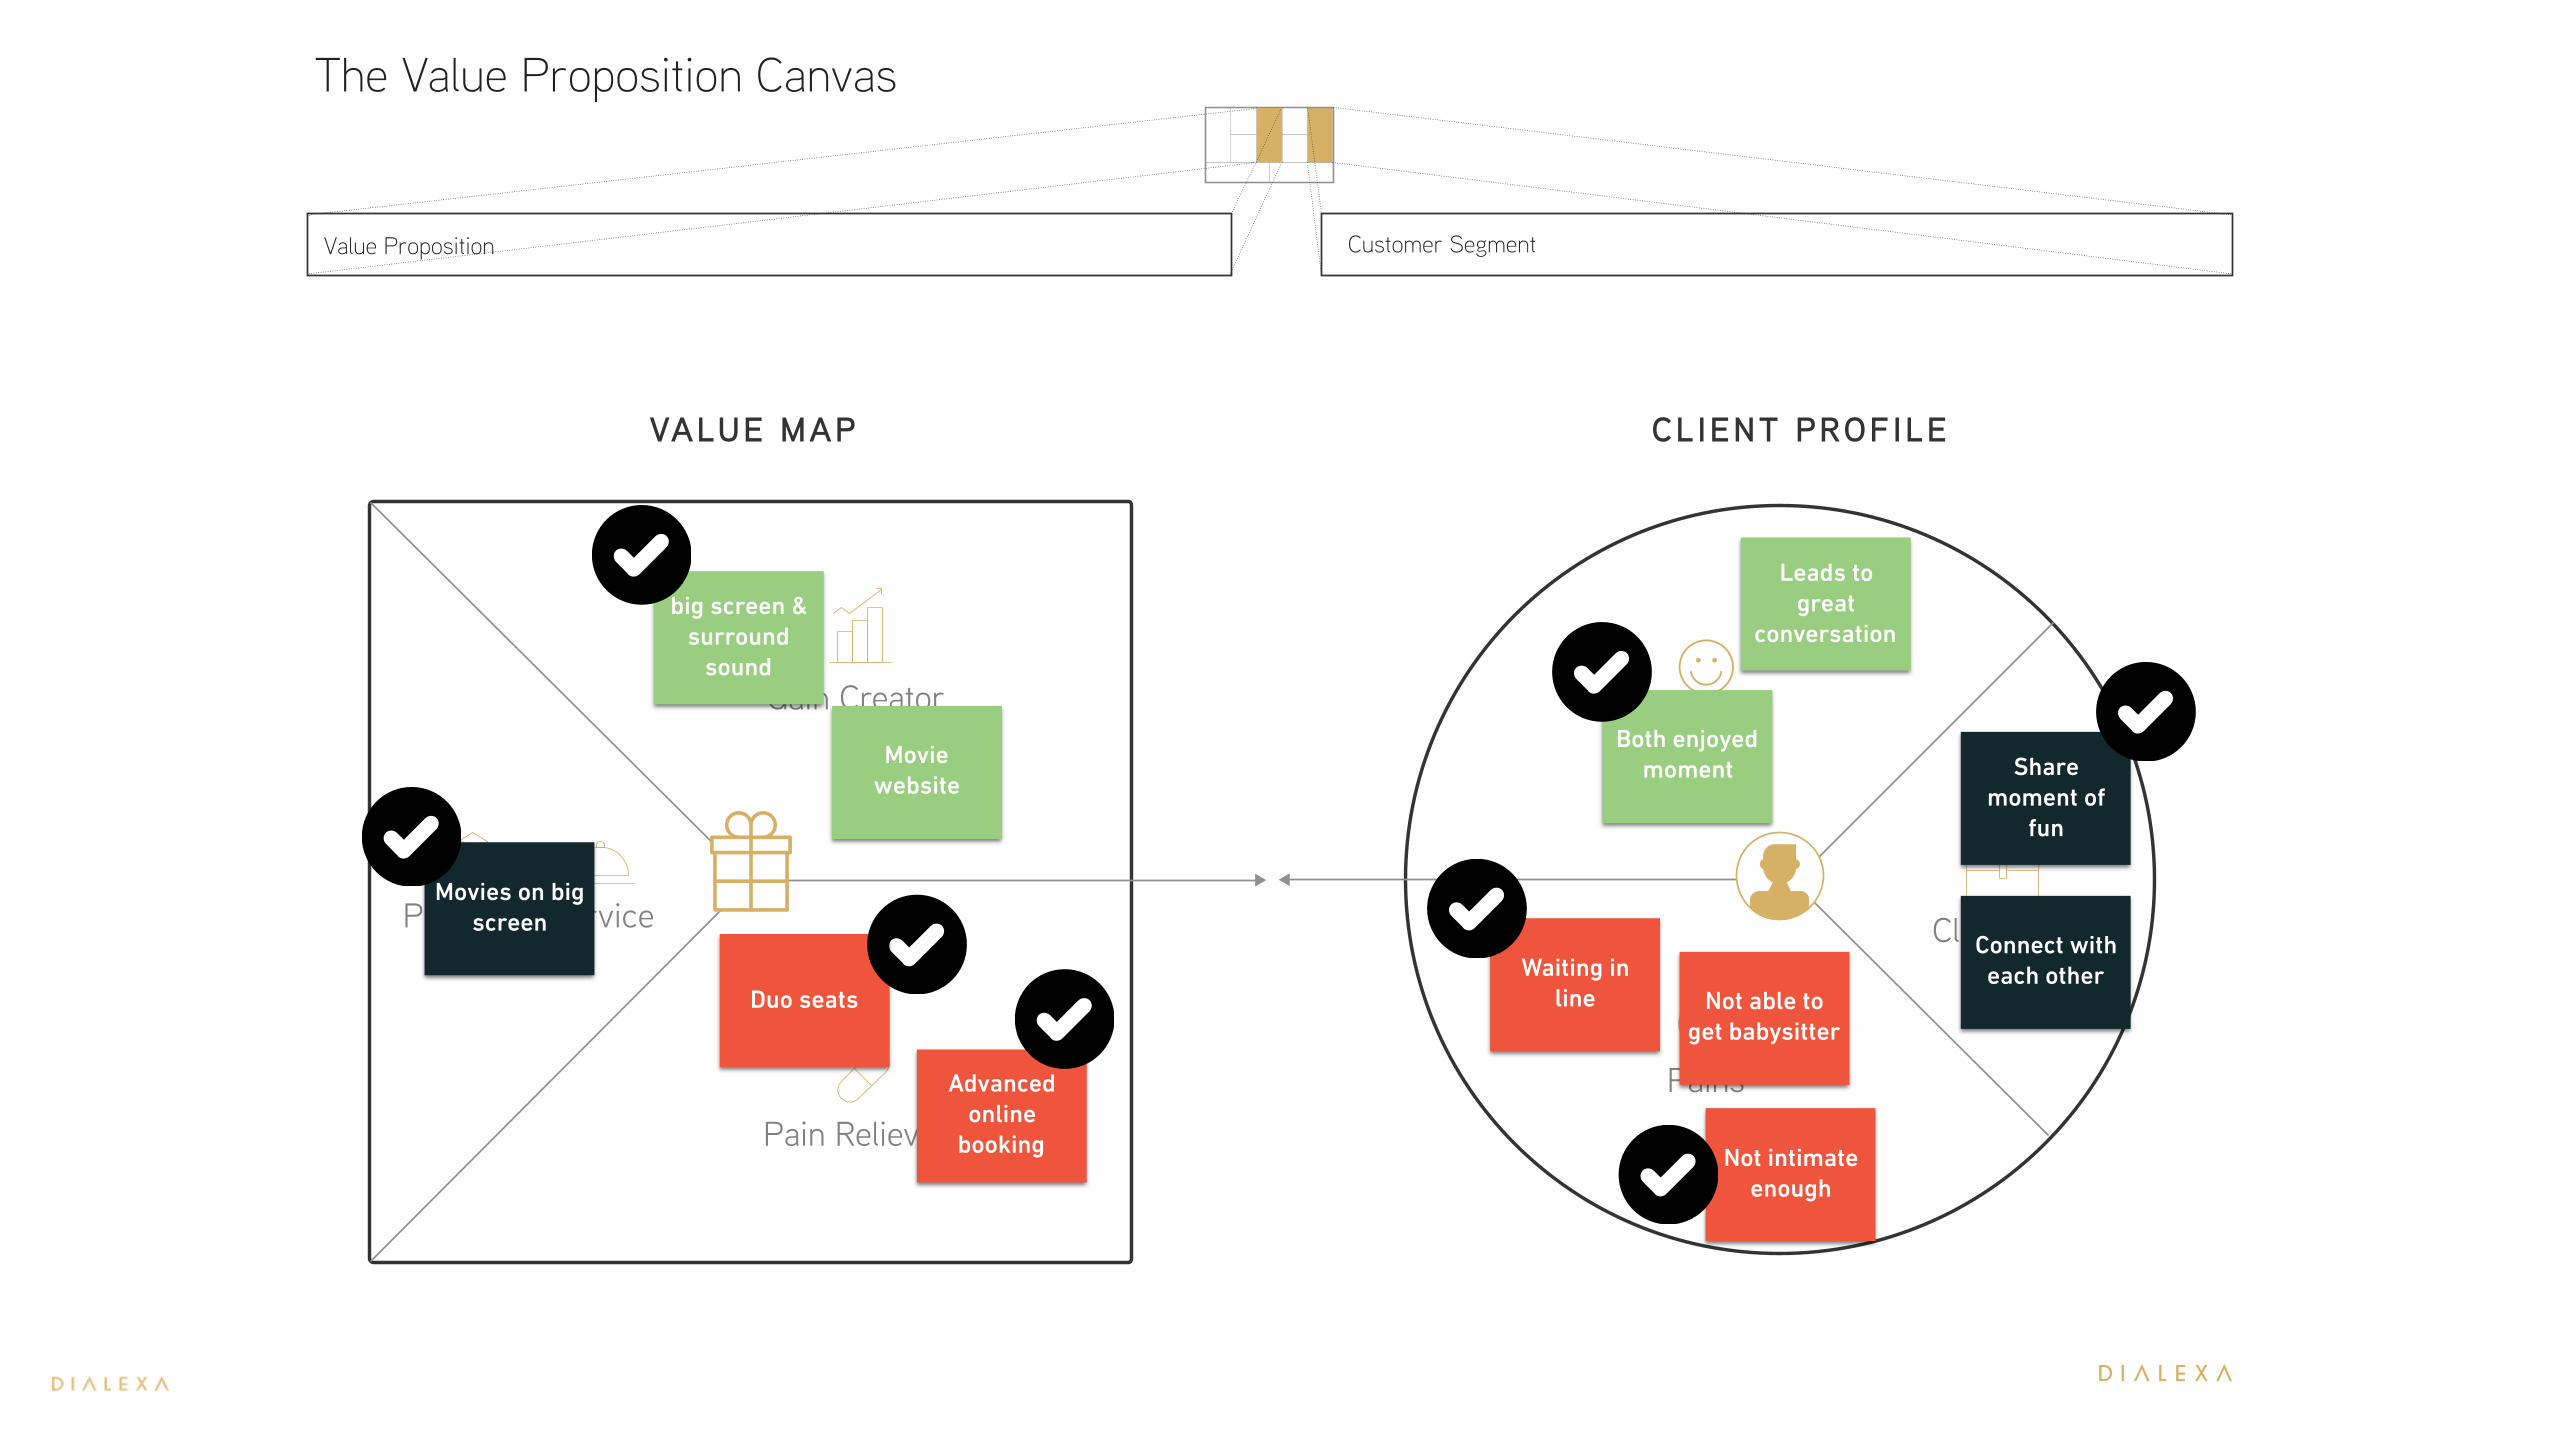
Value Proposition Customer Segment
The Value Proposition Canvas
VALUE MAP
Gain Creator
Product / Service
CLIENT PROFILE
Pain Reliever
Gains
Pains
Client Job
Share moment of
fun
Both enjoyed moment
Waiting in line
Connect with each other
Leads to great
conversation
Not able to get babysitter
Not intimate enough
Movies on big screen
Movie website
Duo seats
big screen & surround
sound
Advanced online
booking
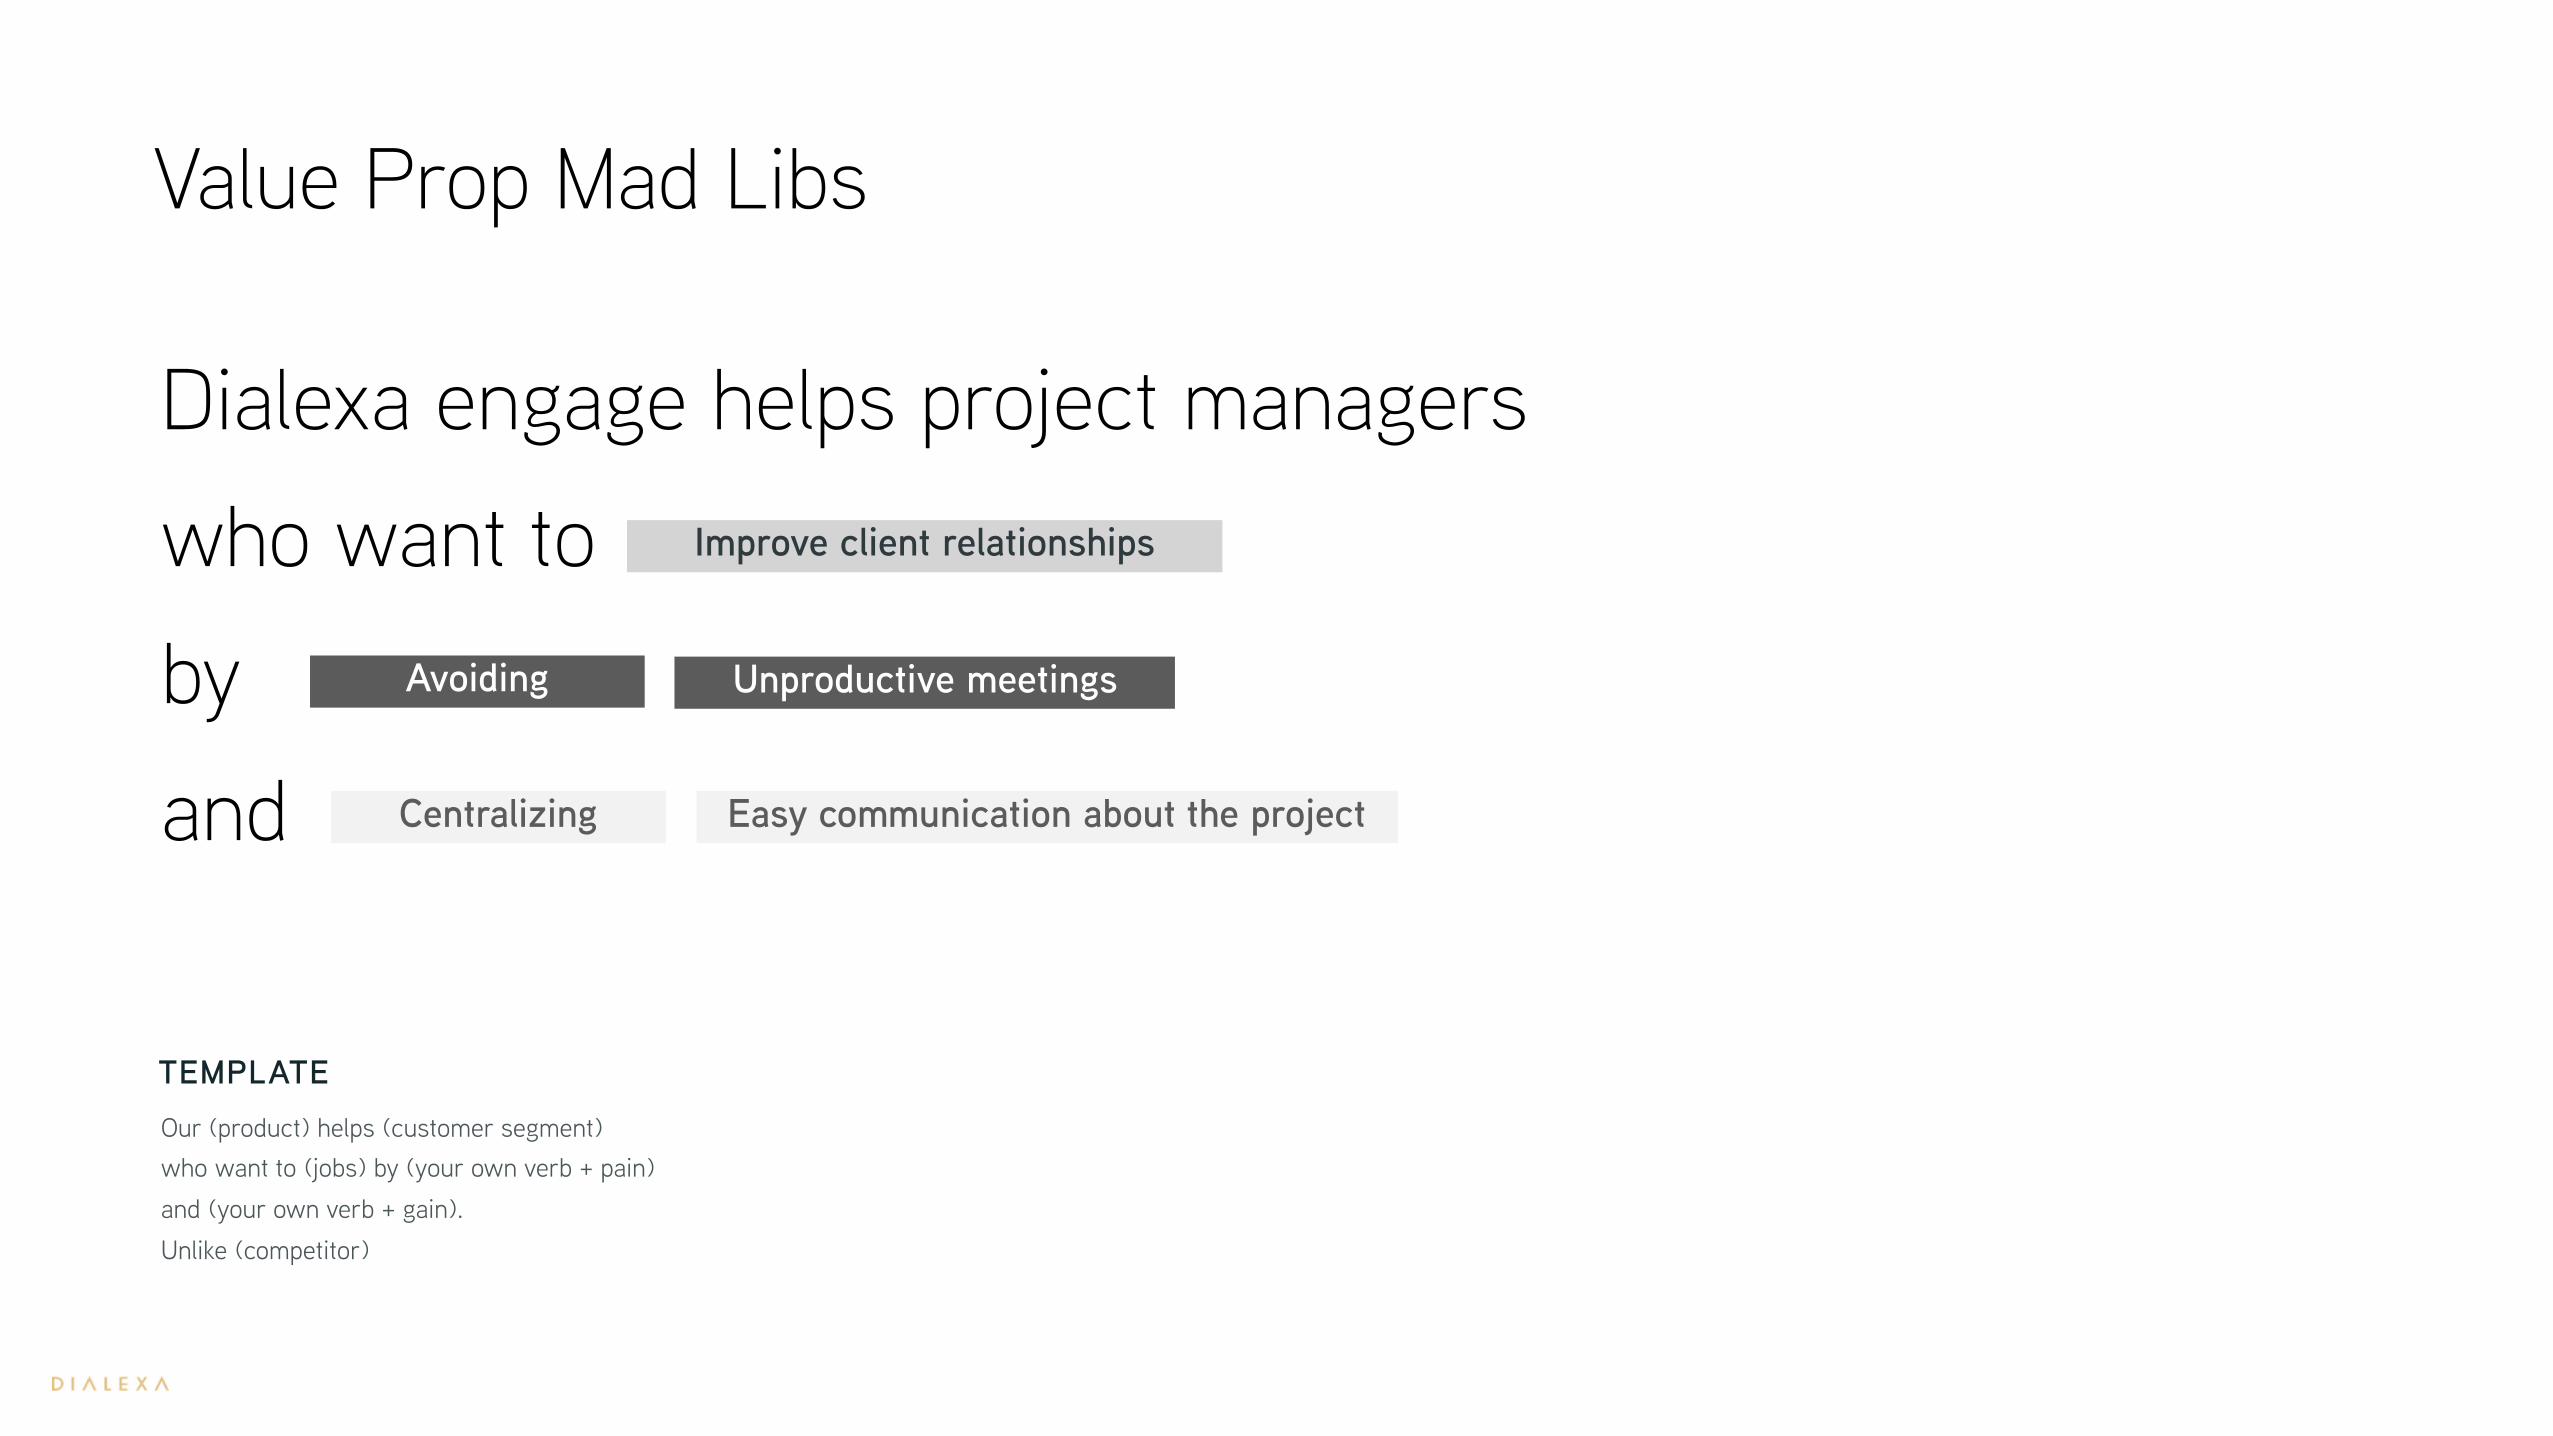
Value Prop Mad Libs
Dialexa engage helps project managers
who want to
by
and
Improve client relationships
Unproductive meetingsAvoiding
Centralizing Easy communication about the project
Our (product) helps (customer segment)
who want to (jobs) by (your own verb + pain)
and (your own verb + gain).
Unlike (competitor)
TEMPLATE

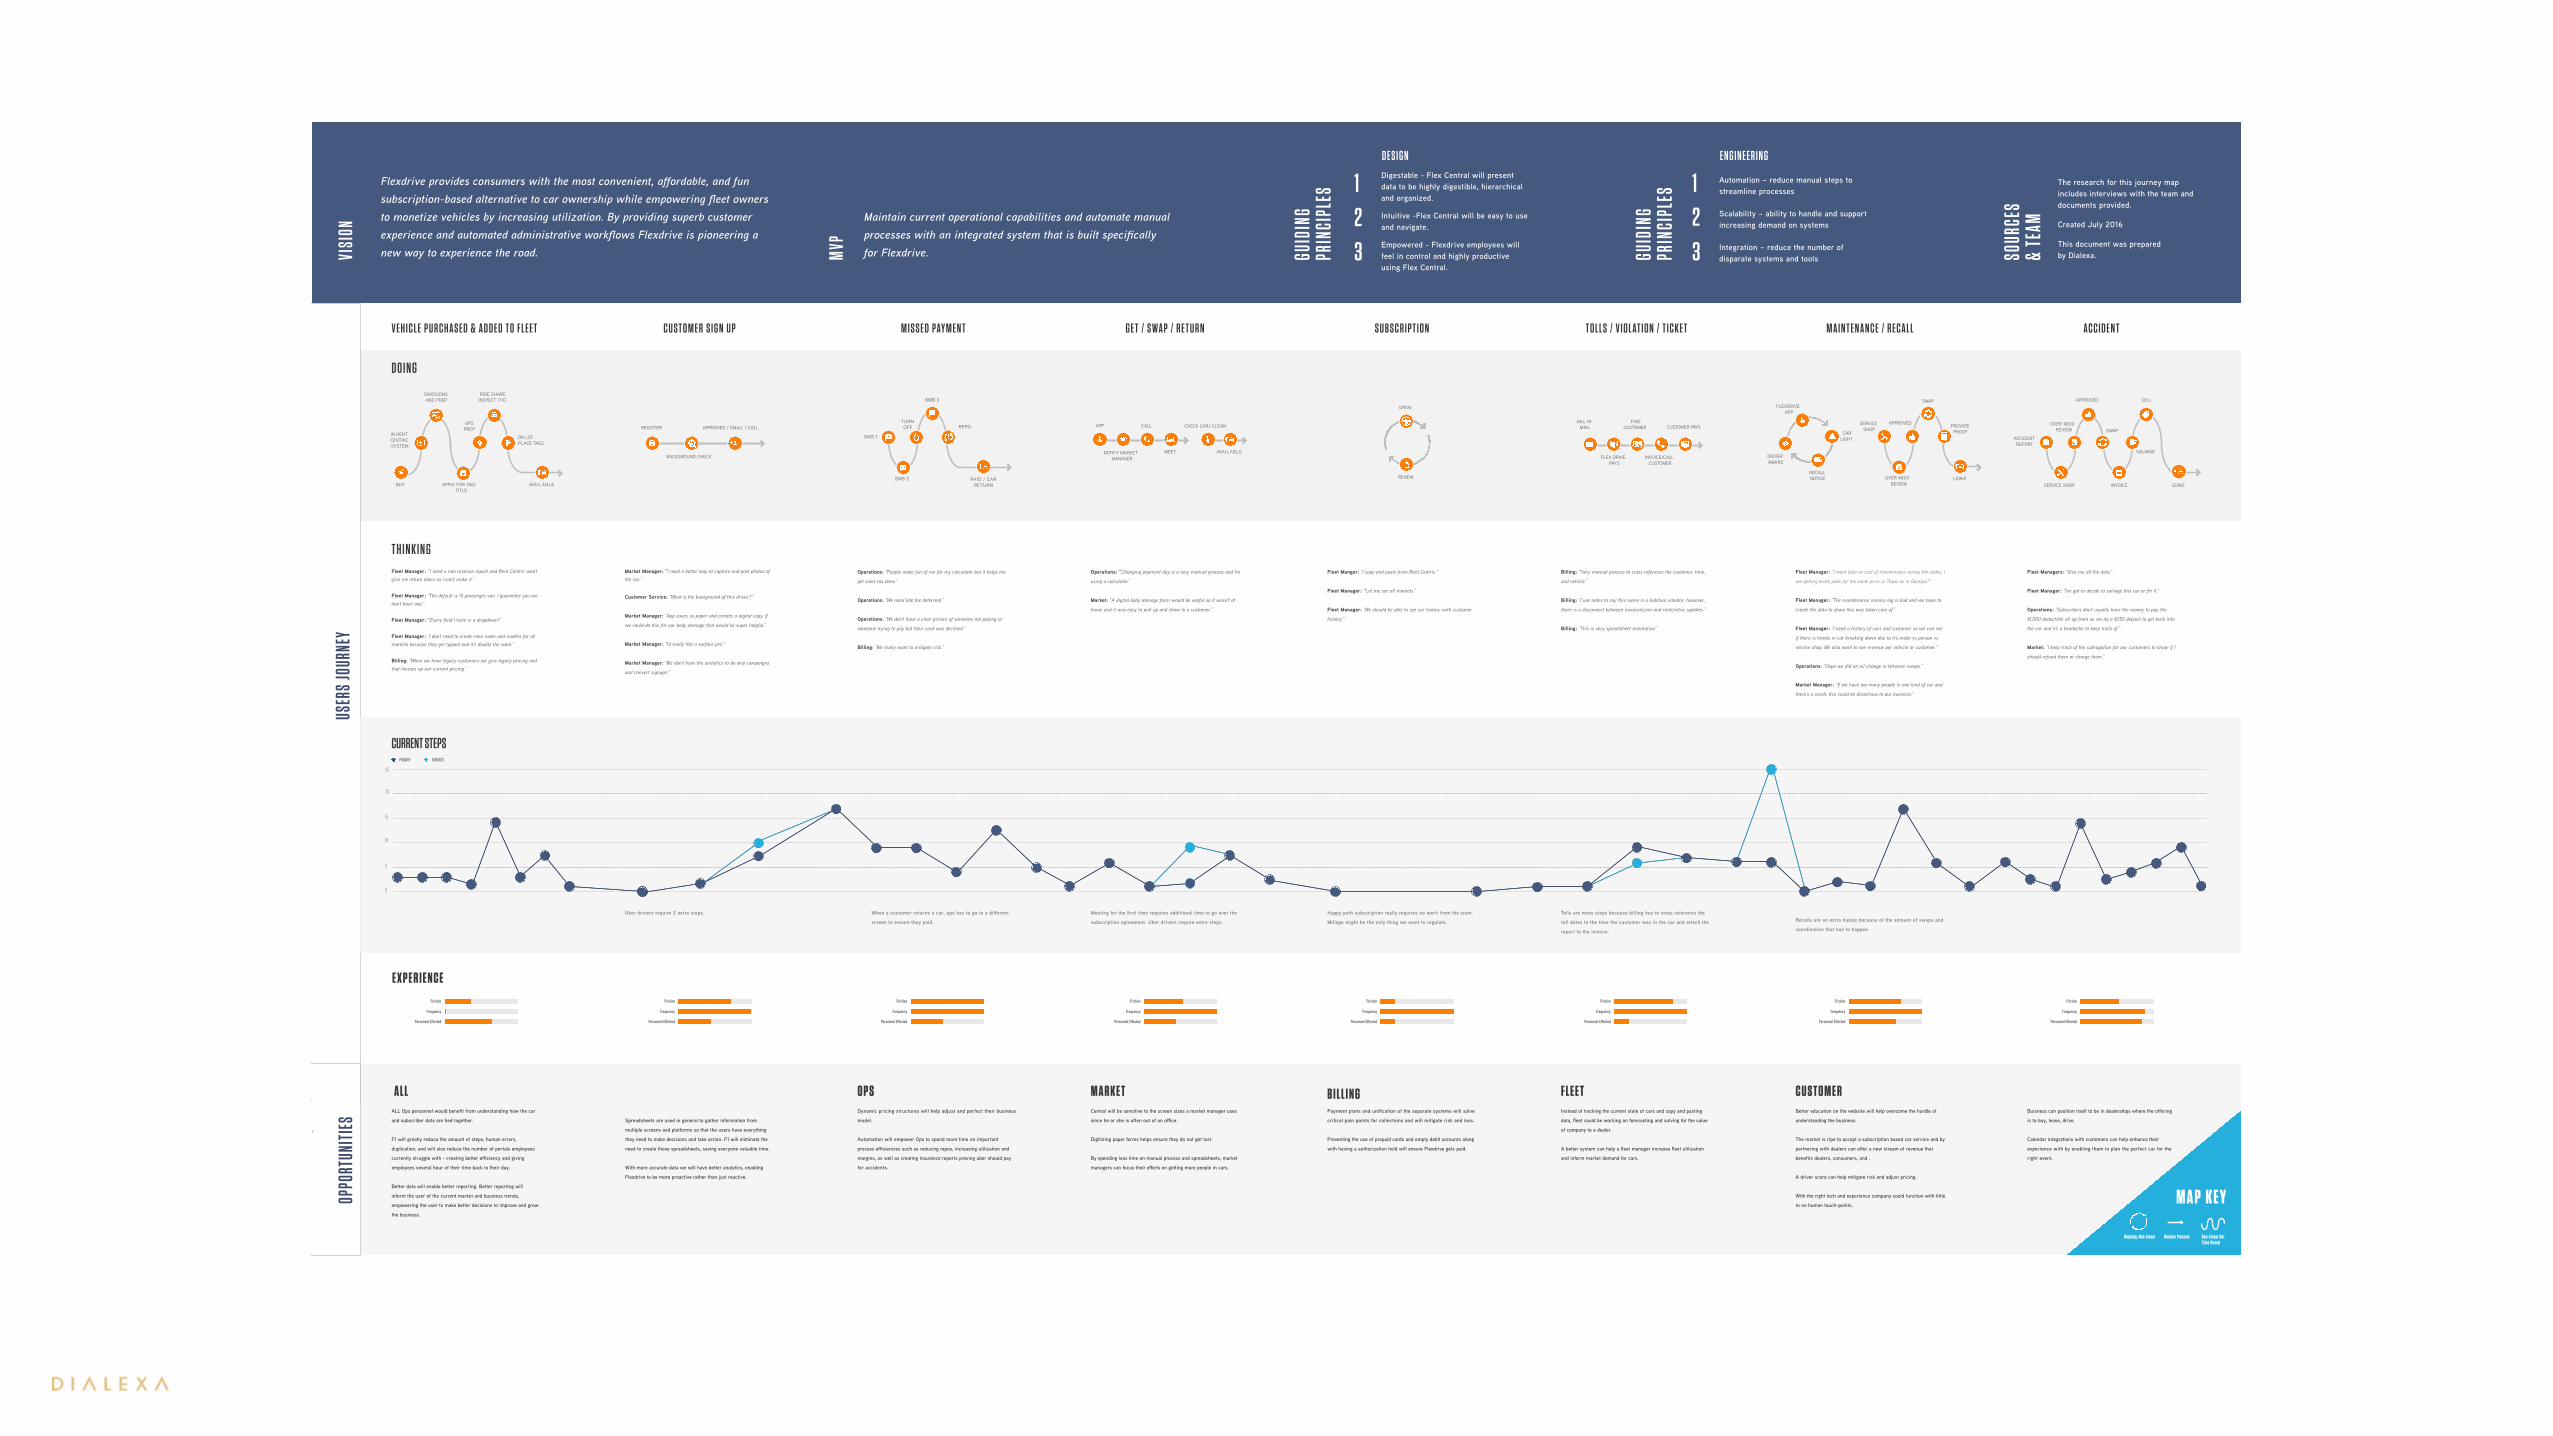
Journey MapVisualize your research
REGISTER
BACKGROUND CHECK
APPROVED / EMAIL / CALL
DRIVE
RENEW
EMISSIONS AND PREP
IN RENT CENTRIC SYSTEM
GPS PREP
RIDE SHARE INSPECT (TX)
ON LOTPLACE TAGS
AVAILABLEBUY APPLY FOR TAG/TITLE
SMS 3
SMS 1
REPOTURN OFF
PAID / CAR RETURN
SMS 2
APP
NOTIFY MARKET MANAGER
CALL
MEET
CHECK CAR/ CLEAN
AVAILABLE
BILL IN MAIL
FLEX DRIVE PAYS
FIND CUSTOMER
INVOICE/CALL CUSTOMER
CUSTOMER PAYS
APPROVED SELL
ACCIDENT REPORT
OVER $800 REVIEW SWAP
INVOICE
SALVAGE
LEAVESERVICE SHOP
FLEXDRIVEAPP
CARLIGHT
RECALL NOTICE
DRIVER AWARE
SWAP
SERVICE SHOP
PROVIDE PROOF
APPROVED
LEAVEOVER $800 REVIEW
Dynamic pricing structures will help adjust and perfect their business
model.
Automation will empower Ops to spend more time on important
process efficiencies such as reducing repos, increasing utilization and
margins, as well as creating insurance reports proving uber should pay
for accidents.
Payment plans and unification of the separate systems will solve
critical pain points for collections and will mitigate risk and loss.
Preventing the use of prepaid cards and empty debit accounts along
with having a authorization hold will ensure Flexdrive gets paid.
V E H I C L E P U R C H A S E D & A D D E D T O F L E E T C U S T O M E R S I G N U P M I S S E D PAY M E N T G E T / S WA P / R E T U R N M A I N T E N A N C E / R E C A L L
D O I N G
T O L L S / V I O L AT I O N / T I C K E TS U B S C R I P T I O N A C C I D E N T
VISI
ON
The research for this journey map includes interviews with the team and documents provided.
Created July 2016
Flexdrive provides consumers with the most convenient, affordable, and fun subscription-based alternative to car ownership while empowering fleet owners to monetize vehicles by increasing utilization. By providing superb customer experience and automated administrative workflows Flexdrive is pioneering a new way to experience the road.
Digestable - Flex Central will present data to be highly digestible, hierarchical and organized.
123
Intuitive -Flex Central will be easy to use and navigate.
Empowered - Flexdrive employees will feel in control and highly productive using Flex Central.
GUID
ING
PRIN
CIPL
ES
Automation – reduce manual steps to streamline processes
21
3
Scalability – ability to handle and support increasing demand on systems
Integration – reduce the number of disparate systems and toolsGU
IDIN
G PR
INCI
PLES
This document was prepared by Dialexa. SO
URCE
S&
TEAM
T H I N K I N GFleet Managers: “Give me all the data.”
Fleet Manager: “I’ve got to decide to salvage this car or fix it.”
Operations: “Subscribers don’t usually have the money to pay the
$1,000 deductible all up front so we do a $250 deposit to get back into
the car and it’s a headache to keep track of.”
Market: “I keep track of the subrogation for our customers to know if I
should refund them or charge them.”
Billing: “Very manual process to cross reference the customer, time,
and vehicle.”
Billing: “I use notes to say this name is a habitual viloator; however,
there is a disconnect between invoiced.com and rentcentric updates.”
Billing: “This is very spreadsheet orientation”
Fleet Manager: “I want data on cost of maintenance across the states. I
am getting brake pads for the same price in Texas as in Georgia?”
Fleet Manager: “The maintenance invoice lag is bad and we have to
create the data to show this was taken care of.”
Fleet Manager: “I need a history of cars and customer so we can see
if there is trends in car breaking down due to it’s make vs person vs
service shop. We also want to see revenue per vehicle or customer.”
Operations: “Hope we did an oil change in between swaps.”
Market Manager: “If we have too many people in one kind of car and
there’s a recall, this could be disastrous to our business.”
Fleet Manger: “I copy and paste from Rent Centric.”
Fleet Manager: “Let me see all markets.”
Fleet Manager: “We should be able to see car history with customer
history.”
Operations: “People make fun of me for my calculator but it helps me
get sales tax done.”
Operations: “We need late fee deterrent.”
Operations: “We don’t have a clear picture of someone not paying or
someone trying to pay but their card was declined.”
Billing: “We really want to mitigate risk.“
Operations: “Changing payment day is a very manual process and I’m
using a calculator.”
Market: “A digital body damage form would be useful so it wasn’t at
home and it was easy to pull up and show to a customer.”
Fleet Manager: “I need a non revenue report and Rent Centric won’t give me return dates so I can’t make it.”
Fleet Manager: “The default is 15 passenger van. I guarantee you we don’t have one.”
Fleet Manager: “Every field I have is a dropdown!”
Fleet Manager: “I don’t need to create new make and models for all markets because they get typoed and it’s double the work.”
Billing: ”When we have legacy customers we give legacy pricing and that messes up our current pricing.”
Market Manager: ”I need a better way to capture and post photos of the car.”
Customer Service: “What is the background of this driver?”
Market Manager: “App saves us paper and creates a digital copy. If
we could do this for our body damage that would be super helpful.”
Market Manager: “I’d really like a surface pro.”
Market Manager: “We don’t have the analytics to do drip campaigns
and convert signups.”
Friction
Frequency
Personnel Effected
Friction
Frequency
Personnel Effected
Friction
Frequency
Personnel Effected
Friction
Frequency
Personnel Effected
Friction
Frequency
Personnel Effected
Friction
Frequency
Personnel Effected
Friction
Frequency
Personnel Effected
Friction
Frequency
Personnel Effected
USER
S JOU
RNEY
OP
PORT
UNIT
IES
A L L O P S
E X P E R I E N C E
M A R K E TCentral will be sensitive to the screen sizes a market manager uses
since he or she is often out of an office.
Digitizing paper forms helps ensure they do not get lost.
By spending less time on manual process and spreadsheets, market
managers can focus their efforts on getting more people in cars.
Instead of tracking the current state of cars and copy and pasting
data, fleet could be working on forecasting and solving for the value
of company to a dealer.
A better system can help a fleet manager increase fleet utilization
and inform market demand for cars.
Better education on the website will help overcome the hurdle of
understanding the business.
The market is ripe to accept a subscription based car service and by
partnering with dealers can offer a new stream of revenue that
benefits dealers, consumers, and .
A driver score can help mitigate risk and adjust pricing.
With the right tech and experience company could function with little
to no human touch-points.
Buisness can position itself to be in dealerships where the offering
is to buy, lease, drive.
Calendar integrations with customers can help enhance their
experience with by enabling them to plan the perfect car for the
right event.
ALL Ops personnel would benefit from understanding how the car
and subscriber data are tied together.
F1 will greatly reduce the amount of steps, human errors,
duplication, and will also reduce the number of portals employees
currently struggle with - creating better efficiency and giving
employees several hour of their time back to their day.
Better data will enable better reporting. Better reporting will
inform the user of the current market and business trends,
empowering the user to make better decisions to improve and grow
the business.
Spreadsheets are used in general to gather information from
multiple screens and platforms so that the users have everything
they need to make decisions and take action. F1 will eliminate the
need to create those spreadsheets, saving everyone valuable time.
With more accurate data we will have better analytics, enabling
Flexdrive to be more proactive rather than just reactive.
B I L L I N G F L E E T C U S T O M E R
MVP
Maintain current operational capabilities and automate manual processes with an integrated system that is built specifically for Flexdrive.
Meeting for the first time requires additional time to go over the
subscription agreement. Uber drivers require extra steps.
When a customer returns a car, ops has to go to a different
screen to ensure they paid.
Uber drivers require 2 extra steps. Tolls are more steps because billing has to cross reference the
toll dates to the time the customer was in the car and attach the
report to the invoice.
Recalls are an extra hassle because of the amount of swaps and
coordination that has to happen.
Happy path subscription really requires no work from the team.
Millage might be the only thing we want to regulate.
CURRENT STEPSPRIMARY VARIANTS
0
25
15
20
5
10
E N G I N E E R I N GD E S I G N
M A P K E Y
Ongoing, Non-Linear Unclear Process Non-Linear but Time-Based

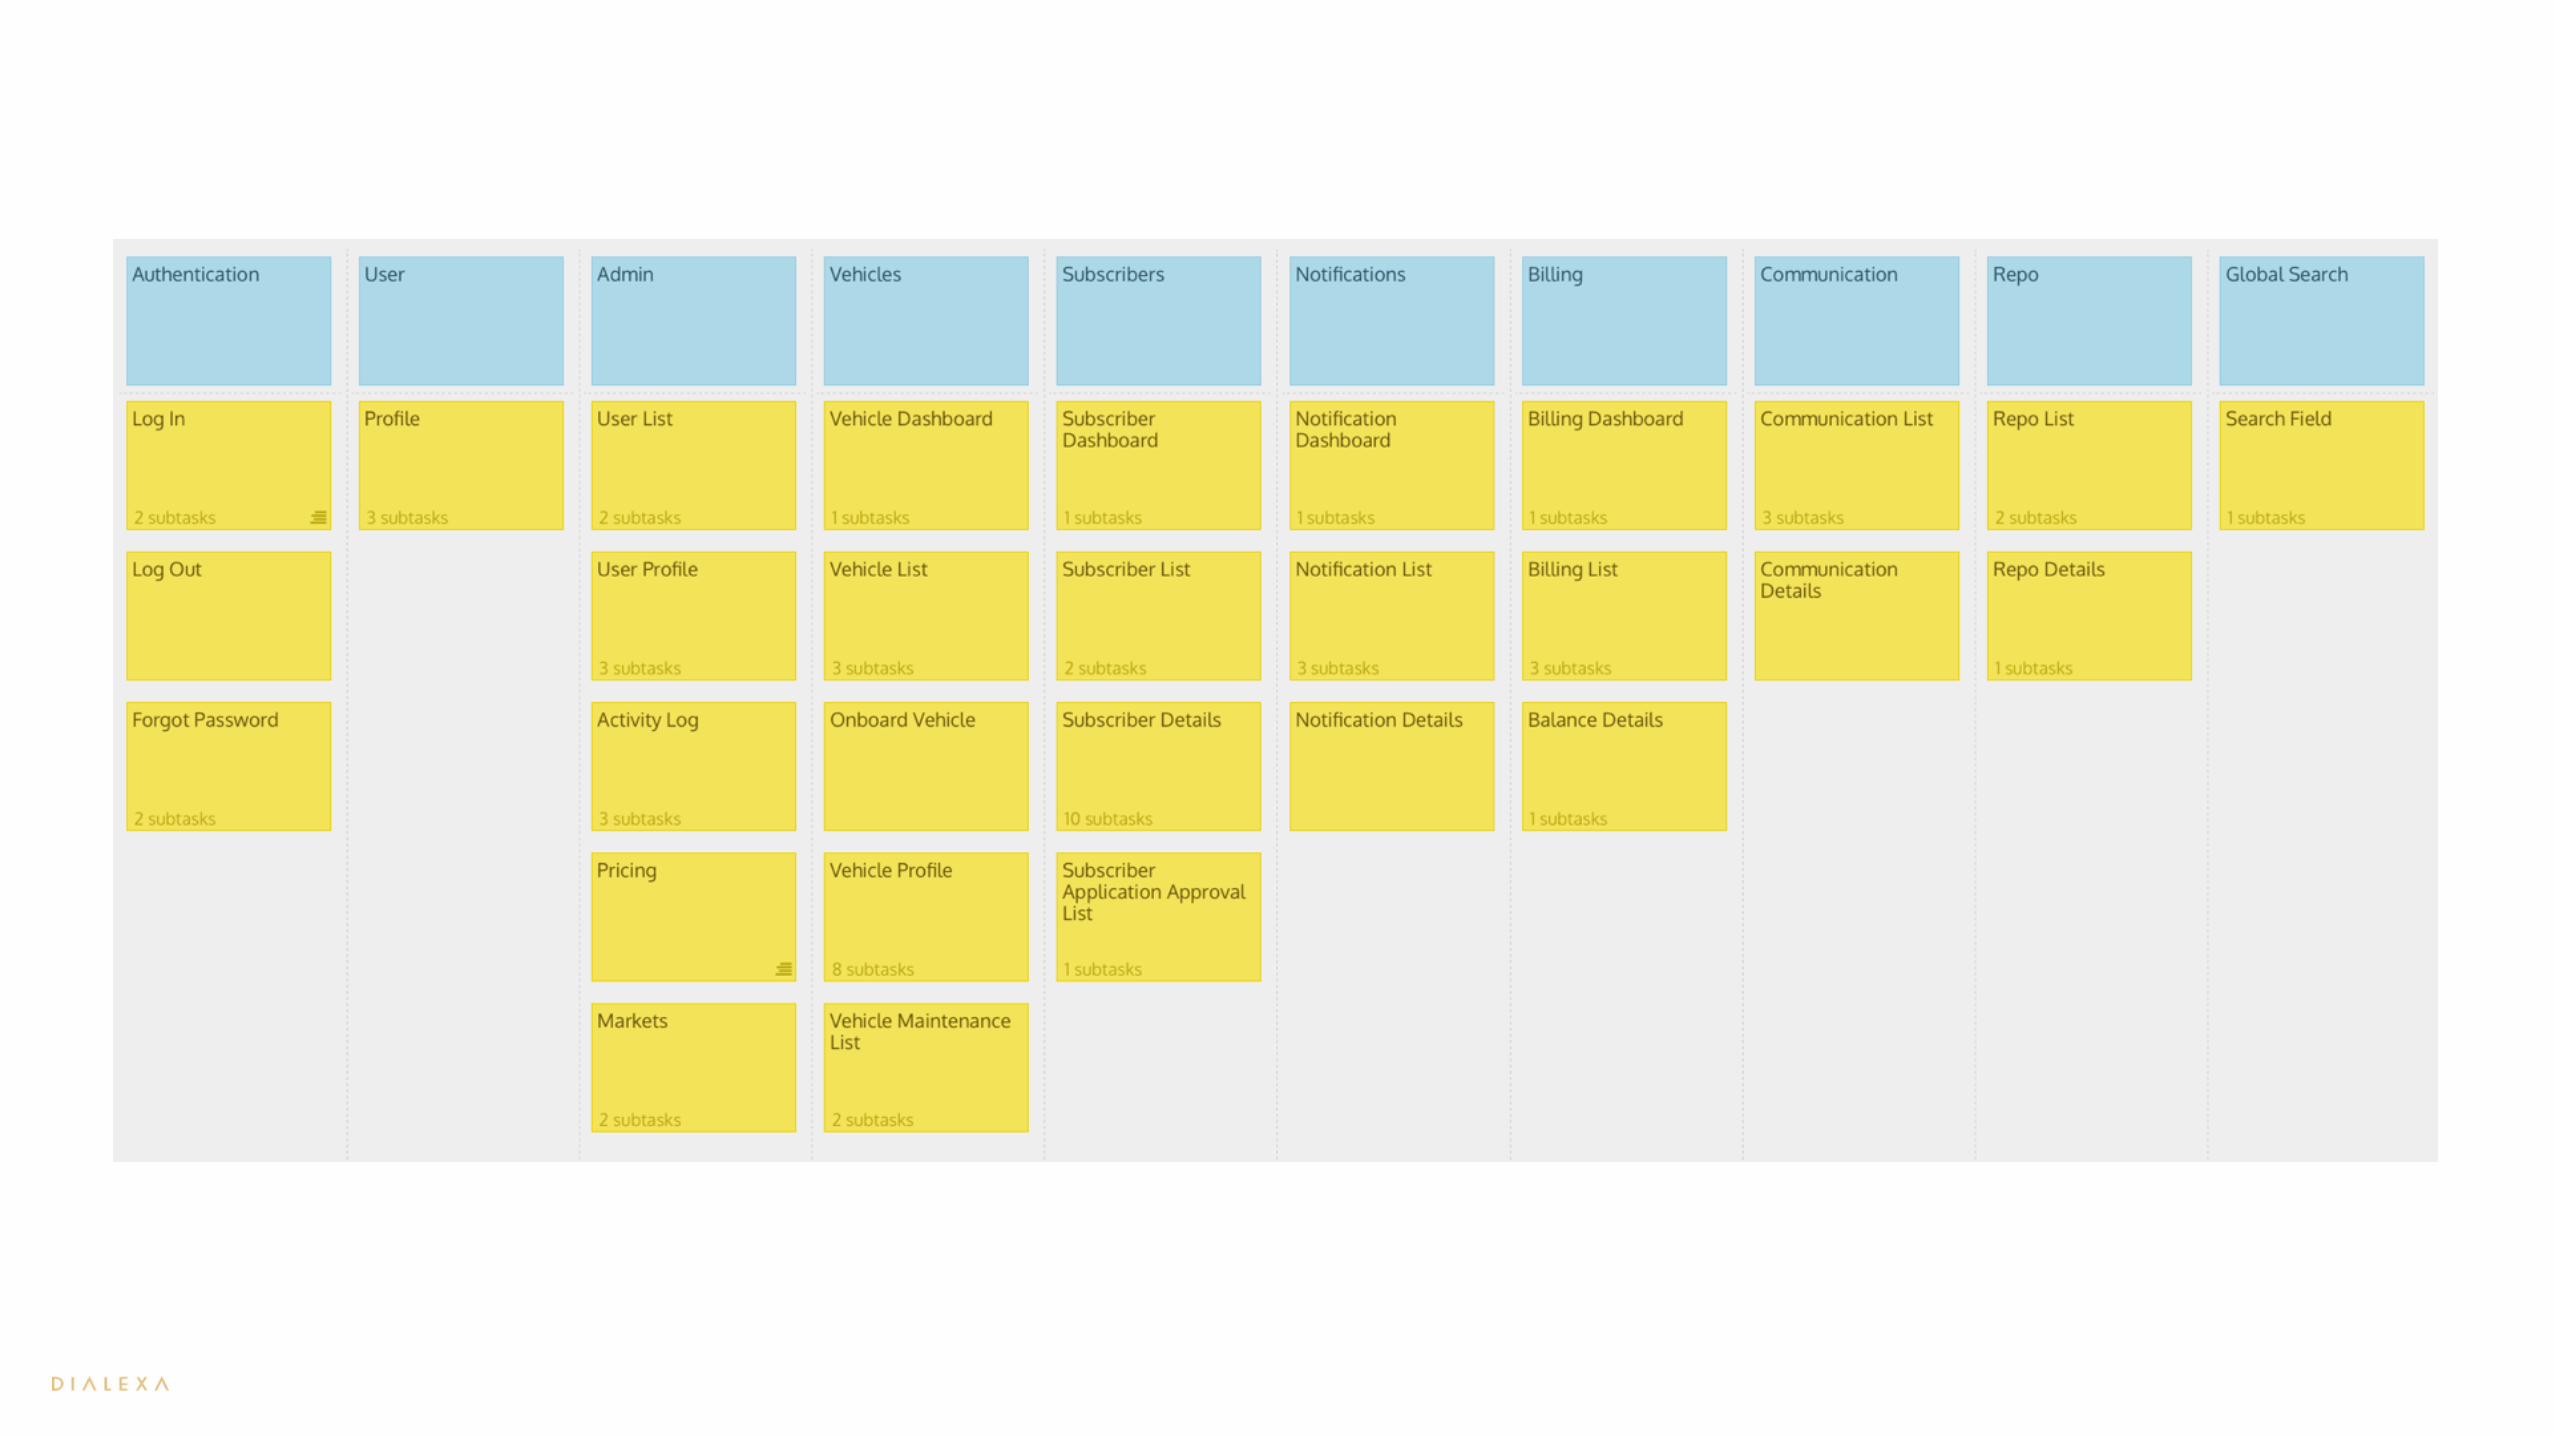
Story MappingA user story I can understand
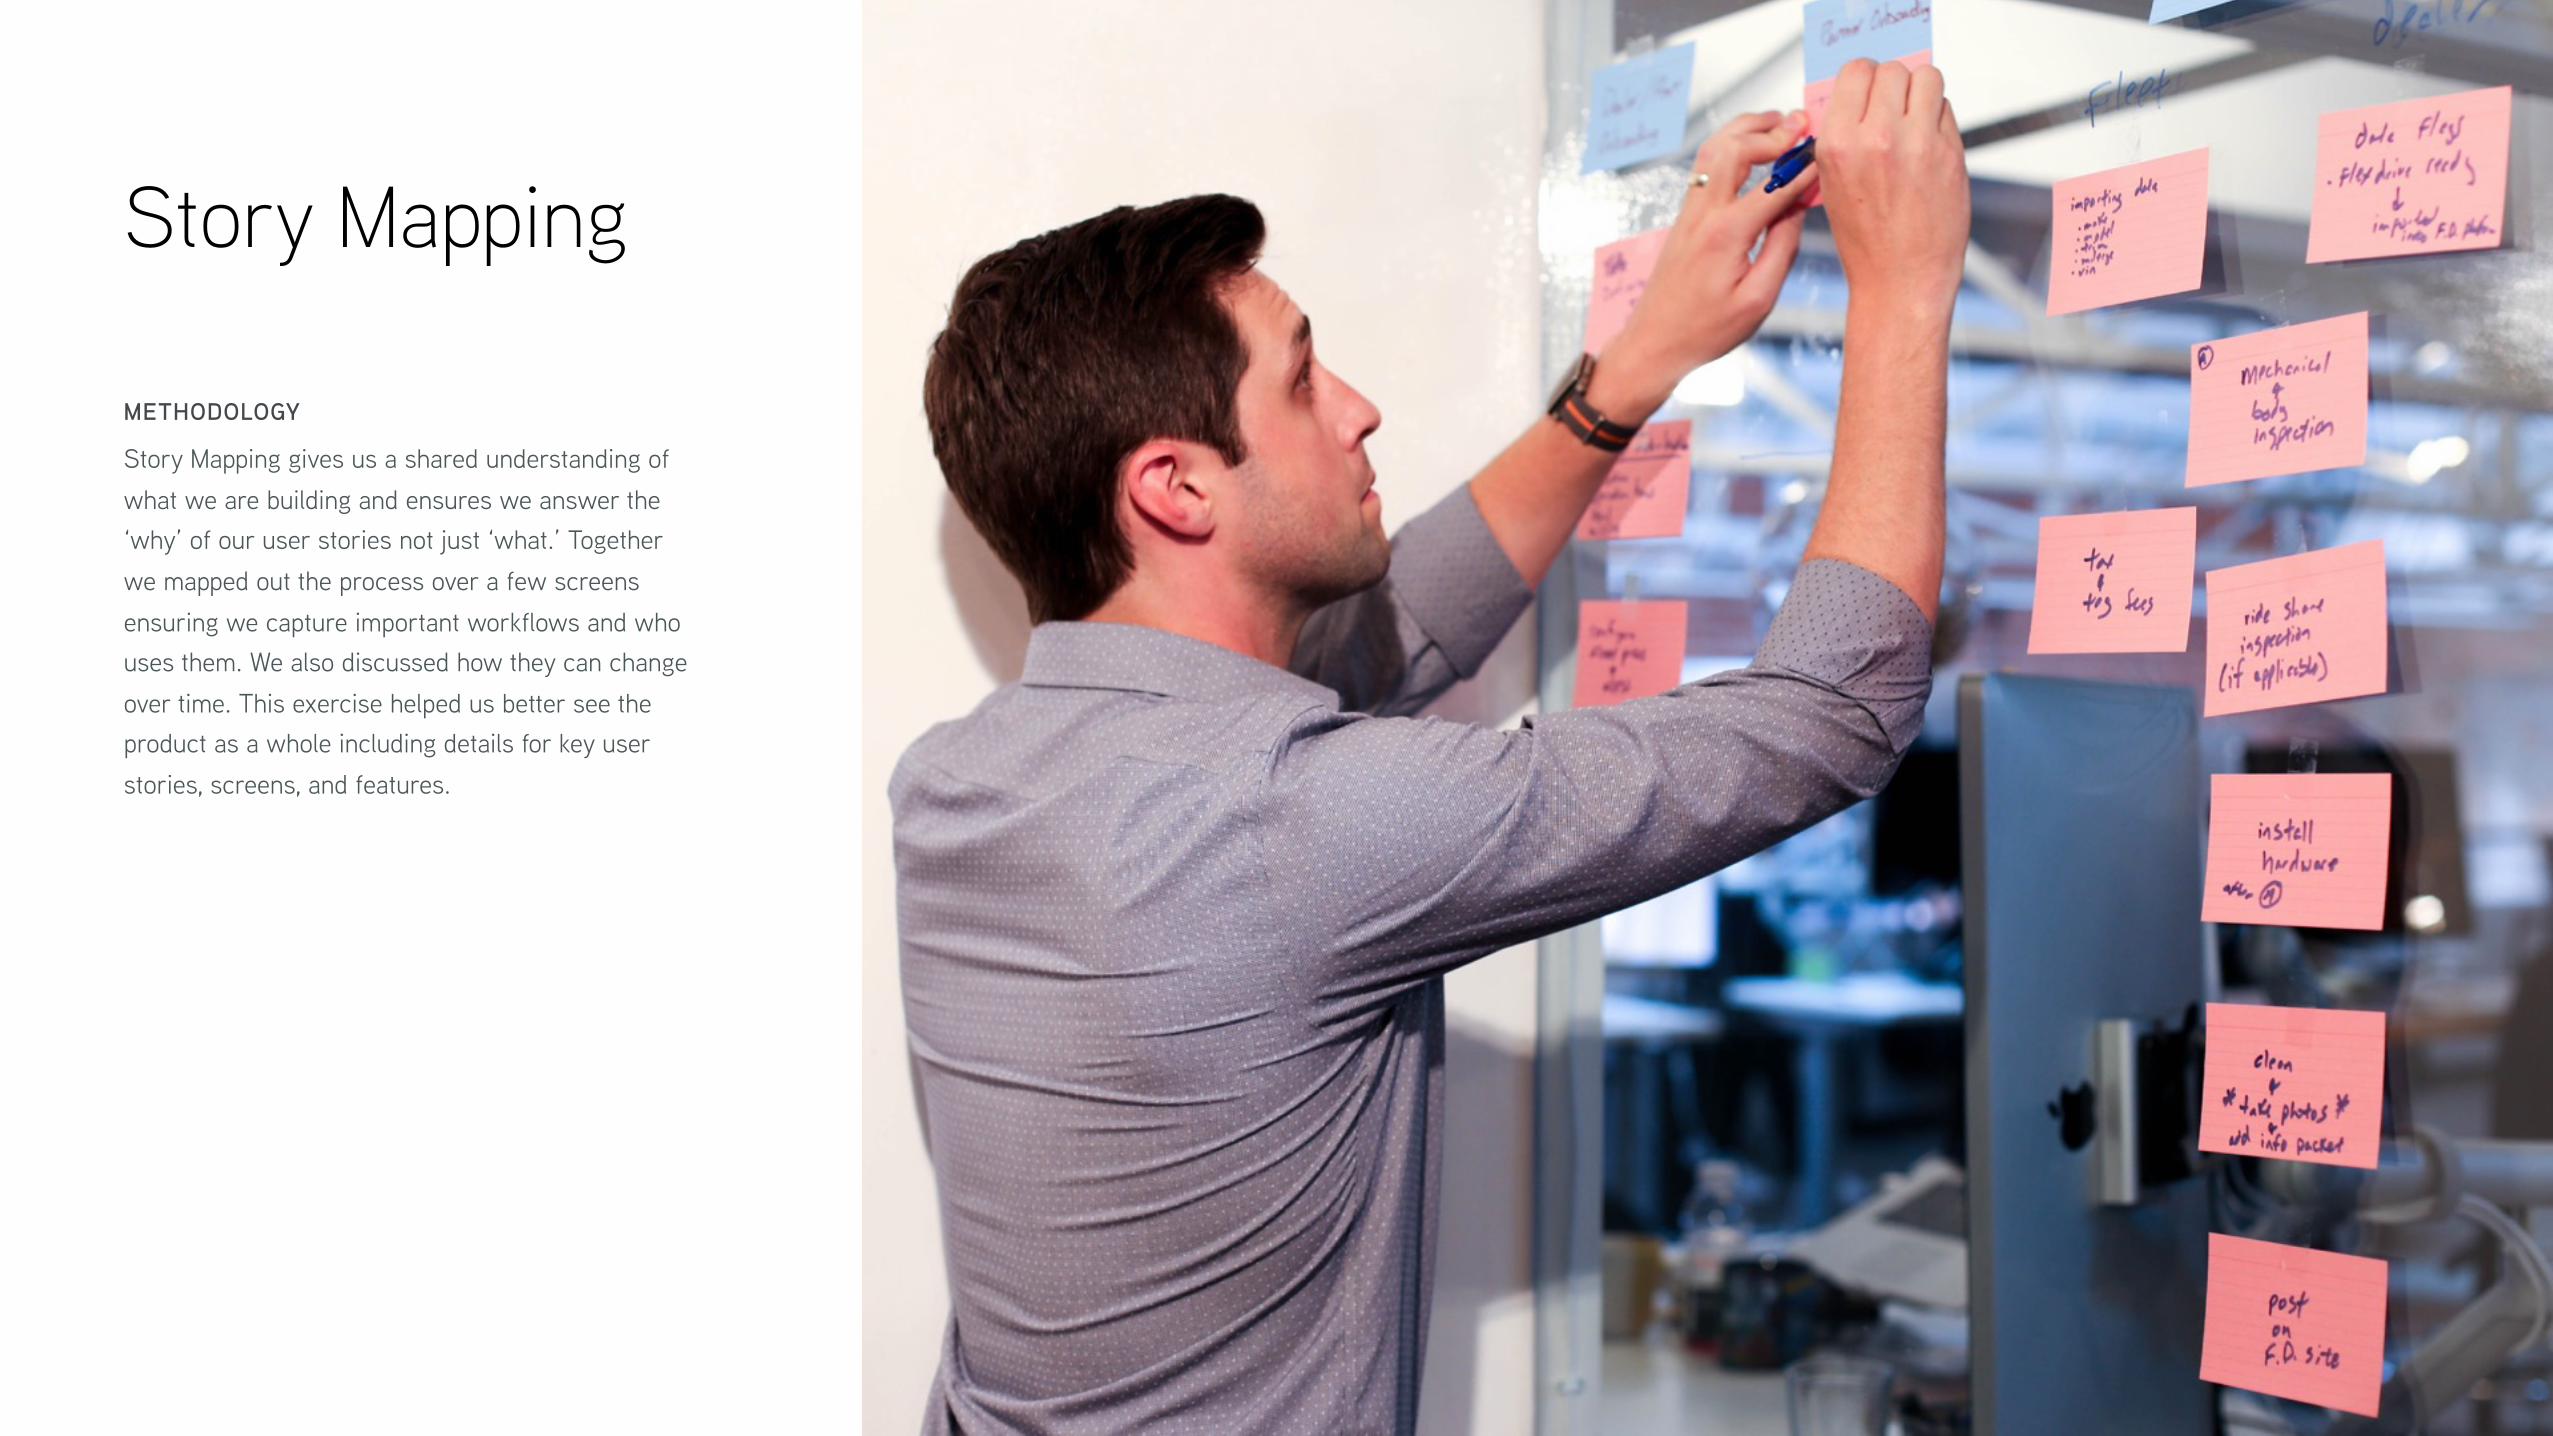
Story Mapping
METHODOLOGY
Story Mapping gives us a shared understanding of
what we are building and ensures we answer the
‘why’ of our user stories not just ‘what.’ Together
we mapped out the process over a few screens
ensuring we capture important workflows and who
uses them. We also discussed how they can change
over time. This exercise helped us better see the
product as a whole including details for key user
stories, screens, and features.
Place Picture Here

Test What You Put Out There

Growth HackingFor all the beautiful data nerds
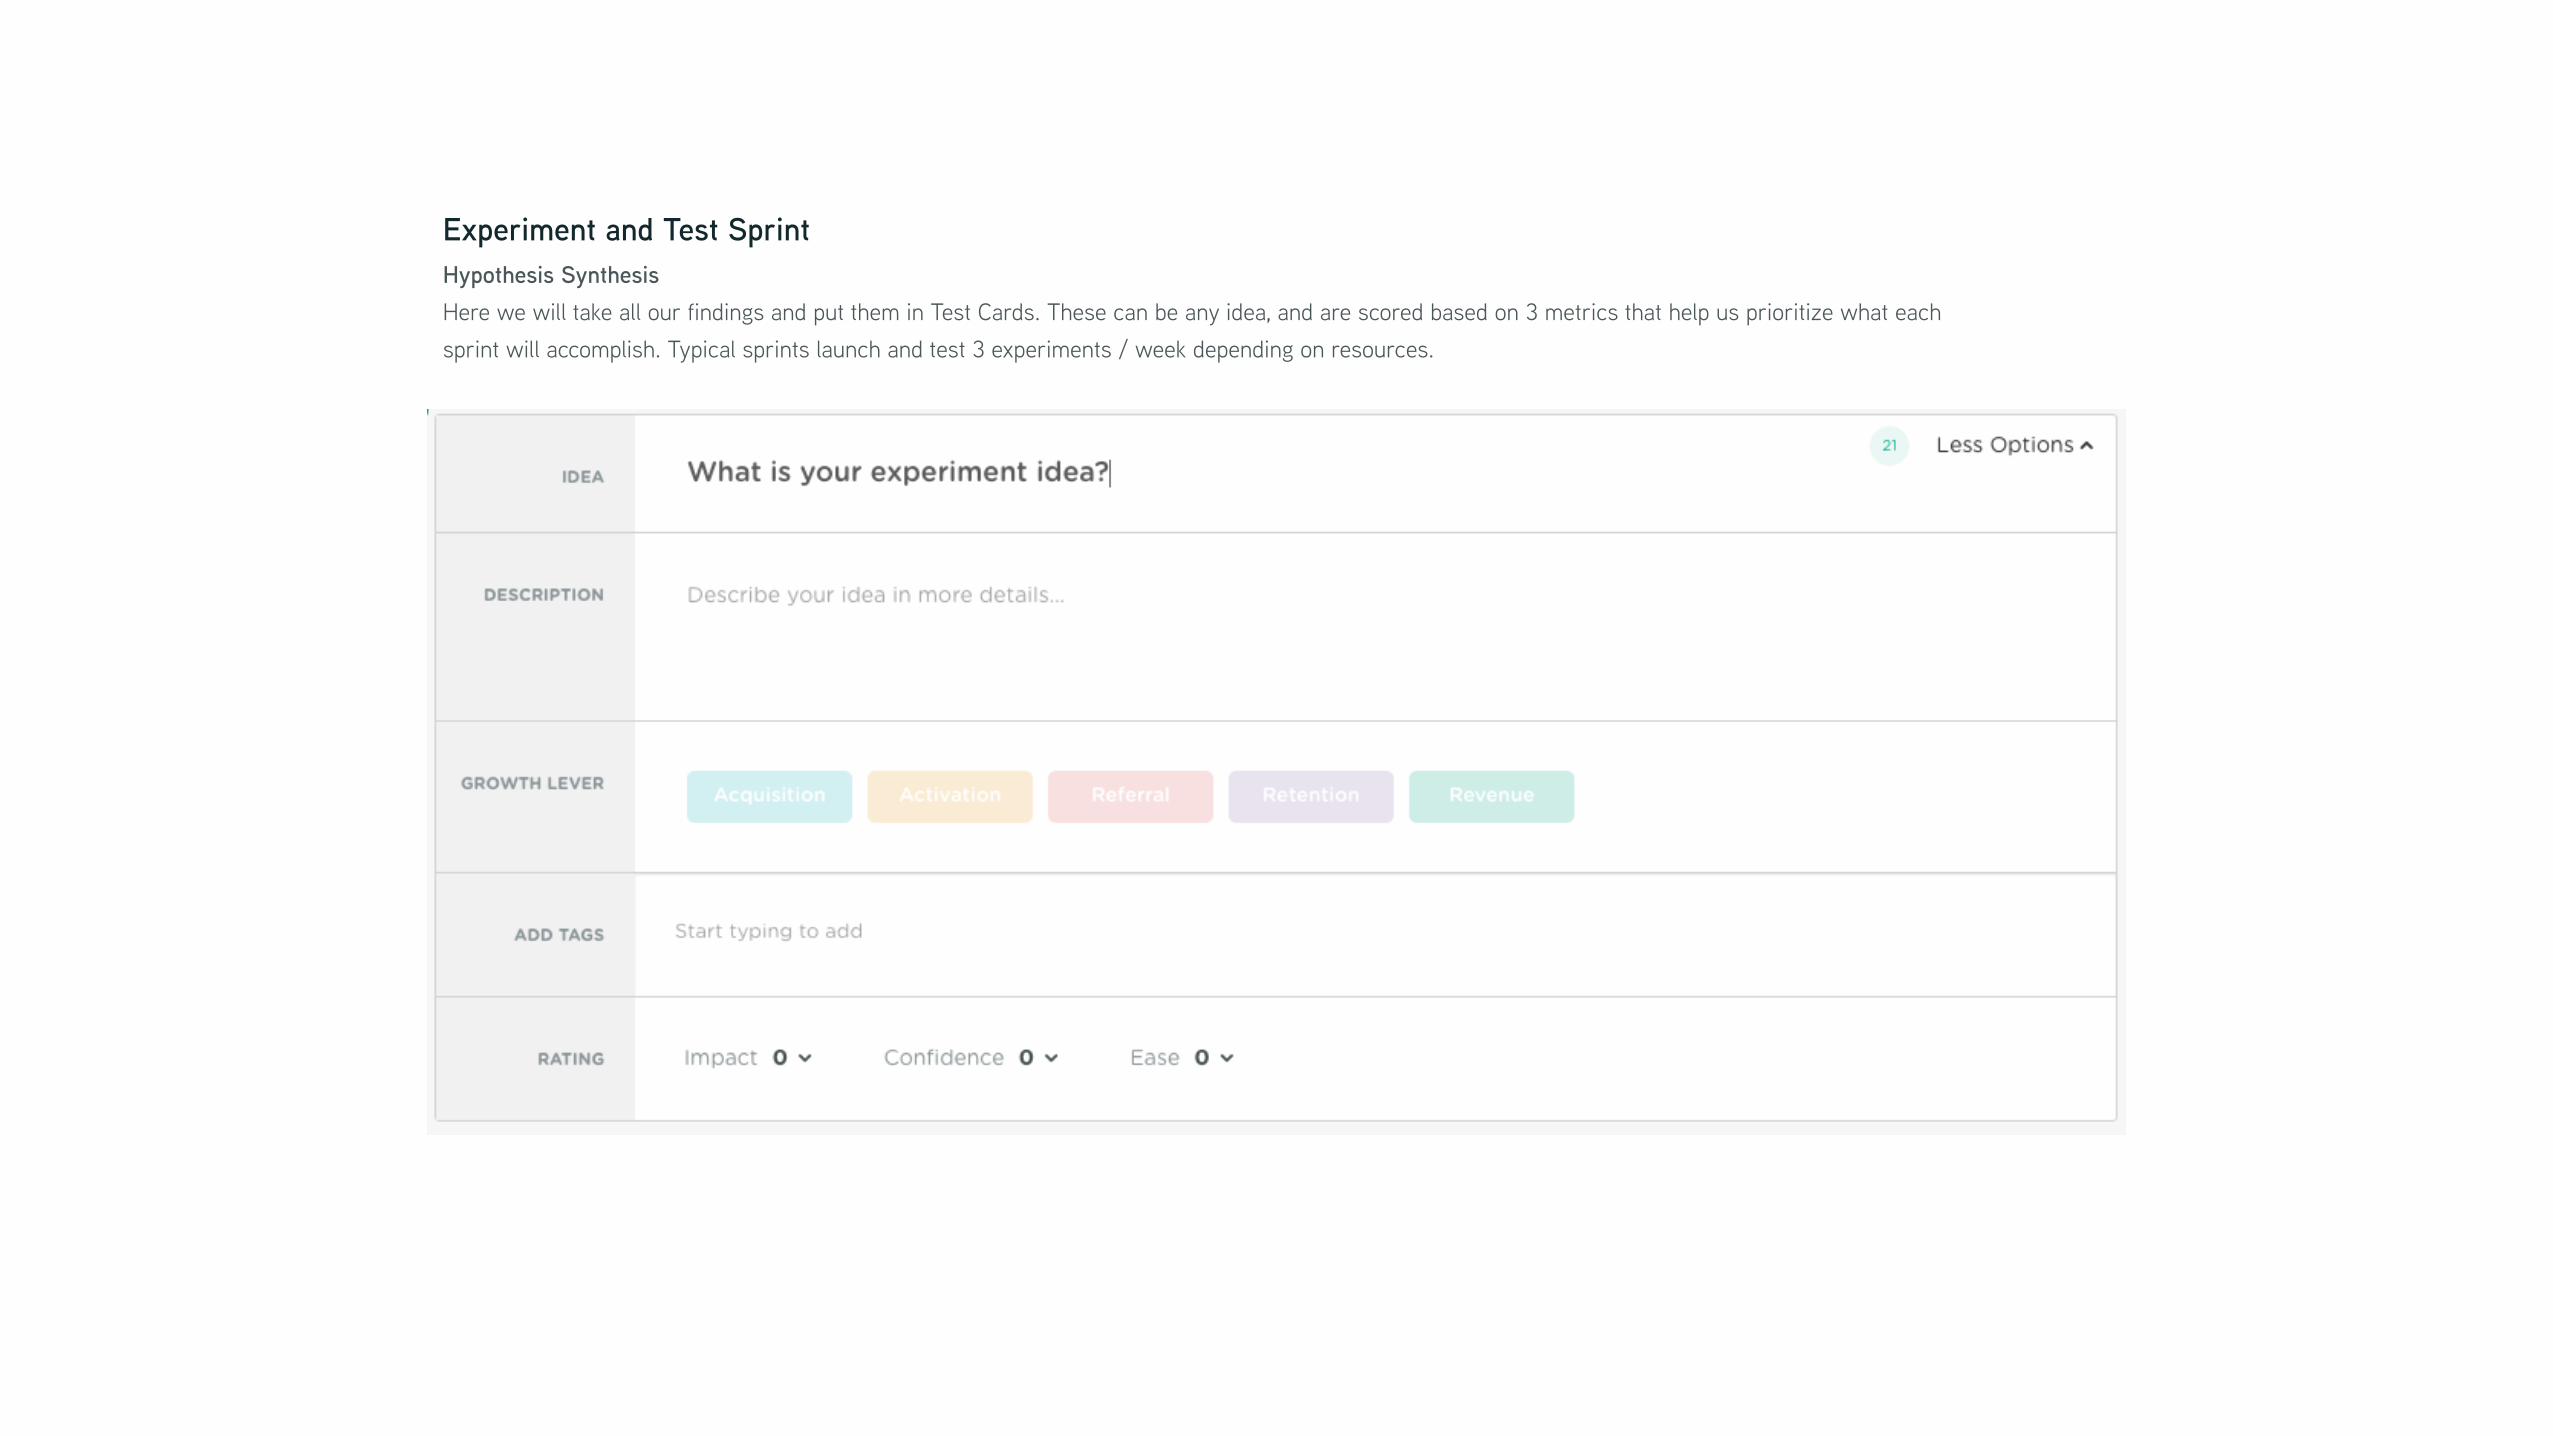
Experiment and Test Sprint
Hypothesis Synthesis
Here we will take all our findings and put them in Test Cards. These can be any idea, and are scored based on 3 metrics that help us prioritize what each
sprint will accomplish. Typical sprints launch and test 3 experiments / week depending on resources.
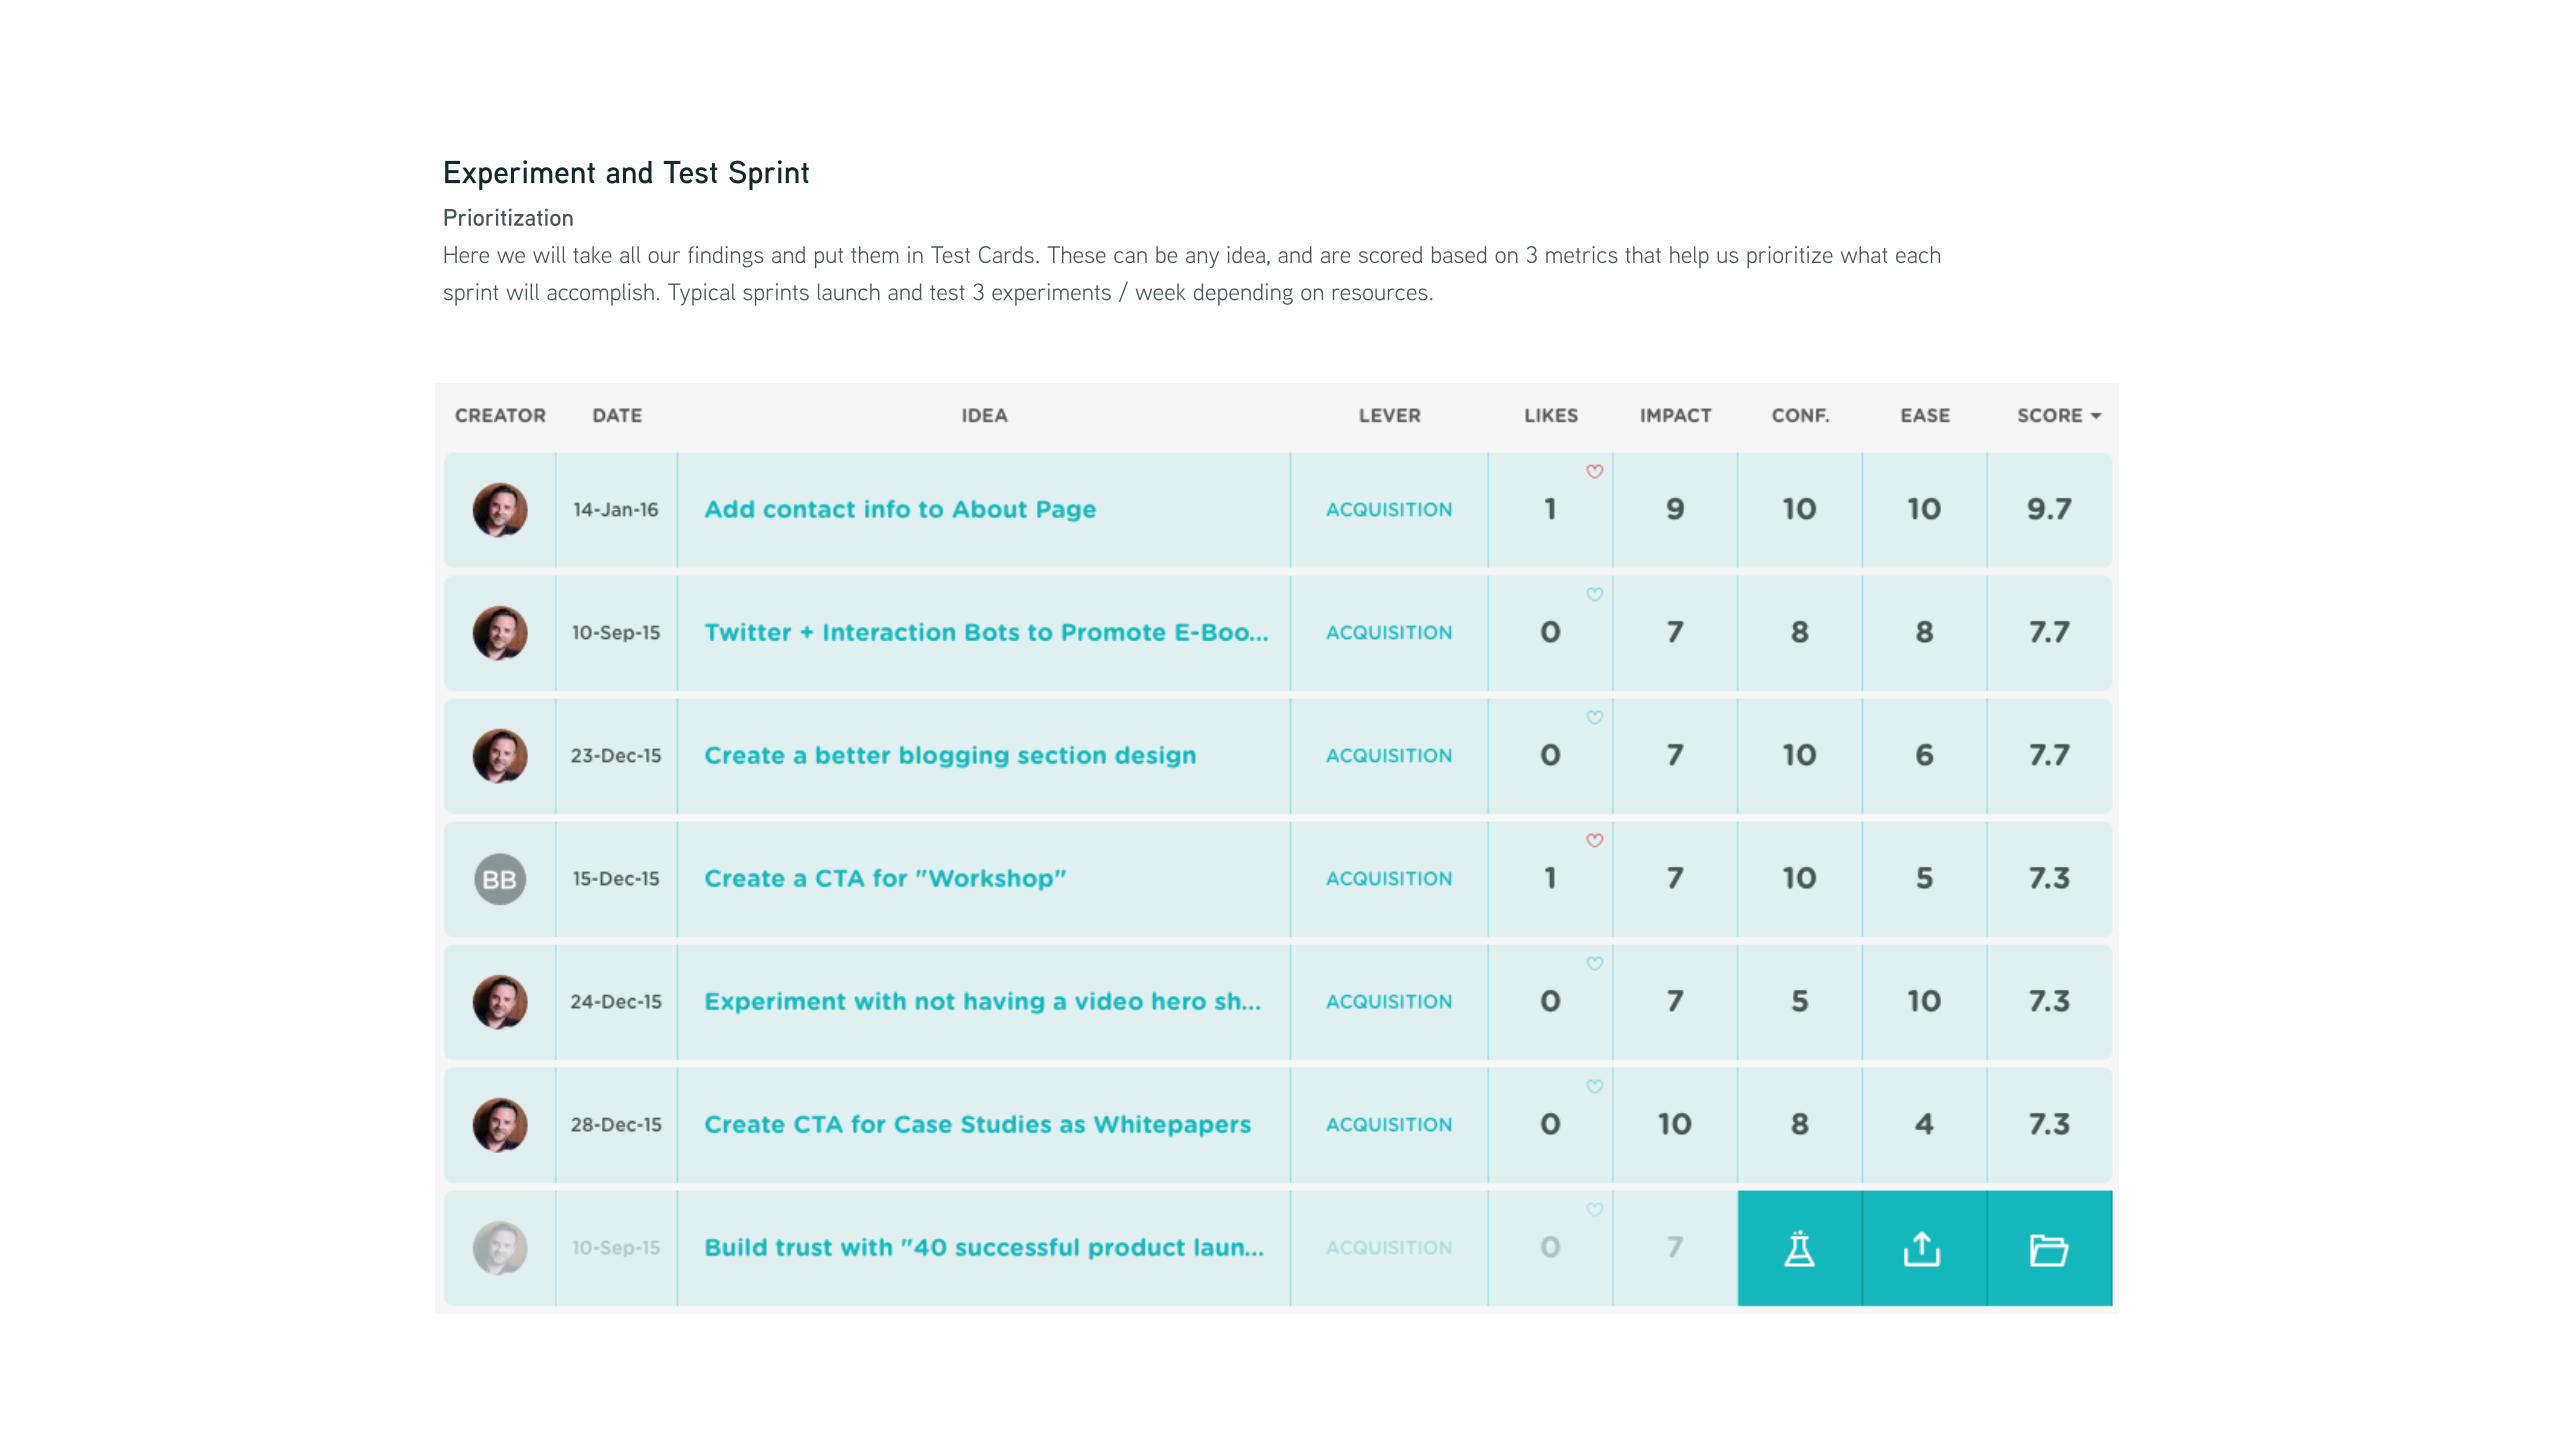
Experiment and Test Sprint
Prioritization
Here we will take all our findings and put them in Test Cards. These can be any idea, and are scored based on 3 metrics that help us prioritize what each
sprint will accomplish. Typical sprints launch and test 3 experiments / week depending on resources.
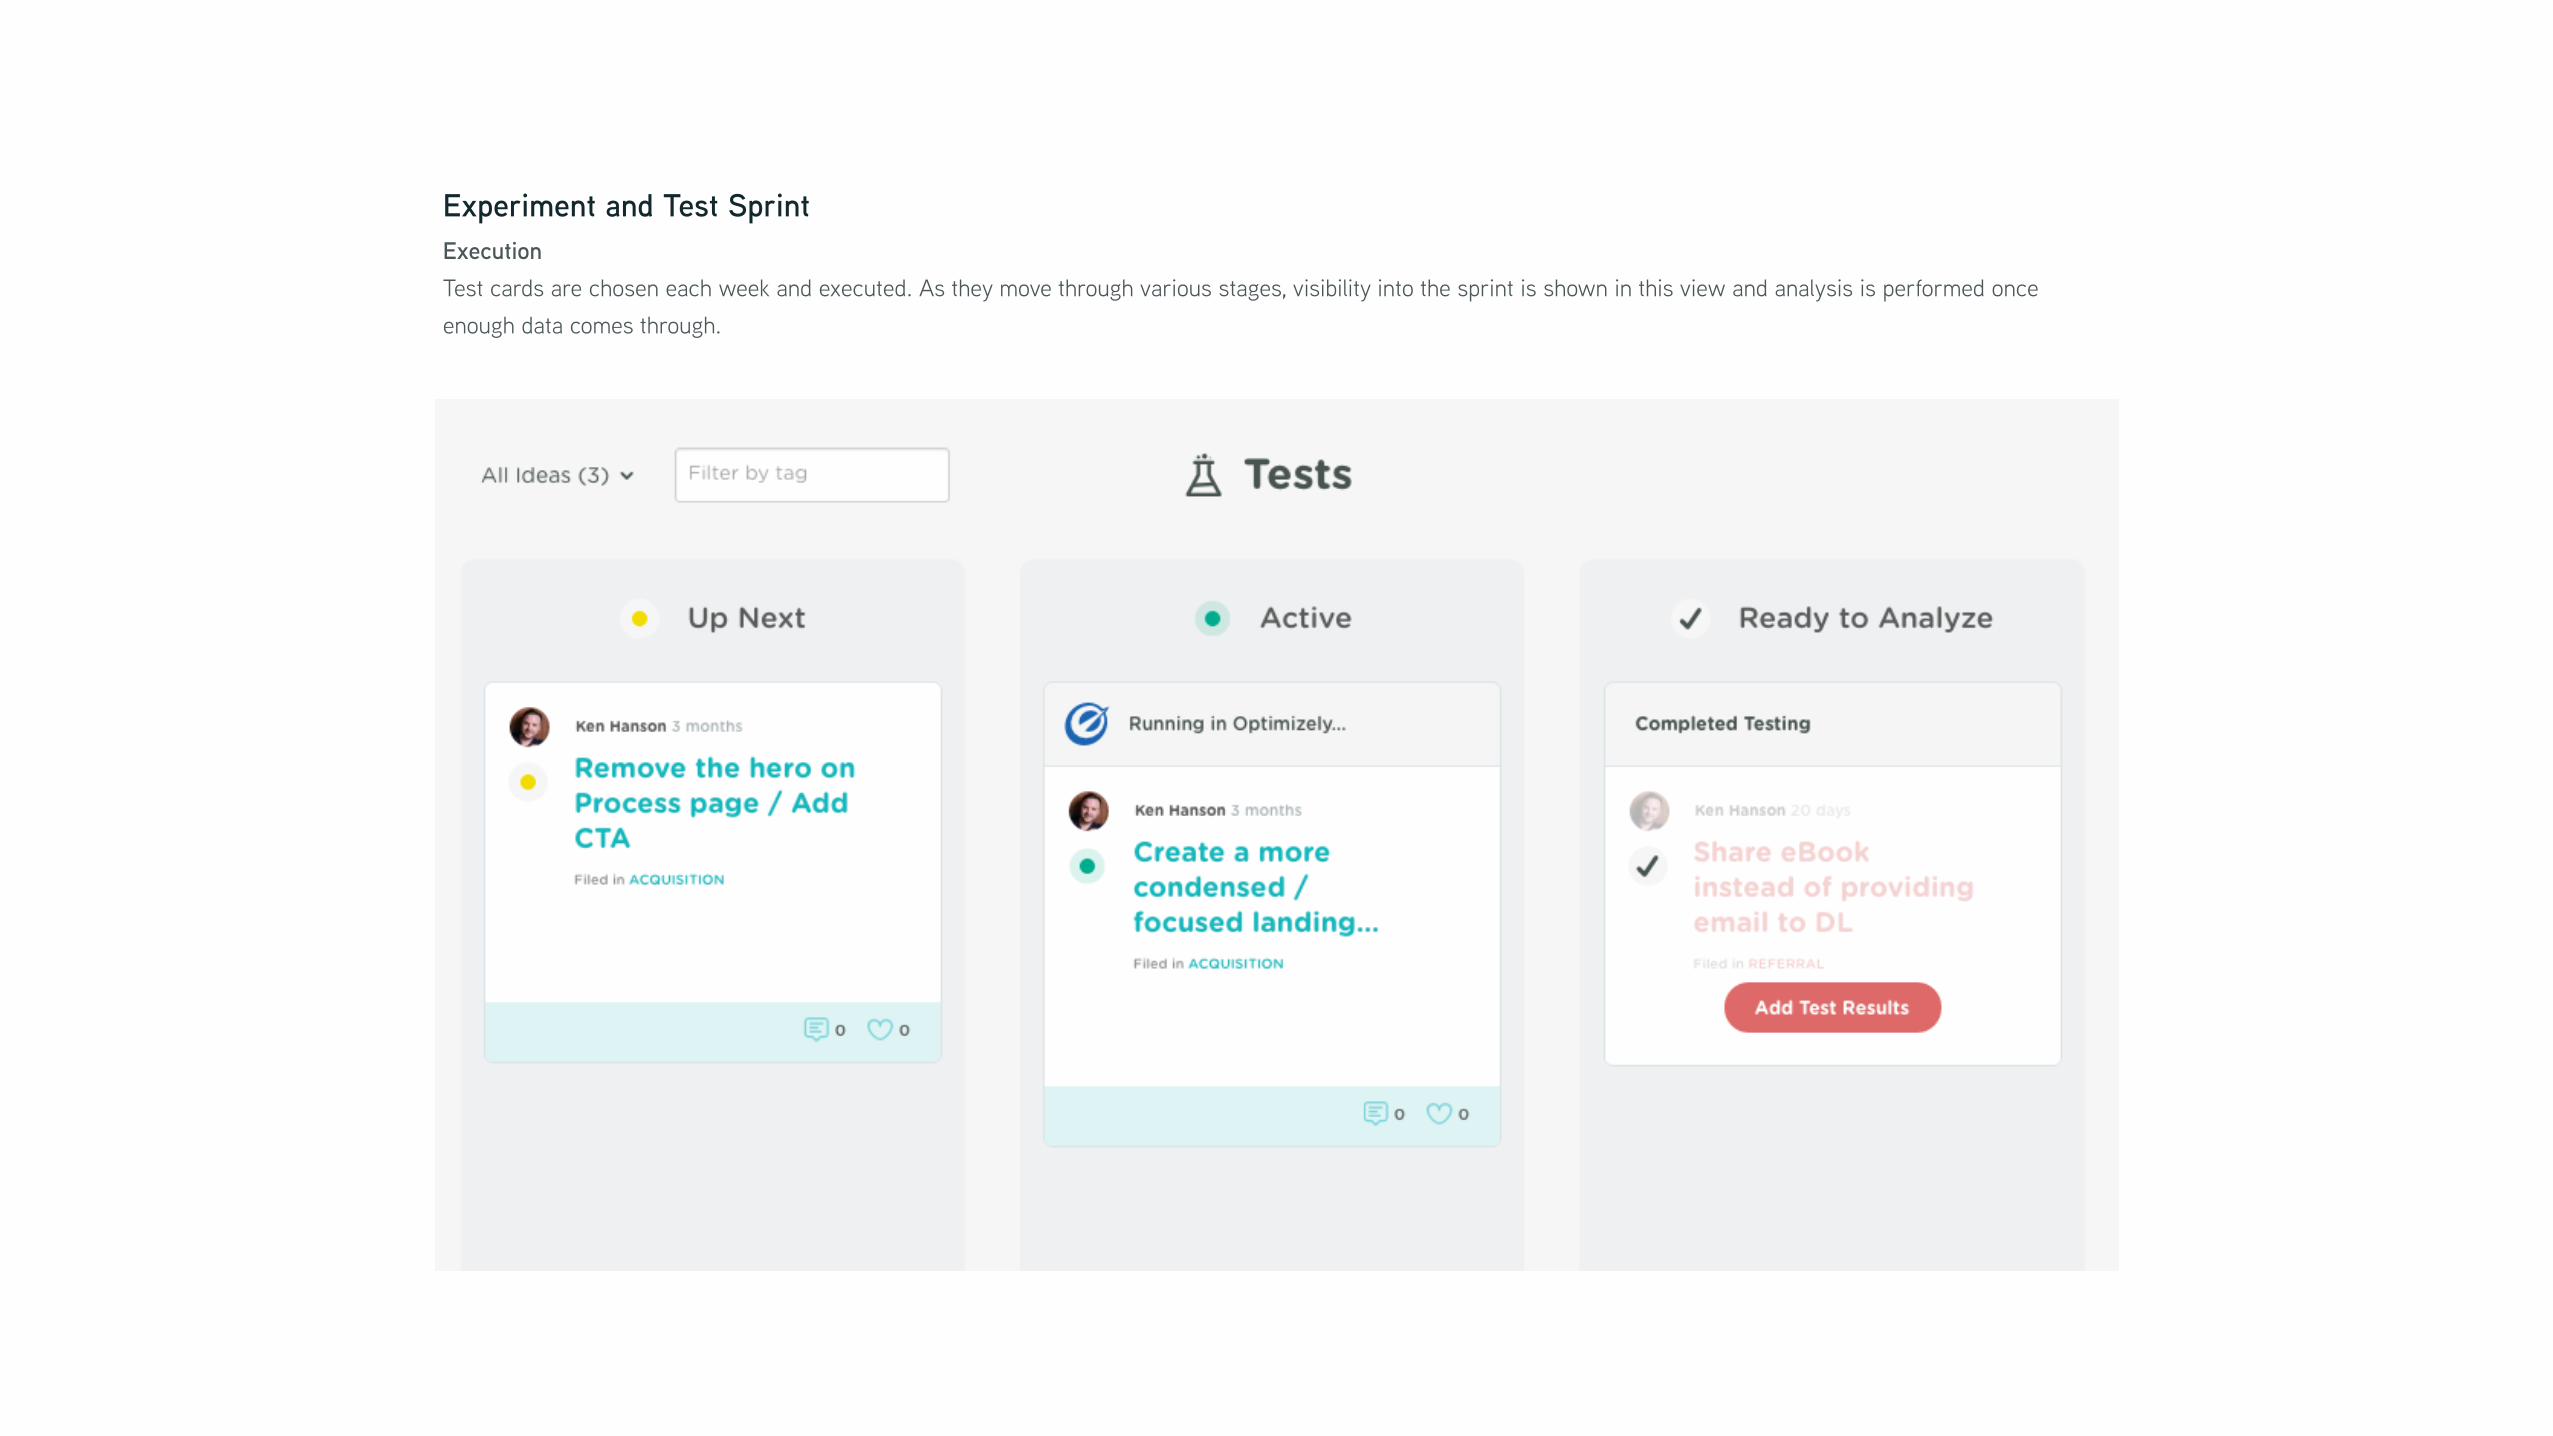
Experiment and Test Sprint
Execution
Test cards are chosen each week and executed. As they move through various stages, visibility into the sprint is shown in this view and analysis is performed once
enough data comes through.
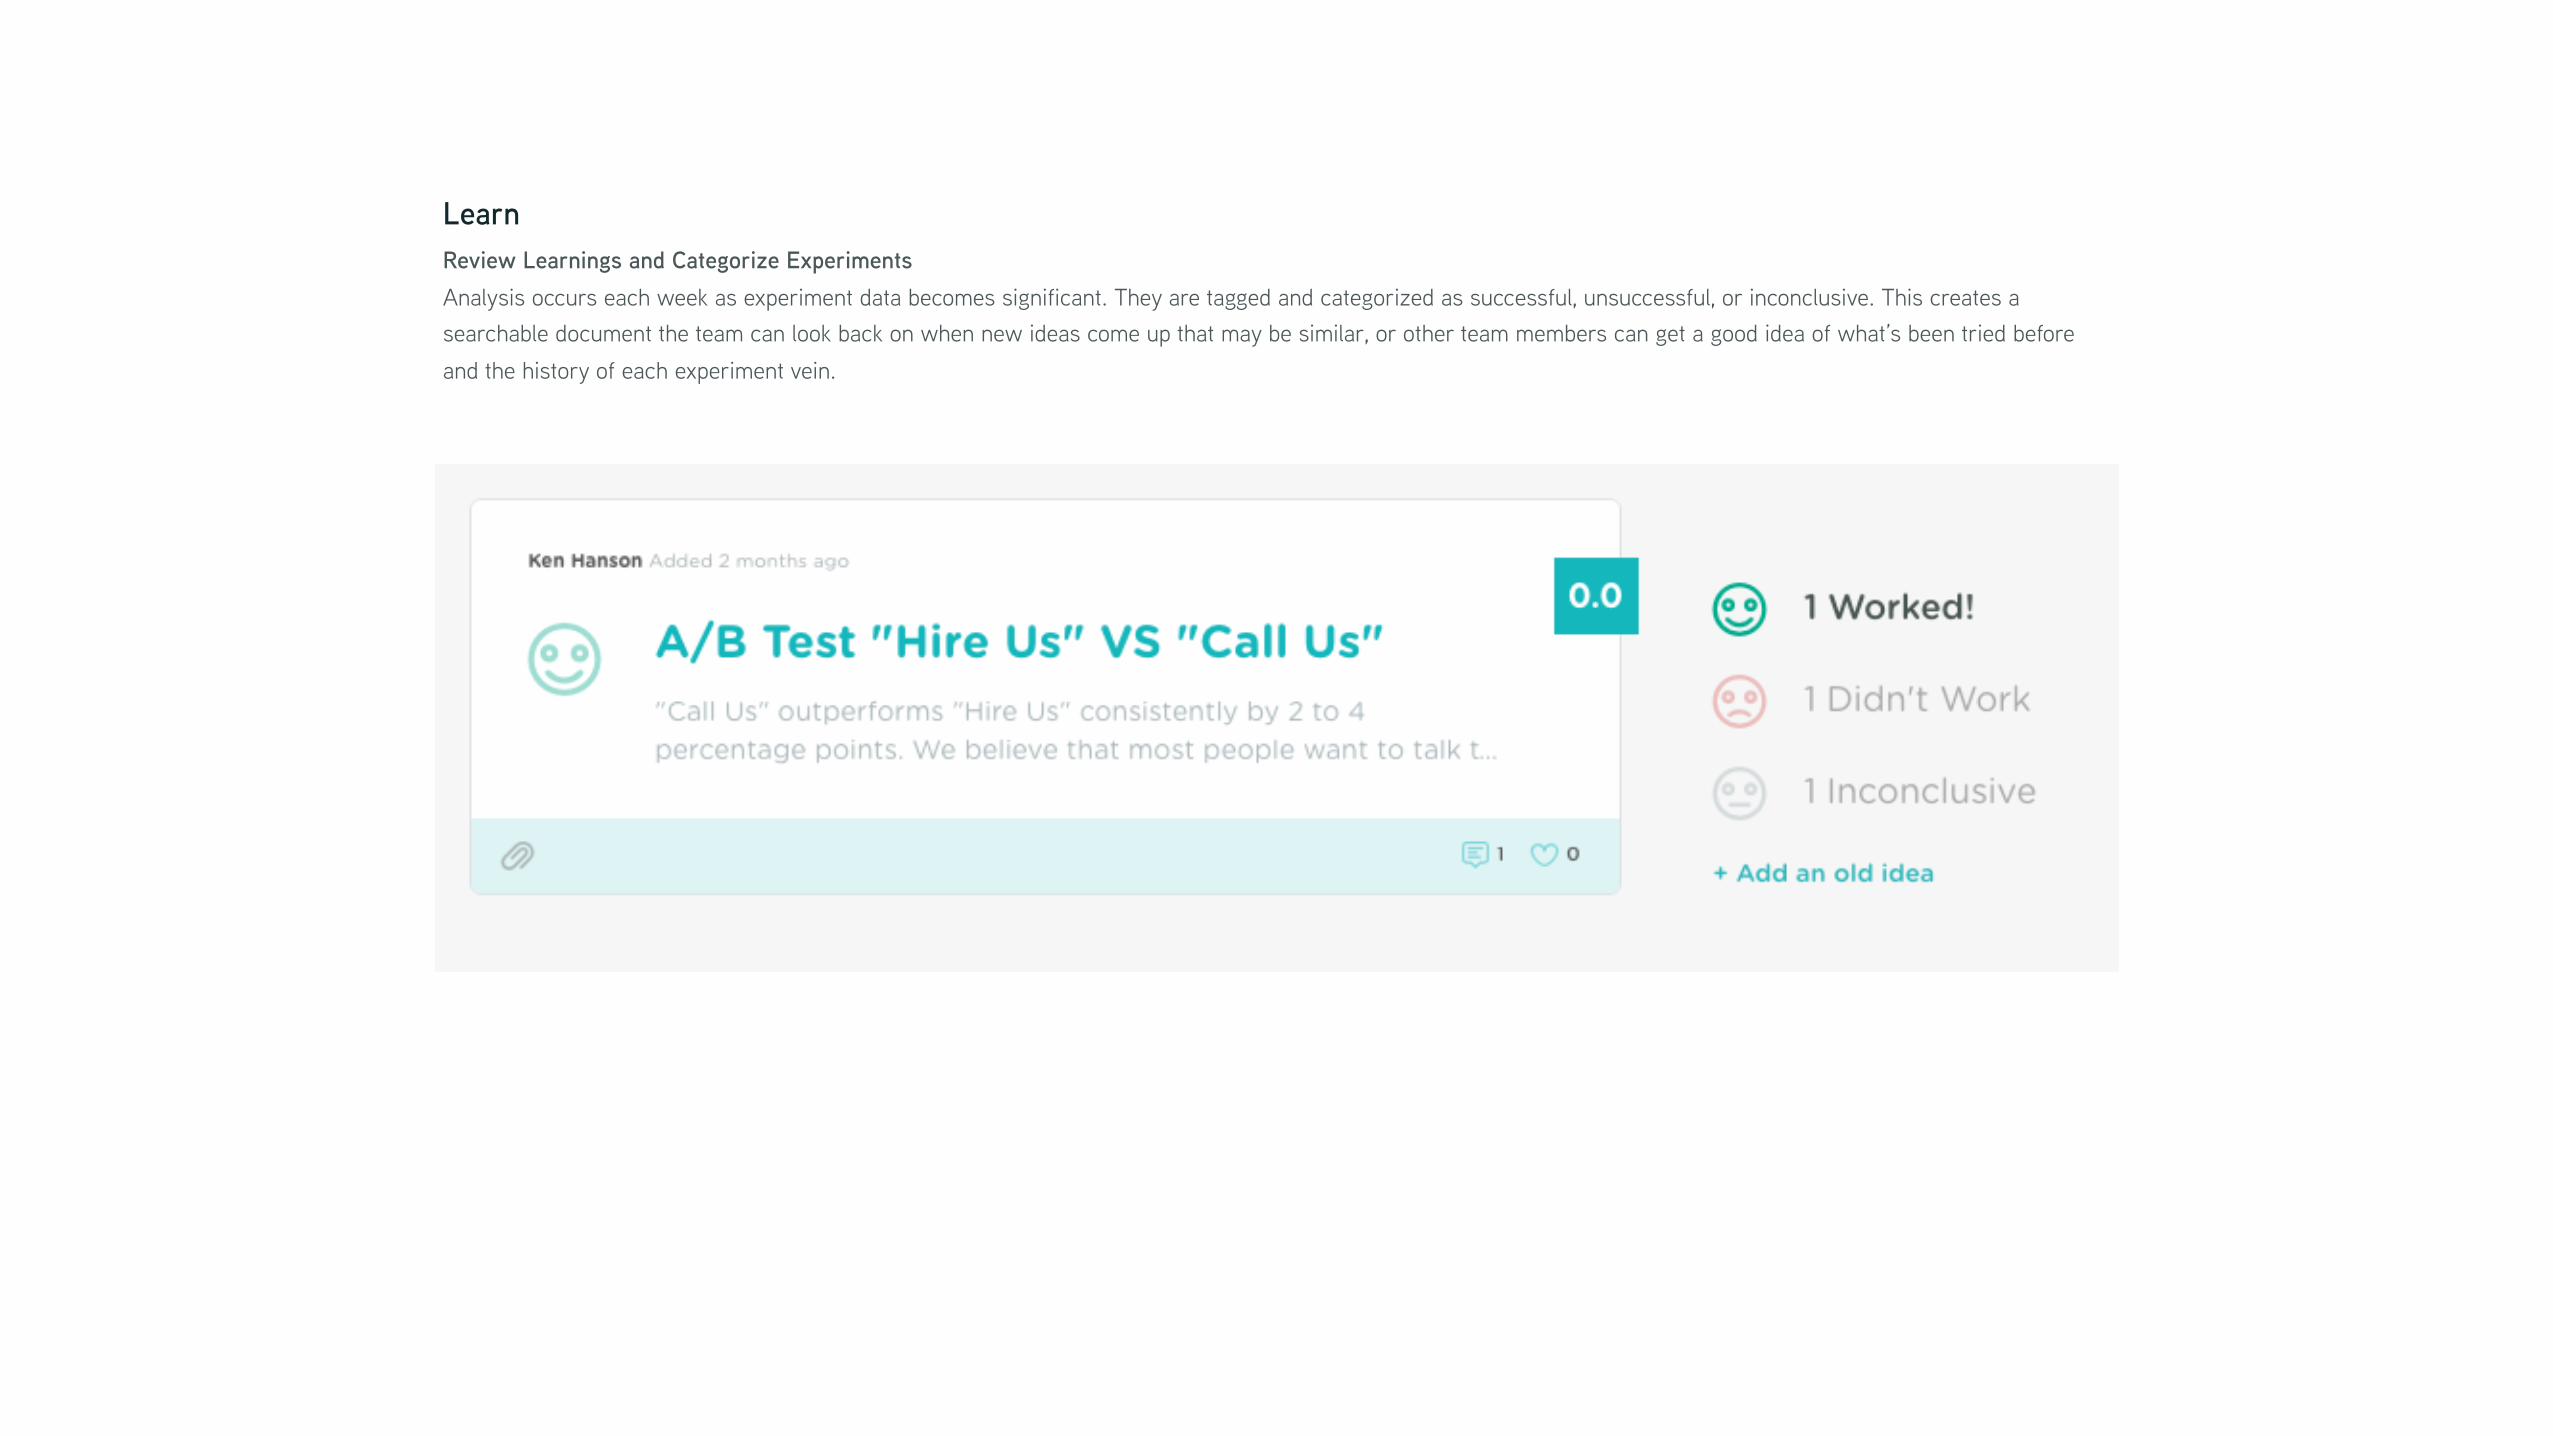
Learn
Review Learnings and Categorize Experiments
Analysis occurs each week as experiment data becomes significant. They are tagged and categorized as successful, unsuccessful, or inconclusive. This creates a
searchable document the team can look back on when new ideas come up that may be similar, or other team members can get a good idea of what’s been tried before
and the history of each experiment vein.
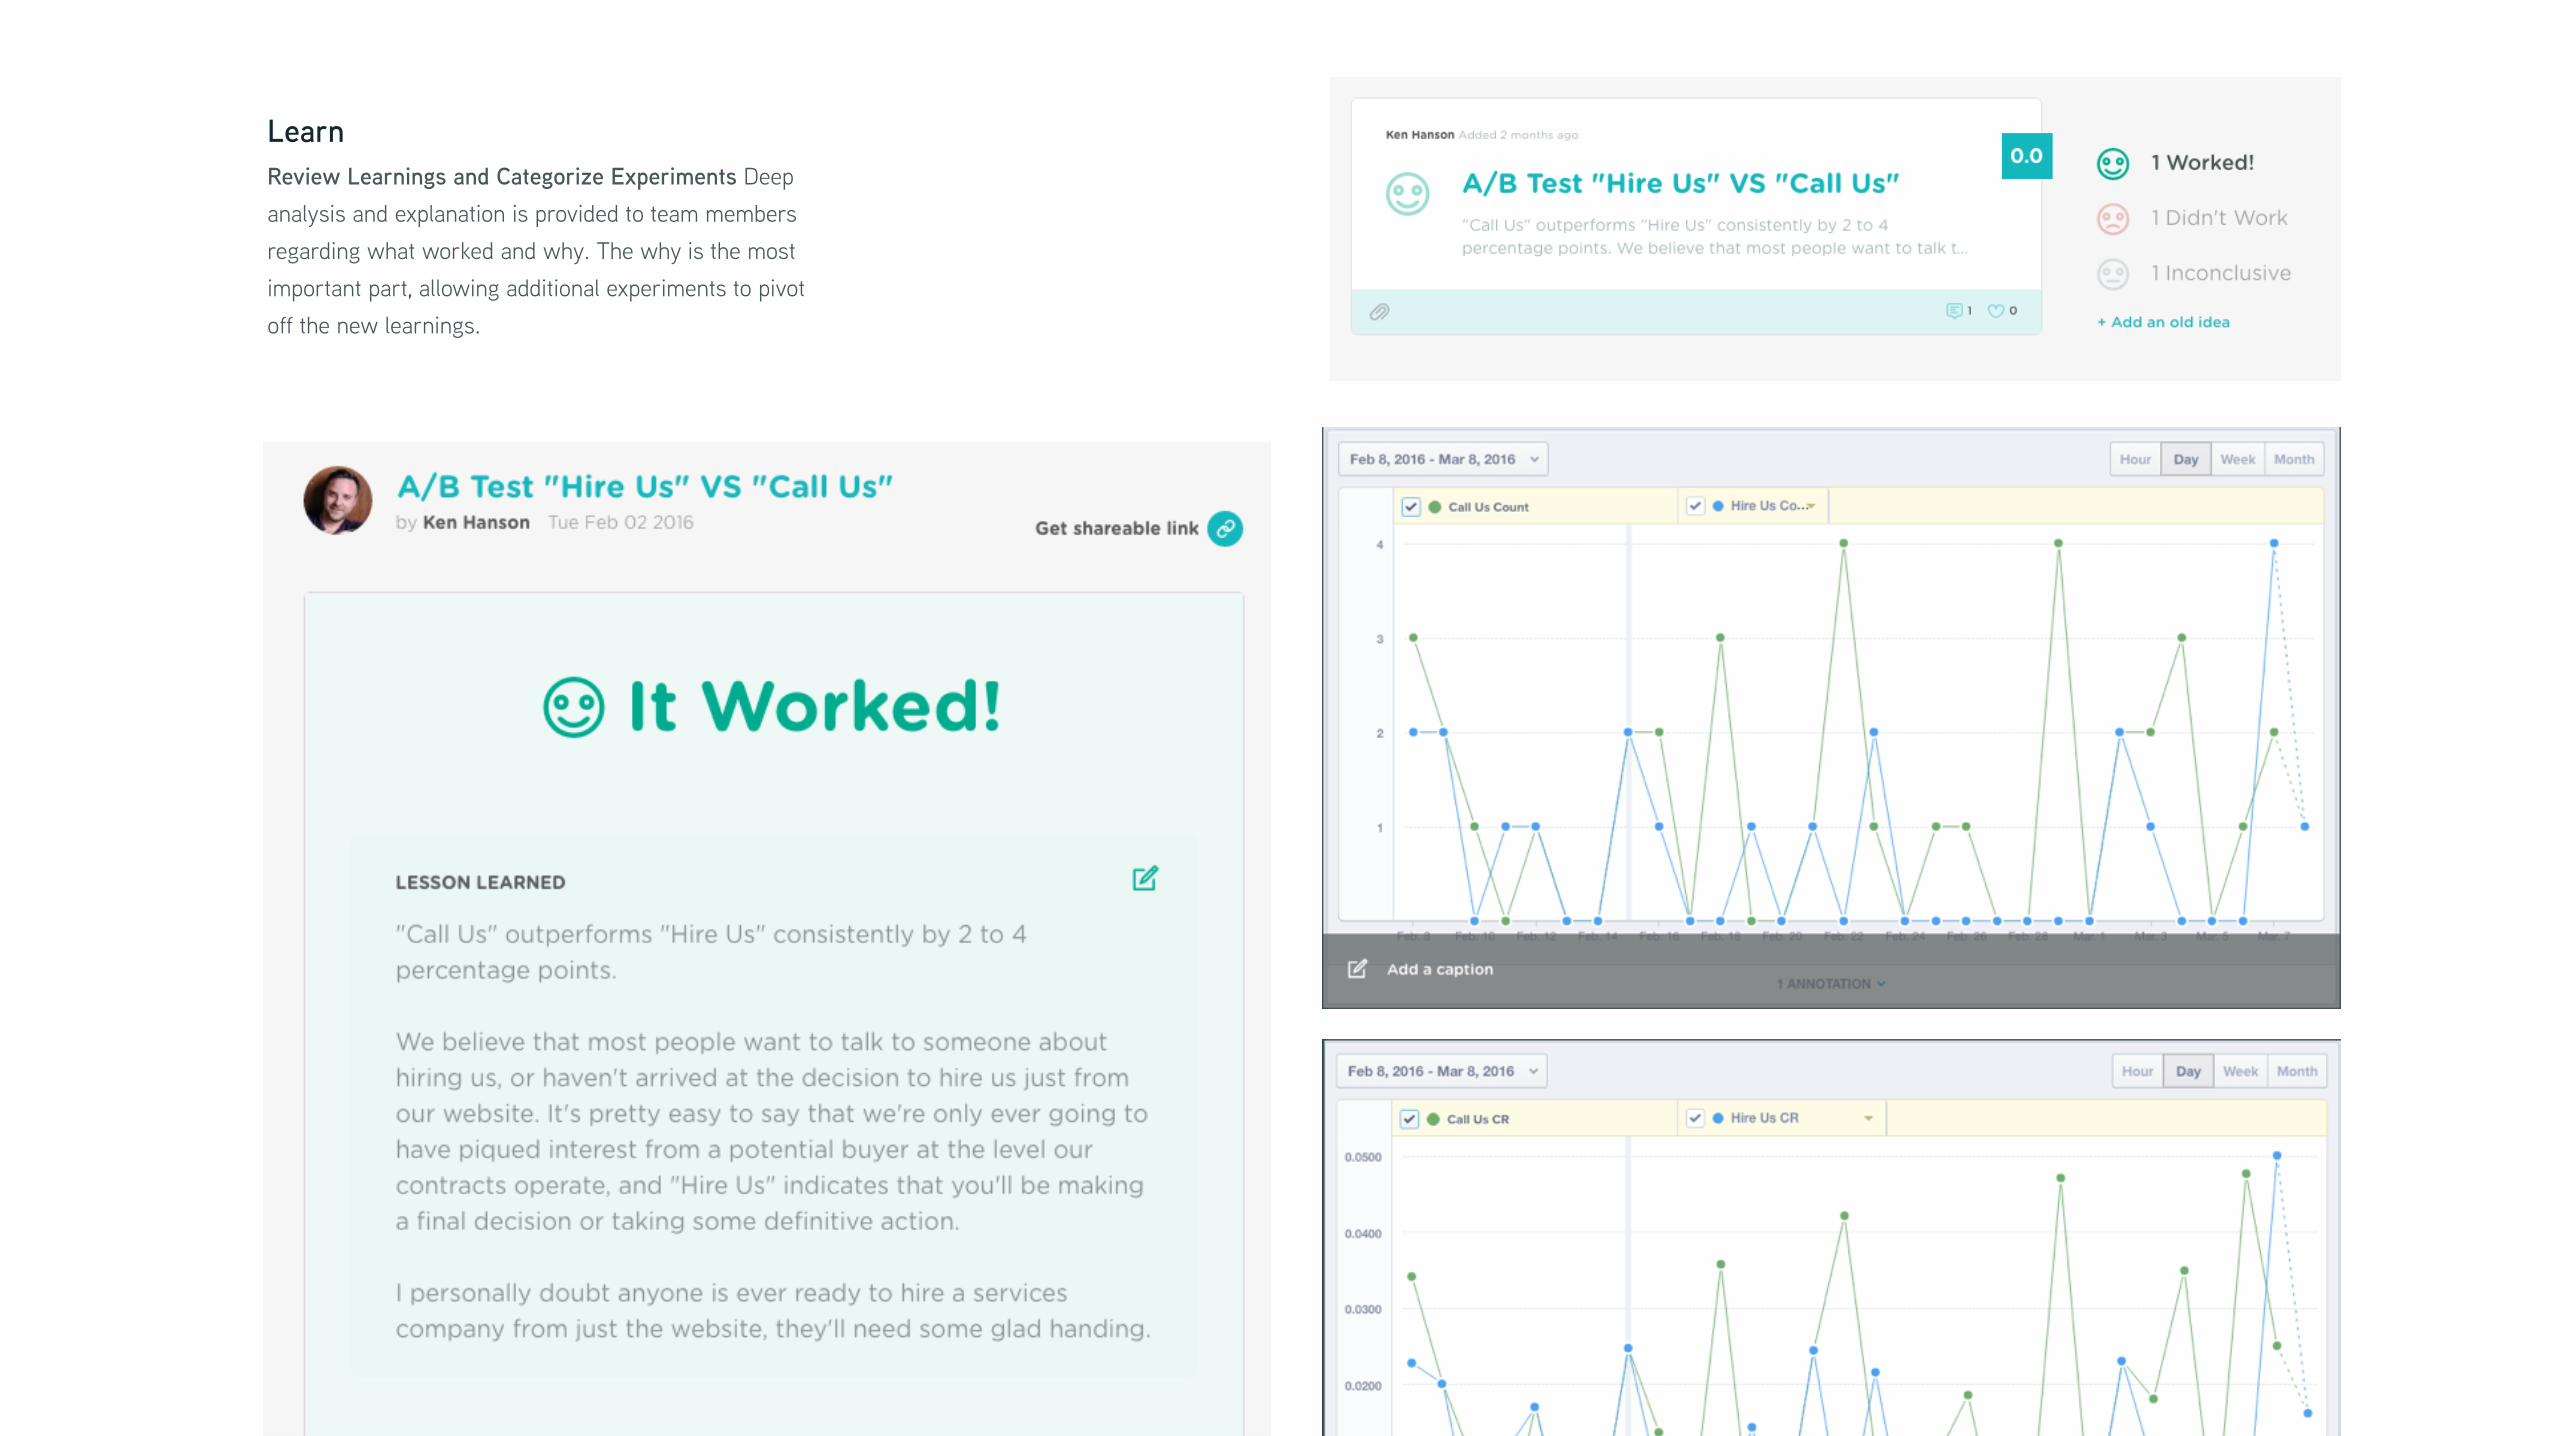
Learn
Review Learnings and Categorize Experiments Deep
analysis and explanation is provided to team members
regarding what worked and why. The why is the most
important part, allowing additional experiments to pivot
off the new learnings.

User TestingFor those of us who prefer to just ask why


Questions?