Embed Size (px)
Citation preview
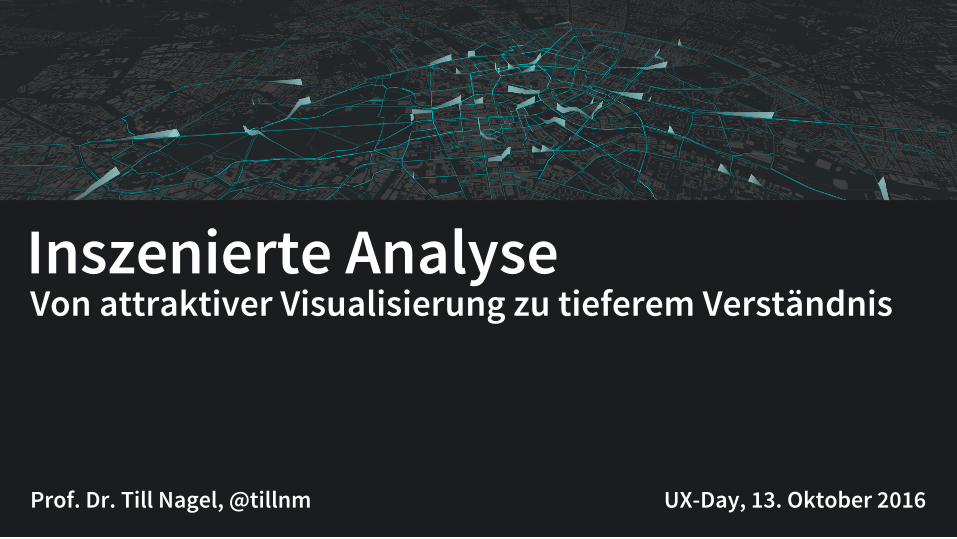
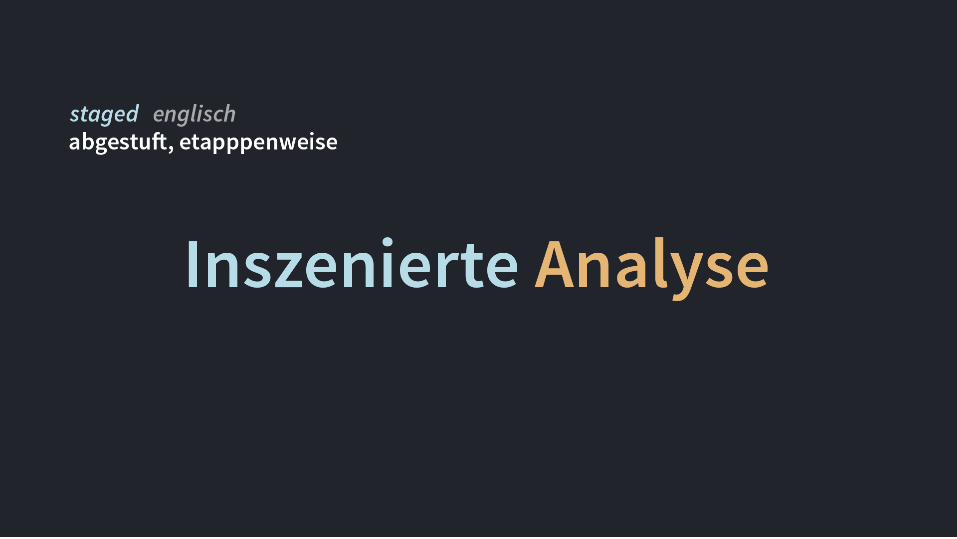
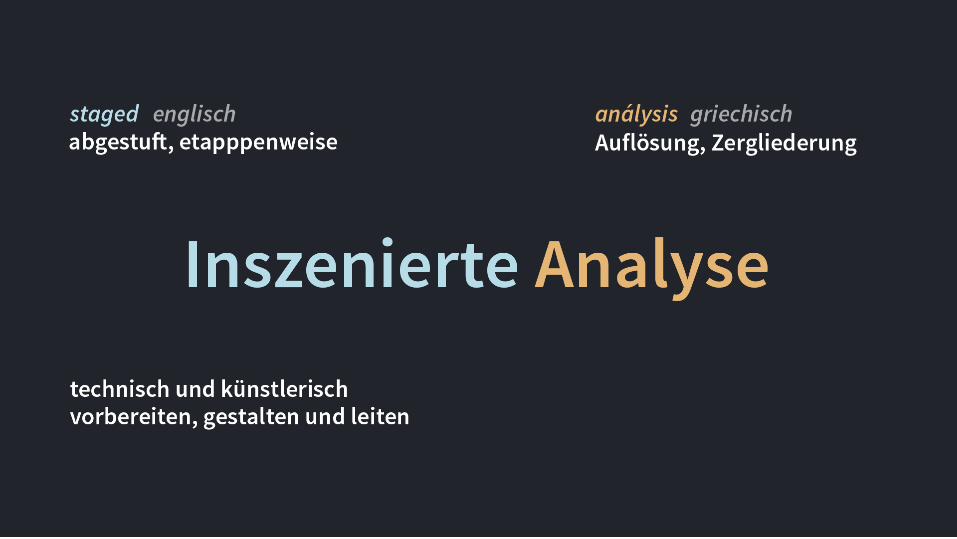
Inszenierte Analyse
Prof. Dr. Till Nagel, @tillnm
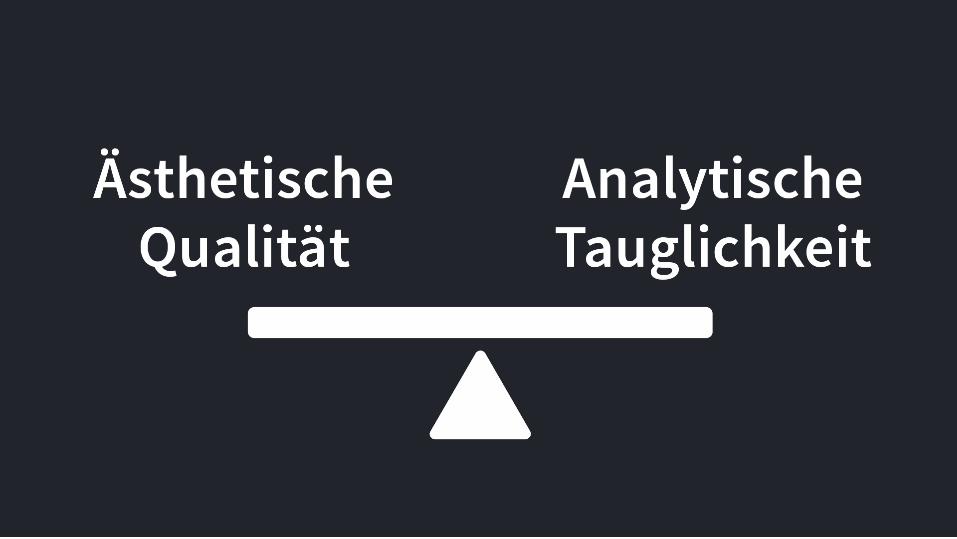
Von attraktiver Visualisierung zu tieferem Verständnis
UX-Day, 13. Oktober 2016


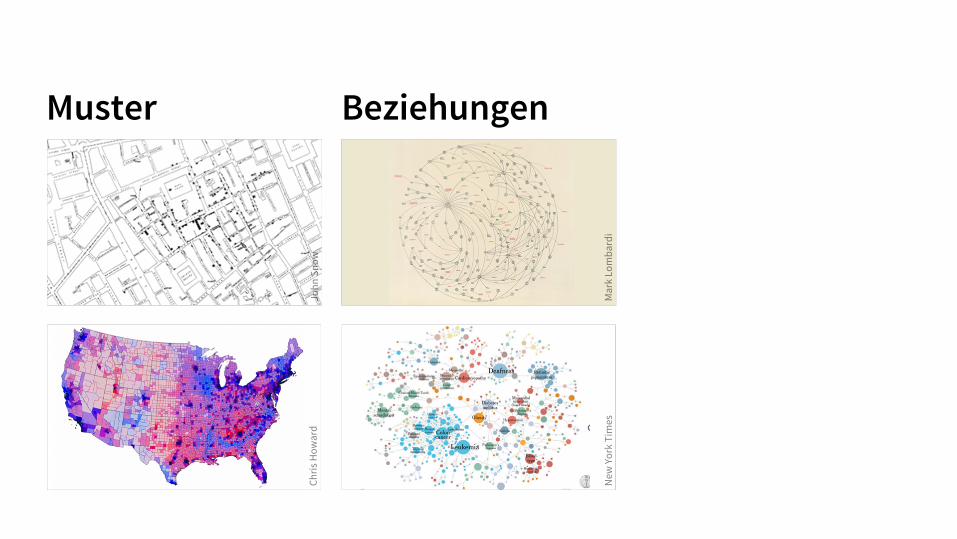
Muster Beziehungen Trends
Chris
How
ard
John
Sno
w
New
Yor
k Ti
mes
Mor
itz S
tefa
ner
Mar
k Lo
mba
rdi
Will
iam
Pla
yfai
r
Muster Beziehungen Trends
Chris
How
ard
John
Sno
w
New
Yor
k Ti
mes
Mor
itz S
tefa
ner
Mar
k Lo
mba
rdi
Will
iam
Pla
yfai
r

Muster Beziehungen Trends
Chris
How
ard
John
Sno
w
New
Yor
k Ti
mes
Mor
itz S
tefa
ner
Mar
k Lo
mba
rdi
Will
iam
Pla
yfai
r


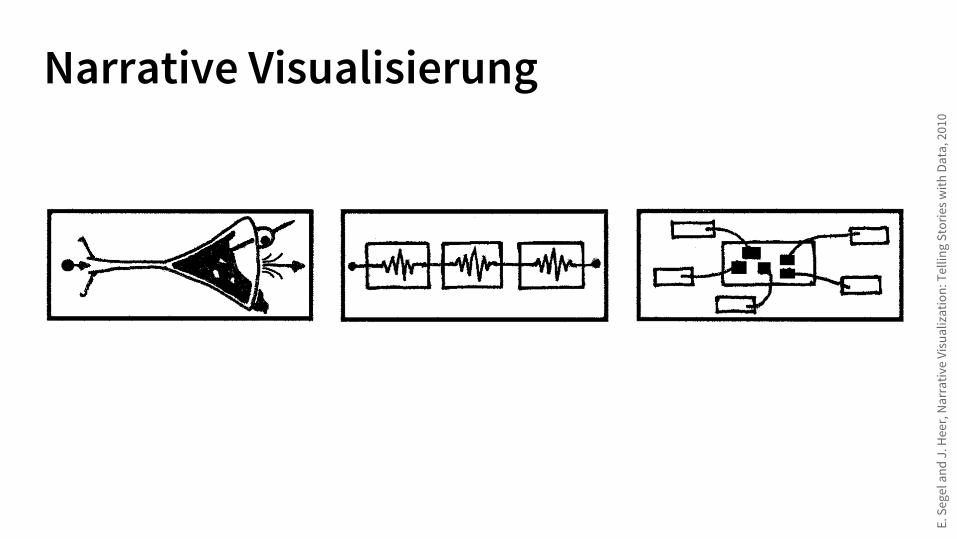
Narrative Visualisierung
E. S
egel
and
J. H
eer,
Nar
rativ
e Vi
sual
izat
ion:
Tel
ling
Stor
ies w
ith D
ata,
201
0


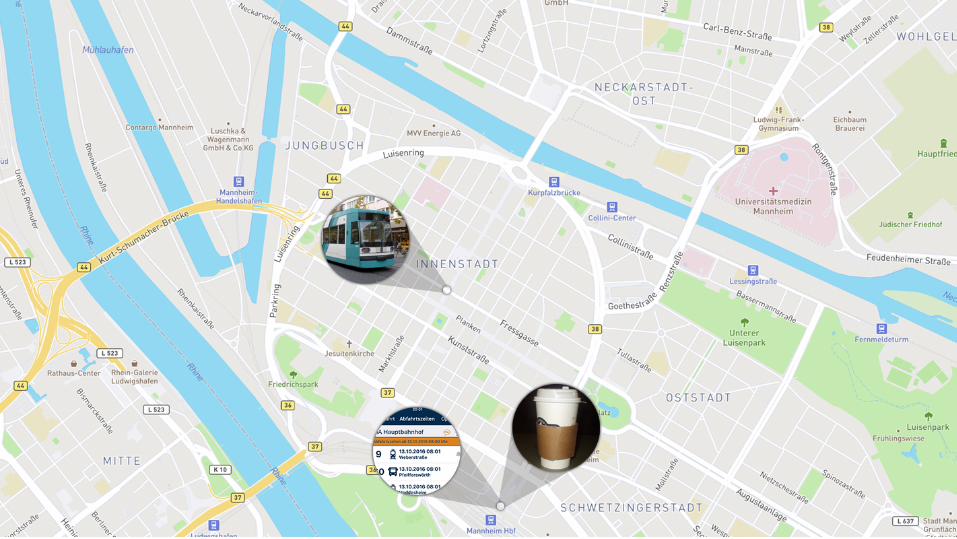
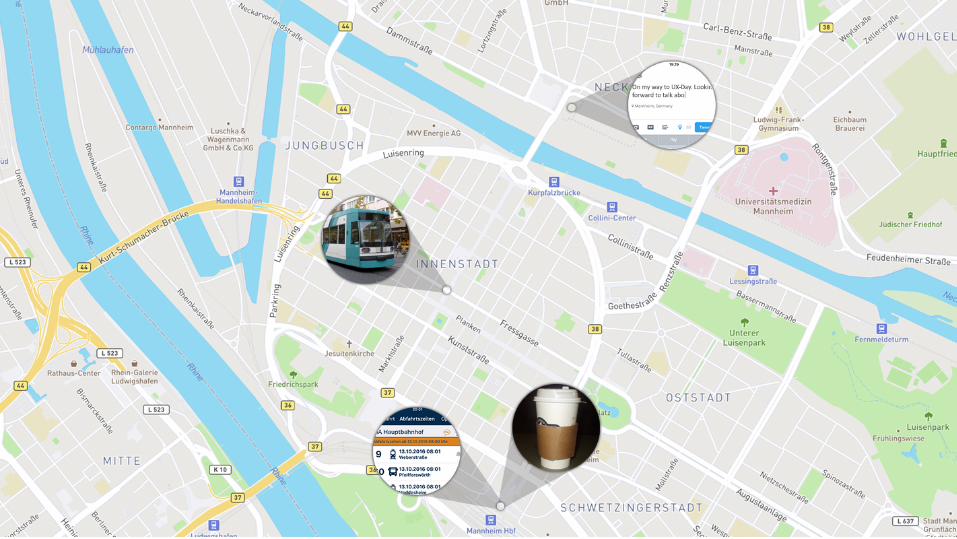
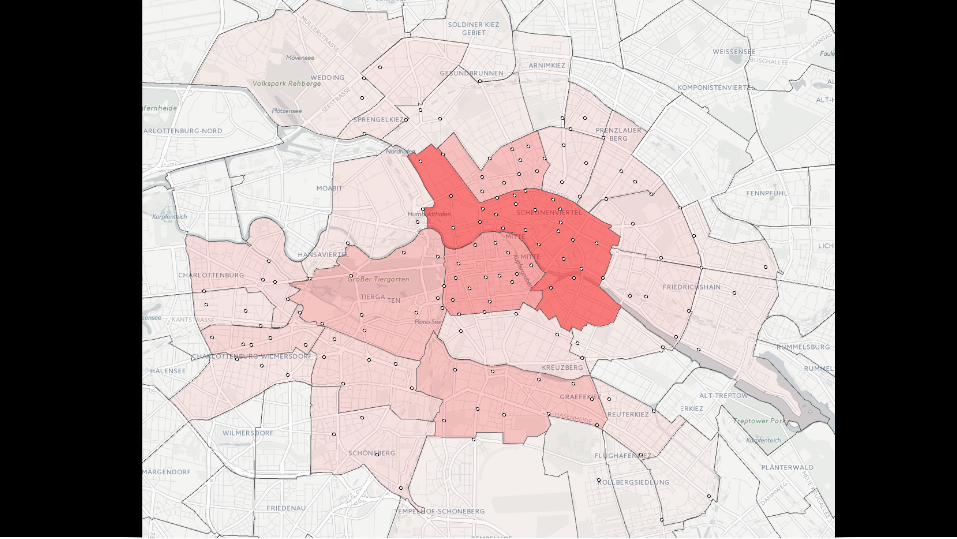
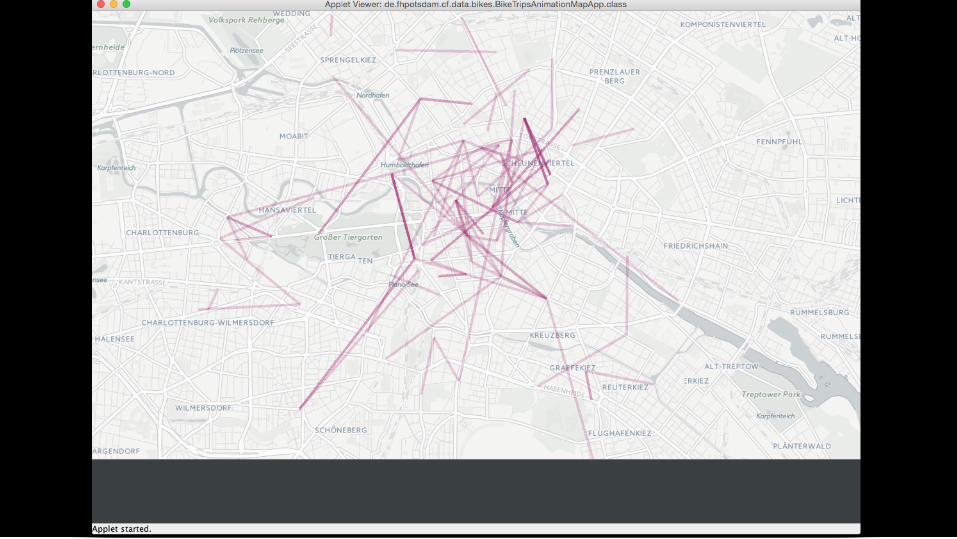
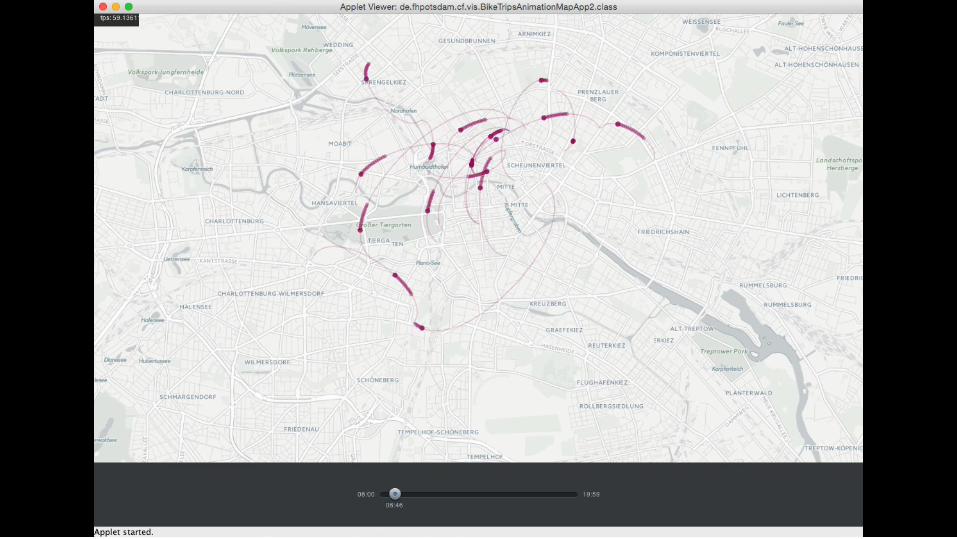
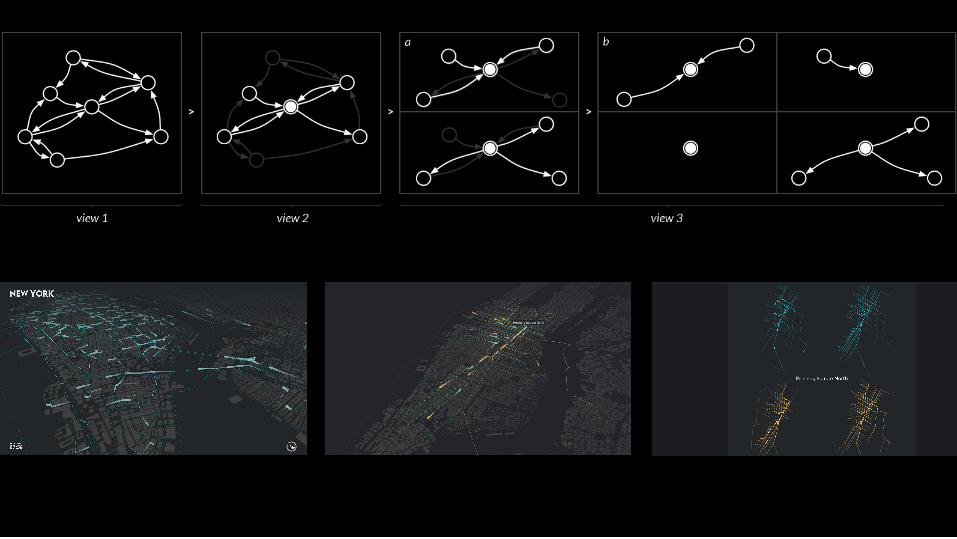
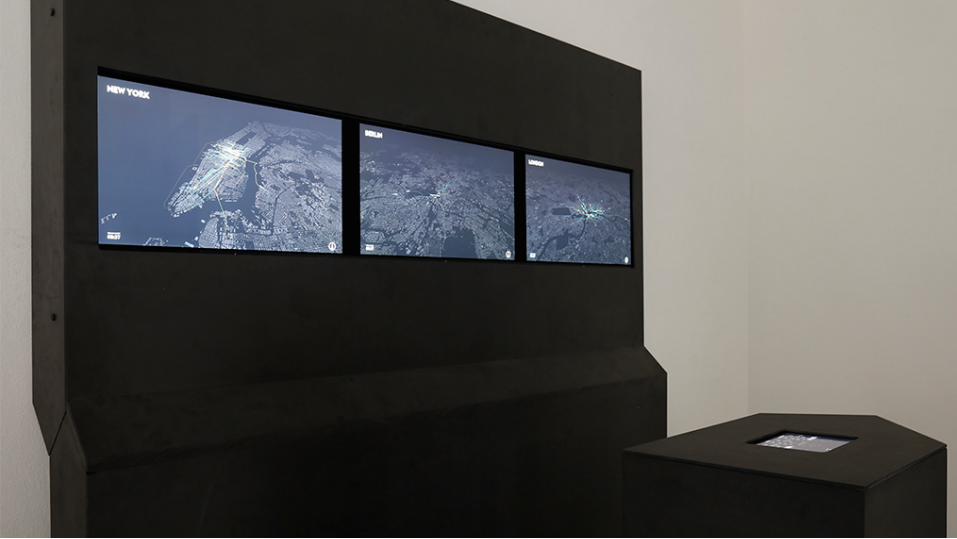
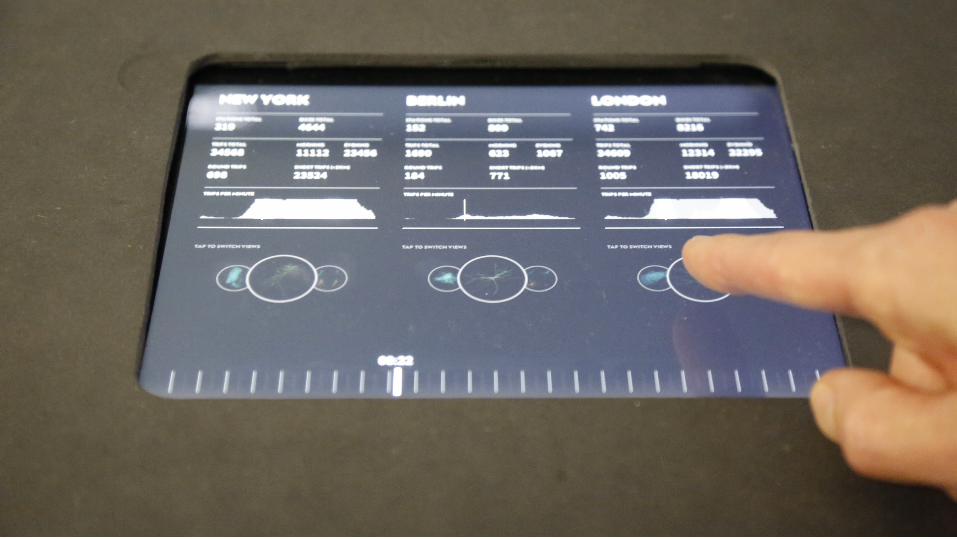
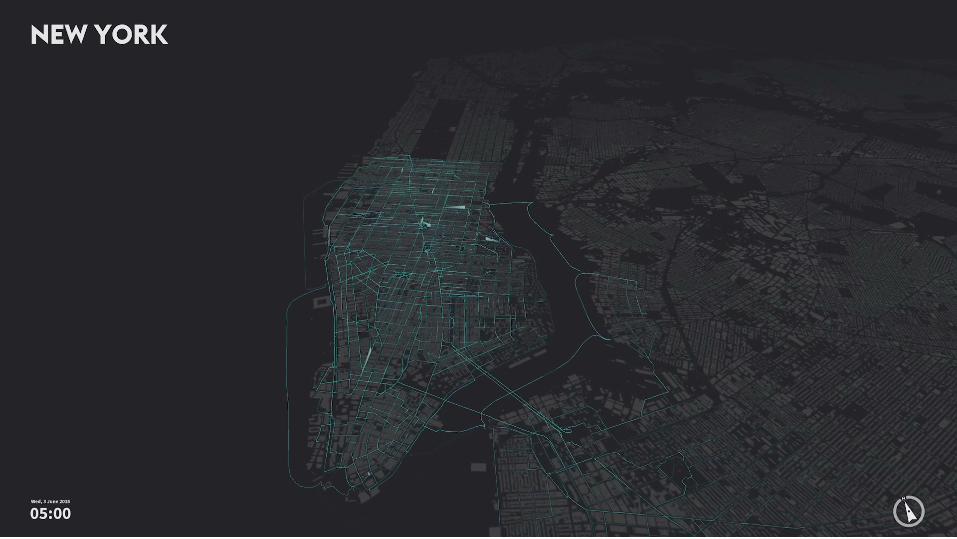
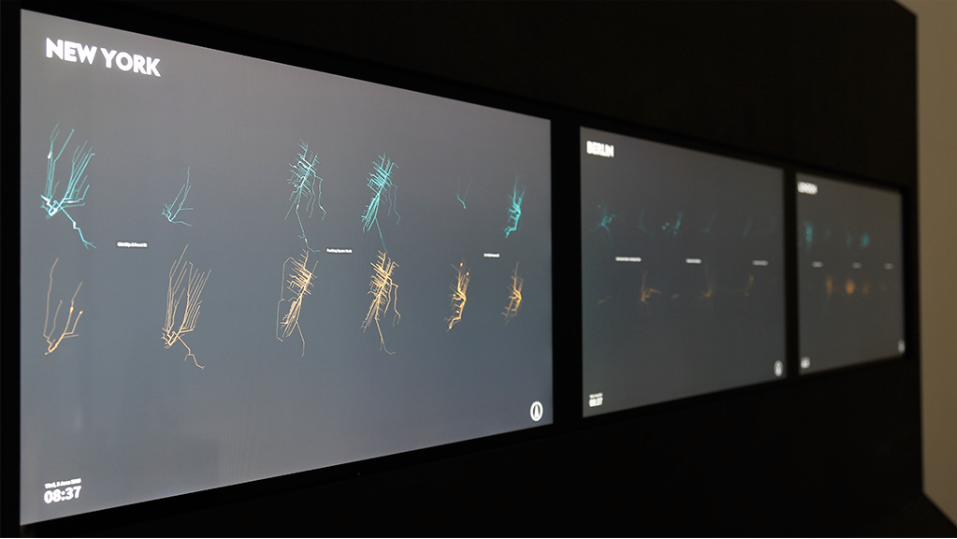
cf. city flows is a comparative visualization environment of urban bike mobility designed to help citizens casually analyze three bike-sharing systems in the context of a public exhibition space. Multiple large screens show the space of flows in bike sharing for three selected cities.


• Anregende Ästhetik bieten Design
• Vergleichende Analyse unterstützen Funktional
• Einen Raum für Diskussion öffnen Sozial
Gestaltungsziele
Bike Sharing Systeme Sammeln, verarbeiten und analysieren von Daten

London Santander Cycles
Berlin Call a Bike
New York Citibike
alan
levi
n
Rudo
lfSim
on
Nic
k-D

London Santander Cycles
Berlin Call a Bike
New York Citibike
20° C
3 Juni 2015
21° C 21° C
alan
levi
n
Rudo
lfSim
on
Nic
k-D


Raw data

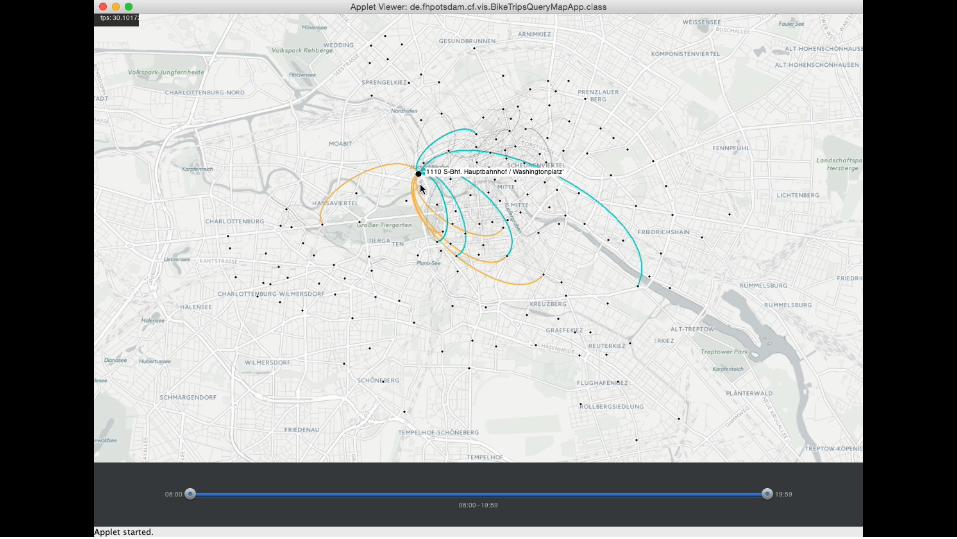
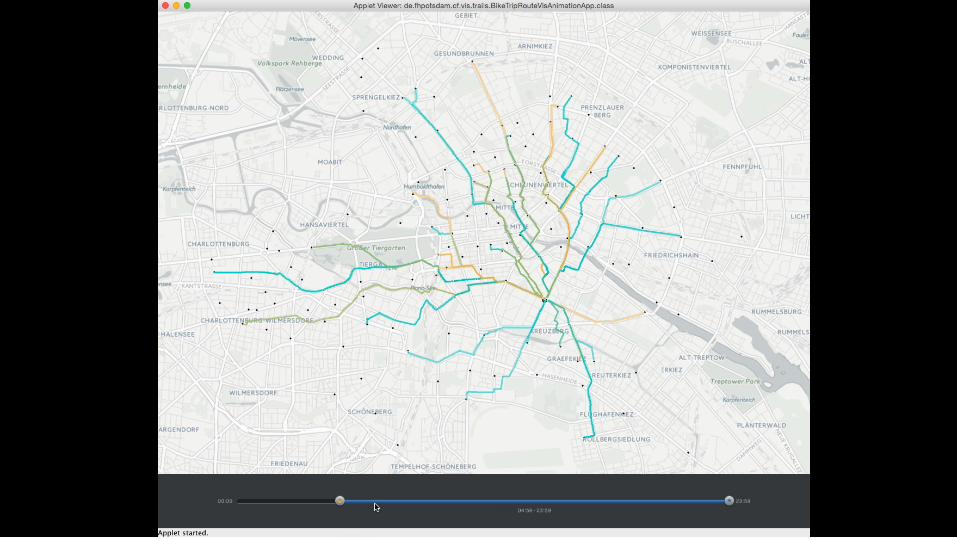
Visuelle Experimente Daten erkunden


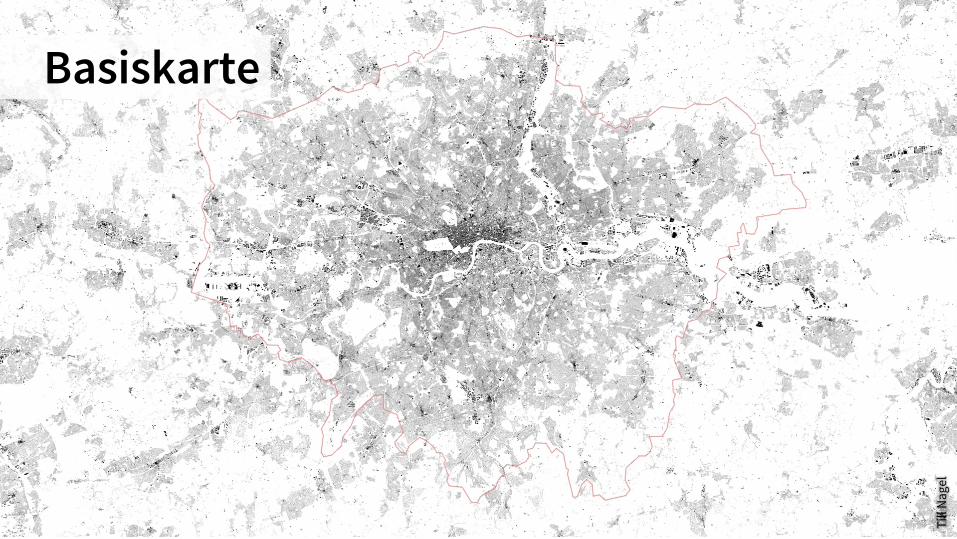
Basiskarte
Till
Nag
el
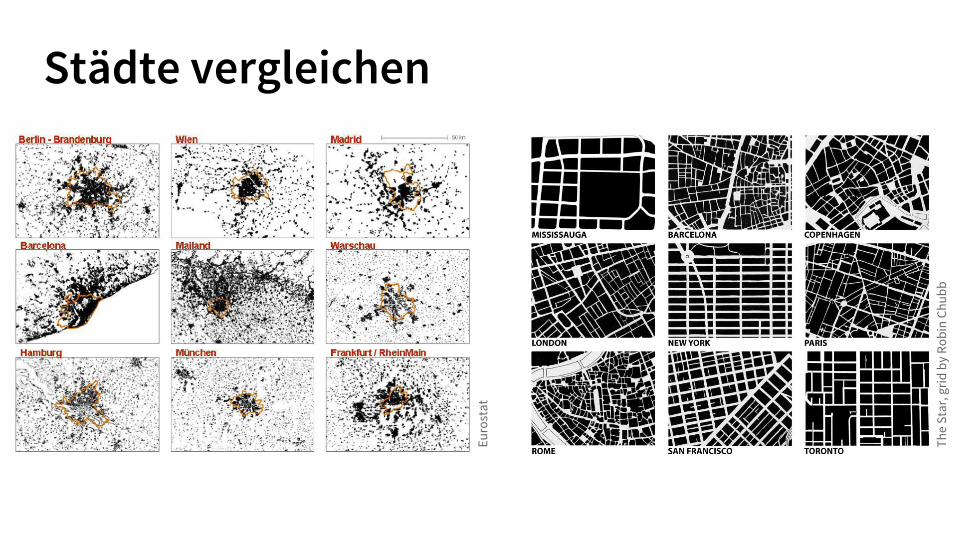
Städte vergleichen
The
Star
, grid
by
Robi
n Ch
ubb
Euro
stat
cf. city flows Inszenierte Analyse in einer Fallstudie
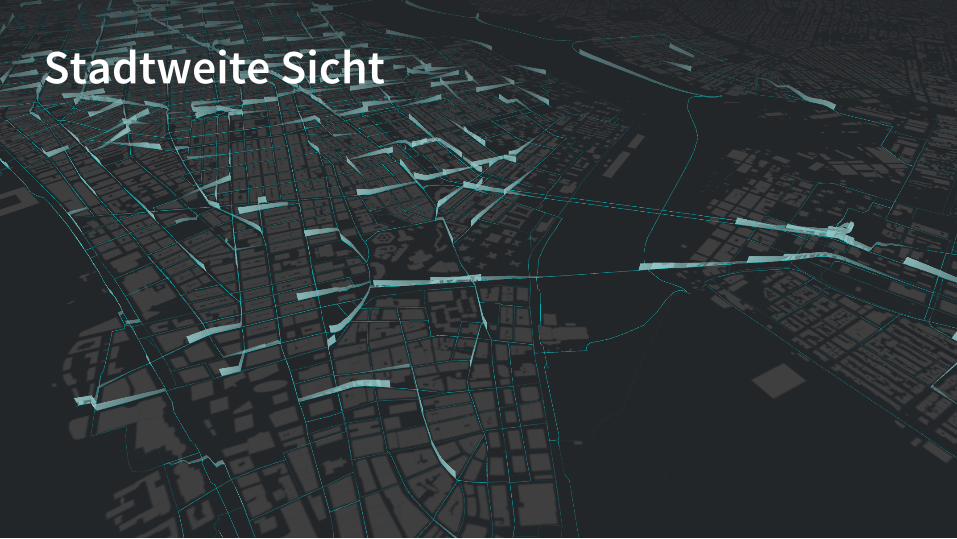
Stadtweite Sicht
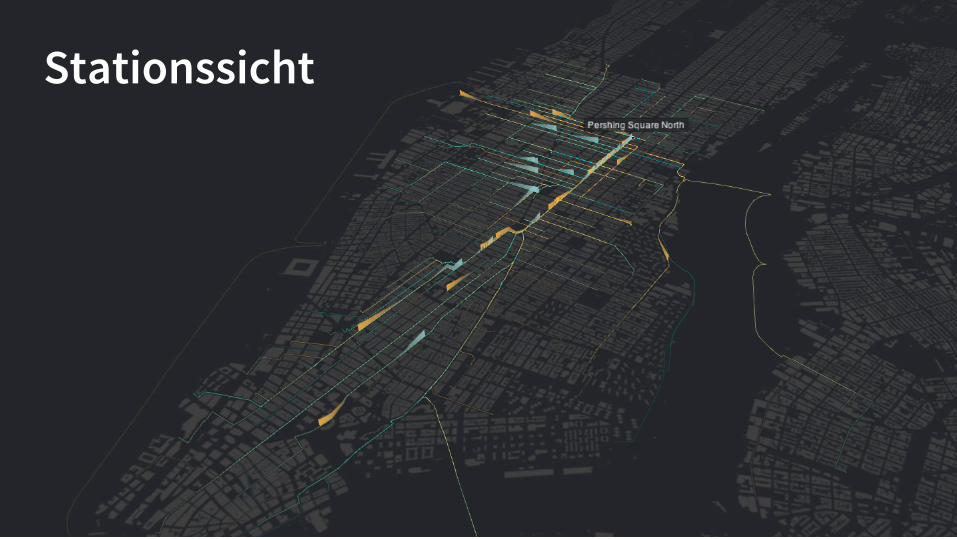
Stationssicht
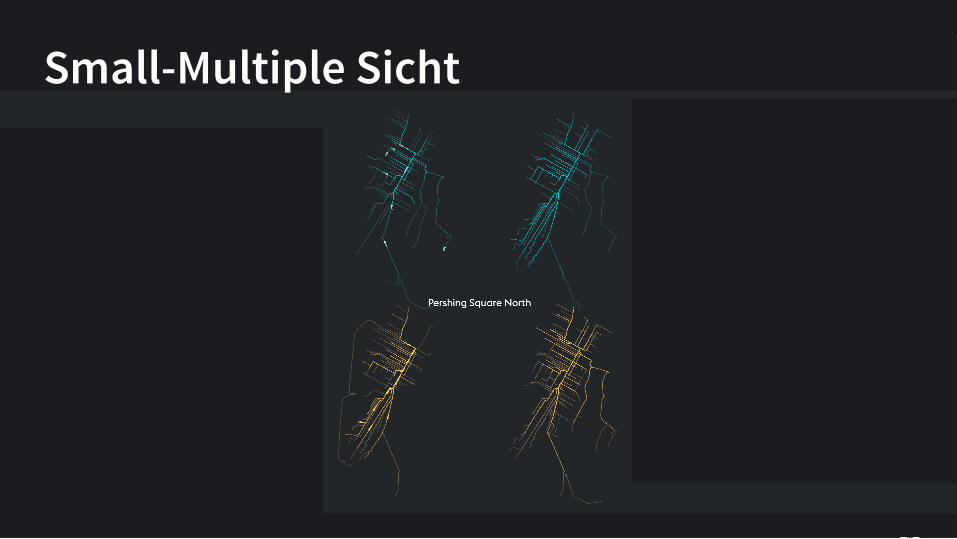
Small-Multiple Sicht

Ausstellung Besuchererlebnisse gestalten

Prod
uct d
esig
n: S
amira
Akh
avan
, And
rea
Bied
erm
ann,
Chr
istia
n M
ünch


Beobachtungen, Feedback und Rezeption

Phot
o: S
teph
anie
Neu
man
n
Ästhetisch, Funktional und Sozial
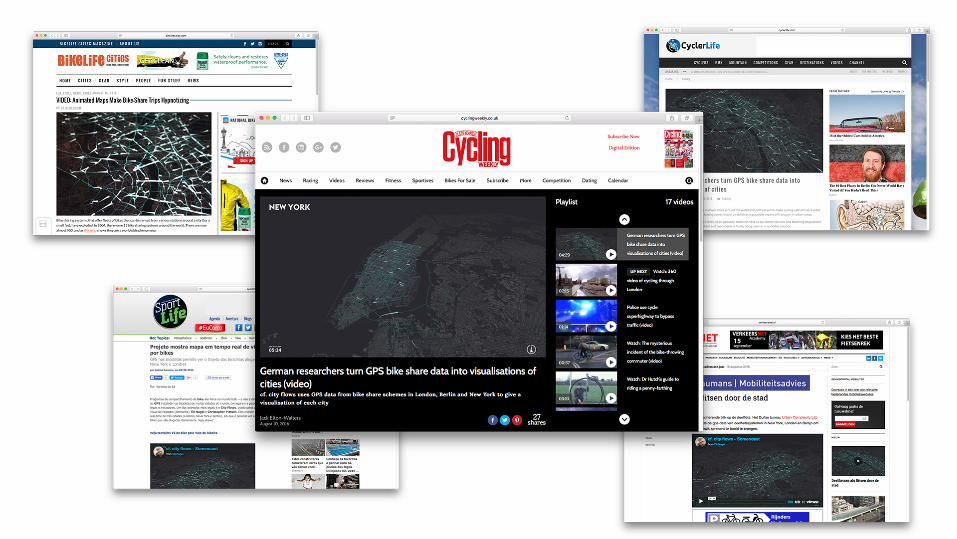

Rezeption

cf. city flows demonstriert wie man komplexe räumlich-zeitliche Daten so in Szene setzen kann, dass ein größeres Publikum Interesse entwickelt, Fragen stellt und sich mit dem Thema beschäftigt.
Vielen Dank.
Prof. Dr. Till Nagel, @tillnm Christopher Pietsch & Prof. Dr. Marian Dörk Urban Complexity Lab, FH Potsdam Hochschule Mannheim
Dank an meine Partner: