Embed Size (px)
Citation preview
join the Future now
Power Distribution Tariffs in India 2016 – Discom Wise & Consumer Wise Comprehensive Track
E-REP Fact Factor Series
March 2016
© ENINCON LLP 2016, All rights reserved
Research Base Power Distribution Tariffs in India 2016| 2
CERC Final tariff
Regulations for 2014-
19 tightens power
plant’s operating
norms
ILLUSTRATIVE
join the Future now
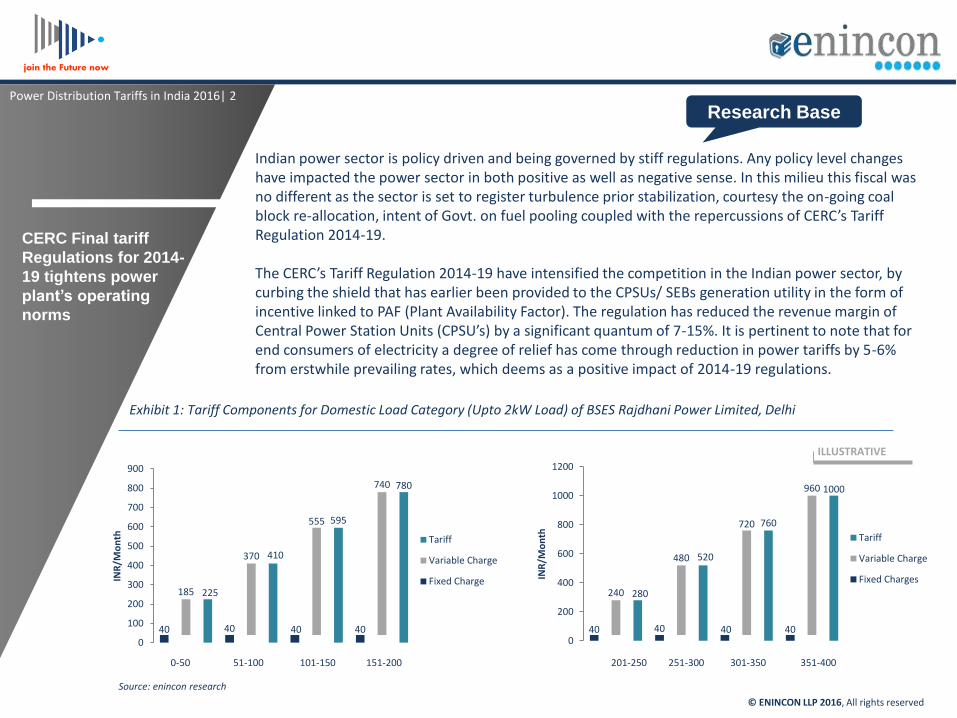
Indian power sector is policy driven and being governed by stiff regulations. Any policy level changes have impacted the power sector in both positive as well as negative sense. In this milieu this fiscal was no different as the sector is set to register turbulence prior stabilization, courtesy the on-going coal block re-allocation, intent of Govt. on fuel pooling coupled with the repercussions of CERC’s Tariff Regulation 2014-19. The CERC’s Tariff Regulation 2014-19 have intensified the competition in the Indian power sector, by curbing the shield that has earlier been provided to the CPSUs/ SEBs generation utility in the form of incentive linked to PAF (Plant Availability Factor). The regulation has reduced the revenue margin of Central Power Station Units (CPSU’s) by a significant quantum of 7-15%. It is pertinent to note that for end consumers of electricity a degree of relief has come through reduction in power tariffs by 5-6% from erstwhile prevailing rates, which deems as a positive impact of 2014-19 regulations.
40 40 40 40
185
370
555
740
225
410
595
780
0
100
200
300
400
500
600
700
800
900
INR
/Mo
nth
Tariff
Variable Charge
Fixed Charge
40 40 40 40
240
480
720
960
280
520
760
1000
0
200
400
600
800
1000
1200
INR
/Mo
nth
Tariff
Variable Charge
Fixed Charges
Exhibit 1: Tariff Components for Domestic Load Category (Upto 2kW Load) of BSES Rajdhani Power Limited, Delhi
Source: enincon research
0-50 51-100 101-150 151-200 201-250 251-300 301-350 351-400
© ENINCON LLP 2016, All rights reserved

© ENINCON LLP 2016, All rights reserved
Power Distribution Tariffs in India 2016 | 3
Research Base
join the Future now
ILLUSTRATIVE Fuel pooling has seen partial acceptance, as coal pooling is still under consideration. Gas pooling will help in reviving up 16 GW of stranded capacity and as Government of India is providing subsidy to check the tariff at INR 5.50. Only future will unveil the extent of benefit to the gas based power plants. The coal pooling would be positive for the stranded capacity, but it would be negative for the government run power generation utilities or the ones having FSA (Fuel Supply Agreement) with CIL. The coal pooling was anticipated to increase the power tariff by INR 0.40- 0.50 per unit during FY 2015-16, but the same would be much lower during this fiscal, ie- FY 2016-17. Such happenings when clubbed generates an imperative need for a dossier which would examine the tariffs as per end consumers. Hence, by meticulously examining the regulation, the latest trends governing the key fuel resources and deeply analysing the possible impacts on all the stakeholders, enincon llp attempts to blend the factual power tariff data and present a dossier which would be first of its kind and would enable clients with reliable insights and better understanding of the power tariff dynamics in the country.
Exhibit 3: Consumer Category Classification
25%
20%
20%
10%
25%
Domestic
Non-domestic
Industrial
Agricultural
Others
Key Highlights of CERC Final Tariff Regulation for 2014-19: New Formula for calculation of Fuel Cost Tightening of Operating Efficiency Norms Actual PLF Linked Incentives Tax Payment on Actual Basis Instead of Gross-up at
Applicable Tax Rate Lower NAPAF for recovery of Fixed Charges Lower Fuel Stock Allowed for Normative Working
Capital
Source: enincon research
“Power Distribution
Tariff in India-2016” gives better understanding
and reliable insights of
power tariff dynamics in the
country

© ENINCON LLP 2016, All rights reserved
ENINCON Research &
Services Framework
Research Reports
ENINCON Research
Desk
Business Stakeholders/Partic
ipants
Experts Insights/ Market view
Validated data & analysis
Opportunity mapping
& Market sizing
First hand sector
knowledge & inputs
Gist of the report in .pdf
format for ready use
Free Author
support on report & Competitive
cost
Customized Research Solution
Primary research
inputs from F2F
interviews
Germinates from minds that think fresh to evolve path finding guide for all stake holders through quality information & analyses
ENINCON’S Service Difference
Exhibit 4: ENINCON’s Difference
Emanates from seamless integration of domain expertise with first hand industry knowledge and customized research solutions at a very competitive cost
ENINCON’S Research Difference
ENINCON’s Difference
ENINCON
The Report gives
a comprehensive
track of all
existing and
upcoming Captive
Power Plants of
India, bifurcated
as per fuel used
Power Distribution Tariffs in India 2016| 4
ILLUSTRATIVE
join the Future now

Re
sear
ch O
bje
ctiv
e
Re
sear
ch R
esu
lts
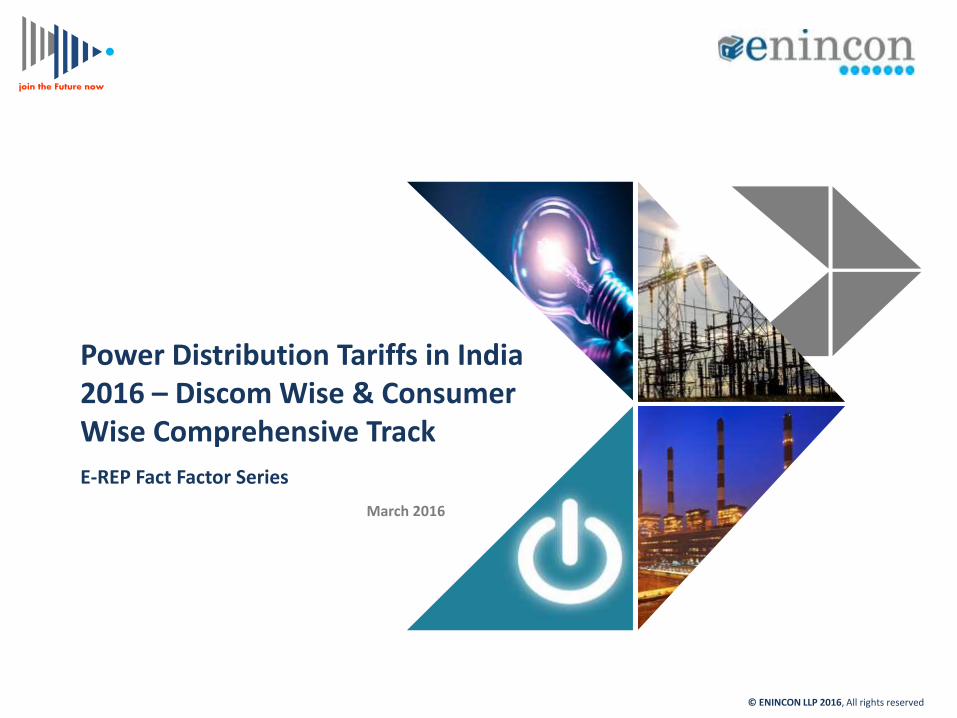
1. To tabulate New tariff Structure for 2014
2. To analyze the pressure on power generating utilities with incentives linked to PLF instead of PAF
3. To study the impact on the various stakeholders of the supply chain due to these regulations
4. To analyse cost of supply and cost of procurement of power from the perspective of distribution utility
Research Objective
Exhibit 5: ENINCON Research Objective & Key Queries Resolved
© ENINCON LLP 2016, All rights reserved
ENINCON Research reports
delivering domain
knowledge, market
insights & future
outlook
Power Distribution Tariff in India 2016 | 5
• What is likely rationale behind tariff calculations followed in India for 2014-19?
• What are the key impacts on the
stakeholders due to these regulations?
• What would be the cost of power
supply and cost of procurement vis-à-vis from power distribution utility’s perspective?
• How this tariff regime impacted the
generating utilities?
Key
Qu
eri
es
Re
solv
ed
ILLUSTRATIVE
join the Future now
© ENINCON LLP 2016, All rights reserved
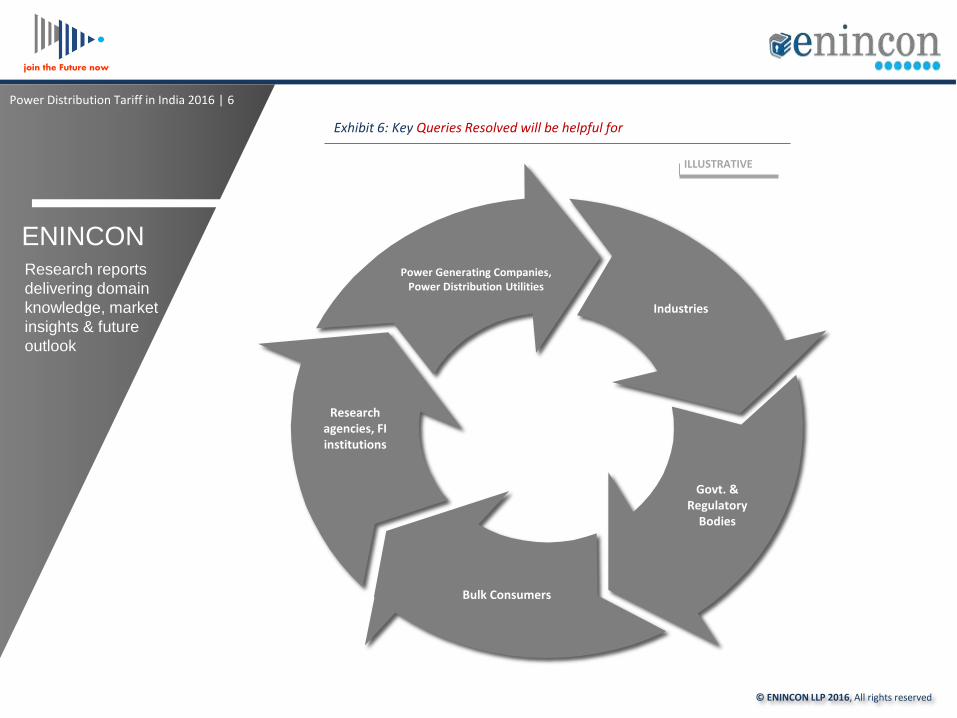
Exhibit 6: Key Queries Resolved will be helpful for
Power Generating Companies, Power Distribution Utilities
Research agencies, FI institutions
Bulk Consumers
Govt. & Regulatory
Bodies
Industries
ENINCON Research reports
delivering domain
knowledge, market
insights & future
outlook
Power Distribution Tariff in India 2016 | 6
ILLUSTRATIVE
join the Future now
Mu
st B
uy
For
Mu
st B
uy
For
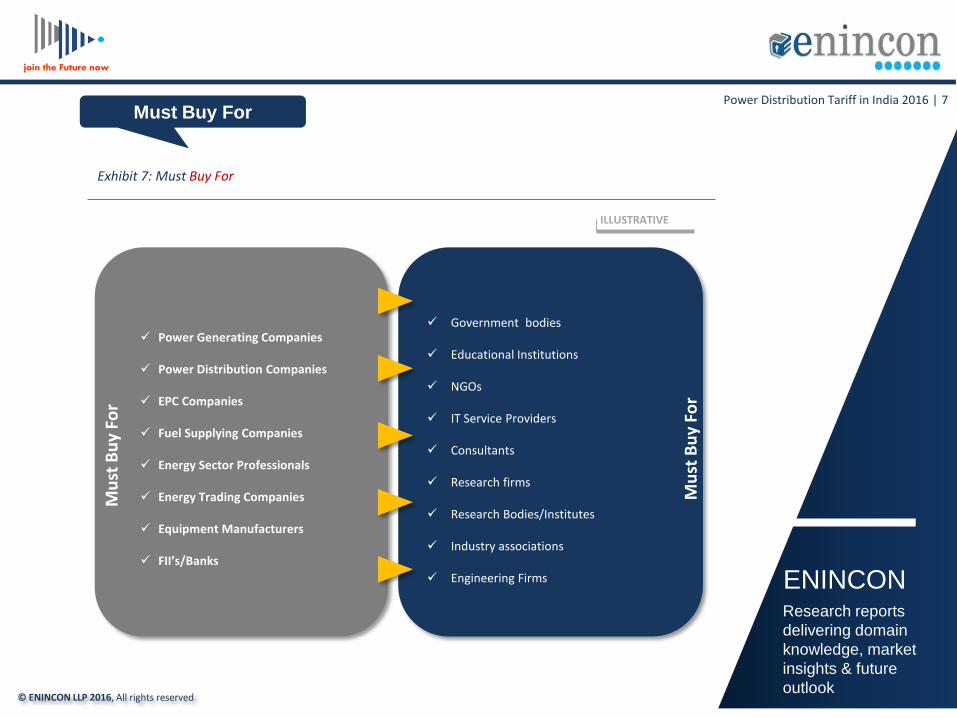
Power Generating Companies
Power Distribution Companies
EPC Companies
Fuel Supplying Companies
Energy Sector Professionals
Energy Trading Companies
Equipment Manufacturers
FII’s/Banks
Government bodies
Educational Institutions
NGOs
IT Service Providers
Consultants
Research firms
Research Bodies/Institutes
Industry associations
Engineering Firms
Must Buy For
Exhibit 7: Must Buy For
© ENINCON LLP 2016, All rights reserved
ENINCON Research reports
delivering domain
knowledge, market
insights & future
outlook
Power Distribution Tariff in India 2016 | 7
ILLUSTRATIVE
join the Future now
Contents & Coverage
© ENINCON LLP 2016, All rights reserved
join the Future now
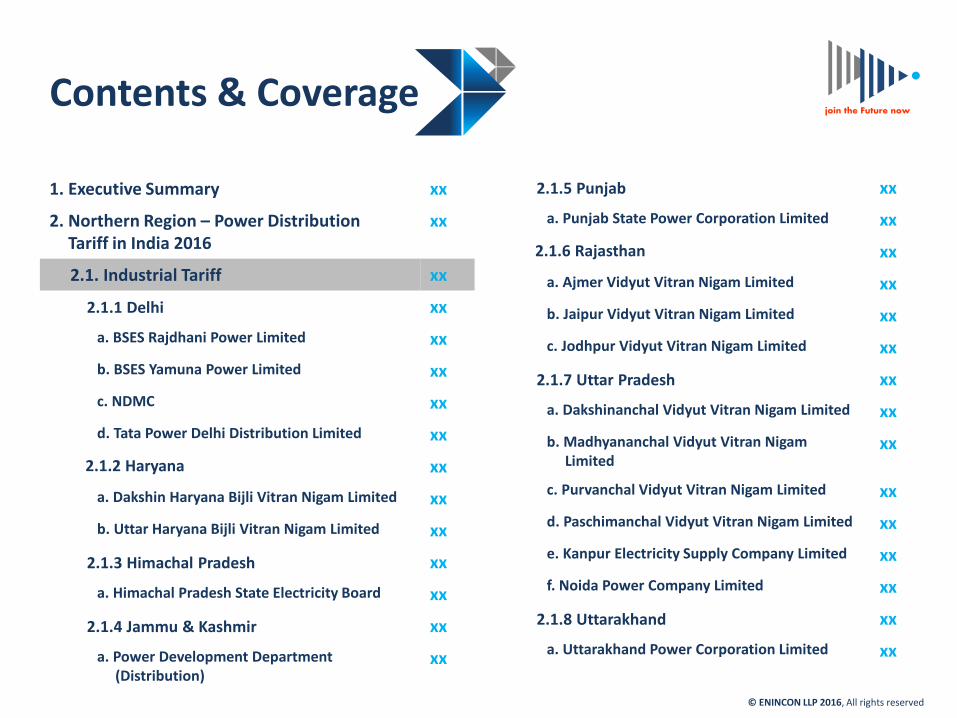
1. Executive Summary xx
2. Northern Region – Power Distribution Tariff in India 2016
xx
2.1. Industrial Tariff xx
2.1.1 Delhi xx
a. BSES Rajdhani Power Limited xx
b. BSES Yamuna Power Limited xx
c. NDMC xx
d. Tata Power Delhi Distribution Limited xx
2.1.2 Haryana xx
a. Dakshin Haryana Bijli Vitran Nigam Limited xx
b. Uttar Haryana Bijli Vitran Nigam Limited xx
2.1.3 Himachal Pradesh xx
a. Himachal Pradesh State Electricity Board xx
2.1.4 Jammu & Kashmir xx
a. Power Development Department (Distribution)
xx
2.1.5 Punjab xx
a. Punjab State Power Corporation Limited xx
2.1.6 Rajasthan xx
a. Ajmer Vidyut Vitran Nigam Limited xx
b. Jaipur Vidyut Vitran Nigam Limited xx
c. Jodhpur Vidyut Vitran Nigam Limited xx
2.1.7 Uttar Pradesh xx
a. Dakshinanchal Vidyut Vitran Nigam Limited xx
b. Madhyananchal Vidyut Vitran Nigam Limited
xx
c. Purvanchal Vidyut Vitran Nigam Limited xx
d. Paschimanchal Vidyut Vitran Nigam Limited xx
e. Kanpur Electricity Supply Company Limited xx
f. Noida Power Company Limited xx
2.1.8 Uttarakhand xx
a. Uttarakhand Power Corporation Limited xx

Contents & Coverage
© ENINCON LLP 2016, All rights reserved
join the Future now
2.2. Commercial Tariff xx
2.2.1 Delhi xx
a. BSES Rajdhani Power Limited xx
b. BSES Yamuna Power Limited xx
c. NDMC xx
d. Tata Power Delhi Distribution Limited xx
2.2.2 Haryana xx
a. Dakshin Haryana Bijli Vitran Nigam Limited xx
b. Uttar Haryana Bijli Vitran Nigam Limited xx
2.2.3 Himachal Pradesh xx
a. Himachal Pradesh State Electricity Board xx
2.2.4 Jammu & Kashmir xx
a. Power Development Department (Distribution)
xx
2.2.5 Punjab xx
a. Punjab State Power Corporation Limited xx
2.2.6 Rajasthan xx
a. Ajmer Vidyut Vitran Nigam Limited xx
b. Jaipur Vidyut Vitran Nigam Limited xx
c. Jodhpur Vidyut Vitran Nigam Limited xx
2.2.7 Uttar Pradesh xx
a. Dakshinanchal Vidyut Vitran Nigam Limited xx
b. Madhyananchal Vidyut Vitran Nigam Limited
xx
c. Purvanchal Vidyut Vitran Nigam Limited xx
d. Paschimanchal Vidyut Vitran Nigam Limited xx
e. Kanpur Electricity Supply Company Limited xx
f. Noida Power Company Limited xx
2.2.8 Uttarakhand xx
a. Uttarakhand Power Corporation Limited xx
2.3. Agricultural Tariff xx
Contents & Coverage
© ENINCON LLP 2016, All rights reserved
join the Future now
2.3.1 Delhi xx
a. BSES Rajdhani Power Limited xx
b. BSES Yamuna Power Limited xx
c. NDMC xx
d. Tata Power Delhi Distribution Limited xx
2.3.2 Haryana xx
a. Dakshin Haryana Bijli Vitran Nigam Limited xx
b. Uttar Haryana Bijli Vitran Nigam Limited xx
2.3.3 Himachal Pradesh xx
a. Himachal Pradesh State Electricity Board xx
2.3.4 Jammu & Kashmir xx
a. Power Development Department (Distribution)
xx
2.3.5 Punjab xx
a. Punjab State Power Corporation Limited xx
2.3.6 Rajasthan xx
a. Ajmer Vidyut Vitran Nigam Limited xx
b. Jaipur Vidyut Vitran Nigam Limited xx
c. Jodhpur Vidyut Vitran Nigam Limited xx
2.3.7 Uttar Pradesh xx
a. Dakshinanchal Vidyut Vitran Nigam Limited xx
b. Madhyananchal Vidyut Vitran Nigam Limited
xx
c. Purvanchal Vidyut Vitran Nigam Limited xx
d. Paschimanchal Vidyut Vitran Nigam Limited xx
e. Kanpur Electricity Supply Company Limited xx
f. Noida Power Company Limited xx
2.3.8 Uttarakhand xx
a. Uttarakhand Power Corporation Limited xx
Contents & Coverage
© ENINCON LLP 2016, All rights reserved
join the Future now
2.4. Domestic Tariff xx
2.4.1 Delhi xx
a. BSES Rajdhani Power Limited xx
b. BSES Yamuna Power Limited xx
c. NDMC xx
d. Tata Power Delhi Distribution Limited xx
2.4.2 Haryana xx
a. Dakshin Haryana Bijli Vitran Nigam Limited xx
b. Uttar Haryana Bijli Vitran Nigam Limited xx
2.4.3 Himachal Pradesh xx
a. Himachal Pradesh State Electricity Board xx
2.4.4 Jammu & Kashmir xx
a. Power Development Department (Distribution)
xx
2.4.5 Punjab xx
a. Punjab State Power Corporation Limited xx
2.4.6 Rajasthan xx
a. Ajmer Vidyut Vitran Nigam Limited xx
b. Jaipur Vidyut Vitran Nigam Limited xx
c. Jodhpur Vidyut Vitran Nigam Limited xx
2.4.7 Uttar Pradesh xx
a. Dakshinanchal Vidyut Vitran Nigam Limited xx
b. Madhyananchal Vidyut Vitran Nigam Limited
xx
c. Purvanchal Vidyut Vitran Nigam Limited xx
d. Paschimanchal Vidyut Vitran Nigam Limited xx
e. Kanpur Electricity Supply Company Limited xx
f. Noida Power Company Limited xx
2.4.8 Uttarakhand xx
a. Uttarakhand Power Corporation Limited xx
2.5. Temporary Tariff xx
Contents & Coverage
© ENINCON LLP 2016, All rights reserved
join the Future now
2.5.1 Delhi xx
a. BSES Rajdhani Power Limited xx
b. BSES Yamuna Power Limited xx
c. NDMC xx
d. Tata Power Delhi Distribution Limited xx
2.5.2 Haryana xx
a. Dakshin Haryana Bijli Vitran Nigam Limited xx
b. Uttar Haryana Bijli Vitran Nigam Limited xx
2.5.3 Himachal Pradesh xx
a. Himachal Pradesh State Electricity Board xx
2.5.4 Jammu & Kashmir xx
a. Power Development Department (Distribution)
xx
2.5.5 Punjab xx
a. Punjab State Power Corporation Limited xx
2.5.6 Rajasthan xx
a. Ajmer Vidyut Vitran Nigam Limited xx
b. Jaipur Vidyut Vitran Nigam Limited xx
c. Jodhpur Vidyut Vitran Nigam Limited xx
2.5.7 Uttar Pradesh xx
a. Dakshinanchal Vidyut Vitran Nigam Limited xx
b. Madhyananchal Vidyut Vitran Nigam Limited
xx
c. Purvanchal Vidyut Vitran Nigam Limited xx
d. Paschimanchal Vidyut Vitran Nigam Limited xx
e. Kanpur Electricity Supply Company Limited xx
f. Noida Power Company Limited xx
2.5.8 Uttarakhand xx
a. Uttarakhand Power Corporation Limited xx
Contents & Coverage
© ENINCON LLP 2016, All rights reserved
join the Future now
3. Western Region – Power Distribution Tariff in India 2016
xx
3.1. Industrial Tariff xx
3.1.1 Chhattisgarh xx
a. Chhattisgarh State Power Distribution Company Ltd.
xx
3.1.2 Gujarat xx
a. Dakshin Gujarat Vij Company Ltd. xx
b. Madhya Gujarat Vij Company Ltd. xx
c. Paschim Gujarat Vij Company Ltd. xx
d. Uttar Gujarat Vij Company Ltd. xx
e. Torrent Power Ltd. xx
f. Torrent Power Ltd. xx
3.1.3 Madhya Pradesh xx
a. Madhya Pradesh Paschim Kshetra Vidyut Vitaran Company Ltd.
xx
b. Madhya Pradesh Poorv Kshetra Vidyut Vitaran Company Ltd.
xx
c. Madhya Pradesh Madhya Kshetra Vidyut Vitaran Company Ltd.
xx
3.1.4 Maharashtra xx
a. BEST Undertaking xx
b. Maharashtra State Electricity Distribution Co. Ltd.
xx
c. Reliance Energy Ltd. xx
d. TATA Power Ltd. xx
3.1.5 Goa xx
a. Electricity Department, Goa xx
3.2. Commercial Tariff xx
3.2.1 Chhattisgarh xx
a. Chhattisgarh State Power Distribution Company Ltd.
xx
Contents & Coverage
© ENINCON LLP 2016, All rights reserved
join the Future now
3.2.2 Gujarat xx
a. Dakshin Gujarat Vij Company Ltd. xx
b. Madhya Gujarat Vij Company Ltd. xx
c. Paschim Gujarat Vij Company Ltd. xx
d. Uttar Gujarat Vij Company Ltd. xx
e. Torrent Power Ltd. xx
f. Torrent Power Ltd. xx
3.2.3 Madhya Pradesh xx
a. Madhya Pradesh Paschim Kshetra Vidyut Vitaran Company Ltd.
xx
b. Madhya Pradesh Poorv Kshetra Vidyut Vitaran Company Ltd.
xx
c. Madhya Pradesh Madhya Kshetra Vidyut Vitaran Company Ltd.
xx
3.2.4 Maharashtra xx
a. BEST Undertaking xx
b. Maharashtra State Electricity Distribution Co. Ltd.
xx
c. Reliance Energy Ltd. xx
d. TATA Power Ltd. xx
3.2.5 Goa xx
a. Electricity Department, Goa xx
3.3. Agricultural Tariff xx
3.3.1 Chhattisgarh xx
a. Chhattisgarh State Power Distribution Company Ltd.
xx
3.3.2 Gujarat xx
a. Dakshin Gujarat Vij Company Ltd. xx
b. Madhya Gujarat Vij Company Ltd. xx
c. Paschim Gujarat Vij Company Ltd. xx
d. Uttar Gujarat Vij Company Ltd. xx
e. Torrent Power Ltd. xx
Contents & Coverage
© ENINCON LLP 2016, All rights reserved
join the Future now
f. Torrent Power Ltd. xx
3.3.3 Madhya Pradesh xx
a. Madhya Pradesh Paschim Kshetra Vidyut Vitaran Company Ltd.
xx
b. Madhya Pradesh Poorv Kshetra Vidyut
Vitaran Company Ltd.
xx
c. Madhya Pradesh Madhya Kshetra Vidyut Vitaran Company Ltd.
xx
3.3.4 Maharashtra xx
a. BEST Undertaking xx
b. Maharashtra State Electricity Distribution Co. Ltd.
xx
c. Reliance Energy Ltd. xx
d. TATA Power Ltd. xx
3.3.5 Goa xx
a. Electricity Department, Goa xx
3.4. Domestic Tariff xx
3.4.1 Chhattisgarh xx
a. Chhattisgarh State Power Distribution Company Ltd.
xx
3.4.2 Gujarat xx
a. Dakshin Gujarat Vij Company Ltd. xx
b. Madhya Gujarat Vij Company Ltd. xx
c. Paschim Gujarat Vij Company Ltd. xx
d. Uttar Gujarat Vij Company Ltd. xx
e. Torrent Power Ltd. xx
3.4.3 Madhya Pradesh xx
a. Madhya Pradesh Paschim Kshetra Vidyut Vitaran Company Ltd.
xx
b. Madhya Pradesh Poorv Kshetra Vidyut Vitaran Company Ltd.
xx
c. Madhya Pradesh Madhya Kshetra Vidyut Vitaran Company Ltd.
xx
3.4.4 Maharashtra xx
Contents & Coverage
© ENINCON LLP 2016, All rights reserved
join the Future now
a. BEST Undertaking xx
b. Maharashtra State Electricity Distribution Co. Ltd.
xx
c. Reliance Energy Ltd. xx
d. TATA Power Ltd. xx
3.4.5 Goa xx
a. Electricity Department, Goa xx
3.5. Temporary Tariff xx
3.5.1 Chhattisgarh xx
a. Chhattisgarh State Power Distribution Company Ltd.
xx
3.5.2 Gujarat xx
a. Dakshin Gujarat Vij Company Ltd. xx
b. Madhya Gujarat Vij Company Ltd. xx
c. Paschim Gujarat Vij Company Ltd. xx
d. Uttar Gujarat Vij Company Ltd. xx
e. Torrent Power Ltd. xx
f. Torrent Power Ltd. xx
3.5.3 Madhya Pradesh xx
a. Madhya Pradesh Paschim Kshetra Vidyut Vitaran Company Ltd.
xx
b. Madhya Pradesh Poorv Kshetra Vidyut Vitaran Company Ltd.
xx
c. Madhya Pradesh Madhya Kshetra Vidyut
Vitaran Company Ltd.
xx
3.5.4 Maharashtra xx
a. BEST Undertaking xx
b. Maharashtra State Electricity Distribution Co. Ltd.
xx
c. Reliance Energy Ltd. xx
d. TATA Power Ltd. xx
3.5.5 Goa xx
Contents & Coverage
© ENINCON LLP 2016, All rights reserved
join the Future now
a. Electricity Department, Goa xx
4. Eastern Region – Power Distribution Tariff in India 2016
xx
4.1. Industrial Tariff xx
4.1.1 Bihar xx
a. Bihar State Electricity Board xx
4.1.2 Jharkhand xx
a. Damodar Valley Corporation xx
b. Jamshedpur Utility & Services Company xx
c. Bokaro Power Supply Company Pvt. Ltd. xx
d. TATA Steel Ltd. xx
4.1.3 Odisha xx
a. Central Electricity Supply Company of Orissa Ltd.
xx
b. North Eastern Electricity Supply Company of Orissa Ltd.
xx
c. Southern Electricity Supply Company of Orissa Ltd.
xx
d. Western Electricity Supply Company of Orissa Ltd.
xx
4.1.4 West Bengal xx
a. Calcutta Electricity Supply Company Ltd. xx
b. DPSC Ltd.. xx
c. Durgapur Projects Ltd. xx
d. West Bengal State Electricity Distribution Company Ltd.
xx
4.1.5 Sikkim xx
a. Energy & Power Department, Govt. of Sikkim
xx
4.2. Commercial Tariff xx
4.2.1 Bihar xx
a. Bihar State Electricity Board xx
4.2.2 Jharkhand xx
Contents & Coverage
© ENINCON LLP 2016, All rights reserved
join the Future now
a. Damodar Valley Corporation xx
b. Jamshedpur Utility & Services Company xx
c. Bokaro Power Supply Company Pvt. Ltd. xx
d. TATA Steel Ltd. xx
4.2.3 Odisha xx
a. Central Electricity Supply Company of Orissa Ltd.
xx
b. North Eastern Electricity Supply Company of Orissa Ltd.
xx
c. Southern Electricity Supply Company of Orissa Ltd.
xx
d. Western Electricity Supply Company of Orissa Ltd.
xx
4.2.4 West Bengal xx
a. Calcutta Electricity Supply Company Ltd. xx
b. DPSC Ltd.. xx
c. Durgapur Projects Ltd. xx
d. West Bengal State Electricity Distribution Company Ltd.
xx
4.2.5 Sikkim xx
a. Energy & Power Department, Govt. of Sikkim
xx
4.3. Agricultural Tariff xx
4.3.1 Bihar xx
a. Bihar State Electricity Board xx
4.3.2 Jharkhand xx
a. Damodar Valley Corporation xx
b. Jamshedpur Utility & Services Company xx
c. Bokaro Power Supply Company Pvt. Ltd. xx
d. TATA Steel Ltd. xx
4.3.3 Odisha xx
a. Central Electricity Supply Company of Orissa Ltd.
xx
Contents & Coverage
© ENINCON LLP 2016, All rights reserved
join the Future now
b. North Eastern Electricity Supply Company of Orissa Ltd.
xx
c. Southern Electricity Supply Company of Orissa Ltd.
xx
d. Western Electricity Supply Company of Orissa Ltd.
xx
4.3.4 West Bengal xx
a. Calcutta Electricity Supply Company Ltd. xx
b. DPSC Ltd.. xx
c. Durgapur Projects Ltd. xx
d. West Bengal State Electricity Distribution Company Ltd.
xx
4.3.5 Sikkim xx
a. Energy & Power Department, Govt. of Sikkim
xx
4.4. Domestic Tariff xx
4.4.1 Bihar xx
a. Bihar State Electricity Board xx
4.4.2 Jharkhand xx
a. Damodar Valley Corporation xx
b. Jamshedpur Utility & Services Company xx
c. Bokaro Power Supply Company Pvt. Ltd. xx
d. TATA Steel Ltd. xx
4.4.3 Odisha xx
a. Central Electricity Supply Company of Orissa Ltd.
xx
b. North Eastern Electricity Supply Company of Orissa Ltd.
xx
c. Southern Electricity Supply Company of Orissa Ltd.
xx
d. Western Electricity Supply Company of Orissa Ltd.
xx
4.4.4 West Bengal xx

Contents & Coverage
© ENINCON LLP 2016, All rights reserved
join the Future now
a. Calcutta Electricity Supply Company Ltd. xx
b. DPSC Ltd.. xx
c. Durgapur Projects Ltd. xx
d. West Bengal State Electricity Distribution Company Ltd.
xx
4.4.5 Sikkim xx
a. Energy & Power Department, Govt. of Sikkim
xx
4.5. Temporary Tariff xx
4.5.1 Bihar xx
a. Bihar State Electricity Board xx
4.5.2 Jharkhand xx
a. Damodar Valley Corporation xx
b. Jamshedpur Utility & Services Company xx
c. Bokaro Power Supply Company Pvt. Ltd. xx
d. TATA Steel Ltd. xx
4.5.3 Odisha xx
a. Central Electricity Supply Company of Orissa Ltd.
xx
b. North Eastern Electricity Supply Company of Orissa Ltd.
xx
c. Southern Electricity Supply Company of Orissa Ltd.
xx
d. Western Electricity Supply Company of Orissa Ltd.
xx
4.5.4 West Bengal xx
a. Calcutta Electricity Supply Company Ltd. xx
b. DPSC Ltd.. xx
c. Durgapur Projects Ltd. xx
d. West Bengal State Electricity Distribution Company Ltd.
xx
4.5.5 Sikkim xx
a. Energy & Power Department, Govt. of Sikkim
xx
Contents & Coverage
© ENINCON LLP 2016, All rights reserved
join the Future now
5. Southern Region – Power Distribution Tariff in India 2016
xx
5.1. Industrial Tariff xx
5.1.1 Andhra Pradesh xx
a. Central Power Distribution Company of A.P. Ltd.
xx
b. Eastern Power Distribution Company of A.P. Ltd.
xx
c. Northern Power Distribution Company of A.P. Ltd.
xx
d. Southern Power Distribution Company of A.P. Ltd.
xx
5.1.2 Karnataka xx
a. Bangalore Electricity Supply Company Ltd. xx
b. Chamundeshwari Electricity Supply Company Ltd.
xx
c. Gulbarga Electricity Supply Company Ltd. xx
d. Hubli Electricity Supply Company Ltd. xx
e. Mangalore Electricity Supply Company Ltd. xx
5.1.3 Tamil Nadu xx
a. Tamil Nadu Electricity Generation & Distribution Co. Ltd.
xx
5.1.4 Kerala xx
a. Kerala State Electricity Board xx
5.2. Commercial Tariff xx
5.2.1 Andhra Pradesh xx
a. Central Power Distribution Company of A.P. Ltd.
xx
b. Eastern Power Distribution Company of A.P. Ltd.
xx
c. Northern Power Distribution Company of A.P. Ltd.
xx
d. Southern Power Distribution Company of A.P. Ltd.
xx
5.2.2 Karnataka xx

Contents & Coverage
© ENINCON LLP 2016, All rights reserved
join the Future now
a. Bangalore Electricity Supply Company Ltd. xx
b. Chamundeshwari Electricity Supply Company Ltd.
xx
c. Gulbarga Electricity Supply Company Ltd. xx
d. Hubli Electricity Supply Company Ltd. xx
e. Mangalore Electricity Supply Company Ltd. xx
5.2.3 Tamil Nadu xx
a. Tamil Nadu Electricity Generation & Distribution Co. Ltd.
xx
5.2.4 Kerala xx
a. Kerala State Electricity Board xx
5.3. Agricultural Tariff xx
5.3.1 Andhra Pradesh xx
a. Central Power Distribution Company of A.P. Ltd.
xx
b. Eastern Power Distribution Company of A.P. Ltd.
xx
c. Northern Power Distribution Company of A.P. Ltd.
xx
d. Southern Power Distribution Company of A.P. Ltd.
xx
5.3.2 Karnataka xx
a. Bangalore Electricity Supply Company Ltd. xx
b. Chamundeshwari Electricity Supply Company Ltd.
xx
c. Gulbarga Electricity Supply Company Ltd. xx
d. Hubli Electricity Supply Company Ltd. xx
e. Mangalore Electricity Supply Company Ltd. xx
5.3.3 Tamil Nadu xx
a. Tamil Nadu Electricity Generation & Distribution Co. Ltd.
xx
5.3.4 Kerala xx
a. Kerala State Electricity Board xx
Contents & Coverage
© ENINCON LLP 2016, All rights reserved
join the Future now
5.4. Domestic Tariff xx
5.4.1 Andhra Pradesh xx
a. Central Power Distribution Company of A.P. Ltd.
xx
b. Eastern Power Distribution Company of A.P. Ltd.
xx
c. Northern Power Distribution Company of A.P. Ltd.
xx
d. Southern Power Distribution Company of A.P. Ltd.
xx
5.4.2 Karnataka xx
a. Bangalore Electricity Supply Company Ltd. xx
b. Chamundeshwari Electricity Supply Company Ltd.
xx
c. Gulbarga Electricity Supply Company Ltd. xx
d. Hubli Electricity Supply Company Ltd. xx
e. Mangalore Electricity Supply Company Ltd. xx
5.4.3 Tamil Nadu xx
a. Tamil Nadu Electricity Generation & Distribution Co. Ltd.
xx
5.4.4 Kerala xx
a. Kerala State Electricity Board xx
5.5. Temporary Tariff xx
5.5.1 Andhra Pradesh xx
a. Central Power Distribution Company of A.P. Ltd.
xx
b. Eastern Power Distribution Company of A.P. Ltd.
xx
c. Northern Power Distribution Company of A.P. Ltd.
xx
d. Southern Power Distribution Company of A.P. Ltd.
xx
5.5.2 Karnataka xx
a. Bangalore Electricity Supply Company Ltd. xx
Contents & Coverage
© ENINCON LLP 2016, All rights reserved
join the Future now
b. Chamundeshwari Electricity Supply Company Ltd.
xx
c. Gulbarga Electricity Supply Company Ltd. xx
d. Hubli Electricity Supply Company Ltd. xx
e. Mangalore Electricity Supply Company Ltd. xx
5.5.3 Tamil Nadu xx
a. Tamil Nadu Electricity Generation & Distribution Co. Ltd.
xx
5.5.4 Kerala xx
a. Kerala State Electricity Board xx
6. ENINCON’s Analysis xx
6.1 Intra State Discom’s Analysis xx
6.1.1 Zones with Highest Revenues xx
6.1.2 Circles with Highest Revenues xx
6.1.3 AT&C Losses xx
a. Losses Within Different Circles xx
b. Metering Efficiency of Discoms xx
c. Collection Efficiency of Discoms xx
6.1.4 Standard Operating Procedures (SOP) xx
6.1.5 Discom with Highest Degree of Automation
xx
6.1.6 Truing Up Schedule 2014-15 xx
6.2 Inter State Discom’s Analysis xx
6.2.1 Best Performing Discoms xx
6.2.2 Best Practices followed amongst Discoms
xx
6.3 CERC Tariff Regulation 2014-19 Analysis xx
6.4 Tariff Comparison 2015-16 xx
6.5 New Tariff Policy/Regulation Analysis xx
7. ENINCON’s Recommendations xx