Embed Size (px)
Citation preview
Indonesia Most Popular
Mobile Browser Apps
2014
Omnibus Popular Brand Index
Date: December 2014
2
A. Detail findings
1. Popular Brand Index
2. Brand awareness
3. Expansive
4. Frequent User
5. Future Intention
6. Switching
7. General Information
3
A. Detail findings
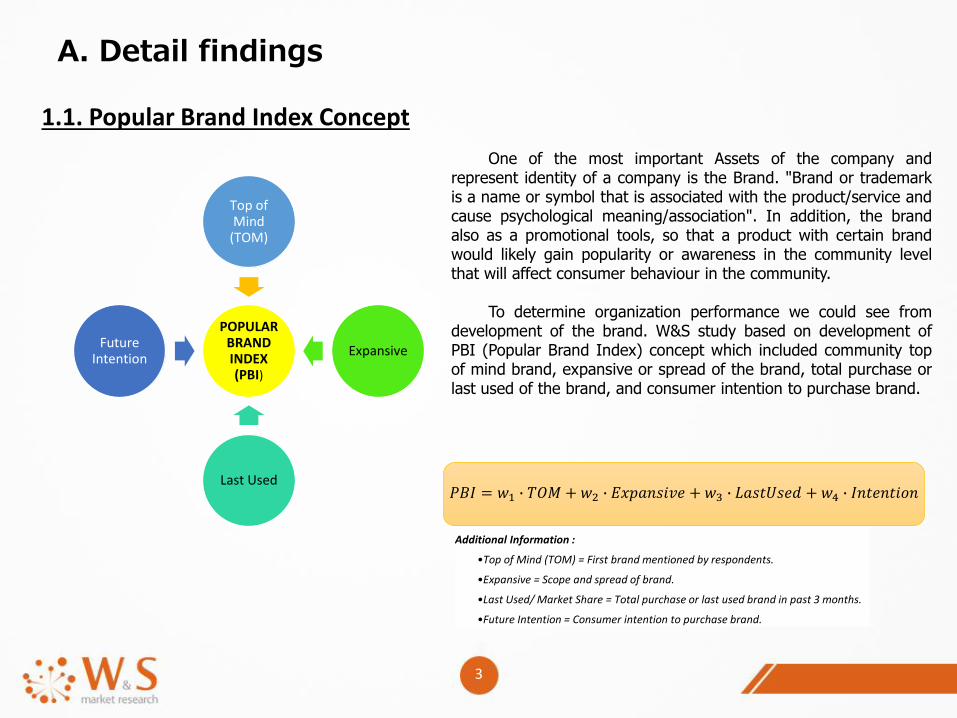
1.1. Popular Brand Index Concept
POPULAR BRAND INDEX (PBI)
Top of Mind
(TOM)
Expansive
Last Used
Future Intention
𝑃𝐵𝐼 = 𝑤1 ∙ 𝑇𝑂𝑀 + 𝑤2 ∙ 𝐸𝑥𝑝𝑎𝑛𝑠𝑖𝑣𝑒 + 𝑤3 ∙ 𝐿𝑎𝑠𝑡𝑈𝑠𝑒𝑑 + 𝑤4 ∙ 𝐼𝑛𝑡𝑒𝑛𝑡𝑖𝑜𝑛
Additional Information :
• Top of Mind (TOM) = First brand mentioned by respondents.
• Expansive = Scope and spread of brand.
• Last Used/ Market Share = Total purchase or last used brand in past 3 months.
• Future Intention = Consumer intention to purchase brand.
One of the most important Assets of the company andrepresent identity of a company is the Brand. "Brand or trademarkis a name or symbol that is associated with the product/service andcause psychological meaning/association". In addition, the brandalso as a promotional tools, so that a product with certain brandwould likely gain popularity or awareness in the community levelthat will affect consumer behaviour in the community.
To determine organization performance we could see fromdevelopment of the brand. W&S study based on development ofPBI (Popular Brand Index) concept which included community topof mind brand, expansive or spread of the brand, total purchase orlast used of the brand, and consumer intention to purchase brand.
4
A. Detail findings
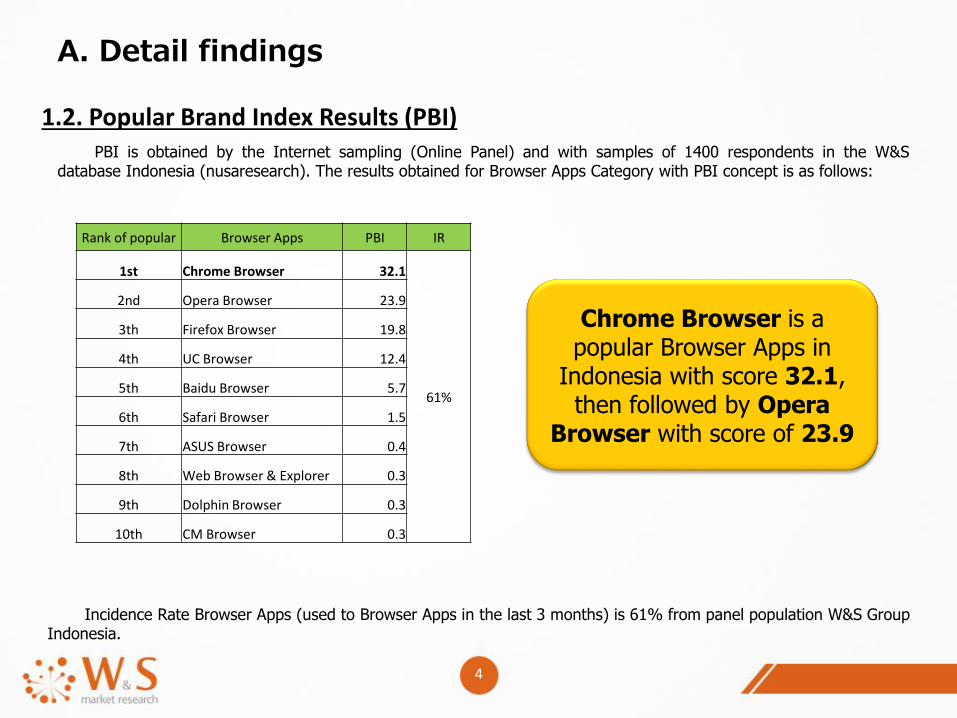
1.2. Popular Brand Index Results (PBI)PBI is obtained by the Internet sampling (Online Panel) and with samples of 1400 respondents in the W&S
database Indonesia (nusaresearch). The results obtained for Browser Apps Category with PBI concept is as follows:
Incidence Rate Browser Apps (used to Browser Apps in the last 3 months) is 61% from panel population W&S GroupIndonesia.
Chrome Browser is a popular Browser Apps in
Indonesia with score 32.1, then followed by Opera
Browser with score of 23.9
Rank of popular Browser Apps PBI IR
1st Chrome Browser 32.1
61%
2nd Opera Browser 23.9
3th Firefox Browser 19.8
4th UC Browser 12.4
5th Baidu Browser 5.7
6th Safari Browser 1.5
7th ASUS Browser 0.4
8th Web Browser & Explorer 0.3
9th Dolphin Browser 0.3
10th CM Browser 0.3
5
A. Detail findings
1. Popular Brand Index
2. Brand Awareness
3. Expansive
4. Frequent User
5. Future Intention
6. Switching
7. General Information
6
A. Detail findings
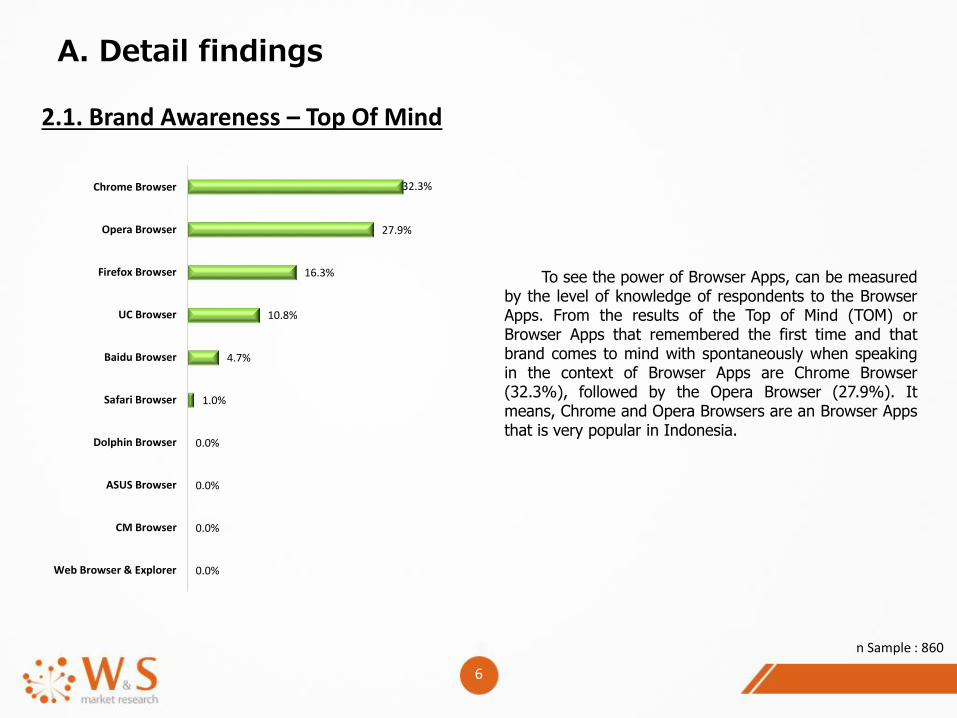
2.1. Brand Awareness – Top Of Mind
n Sample : 860
To see the power of Browser Apps, can be measuredby the level of knowledge of respondents to the BrowserApps. From the results of the Top of Mind (TOM) orBrowser Apps that remembered the first time and thatbrand comes to mind with spontaneously when speakingin the context of Browser Apps are Chrome Browser(32.3%), followed by the Opera Browser (27.9%). Itmeans, Chrome and Opera Browsers are an Browser Appsthat is very popular in Indonesia.
32.3%
27.9%
16.3%
10.8%
4.7%
1.0%
0.0%
0.0%
0.0%
0.0%
Chrome Browser
Opera Browser
Firefox Browser
UC Browser
Baidu Browser
Safari Browser
Dolphin Browser
ASUS Browser
CM Browser
Web Browser & Explorer
7
68.5%61.0%
50.5%
23.3%30.6%
7.8%0.7% 4.8% 0.1% 0.9%
19.8%24.2%
31.2%
34.8% 21.4%
24.2%
21.2% 16.5%
7.9% 4.8%
88.3%85.2% 81.7%
58.1%
52.0%
32.0%
21.9% 21.3%
8.0%5.7%
ChromeBrowser
OperaBrowser
FirefoxBrowser
BaiduBrowser
UC Browser SafariBrowser
WebBrowser &Explorer
DolphinBrowser
ASUSBrowser
CM Browser
Aided
Unaided
Total Awareness
A. Detail findings
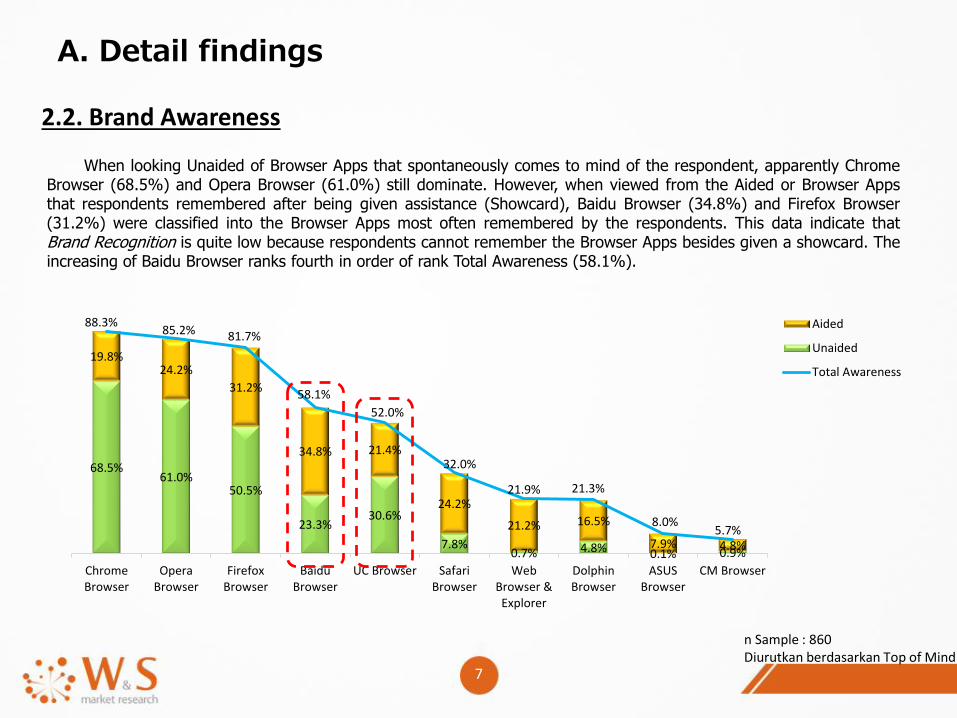
2.2. Brand Awareness
When looking Unaided of Browser Apps that spontaneously comes to mind of the respondent, apparently ChromeBrowser (68.5%) and Opera Browser (61.0%) still dominate. However, when viewed from the Aided or Browser Appsthat respondents remembered after being given assistance (Showcard), Baidu Browser (34.8%) and Firefox Browser(31.2%) were classified into the Browser Apps most often remembered by the respondents. This data indicate thatBrand Recognition is quite low because respondents cannot remember the Browser Apps besides given a showcard. Theincreasing of Baidu Browser ranks fourth in order of rank Total Awareness (58.1%).
n Sample : 860Diurutkan berdasarkan Top of Mind
8
A. Detail findings
1. Popular Brand Index
2. Brand Awareness
3. Expansive
4. Frequent User
5. Future Intention
6. Switching
7. General Information
9
A. Detail findings
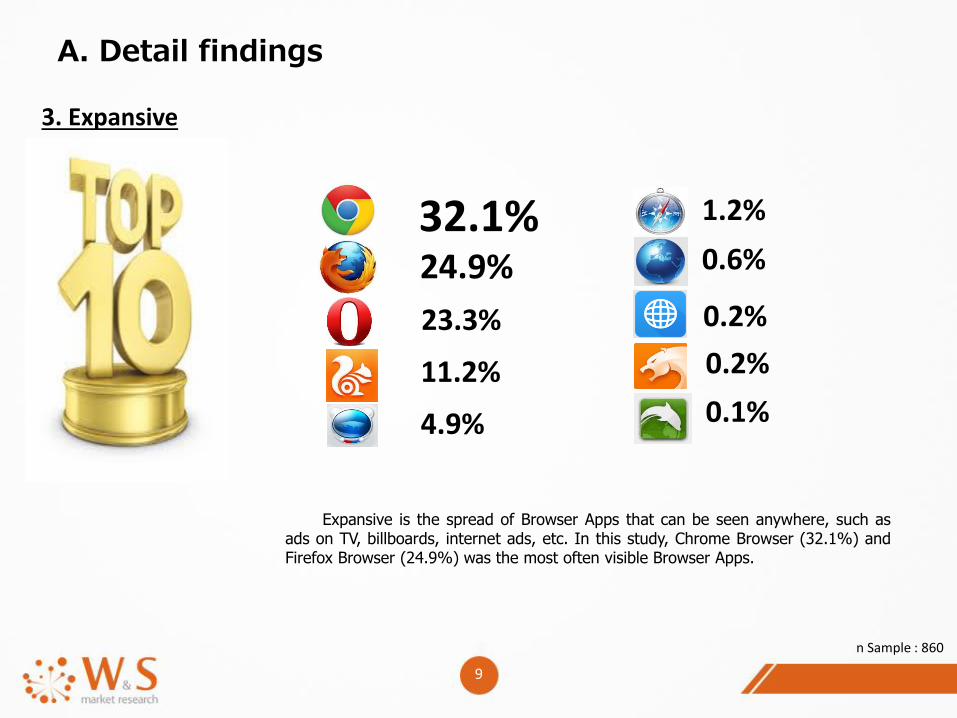
3. Expansive
n Sample : 860
Expansive is the spread of Browser Apps that can be seen anywhere, such asads on TV, billboards, internet ads, etc. In this study, Chrome Browser (32.1%) andFirefox Browser (24.9%) was the most often visible Browser Apps.
32.1%24.9%
23.3%
11.2%
4.9%
1.2%
0.6%
0.2%
0.2%
0.1%
10
A. Detail findings
4. Frequent User
n Sample : 860
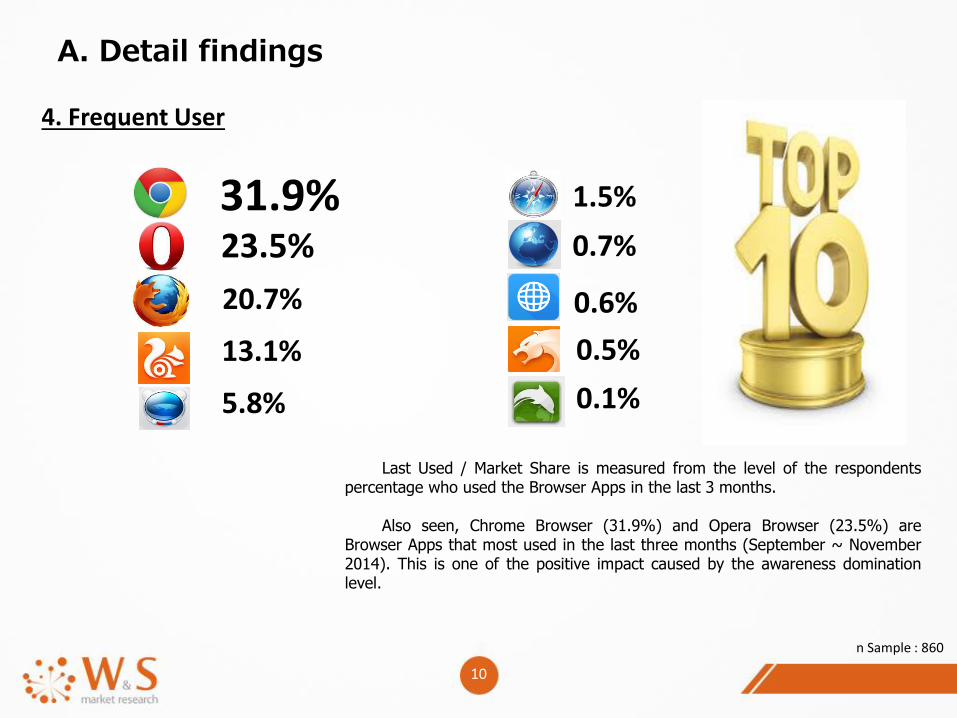
Last Used / Market Share is measured from the level of the respondentspercentage who used the Browser Apps in the last 3 months.
Also seen, Chrome Browser (31.9%) and Opera Browser (23.5%) areBrowser Apps that most used in the last three months (September ~ November2014). This is one of the positive impact caused by the awareness dominationlevel.
31.9%23.5%
20.7%
13.1%
5.8%
1.5%
0.7%
0.6%
0.5%
0.1%
11
A. Detail findings
5. Future Intention
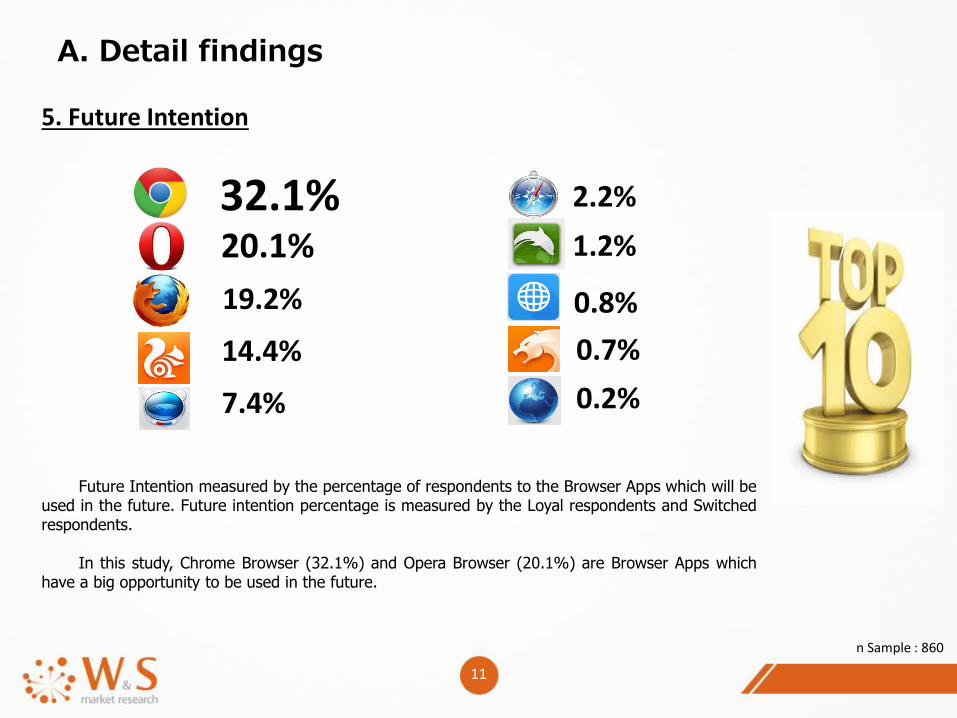
Future Intention measured by the percentage of respondents to the Browser Apps which will beused in the future. Future intention percentage is measured by the Loyal respondents and Switchedrespondents.
In this study, Chrome Browser (32.1%) and Opera Browser (20.1%) are Browser Apps whichhave a big opportunity to be used in the future.
n Sample : 860
32.1%20.1%
19.2%
14.4%
7.4%
2.2%
1.2%
0.8%
0.7%
0.2%
12
A. Detail findings
1. Popular Brand Index
2. Brand Awareness
3. Expansive
4. Frequent User
5. Future Intention
6. Switching
7. General Information
13
A. Detail findings
6.1. Switching
n Sample : 860
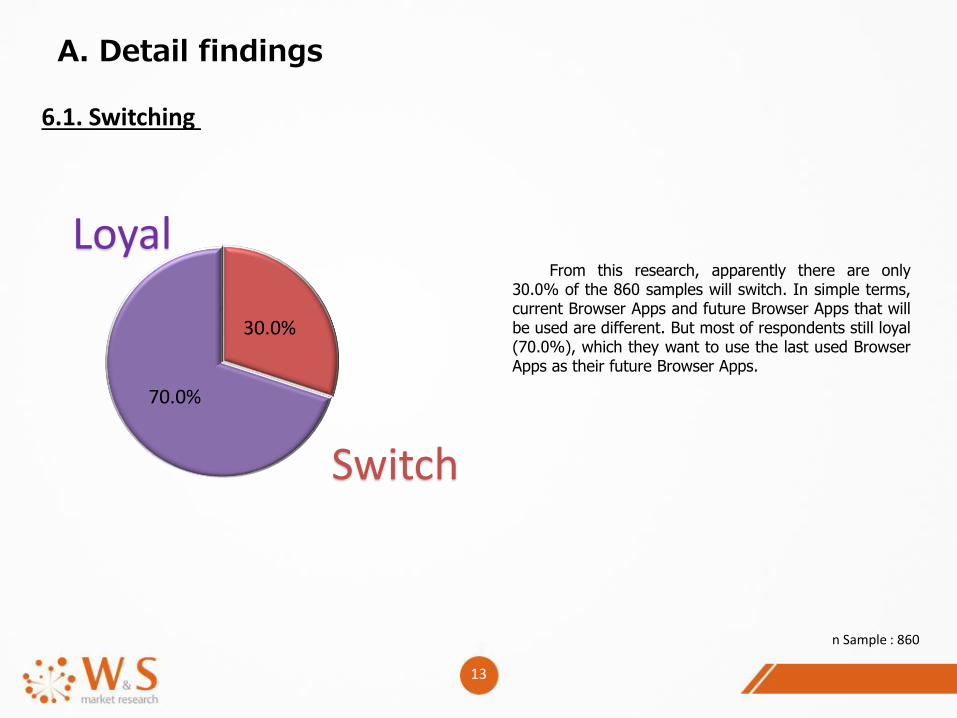
From this research, apparently there are only30.0% of the 860 samples will switch. In simple terms,current Browser Apps and future Browser Apps that willbe used are different. But most of respondents still loyal(70.0%), which they want to use the last used BrowserApps as their future Browser Apps.
Loyal
Switch
30.0%
70.0%
14
A. Detail findings
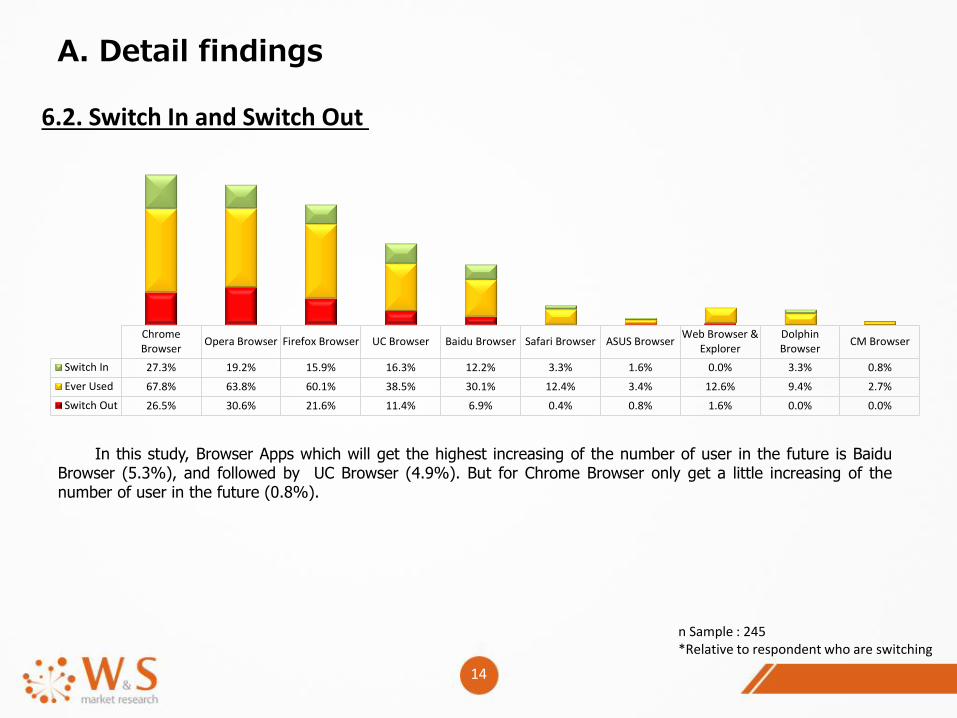
6.2. Switch In and Switch Out
n Sample : 245*Relative to respondent who are switching
In this study, Browser Apps which will get the highest increasing of the number of user in the future is BaiduBrowser (5.3%), and followed by UC Browser (4.9%). But for Chrome Browser only get a little increasing of thenumber of user in the future (0.8%).
ChromeBrowser
Opera Browser Firefox Browser UC Browser Baidu Browser Safari Browser ASUS BrowserWeb Browser &
ExplorerDolphinBrowser
CM Browser
Switch In 27.3% 19.2% 15.9% 16.3% 12.2% 3.3% 1.6% 0.0% 3.3% 0.8%
Ever Used 67.8% 63.8% 60.1% 38.5% 30.1% 12.4% 3.4% 12.6% 9.4% 2.7%
Switch Out 26.5% 30.6% 21.6% 11.4% 6.9% 0.4% 0.8% 1.6% 0.0% 0.0%
15
A. Detail findings
1. Popular Brand Index
2. Brand Awareness
3. Expansive
4. Frequent User
5. Future Intention
6. Switching
7. General Information
16
A. Detail findings
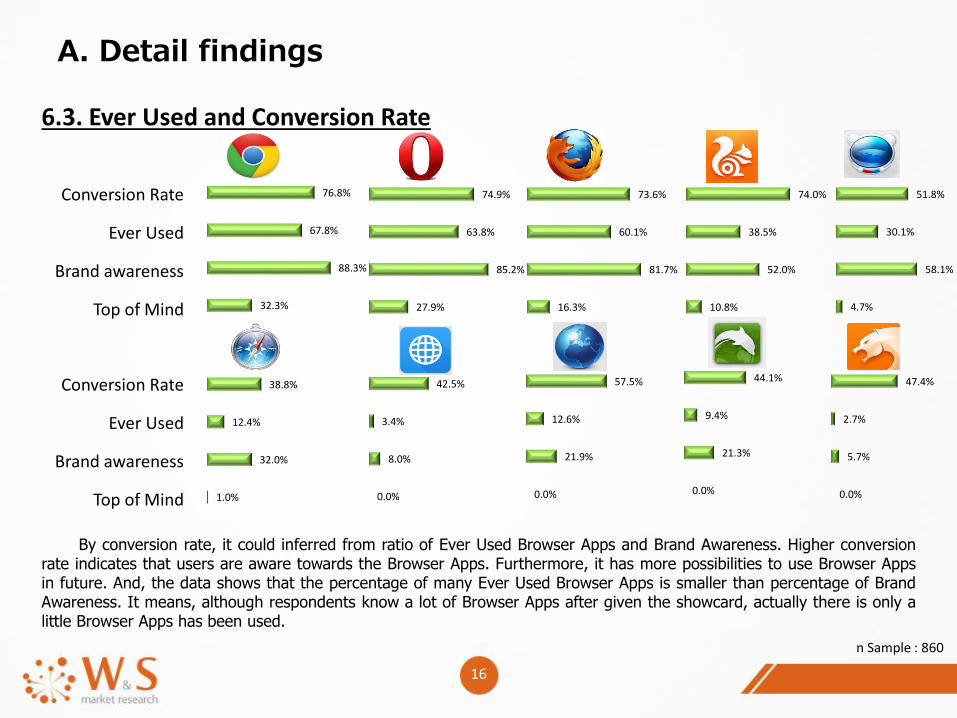
6.3. Ever Used and Conversion Rate
Conversion Rate
Ever Used
Brand awareness
Top of Mind
Conversion Rate
Ever Used
Brand awareness
Top of Mind
n Sample : 860
By conversion rate, it could inferred from ratio of Ever Used Browser Apps and Brand Awareness. Higher conversionrate indicates that users are aware towards the Browser Apps. Furthermore, it has more possibilities to use Browser Appsin future. And, the data shows that the percentage of many Ever Used Browser Apps is smaller than percentage of BrandAwareness. It means, although respondents know a lot of Browser Apps after given the showcard, actually there is only alittle Browser Apps has been used.
4.7%
58.1%
30.1%
51.8%
0.0%
5.7%
2.7%
47.4%
27.9%
85.2%
63.8%
74.9%
10.8%
52.0%
38.5%
74.0%
16.3%
81.7%
60.1%
73.6%
32.3%
88.3%
67.8%
76.8%
1.0%
32.0%
12.4%
38.8%
0.0%
8.0%
3.4%
42.5%
0.0%
21.9%
12.6%
57.5%
0.0%
21.3%
9.4%
44.1%
17
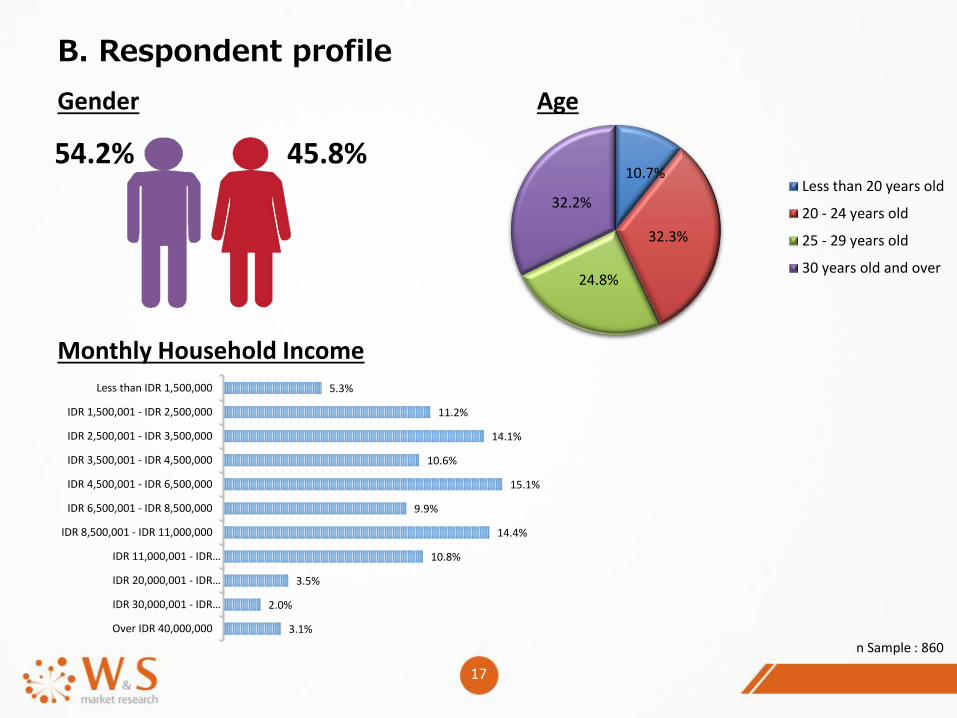
B. Respondent profile
Monthly Household Income
54.2% 45.8%
Age
n Sample : 860
Gender
10.7%
32.3%
24.8%
32.2%Less than 20 years old
20 - 24 years old
25 - 29 years old
30 years old and over
3.1%
2.0%
3.5%
10.8%
14.4%
9.9%
15.1%
10.6%
14.1%
11.2%
5.3%
Over IDR 40,000,000
IDR 30,000,001 - IDR…
IDR 20,000,001 - IDR…
IDR 11,000,001 - IDR…
IDR 8,500,001 - IDR 11,000,000
IDR 6,500,001 - IDR 8,500,000
IDR 4,500,001 - IDR 6,500,000
IDR 3,500,001 - IDR 4,500,000
IDR 2,500,001 - IDR 3,500,000
IDR 1,500,001 - IDR 2,500,000
Less than IDR 1,500,000
PT. Nusaresearch is a 100% Japanese investment. Our main professions are ‘Online market research’, ‘Web creative’ and ‘Web marketing’.Online research is conducted based on Nusaresearch – our actively managed over 100,000 members panel with various segmentationsacross Indonesia.
FOR FURTHER INQUIRIES, PLEASE CONTACT:
PT. Nusaresearch» Address: 21H Grand Slipi Tower, Jl. S. Parman Kav. 22-24, Slipi, Jakarta Barat, Indonesia 11480» Office phone: (+6221) 29 022 227 Fax: (+ 6221) 29 022 365» Email: [email protected] » Website: http://nusaresearch.com/
The copyright of this report belongs to PT. Nusaresearch Company. The results (analyzing, wording, data, tables and graphs) ofthis survey can be publicly used, but must be cited and sourced from PT. Nusaresearch Company (also include its website addresshttp://nusaresearch.com).