Embed Size (px)
Citation preview

Deriving Knowledge from Data at Scale

Deriving Knowledge from Data at Scale
Read this… A brilliant read that offers
an accessible overview of predictive
analytics, technical but at the same
time a recreational read with ample
practical examples, and it provides
footnotes for further study...
I highly recommend it…

Deriving Knowledge from Data at Scale
Review of Course Plan…
W5: Clustering Review
Clustering Assignment
W6: Feature Select/Create
SVMs & Regression
Data Prep Assignment
Kaggle Contest HW
W7: SVMs Cont’d

Deriving Knowledge from Data at Scale
• Opening Discussion 30 minutesReview Discussion…
• Data ScienceHands On 60 minutes
• Break 5 minutes
• Data Science Modelling 30 minutesModel performance evaluation…
• Machine Learning Boot Camp ~60 minutesClustering, k-Means…
• Close

Deriving Knowledge from Data at Scale
• Clustering
• Clustering in Weka
• Class Imbalance
• Performance Measures

Deriving Knowledge from Data at Scale
• Opening Discussion 30 minutesReview Discussion…
• Data ScienceHands On 60 minutes
• Break 5 minutes
• Data Science Modelling 30 minutesModel performance evaluation…
• Machine Learning Boot Camp ~60 minutesClustering, k-Means…
• Close
Deriving Knowledge from Data at Scale
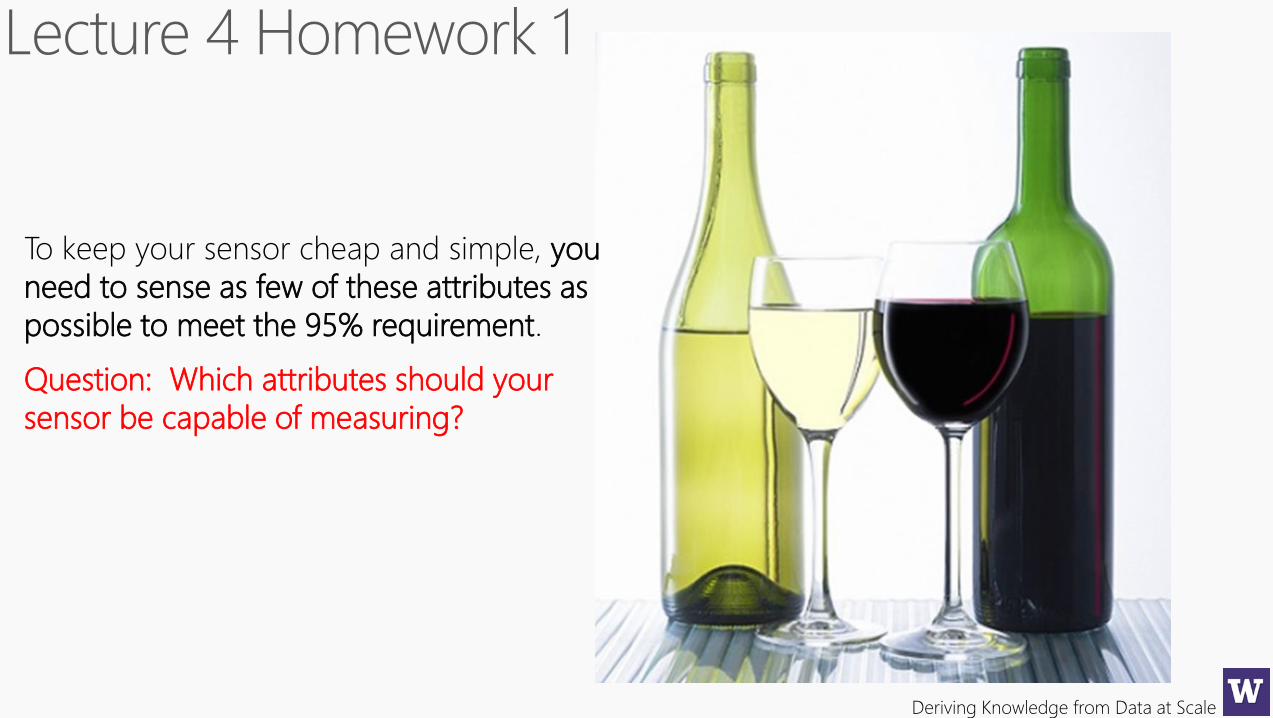
To keep your sensor cheap and simple, you
need to sense as few of these attributes as
possible to meet the 95% requirement.
Question: Which attributes should your
sensor be capable of measuring?

Deriving Knowledge from Data at Scale

Deriving Knowledge from Data at Scale
Diversity of Opinion
Independence
Decentralization
Aggregation

Deriving Knowledge from Data at Scale

Deriving Knowledge from Data at Scale
Began October 2006
http://www.wired.com/business/2009/09/how-the-netflix-prize-was-won/, a light read (highly suggested)

Deriving Knowledge from Data at Scale
Deriving Knowledge from Data at Scale
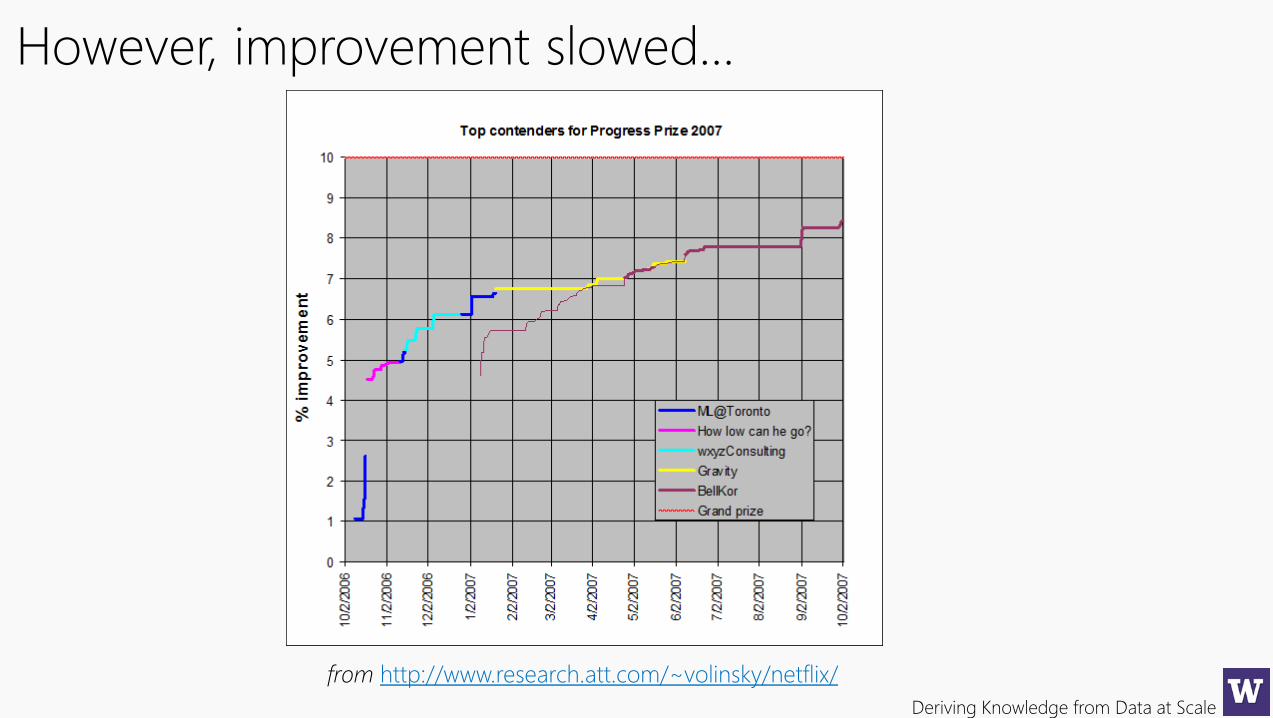
from http://www.research.att.com/~volinsky/netflix/
However, improvement slowed…

Deriving Knowledge from Data at Scale
The top team posted a 8.5% improvement.
Ensemble methods are the best performers…

Deriving Knowledge from Data at Scale
“Thanks to Paul Harrison's collaboration, a
simple mix of our solutions improved our result
from 6.31 to 6.75”
Rookies

Deriving Knowledge from Data at Scale
“My approach is to combine the results of many
methods (also two-way interactions between
them) using linear regression on the test set.
The best method in my ensemble is regularized
SVD with biases, post processed with kernel
ridge regression”
Arek Paterek
http://rainbow.mimuw.edu.pl/~ap/ap_kdd.pdf
Deriving Knowledge from Data at Scale
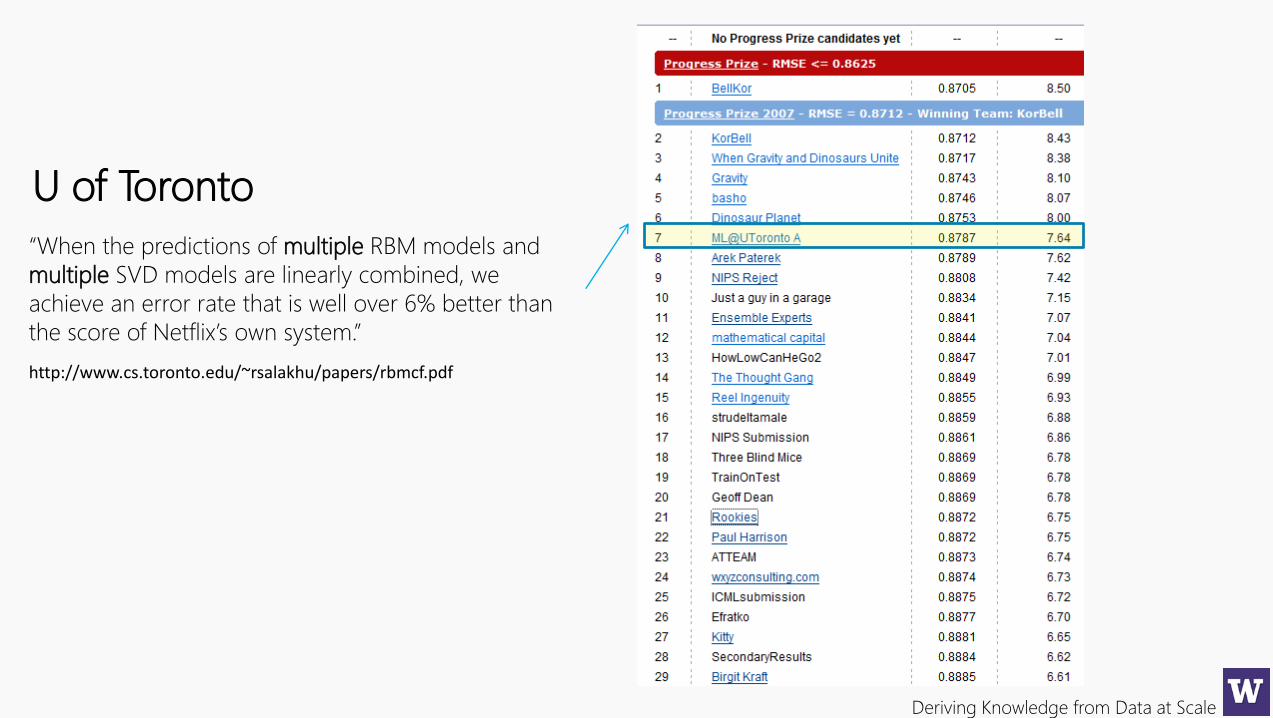
“When the predictions of multiple RBM models and
multiple SVD models are linearly combined, we
achieve an error rate that is well over 6% better than
the score of Netflix’s own system.”
U of Toronto
http://www.cs.toronto.edu/~rsalakhu/papers/rbmcf.pdf

Deriving Knowledge from Data at Scale
Gravity
home.mit.bme.hu/~gtakacs/download/gravity.pdf

Deriving Knowledge from Data at Scale
“Our common team blends the result of team
Gravity and team Dinosaur Planet.”
Might have guessed from the name…
When Gravity and
Dinosaurs Unite

Deriving Knowledge from Data at Scale
And, yes, the top team which is from AT&T…
“Our final solution (RMSE=0.8712) consists
of blending 107 individual results. “
BellKor / KorBell

Deriving Knowledge from Data at Scale
Clustering
Fundamental Concepts: Calculating similarity of objects described
by data; Using similarity for prediction; Clustering as similarity-
based segmentation.
Exemplary Techniques: Searching for similar entities; Nearest
neighbor methods; Clustering methods; Distance metrics for
calculating similarity.

Deriving Knowledge from Data at Scale
similar
unsupervised learning
data exploration

Deriving Knowledge from Data at Scale
CustomersMovies
I loved this movie…
The movies I watched…
You might want to
watch this movie…
You might like this one too…

Deriving Knowledge from Data at Scale

Deriving Knowledge from Data at Scale
We may want to retrieve similar things directly. For example, IBM wants to find companies
that are similar to their best business customers, in order to have sales staff look at them as
prospects. Hewlett-Packard maintains many high performance servers for clients; this
maintenance is aided by a tool that, given a server configuration, retrieves information on
other similarly configured servers.
We may want to group similar items together into clusters, for example to see whether our
customer base contains groups of similar customers and what these groups have in
common.
Reasoning from similar cases of course extends beyond business applications; it is natural
to fields such as medicine and law. A doctor may reason about a new difficult case by
recalling a similar case and its diagnosis. A lawyer often argues cases by citing legal
precedents, which are similar historical cases whose dispositions were previously judged and
entered into the legal casebook.

Deriving Knowledge from Data at Scale
Successful Predictions

Deriving Knowledge from Data at Scale

Deriving Knowledge from Data at Scale
grouping within a group aresimilar and different from (or unrelated to)the objects in other groups
Inter-cluster
distances are
maximizedIntra-cluster
distances are
minimized

Deriving Knowledge from Data at Scale
• Outliers objects that do not belong to any cluster
outlier analysis
cluster
outliers

Deriving Knowledge from Data at Scale
data reductionnatural clusters useful outlier detection

Deriving Knowledge from Data at Scale
d(x, y) x y metric
• d(i, j) 0 non-negativity
• d(i, i) = 0 isolation
• d(i, j) = d(j, i) symmetry
• d(i, j) ≤ d(i, h)+d(h, j) triangular inequality
real, boolean, categorical, ordinal

Deriving Knowledge from Data at Scale

Deriving Knowledge from Data at Scale

Deriving Knowledge from Data at Scale
Single Linkage:
Minimum distance* *
Complete Linkage:
Maximum distance* *
Average Linkage:
Average distance*
*
*
*
Wards method:
Minimization of within-cluster variance
**
*
**
¤*
* *
*¤
Centroid method:
Distance betweencentres
**
*
* *
***
* *¤ ¤
Non overlapping Overlapping
Hierarchical Non-hierarchical
1a 1b
1c
1a 1b
1b11b22
Agglomerative Divisive

Deriving Knowledge from Data at Scale

Deriving Knowledge from Data at Scale
Single Linkage:
Minimum distance* *
Complete Linkage:
Maximum distance* *
Average Linkage:
Average distance*
*
*
*
Wards method:
Minimization of within-cluster variance
**
*
**
¤*
* *
*¤
Centroid method:
Distance betweencentres
**
*
* *
***
* *¤ ¤
Non overlapping Overlapping
Hierarchical Non-hierarchical
1a 1b
1c
1a 1b
1b11b22
Agglomerative Divisive

Deriving Knowledge from Data at Scale
centroid
Deriving Knowledge from Data at Scale

Deriving Knowledge from Data at Scale
-2 -1.5 -1 -0.5 0 0.5 1 1.5 2
0
0.5
1
1.5
2
2.5
3
x
y
-2 -1.5 -1 -0.5 0 0.5 1 1.5 2
0
0.5
1
1.5
2
2.5
3
x
y
Sub-optimal Clustering
-2 -1.5 -1 -0.5 0 0.5 1 1.5 2
0
0.5
1
1.5
2
2.5
3
x
y
Optimal Clustering
Original Points

Deriving Knowledge from Data at Scale
-2 -1.5 -1 -0.5 0 0.5 1 1.5 2
0
0.5
1
1.5
2
2.5
3
x
y
Iteration 1
-2 -1.5 -1 -0.5 0 0.5 1 1.5 2
0
0.5
1
1.5
2
2.5
3
x
y
Iteration 2
-2 -1.5 -1 -0.5 0 0.5 1 1.5 2
0
0.5
1
1.5
2
2.5
3
x
y
Iteration 3
-2 -1.5 -1 -0.5 0 0.5 1 1.5 2
0
0.5
1
1.5
2
2.5
3
x
y
Iteration 4
-2 -1.5 -1 -0.5 0 0.5 1 1.5 2
0
0.5
1
1.5
2
2.5
3
x
y
Iteration 5
-2 -1.5 -1 -0.5 0 0.5 1 1.5 2
0
0.5
1
1.5
2
2.5
3
x
y
Iteration 6

Deriving Knowledge from Data at Scale
K
i Cx
i
i
xmdistSSE1
2 ),(

Deriving Knowledge from Data at Scale
• Boolean Values
• Categories

Deriving Knowledge from Data at Scale

Deriving Knowledge from Data at Scale

Deriving Knowledge from Data at Scale
• Opening Discussion 30 minutesReview Discussion…
• Data ScienceHands On 60 minutes
• Break 5 minutes
• Data Science Modelling 30 minutesModel performance evaluation…
• Machine Learning Boot Camp ~60 minutesClustering, k-Means…
• Close

Deriving Knowledge from Data at Scale

Deriving Knowledge from Data at Scale

Deriving Knowledge from Data at Scale

Deriving Knowledge from Data at Scale

Deriving Knowledge from Data at Scale

Deriving Knowledge from Data at Scale

Deriving Knowledge from Data at Scale

Deriving Knowledge from Data at Scale
evaluates
• Use training set
Supplied test Percentage split
• Classes to clusters

Deriving Knowledge from Data at Scale

Deriving Knowledge from Data at Scale

Deriving Knowledge from Data at Scale

Deriving Knowledge from Data at Scale

Deriving Knowledge from Data at Scale

Deriving Knowledge from Data at Scale

Deriving Knowledge from Data at Scale

Deriving Knowledge from Data at Scale

Deriving Knowledge from Data at Scale

Deriving Knowledge from Data at Scale

Deriving Knowledge from Data at Scale

Deriving Knowledge from Data at Scale
Note, some implementations of K-means
only allow numerical values so it may be
necessary to convert categorical to binary.
Also, normalize attributes on very differently
scales (age and income).

Deriving Knowledge from Data at Scale
hands on…

Deriving Knowledge from Data at Scale

Deriving Knowledge from Data at Scale
Deriving Knowledge from Data at Scale
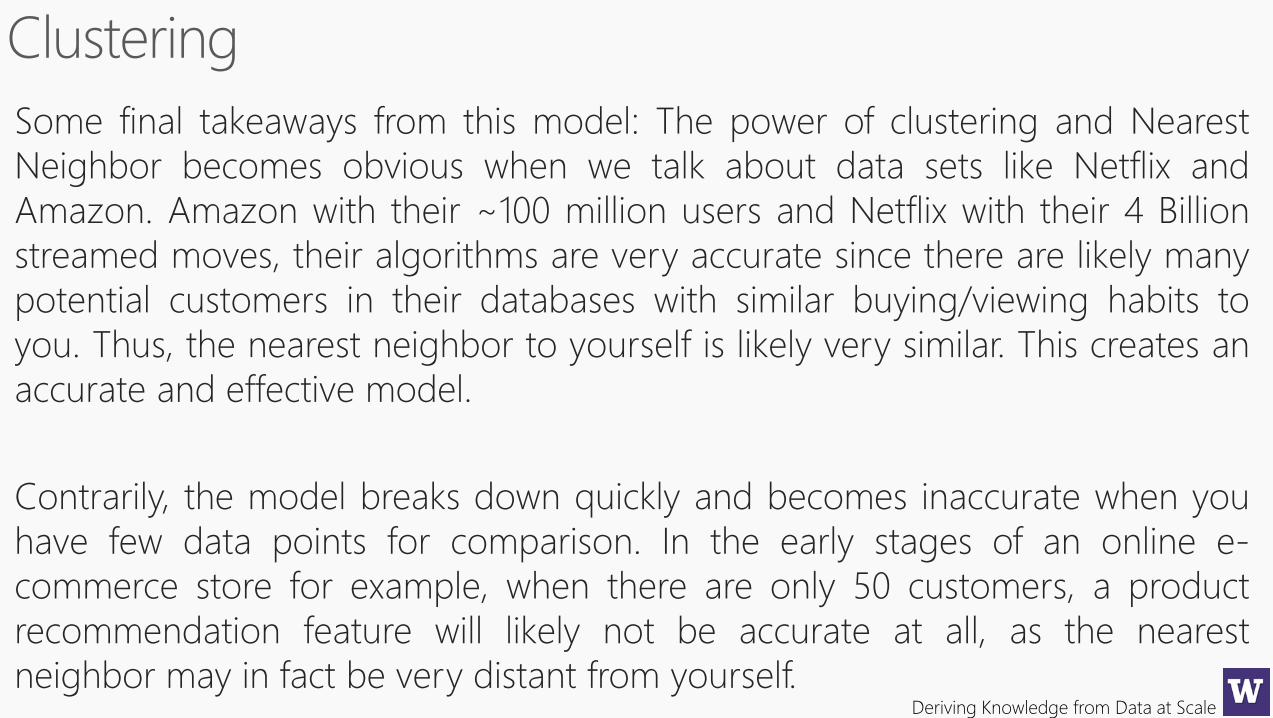
Some final takeaways from this model: The power of clustering and Nearest
Neighbor becomes obvious when we talk about data sets like Netflix and
Amazon. Amazon with their ~100 million users and Netflix with their 4 Billion
streamed moves, their algorithms are very accurate since there are likely many
potential customers in their databases with similar buying/viewing habits to
you. Thus, the nearest neighbor to yourself is likely very similar. This creates an
accurate and effective model.
Contrarily, the model breaks down quickly and becomes inaccurate when you
have few data points for comparison. In the early stages of an online e-
commerce store for example, when there are only 50 customers, a product
recommendation feature will likely not be accurate at all, as the nearest
neighbor may in fact be very distant from yourself.

Deriving Knowledge from Data at Scale

Deriving Knowledge from Data at Scale
10 Minute Break…

Deriving Knowledge from Data at Scale

Deriving Knowledge from Data at Scale

Deriving Knowledge from Data at Scale

Deriving Knowledge from Data at Scale

Deriving Knowledge from Data at Scale
•
biased majority class
• reduceerror rate
•

Deriving Knowledge from Data at Scale
synthetic samples
• Controlling amount placement

Deriving Knowledge from Data at Scale

Deriving Knowledge from Data at Scale
Deriving Knowledge from Data at Scale

Deriving Knowledge from Data at Scale
oversampling minority class random undersampling majority class

Deriving Knowledge from Data at Scale

Deriving Knowledge from Data at Scale

Deriving Knowledge from Data at Scale
: Minority sample
: Synthetic sample
… But what if there
is a majority sample
Nearby?
: Majority sample

Deriving Knowledge from Data at ScaleLet’s try it

Deriving Knowledge from Data at Scale
10 Minute Break…
Deriving Knowledge from Data at Scale

Deriving Knowledge from Data at Scale
• It dependsone more
example right than you did

Deriving Knowledge from Data at Scale

Deriving Knowledge from Data at Scale

Deriving Knowledge from Data at Scale92
Deriving Knowledge from Data at Scale
No Prob Target CustID Age
1 0.97 Y 1746 …
2 0.95 N 1024 …
3 0.94 Y 2478 …
4 0.93 Y 3820 …
5 0.92 N 4897 …
… … … …
99 0.11 N 2734 …
100 0.06 N 2422
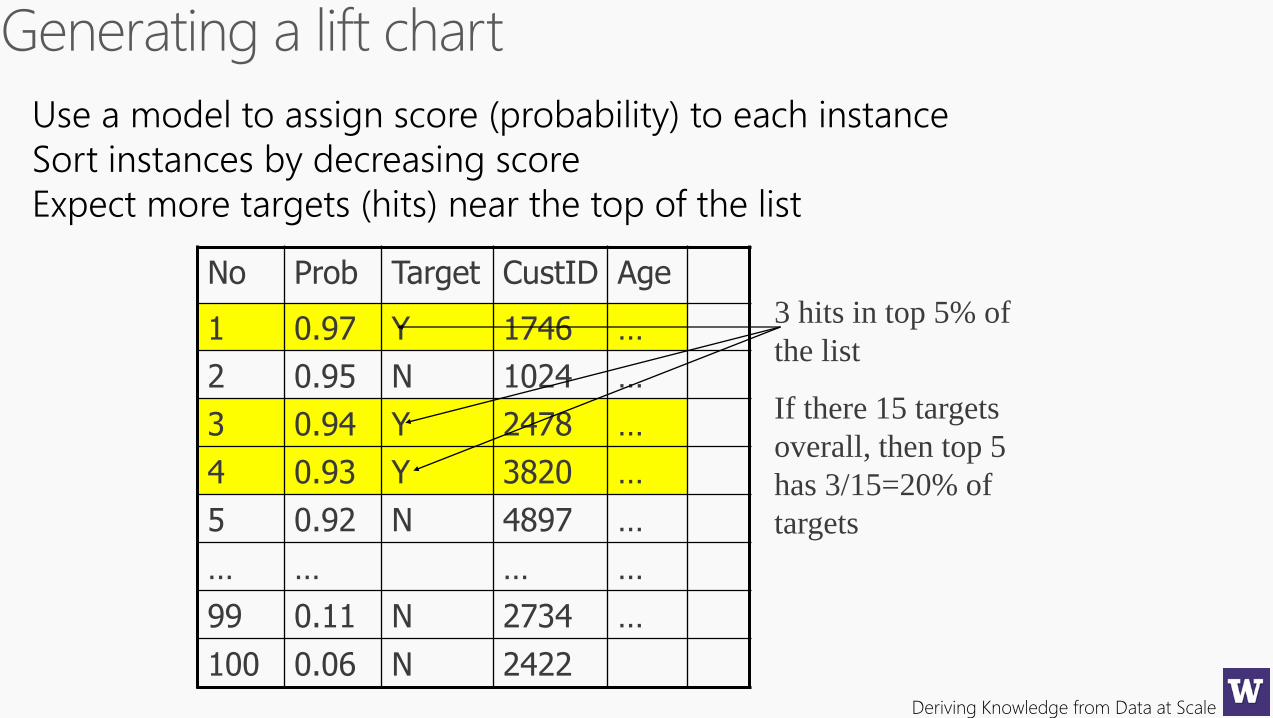
Use a model to assign score (probability) to each instance
Sort instances by decreasing score
Expect more targets (hits) near the top of the list
3 hits in top 5% of
the list
If there 15 targets
overall, then top 5
has 3/15=20% of
targets

Deriving Knowledge from Data at Scale
40% of responses for
10% of cost
Lift factor = 4
80% of responses for
40% of cost
Lift factor = 2Model
Random

Deriving Knowledge from Data at Scale

Deriving Knowledge from Data at Scale

Deriving Knowledge from Data at Scale

Deriving Knowledge from Data at Scale

Deriving Knowledge from Data at Scale
Precision and Recall

Deriving Knowledge from Data at Scale
Once you can compute precision and recall, you are often able to produce
precision/recall curves. Suppose that you are attempting to identify spam. You
run a learning algorithm to make predictions on a test set. But instead of just
taking a “yes/no” answer, you allow your algorithm to produce its confidence.
For instance, using a perceptron, you might use the distance from the
hyperplane as a confidence measure. You can then sort all of your test emails
according to this ranking. You may put the most spam-like emails at the top
and the least spam-like emails at the bottom

Deriving Knowledge from Data at Scale
Once you can compute precision and recall, you are often able to produce precision/recall curves. Suppose
that you are attempting to identify spam. You run a learning algorithm to make predictions on a test set. But
instead of just taking a “yes/no” answer, you allow your algorithm to produce its confidence. For instance, using
a perceptron, you might use the distance from the hyperplane as a confidence measure. You can then sort all
of your test emails according to this ranking. You may put the most spam-like emails at the top and the least
spam-like emails at the bottom
Once you have this sorted list, you can choose how aggressively you want your
spam filter to be by setting a threshold anywhere on this list. One would hope
that if you set the threshold very high, you are likely to have high precision (but
low recall). If you set the threshold very low, you’ll have high recall (but low
precision). By considering every possible place you could put this threshold,
you can trace out a curve of precision/recall values, like the one in Figure 4.15.
This allows us to ask the question: for some fixed precision, what sort of
recall can I get…

Deriving Knowledge from Data at Scale
Sometimes we want a single number that informs us of the quality of the
solution. A popular way to combe precision and recall into a single number is
by taking their harmonic mean. This is known as the balanced f-measure:
The reason to use a harmonic mean rather than an arithmetic mean is that it
favors systems that achieve roughly equal precision and recall. In the extreme
case where P = R, then F = P = R. But in the imbalanced case, for instance P =
0.1 and R = 0.9, the overall f-measure is a modest 0.18.

Deriving Knowledge from Data at Scale
depend crucially on which class is considered
not the case that precision on the flipped task is equal to recall on the original task

Deriving Knowledge from Data at Scale

Deriving Knowledge from Data at Scale

Deriving Knowledge from Data at Scale

Deriving Knowledge from Data at Scale

Deriving Knowledge from Data at Scale

Deriving Knowledge from Data at Scale

Deriving Knowledge from Data at Scale

Deriving Knowledge from Data at Scale

Deriving Knowledge from Data at Scale

Deriving Knowledge from Data at Scale
blue dominates red and green
neither red nor green dominate the other
You could get the best of the red and
green curves by making a hybrid
classifier that switches between
strategies at the cross-over points.

Deriving Knowledge from Data at Scale
Suppose you have a test for Alzheimer’s whose false
positive rate can be varied from 5% to 25% as the
false negative rate varies from 25% to 5% (suppose
linear dependences on both):
You try the test on a population of 10,000 people, 1%
of whom actually are Alzheimer’s positive:

Deriving Knowledge from Data at Scale
Area under the
ROC curve =
AUC
• Area under the ROC curve (AUC) is a
measure of the model performance
0.5 𝑟𝑎𝑛𝑑𝑜𝑚 𝑚𝑜𝑑𝑒𝑙 <𝐴𝑈𝐶 <
1 𝑝𝑒𝑟𝑓𝑒𝑐𝑡 𝑚𝑜𝑑𝑒𝑙
• Larger the AUC, better is the model

Deriving Knowledge from Data at Scale

Deriving Knowledge from Data at Scale

Deriving Knowledge from Data at Scale
to impact…
1. Build our predictive model in WEKA Explorer;
2. Use our model to score (predict) which new customers to target in our upcoming advertising campaign;• ARFF file manipulation (hacking), all too common pita…• Excel manipulation to join model output with our customers list
3. Compute the lift chart to assess business impact of our predictive model on the advertising campaign• How are Lift charts built, of all the charts and/or performance
measures from a model this one is ‘on you’ to construct;• Where is the business ‘bang for the buck’?

Deriving Knowledge from Data at Scale

Deriving Knowledge from Data at Scale

Deriving Knowledge from Data at Scale

Deriving Knowledge from Data at Scale
Bagging
with replacement…
Boosting
Decision Trees:
bagging
boosting

Deriving Knowledge from Data at Scale
Decision Trees and Decision Forests
A forest is an ensemble of trees. The trees are all slightly different from one another.
terminal (leaf) node
internal
(split) node
root node0
1 2
3 4 5 6
7 8 9 10 11 12 13 14
A general tree structureIs top
part blue?
Is bottom
part green?Is bottom
part blue?
A decision tree

Deriving Knowledge from Data at Scale
Decision Forest Model: the randomness model1) Bagging (randomizing the training set)
The full training set
The randomly sampled subset of training data made available for the tree t
Forest training

Deriving Knowledge from Data at Scale
Decision Forest Model: the randomness model
The full set of all possible node test parameters
For each node the set of randomly sampled features
Randomness control parameter.
For no randomness and maximum tree correlation.
For max randomness and minimum tree correlation.
2) Randomized node optimization (RNO)
Small value of ; little tree correlation. Large value of ; large tree correlation.
The effect of
Node weak learner
Node test params
Node training

Deriving Knowledge from Data at Scale
Decision Forest Model: training and information gain
Befo
re s
pli
t
Information gain
Shannon’s entropy
Node training
(for categorical, non-parametric distributions)
Sp
lit
1S
pli
t 2

Deriving Knowledge from Data at Scale
Why we prune…

Deriving Knowledge from Data at Scale
Classification ForestTraining data in feature space
?
?
?
Entropy of a discrete distribution
with
Classification treetraining
Obj. funct. for node j (information gain)
Training node j
Output is categorical
Input data point
Node weak learner
Predictor model (class posterior)
Model specialization for classification
( is feature response)
(discrete set)

Deriving Knowledge from Data at Scale
Classification Forest: the weak learner model
Node weak learner
Node test params
Splitting data at node j
Weak learner: axis aligned Weak learner: oriented line Weak learner: conic section
Examples of weak learners
Feature response
for 2D example.
With a generic line in homog. coordinates.
Feature response
for 2D example.
With a matrix representing a conic.
Feature response
for 2D example.
In general may select only a very small subset of features
With or

Deriving Knowledge from Data at Scale
Classification Forest: the prediction model
What do we do at the leaf?
leafleaf
leaf
Prediction model: probabilistic

Deriving Knowledge from Data at Scale
Classification Forest: the ensemble model
Tree t=1 t=2 t=3
Forest output probability
The ensemble model

Deriving Knowledge from Data at Scale
Training different trees in the forest
Testing different trees in the forest
(2 videos in this page)
Classification Forest: effect of the weak learner model
Parameters: T=200, D=2, weak learner = aligned, leaf model = probabilistic
• “Accuracy of prediction”
• “Quality of confidence”
• “Generalization”
Three concepts to keep in mind:
Training points

Deriving Knowledge from Data at Scale
Training different trees in the forest
Testing different trees in the forest
Classification Forest: effect of the weak learner model
Parameters: T=200, D=2, weak learner = linear, leaf model = probabilistic
Training points

Deriving Knowledge from Data at Scale
Classification Forest: effect of the weak learner modelTraining different trees in the forest
Testing different trees in the forest
Parameters: T=200, D=2, weak learner = conic, leaf model = probabilistic(2 videos in this page)
Training points

Deriving Knowledge from Data at Scale
Classification Forest: with >2 classesTraining different trees in the forest
Testing different trees in the forest
Parameters: T=200, D=3, weak learner = conic, leaf model = probabilistic(2 videos in this page)
Training points

Deriving Knowledge from Data at Scale
Classification Forest: effect of tree depth
max tree depth, D
overfittingunderfitting
T=200, D=3, w. l. = conic T=200, D=6, w. l. = conic T=200, D=15, w. l. = conic
Predictor model = prob.(3 videos in this page)
Training points: 4-class mixed

Deriving Knowledge from Data at Scale
Classification Forest: analysing generalization
Parameters: T=200, D=13, w. l. = conic, predictor = prob.(3 videos in this page)
Training points: 4-class spiral Training pts: 4-class spiral, large gaps Tr. pts: 4-class spiral, larger gapsTe
stin
g p
ost
eri
ors

Deriving Knowledge from Data at Scale
Q

Deriving Knowledge from Data at Scale
Feature extraction and selection are the most important but
underrated step of machine learning. Better features are
better than better algorithms…

Deriving Knowledge from Data at Scale
That’s all for tonight….