Embed Size (px)
Citation preview

BySudarshan Kadariya
JMC

Keynesian multiplier theory indicates the cumulative effects of change in investment on income through their effects on consumption expenditure.
Multiplier is the number which multiplied by the additional investment (∆ I ) gives the additional increase in national income. It is defined as " the ratio of the total change in income to the intial change in investment.

Since, multiplier is related with the effect of changes in investment on consumption expenditure, multiplier is related with the marginal propensity to consume (i.e. mpc = ∆ C / ∆ Y ).
It means multiplier is determined by mpc.
In other words, it is determined as 1/ (1-mpc) or 1/mps whereas mps implies for marginal propensity to save.
The size of multiplier effect depends upon the size of mpc. Greater the mpc, bigger will be the value of the multiplier.

Theoretically, the value of multiplier can range from one to infinite but in reality it can not be one because consumption always increases when income increases.
Or, in other words, marginal propensity to consume is never zero.
The value of multiplier can not be equal to infinity because Keynes assumes that mpc is less than unity.
If mpc is zero, the multiplier will be unity because the induced consumption expenditure is zero.

Mult ipl ier Process: Effect of Investment on National Income (Y = C + I)Round Spending on Process Resulting change in
aggregate demand and national product
First Investment 20.0 Direct impact
Second Consumption 20.0 x 0.8 = 16.0 Induced increase in consumption = 0.8 mpc
Third Consumption 16.0 x 0.8 = 12.8
Fourth Consumption 12.8 x 0.8 = 10.2
Fifth 10.2 x 0.8 = 8.2
•
•
Total increase in income
100 billion This story goes on and on till it reaches to 100 billion [20(1/(1 - 0.8)].
K = 1/(1-MPC) = 1/MPS

Round Consumption MPC Income Remarks1st 20.00 Investment2nd 20.00 0.8 16.00 Consumption. 16.00 0.8 12.80 Consumption. 12.80 0.8 10.24 Consumption. 10.24 0.8 8.19 Consumption. 8.19 0.8 6.55 Consumption
6.55 0.8 5.24 Consumption. 5.24 0.8 4.19 Consumption. 4.19 0.8 3.36 Consumption
3.36 0.8 2.68 Consumption. 2.68 0.8 2.15 Consumption. 2.15 0.8 1.72 Consumption
1.72 0.8 1.37 Consumption. 1.37 0.8 1.10 Consumption. 1.10 0.8 0.88 Consumption
0.88 0.8 0.70 Consumption. 0.70 0.8 0.56 Consumption. 0.56 0.8 0.45 Consumption. 0.45 0.8 0.36 Consumption. 0.36 0.8 0.29 Consumption
0.29 0.8 0.23 Consumption. 0.23 0.8 0.18 Consumption. 0.18 0.8 0.15 Consumption
0.15 0.8 0.12 ConsumptionTotal increase in income 100
MULTIPLIER PROCESS

Consumption Function :C = c + mpc.YC = 200 + 0.75Y
MPC+MPS = 1


1. There is no change in the marginal propensity to consume during the adjustment process which remains more or less constant.
2. There is no induced investment (i.e. accelerating is not operating).
3. The new higher level of investment is maintained long enough for the completion of the adjustment process.
4. The output of consumer goods is responsive to effective demand.
5. There is no time lag between the receipt of income and its expenditure.

The concept of multiplier is an important tool for analyzing growth, planning and projecting the investment requirement of an economy given the growth objective.
Given the mpc, the planners can easily work out the investment requirement to achieve a targeted growth rate.

1. Higher mpc implies higher multiplier. It means that the less developed countries with higher mpc would grow at a much higher rate than the developed countries with a lower mpc. But this is not true. The actual multiplier depends upon a number of other factors.

2.The working of mpc assumes that those who earn income as a result of certain autonomous investment, would continue to spend a certain percentage of their newly earned income on consumption. This assumption may not hold true in reality as people may like to spend part or whole income on: saving, debt cancellation, imports, price inflation, hoarding, purchase of stock and shares from the shareholders, purchase of second hand car or old house. These activities do not generate new demand. These are called as leakages in the consumption flows which reduce the rate of multiplier.

3.The working of multiplier also assumes that goods and services are adequately available. If there is a shortage of goods and services, the actual consumption expenditure will be reduced what ever the rate of mpc. Consequently, multiplier will be reduced. If expenditure continues to increase in the face of scarcity, it generates inflation , not the real income.

4. Under the condition of of the full employment , the theory of multiplier does not work because goods and services can not be produced in excess of their full employment level.

THANK YOU.Next: Super-multiplier

John Richard Hicks (8 April 1904 – 20 May 1989)

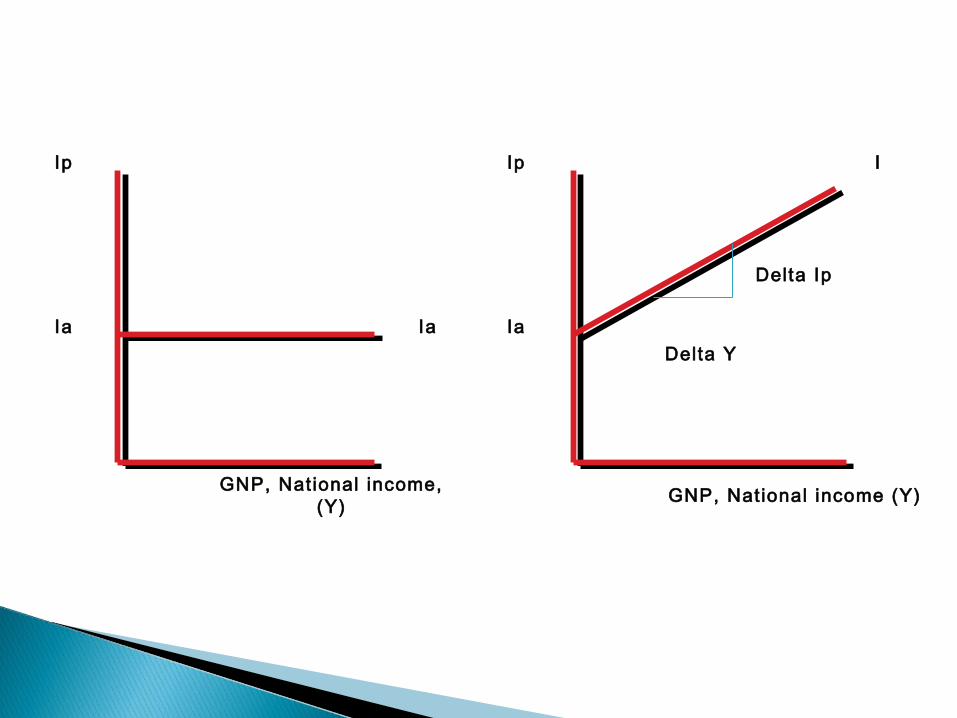
Autonomous investment (Ia) : independent of national income
Induced (private) investment (Ip): dependent with nation income or when GNP increase by delta Y, Ip increases by delta Ip. In other words, induced investment is new investment stimulated by an increase in aggregate demand
Marginal Propensity of invest (MPI): the ratio of the two absolute changes is known as the MPI, which may be expressed as: MPI = Delta Ip/Delta Y
Ia
GNP, National income, (Y)
Ia
Ip I
GNP, National income (Y)
Ia
Ip
Delta Y
Delta Ip

What is the importance of induced investment in the theory of income determination?
The answer has been given by J.R. Hicks in 1951. He has proved conclusively that the induced investment makes the value of the Keynesian multiplier larger and he developed the concept of supermultiplier, the new concept.

The term supermultiplier was first coined by J.R. Hicks in his business cycle theory.
The objective was to show the relationship between change in induced investment and the corresponding change in income.
To be more specific, it includes the ratio between the two changes i.e. in investment and in equilibrium output.

The concept of supermultiplier is the mathematical combination of multiplier of Keynes and accelerator of Aftalian.
Prof. J.R. Hicks has interacted both multiplier and accelerator with a view to measuring the total effect of initial investment on income.
The combined effect of the multiplier and the accelerator is also called the leverage effect.
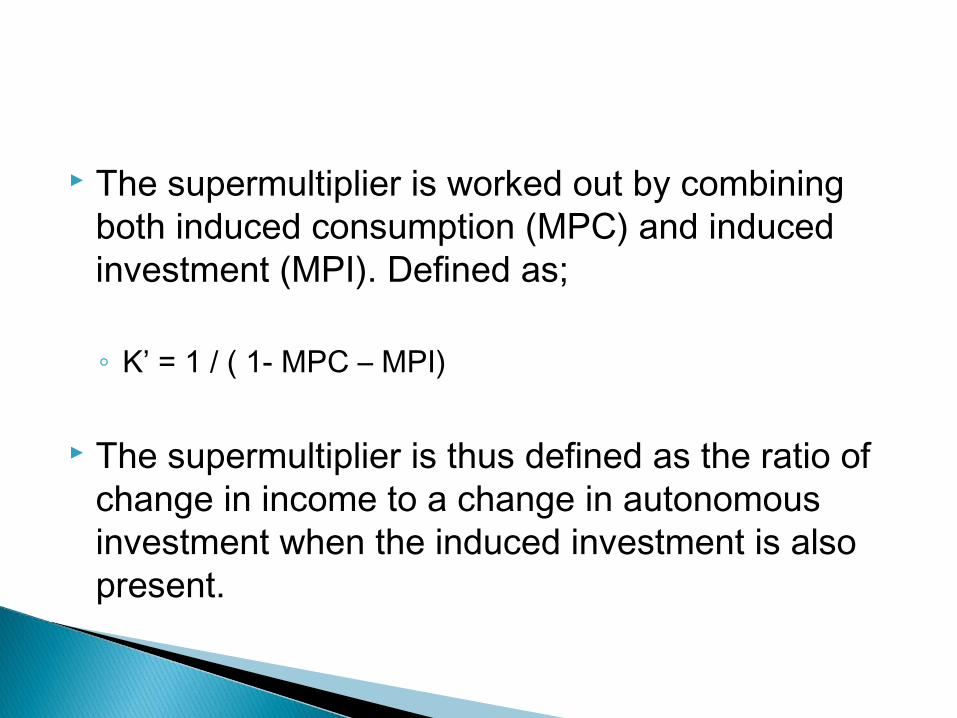
The supermultiplier is worked out by combining both induced consumption (MPC) and induced investment (MPI). Defined as;
◦ K’ = 1 / ( 1- MPC – MPI)
The supermultiplier is thus defined as the ratio of change in income to a change in autonomous investment when the induced investment is also present.

PeriodInitial
Investment
Induced consumption (MPC = 0.50)
Induced Investment (MPI = 0.4)
Increase in income (Delta Y
= MPC + MPI)
Total increase in income
1st - - - - 2nd 50.00 - - 50.00 50.00 3rd 25.00 20.00 45.00 95.00 4th 22.50 18.00 40.50 135.50 5th 20.25 16.20 36.45 171.95 6th 18.23 14.58 32.81 204.76 7th 16.40 13.12 29.52 234.28 8th 14.76 11.81 26.57 260.85 9th 13.29 10.63 23.91 284.77
10th 11.96 9.57 21.52 306.29 11th 10.76 8.61 19.37 325.66 12th 9.69 7.75 17.43 343.09 13th 8.72 6.97 15.69 358.79 14th 7.85 6.28 14.12 372.91
. . . . .
. . . . . 0 0 0 500.00
K' = 1 / (1-0.5-.4) K' = 10Note: When K' is 10, the initial investment grow equivalent to 10 fold in terms of national income
SUPERMULTIPLIER PROCESS

When we introduce the induced investment in autonomous investment, the total investment will have two components:
a) autonomous (Ia) and b) induced (Ip)

The simple multiplier implies that investment is the central determinant of output.
The super multiplier combines the multiplier with the accelerator that indicates that investment is not only autonomous, but is part of derived demand.
Hence, the super multiplier indicates that capacity adjusted output is determined by autonomous demand.


The GDP measures the market value of all f inal goods and services produced within an economy in a given period.
GDP only measures current production. Transfer payments and transactions involving goods produced in other periods are not included in the calculation of GDP.
Transfer payments – are transactions wherein one party is not obliged to deliver a good or service in return for the payment. Examples: retirement benefits, unemployment benefits, scholarships, and donations.

The market value of good i (Vi) is equal to Pi⋅Qi
GDP = sum of the market values of all final goods and services produced within the year.
= =
= = ×∑ ∑n n
i i ii 1 i 1
GDP V P Q

1. Expenditure Approach – measures GDP as the sum of expenditures on final goods and services.
2. Income Approach – measures GDP as the sum of incomes of factors of production (wages, rent, interest and profit.
3. Value-added Approach – measures GDP as the sum of value added at each stage of production (from initial to final stage)

GNP = GDP + Net Factor Income from the Rest of the World (NFIRW)
NFIRW - measures the difference between the earnings of Nepalese residents in other countries and foreign residents in the Nepal

Gross Domestic Product GDP 4,022,700
Net Factor Income from the Rest of the World
NFIRW 267,500
Gross National Product GNP 4,290,200

Nominal GDPReal GDP 100.
GDP deflator= ⋅

Measures how much output or income was produced or received, on the average, by an individual in an economy
Useful for comparing the performance of a country overtime and a country’s performance relative to its neighbors
GDPGDP per capita
population=

Personal disposable income represents the income that households are free to spend or save.

Ignores income distribution Ignores environmental degradation Does not include activities that do not go through
the formal markets sectors Does not include “illegal” activities like drug
trafficking, prostitution, moonlighting

Country or GDP nominal GDP PPP GDP PPP per capita
Location
territorymillions of
USDmillions of
USD USD
Asia 18,515,000 24,077,000
Afghanistan 16,631 29,616 1000 South Asia
Bangladesh 105,402 257,545 1,600 South Asia
Bhutan 1,397 3,785 5,600 South Asia
India 1,537,966 4,060,392 3,339 South Asia
Maldives 1,433 1,755 5,483 South Asia
Nepal 15,108 35,231 1,250 South Asia
Pakistan 164,792 464,711 2,789 South Asia
Sri Lanka 48,241 104,124 5,103 South Asia