Embed Size (px)
Citation preview
Transport Infrastructure Planning development
and Non Motorised Transport
COAL TRANSPORTATION AFRICA SUMMIT
Indaba Hotel, Fourways, Johannesburg
20 May 2015
1
Whity Maphakela: National Department of Transport
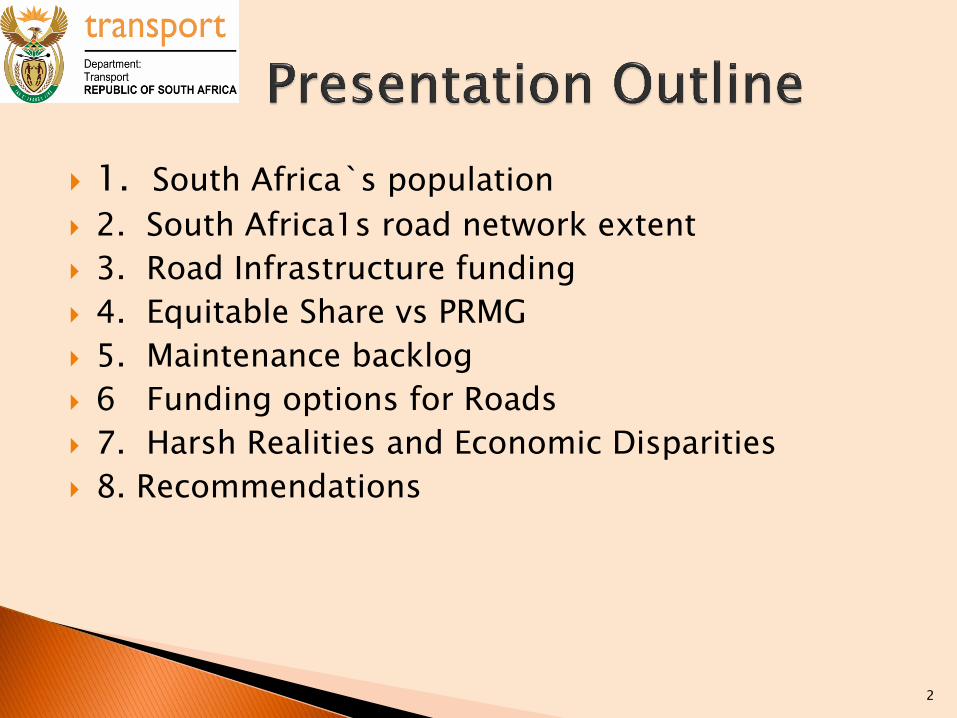
1. South Africa`s population
2. South Africa1s road network extent
3. Road Infrastructure funding
4. Equitable Share vs PRMG
5. Maintenance backlog
6 Funding options for Roads
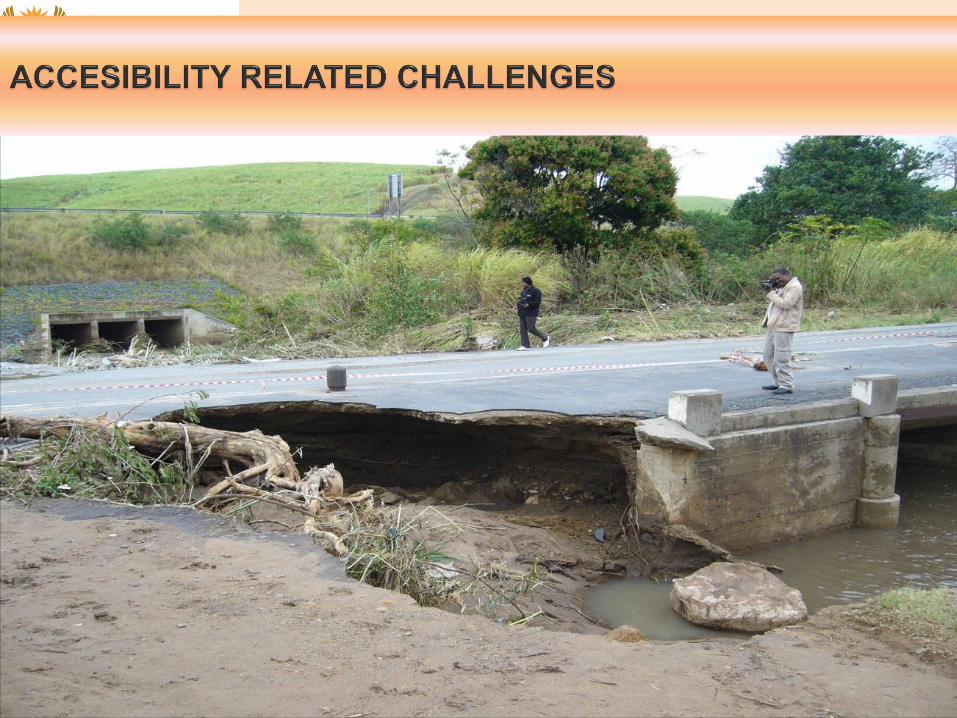
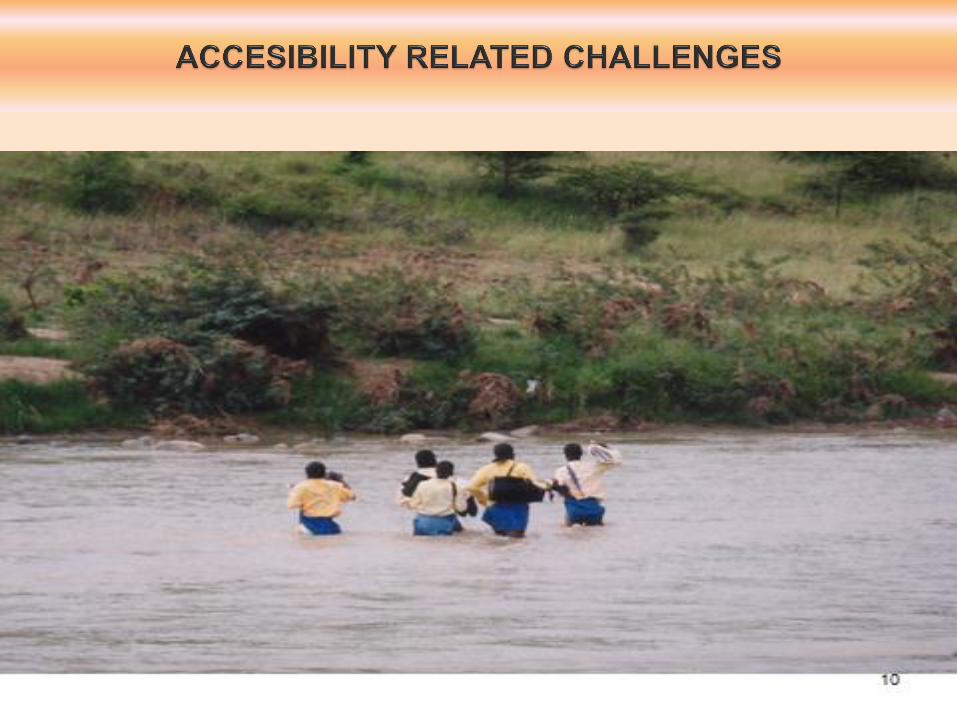
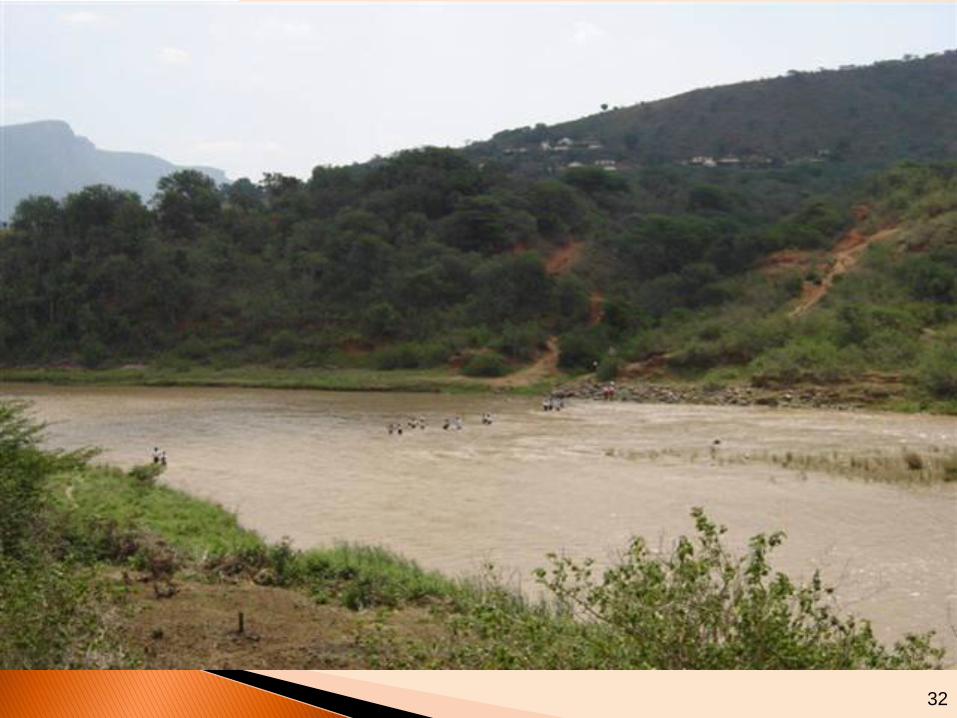
7. Harsh Realities and Economic Disparities
8. Recommendations
2

Rank Province Population (2011)
Percentage Population Estimate (2013)
1 Gauteng 12,272,263 23.7 12,728,400
2 KwaZulu-Natal
10,267,300 19.8 10,456,900
3 Eastern Cape 6,562,053 12.7 6,620,100
4 Western Cape 5,822,734 11.2 6,016,900
5 Limpopo 5,404,868 10.4 5,518,000
6 Mpumalanga 4,039,939 7.8 4,128,000
7 North West 3,509,953 6.8 3,597,600
8 Free State 2,745,590 5.3 2,753,200
9 Northern Cape 1,145,861 2.2 1,162,900
Total 51,770,561 100.0 52,982,000
3
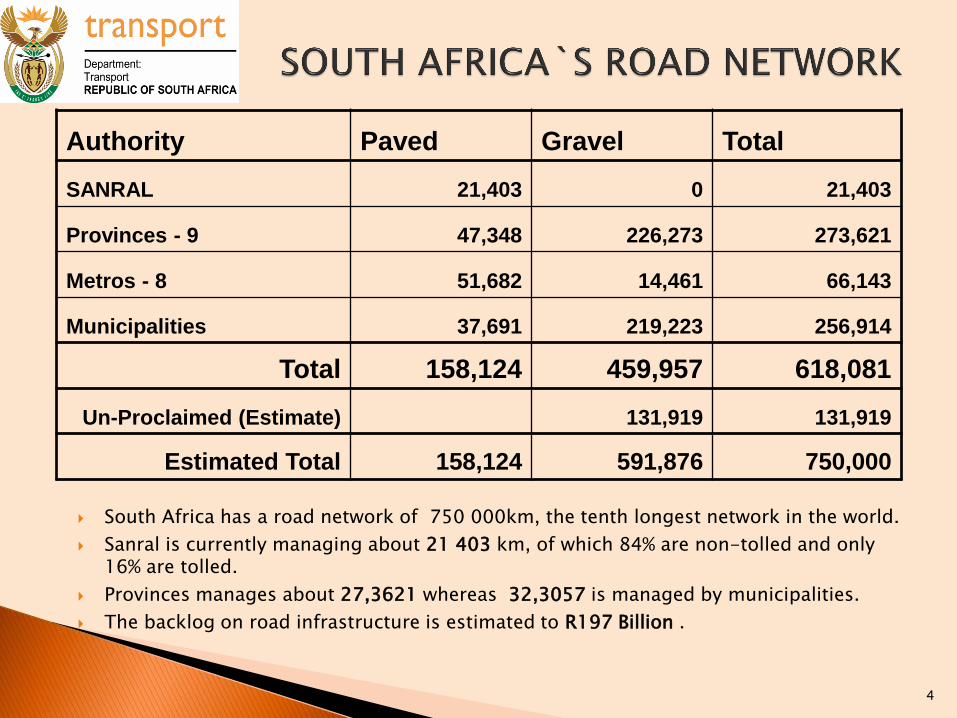
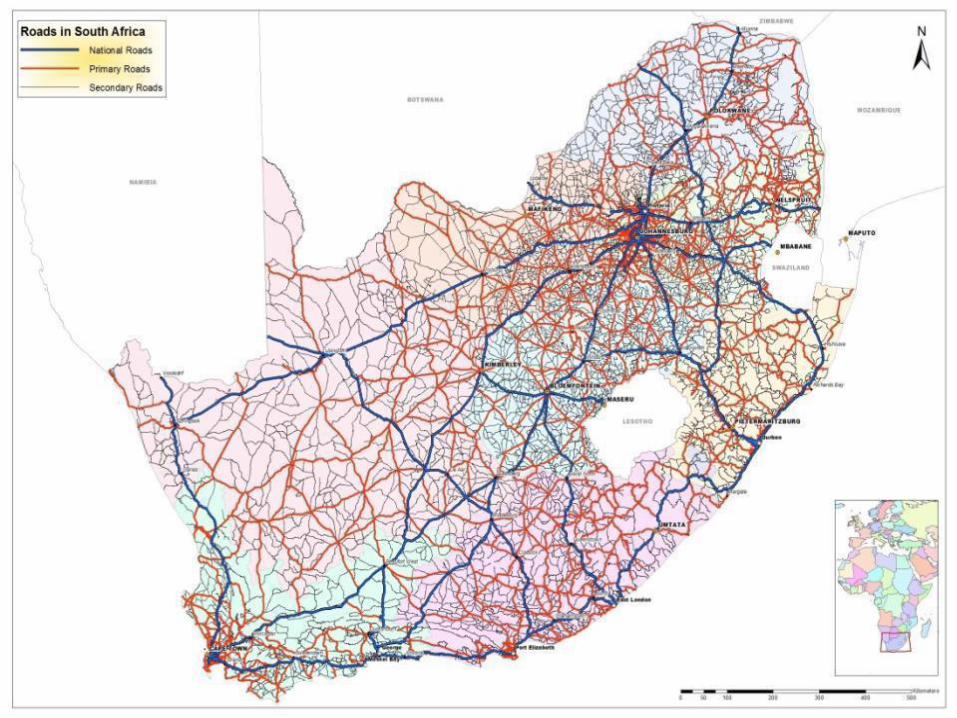
South Africa has a road network of 750 000km, the tenth longest network in the world.
Sanral is currently managing about 21 403 km, of which 84% are non-tolled and only 16% are tolled.
Provinces manages about 27,3621 whereas 32,3057 is managed by municipalities.
The backlog on road infrastructure is estimated to R197 Billion .
4
Authority Paved Gravel Total
SANRAL 21,403 0 21,403
Provinces - 9 47,348 226,273 273,621
Metros - 8 51,682 14,461 66,143
Municipalities 37,691 219,223 256,914
Total 158,124 459,957 618,081
Un-Proclaimed (Estimate) 131,919 131,919
Estimated Total 158,124 591,876 750,000
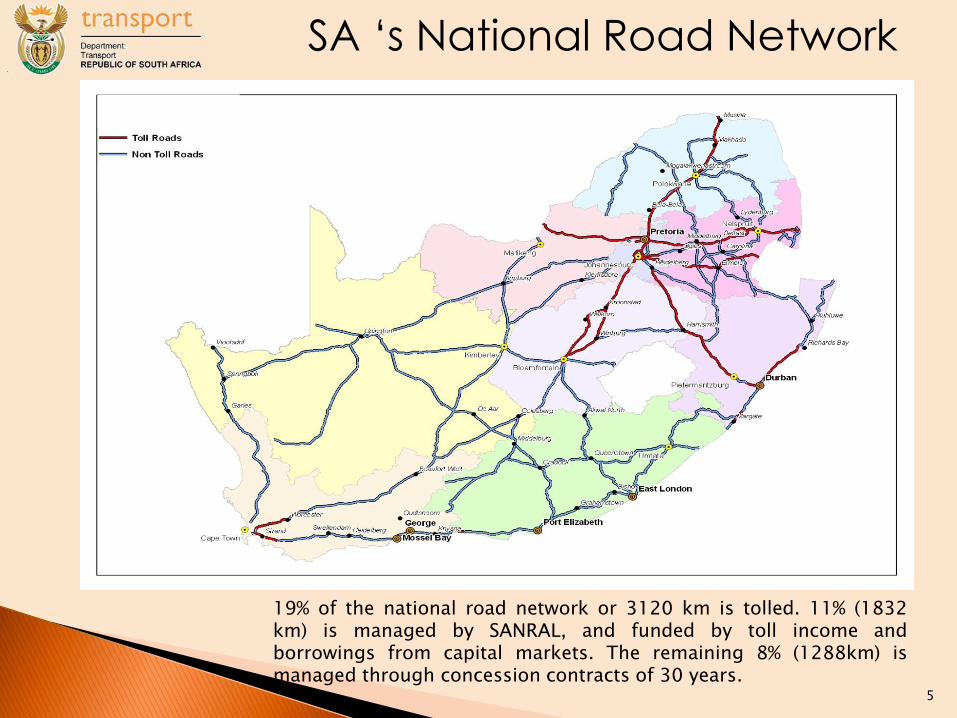
19% of the national road network or 3120 km is tolled. 11% (1832 km) is managed by SANRAL, and funded by toll income and borrowings from capital markets. The remaining 8% (1288km) is managed through concession contracts of 30 years.
SA ‘s National Road Network
5
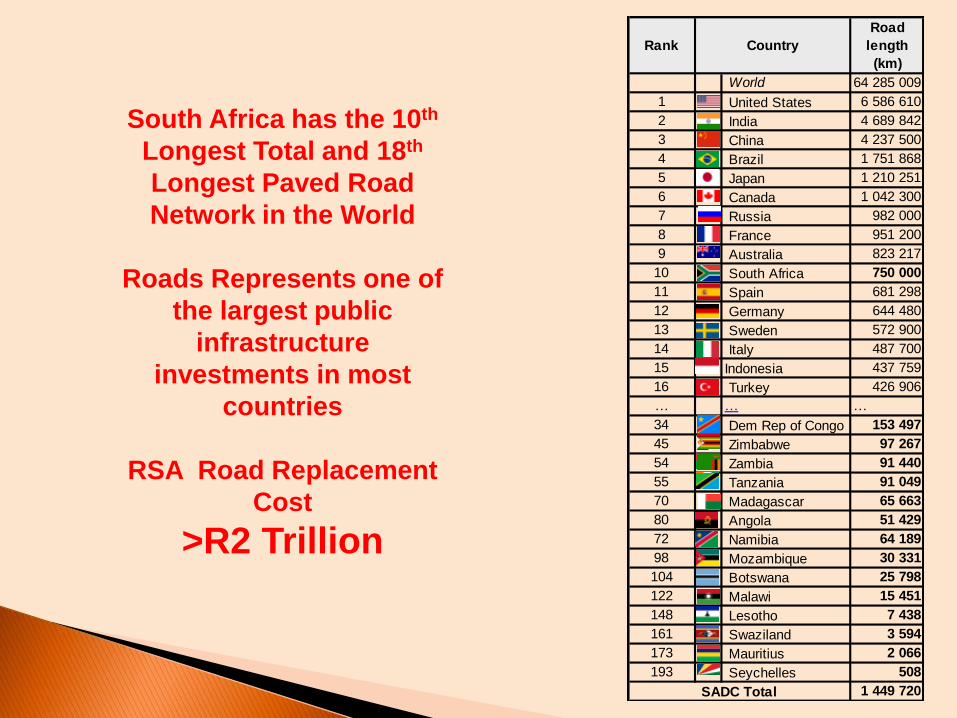
South Africa has the 10th
Longest Total and 18th
Longest Paved Road
Network in the World
Roads Represents one of
the largest public
infrastructure
investments in most
countries
RSA Road Replacement
Cost
>R2 Trillion
World 64 285 009
1 United States 6 586 610
2 India 4 689 842
3 China 4 237 500
4 Brazil 1 751 868
5 Japan 1 210 251
6 Canada 1 042 300
7 Russia 982 000
8 France 951 200
9 Australia 823 217
10 South Africa 750 000
11 Spain 681 298
12 Germany 644 480
13 Sweden 572 900
14 Italy 487 700
15 Indonesia 437 759
16 Turkey 426 906
… … …
34 Dem Rep of Congo 153 497
45 Zimbabwe 97 267
54 Zambia 91 440
55 Tanzania 91 049
70 Madagascar 65 663
80 Angola 51 429
72 Namibia 64 189
98 Mozambique 30 331
104 Botswana 25 798
122 Malawi 15 451
148 Lesotho 7 438
161 Swaziland 3 594
173 Mauritius 2 066
193 Seychelles 508
1 449 720
Rank Country
Road
length
(km)
SADC Total
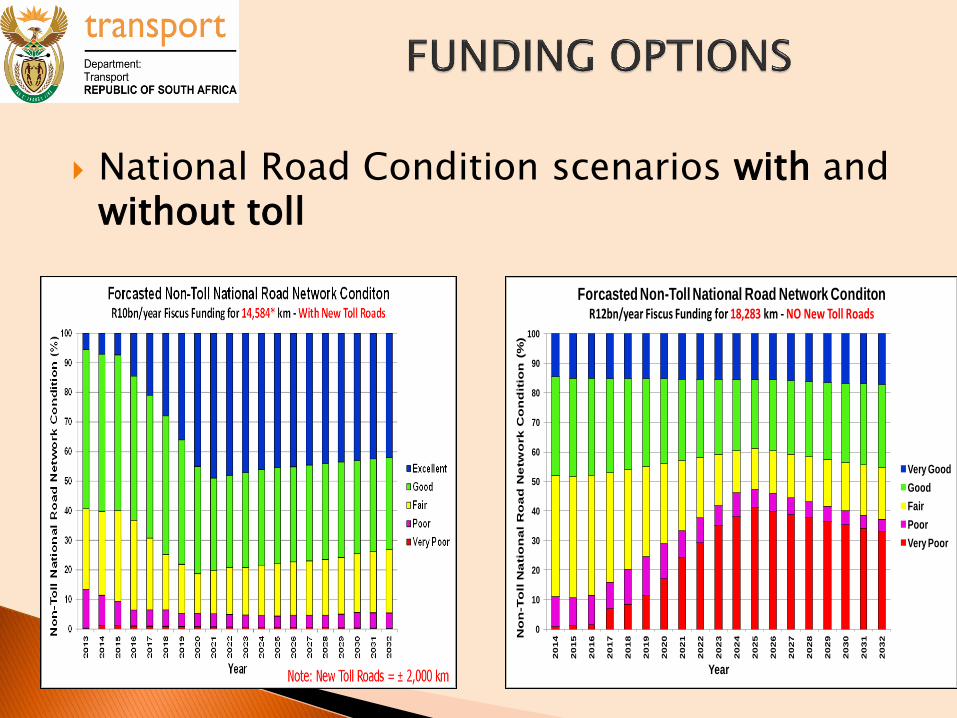
National Road Condition scenarios with and without toll
0
10
20
30
40
50
60
70
80
90
100
20
14
20
15
20
16
20
17
20
18
20
19
20
20
20
21
20
22
20
23
20
24
20
25
20
26
20
27
20
28
20
29
20
30
20
31
20
32N
on
-To
ll N
ati
on
al
Ro
ad
Ne
two
rk
Co
nd
itio
n (
%)
Year
Forcasted Non-Toll National Road Network ConditonR12bn/year Fiscus Funding for 18,283 km - NO New Toll Roads
Very Good
Good
Fair
Poor
Very Poor

Paved Network Condition Summary 2013
0% 20% 40% 60% 80% 100%
SANRAL
EASTERN CAPE
FREESTATE
GAUTENG
KWAZULU NATAL
LIMPOPO
MPUMALANGA
NORTHERN CAPE
NORTH WEST
WESTERN CAPE
Percentage of Network
Au
th
orit
y
Very Poor (km)
Poor (km)
Fair (km)
Good (km)
Very Good (km)
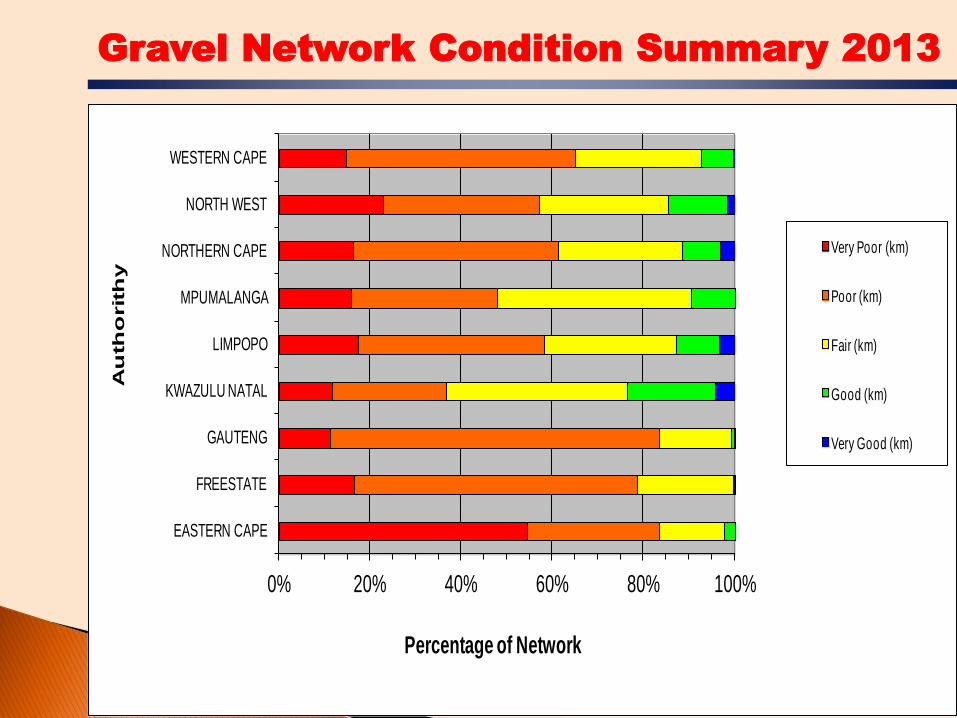
Gravel Network Condition Summary 2013
0% 20% 40% 60% 80% 100%
EASTERN CAPE
FREESTATE
GAUTENG
KWAZULU NATAL
LIMPOPO
MPUMALANGA
NORTHERN CAPE
NORTH WEST
WESTERN CAPE
Percentage of Network
Au
tho
rit
hy
Very Poor (km)
Poor (km)
Fair (km)
Good (km)
Very Good (km)
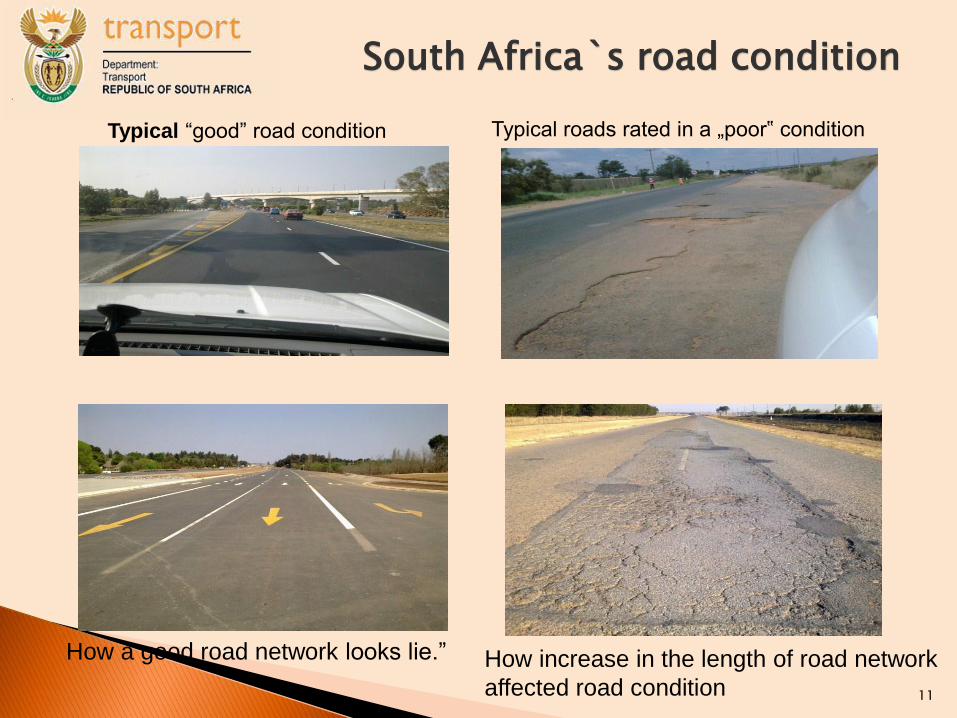
South Africa`s road condition
11
Typical “good” road condition Typical roads rated in a „poor‟ condition
How increase in the length of road network
affected road condition
How a good road network looks lie.”

Type Year V-Good Good Fair Poor V-Poor
Length
(km) 2013 1886 9,331 34,993 56,737 37,394
% 2013 1.34% 6.65% 24.93% 40.43% 26.64%

Maintenance backlog Cont’
• According to COTO Document regarding road network condition and funding requirements: – Budget required per year to sustain overall road network: R58,6 billion (no
expansion, strengthening, improvements etc.)
– Budget required per year to address maintenance backlog for the overall road network: R14,5 billion
*Note : the table below does not provide for any expansions to road networks and excludes the SANRAL toll portfolio
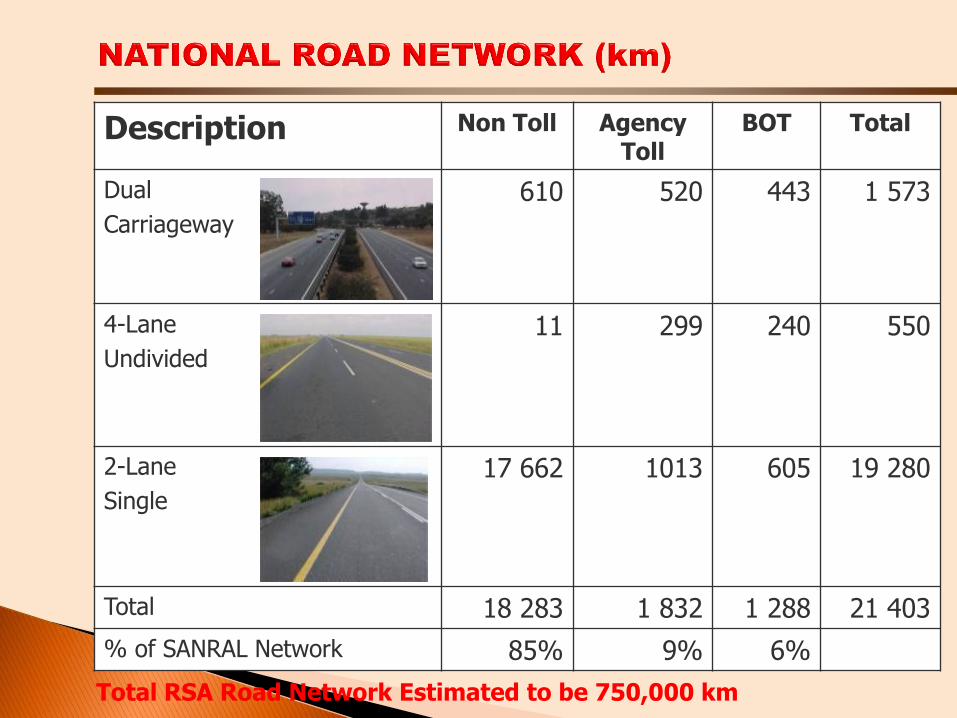
Description Non Toll Agency Toll
BOT Total
Dual
Carriageway
610
520 443 1 573
4-Lane
Undivided
11 299 240 550
2-Lane
Single
17 662 1013
605 19 280
Total 18 283 1 832 1 288 21 403
% of SANRAL Network 85% 9% 6%
Total RSA Road Network Estimated to be 750,000 km
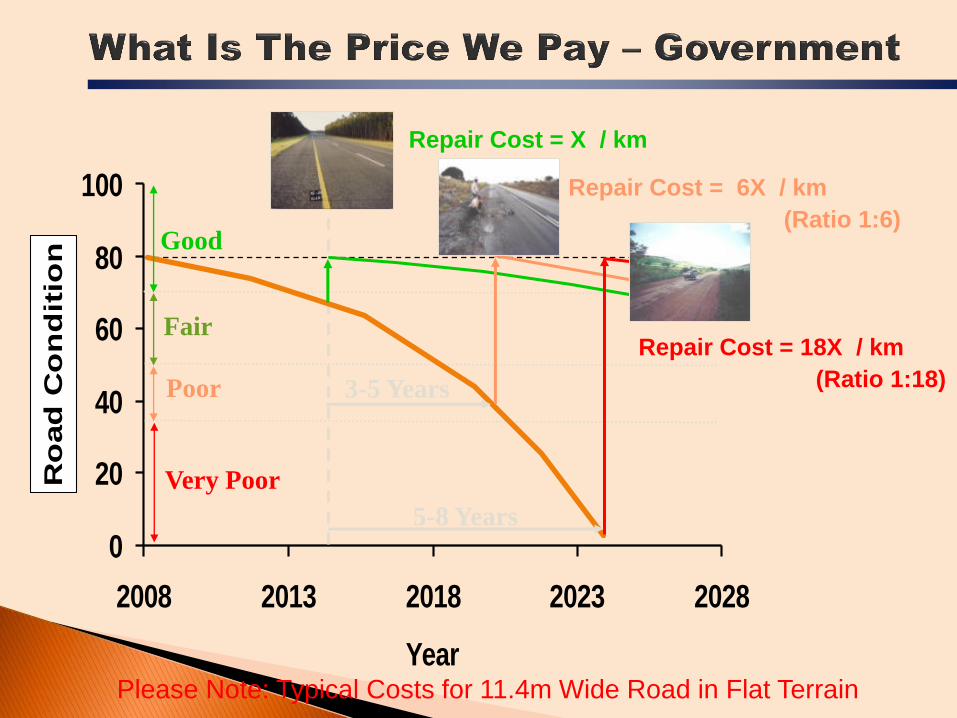
0
20
40
60
80
100
2008 2013 2018 2023 2028
Year
Ro
ad
Co
nd
itio
n
Repair Cost = X / km
Good
Fair
Poor
Very Poor
3-5 Years
Repair Cost = 6X / km
5-8 Years
Repair Cost = 18X / km
(Ratio 1:6)
(Ratio 1:18)
Please Note: Typical Costs for 11.4m Wide Road in Flat Terrain
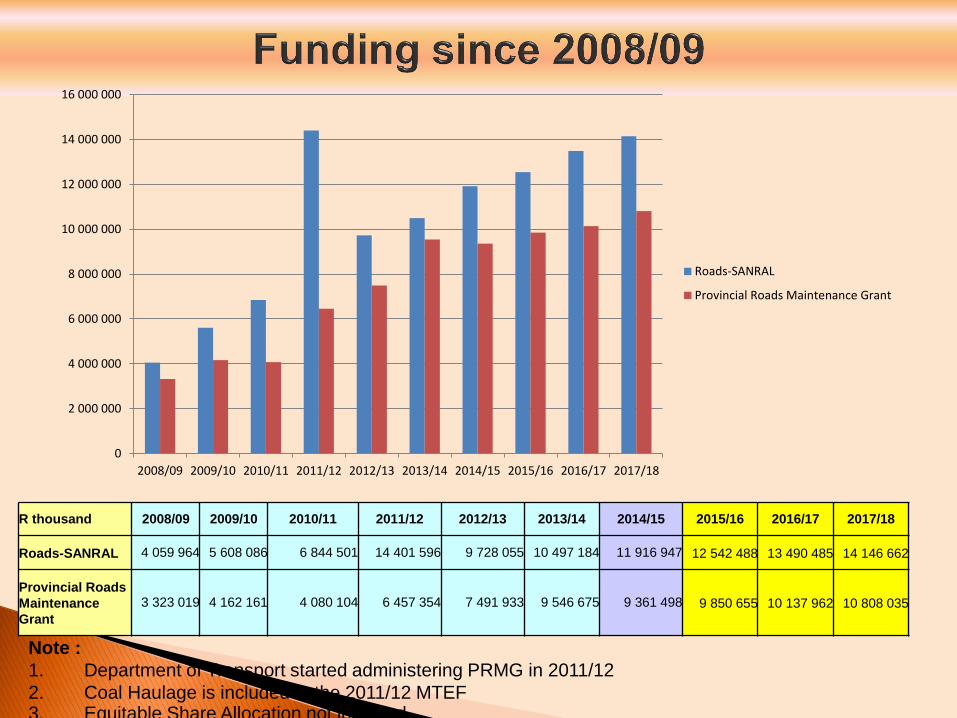
R thousand 2008/09 2009/10 2010/11 2011/12 2012/13 2013/14 2014/15 2015/16 2016/17 2017/18
Roads-SANRAL 4 059 964 5 608 086 6 844 501 14 401 596 9 728 055 10 497 184 11 916 947 12 542 488 13 490 485 14 146 662
Provincial Roads
Maintenance
Grant
3 323 019 4 162 161 4 080 104 6 457 354 7 491 933 9 546 675 9 361 498 9 850 655 10 137 962 10 808 035
0
2 000 000
4 000 000
6 000 000
8 000 000
10 000 000
12 000 000
14 000 000
16 000 000
2008/09 2009/10 2010/11 2011/12 2012/13 2013/14 2014/15 2015/16 2016/17 2017/18
Roads-SANRAL
Provincial Roads Maintenance Grant
Note :
1. Department of Transport started administering PRMG in 2011/12
2. Coal Haulage is included in the 2011/12 MTEF 3. Equitable Share Allocation not included.
ALLOCATION
EQUITABLE SHARE
vs
PRMG
20
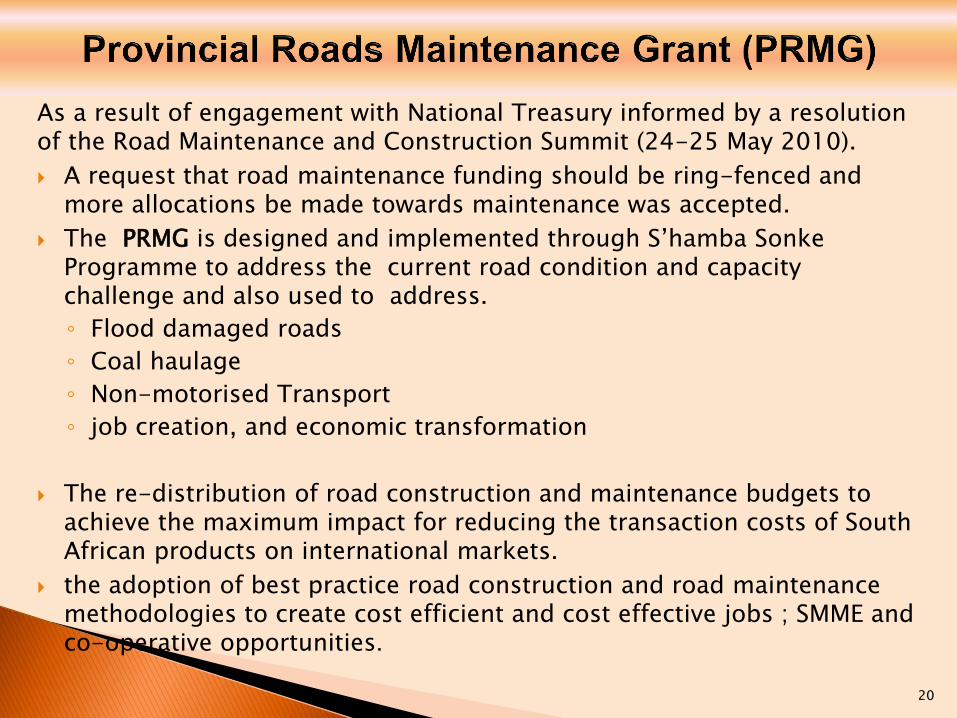
As a result of engagement with National Treasury informed by a resolution of the Road Maintenance and Construction Summit (24-25 May 2010).
A request that road maintenance funding should be ring-fenced and more allocations be made towards maintenance was accepted.
The PRMG is designed and implemented through S’hamba Sonke Programme to address the current road condition and capacity challenge and also used to address.
◦ Flood damaged roads
◦ Coal haulage
◦ Non-motorised Transport
◦ job creation, and economic transformation
The re-distribution of road construction and maintenance budgets to achieve the maximum impact for reducing the transaction costs of South African products on international markets.
the adoption of best practice road construction and road maintenance methodologies to create cost efficient and cost effective jobs ; SMME and co-operative opportunities.
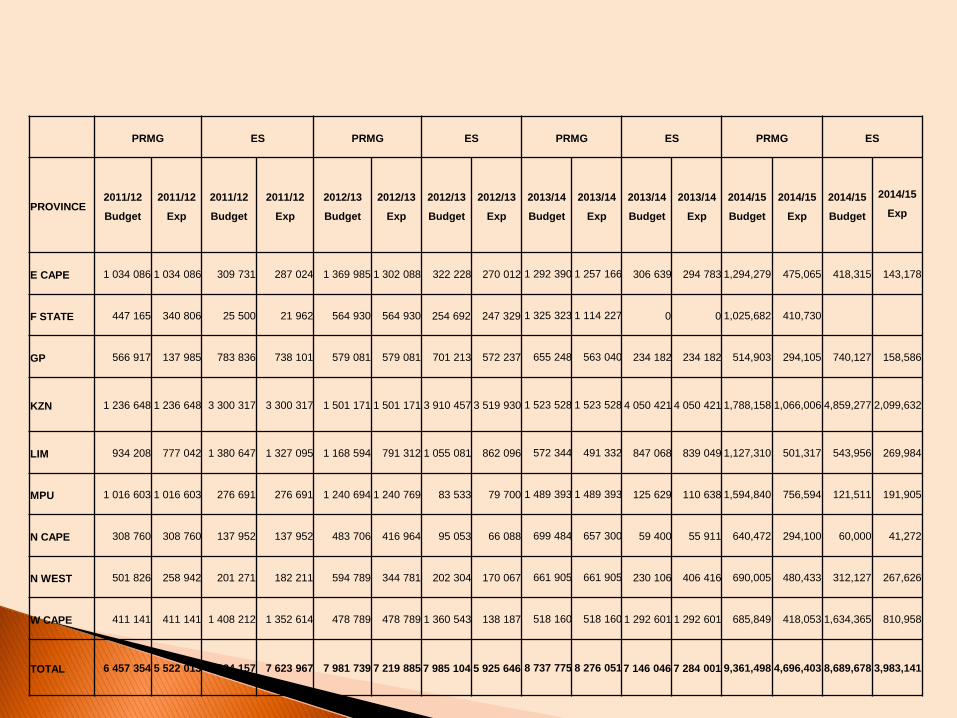
PRMG ES PRMG ES PRMG ES PRMG ES
PROVINCE 2011/12
Budget
2011/12
Exp
2011/12
Budget
2011/12
Exp
2012/13
Budget
2012/13
Exp
2012/13
Budget
2012/13
Exp
2013/14
Budget
2013/14
Exp
2013/14
Budget
2013/14
Exp
2014/15
Budget
2014/15
Exp
2014/15
Budget
2014/15
Exp
E CAPE 1 034 086 1 034 086 309 731 287 024 1 369 985 1 302 088 322 228 270 012 1 292 390 1 257 166 306 639 294 783 1,294,279 475,065 418,315 143,178
F STATE 447 165 340 806 25 500 21 962 564 930 564 930 254 692 247 329 1 325 323 1 114 227 0 0 1,025,682 410,730
GP 566 917 137 985 783 836 738 101 579 081 579 081 701 213 572 237 655 248 563 040 234 182 234 182 514,903 294,105 740,127 158,586
KZN 1 236 648 1 236 648 3 300 317 3 300 317 1 501 171 1 501 171 3 910 457 3 519 930 1 523 528 1 523 528 4 050 421 4 050 421 1,788,158 1,066,006 4,859,277 2,099,632
LIM 934 208 777 042 1 380 647 1 327 095 1 168 594 791 312 1 055 081 862 096 572 344 491 332 847 068 839 049 1,127,310 501,317 543,956 269,984
MPU 1 016 603 1 016 603 276 691 276 691 1 240 694 1 240 769 83 533 79 700 1 489 393 1 489 393 125 629 110 638 1,594,840 756,594 121,511 191,905
N CAPE 308 760 308 760 137 952 137 952 483 706 416 964 95 053 66 088 699 484 657 300 59 400 55 911 640,472 294,100 60,000 41,272
N WEST 501 826 258 942 201 271 182 211 594 789 344 781 202 304 170 067 661 905 661 905 230 106 406 416 690,005 480,433 312,127 267,626
W CAPE 411 141 411 141 1 408 212 1 352 614 478 789 478 789 1 360 543 138 187 518 160 518 160 1 292 601 1 292 601 685,849 418,053 1,634,365 810,958
TOTAL 6 457 354 5 522 013 7 824 157 7 623 967 7 981 739 7 219 885 7 985 104 5 925 646 8 737 775 8 276 051 7 146 046 7 284 001 9,361,498 4,696,403 8,689,678 3,983,141
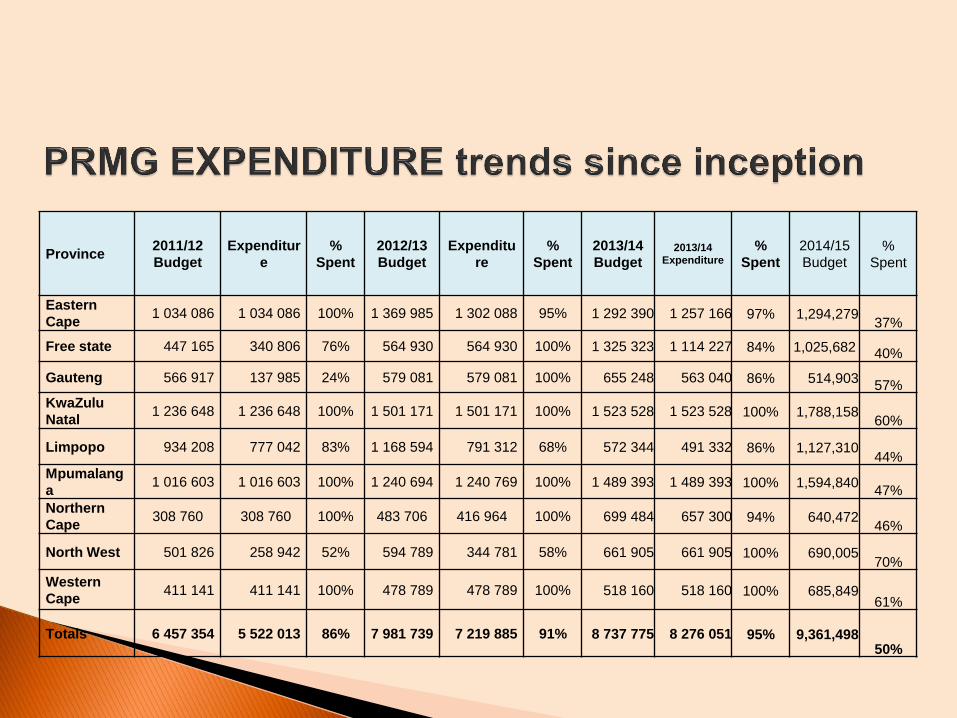
Province 2011/12
Budget
Expenditur
e
%
Spent
2012/13
Budget
Expenditu
re
%
Spent
2013/14
Budget 2013/14
Expenditure
%
Spent
2014/15
Budget
%
Spent
Eastern
Cape 1 034 086 1 034 086 100% 1 369 985 1 302 088 95% 1 292 390 1 257 166 97% 1,294,279
37%
Free state 447 165 340 806 76% 564 930 564 930 100% 1 325 323 1 114 227 84% 1,025,682 40%
Gauteng 566 917 137 985 24% 579 081 579 081 100% 655 248 563 040 86% 514,903 57%
KwaZulu
Natal 1 236 648 1 236 648 100% 1 501 171 1 501 171 100% 1 523 528 1 523 528 100% 1,788,158
60%
Limpopo 934 208 777 042 83% 1 168 594 791 312 68% 572 344 491 332 86% 1,127,310 44%
Mpumalang
a 1 016 603 1 016 603 100% 1 240 694 1 240 769 100% 1 489 393 1 489 393 100% 1,594,840
47%
Northern
Cape 308 760 308 760 100% 483 706 416 964 100% 699 484 657 300 94% 640,472
46%
North West 501 826 258 942 52% 594 789 344 781 58% 661 905 661 905 100% 690,005 70%
Western
Cape 411 141 411 141 100% 478 789 478 789 100% 518 160 518 160 100% 685,849
61%
Totals 6 457 354 5 522 013 86% 7 981 739 7 219 885 91% 8 737 775 8 276 051 95% 9,361,498 50%
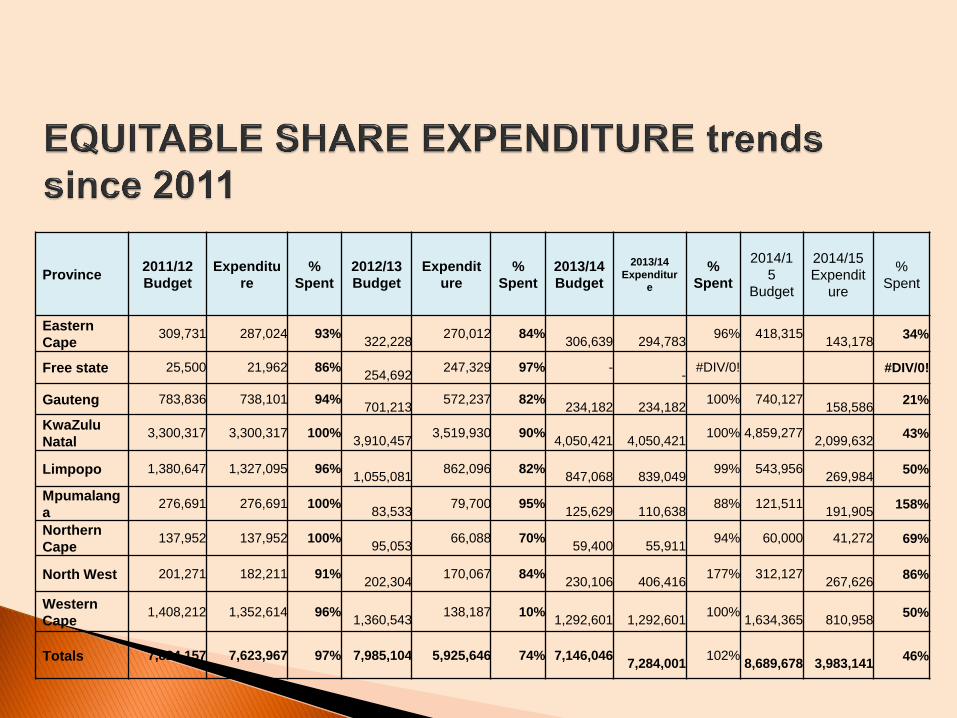
Province 2011/12
Budget
Expenditu
re
%
Spent
2012/13
Budget
Expendit
ure
%
Spent
2013/14
Budget
2013/14
Expenditur
e
%
Spent
2014/1
5
Budget
2014/15
Expendit
ure
%
Spent
Eastern
Cape 309,731 287,024 93%
322,228 270,012 84%
306,639
294,783 96% 418,315
143,178 34%
Free state 25,500 21,962 86%
254,692 247,329 97% -
- #DIV/0! #DIV/0!
Gauteng 783,836 738,101 94%
701,213 572,237 82%
234,182
234,182 100% 740,127
158,586 21%
KwaZulu
Natal 3,300,317 3,300,317 100%
3,910,457 3,519,930 90%
4,050,421
4,050,421 100% 4,859,277
2,099,632 43%
Limpopo 1,380,647 1,327,095 96%
1,055,081 862,096 82%
847,068
839,049 99% 543,956
269,984 50%
Mpumalang
a 276,691 276,691 100%
83,533 79,700 95%
125,629
110,638 88% 121,511
191,905 158%
Northern
Cape 137,952 137,952 100%
95,053 66,088 70%
59,400
55,911 94% 60,000 41,272 69%
North West 201,271 182,211 91%
202,304 170,067 84%
230,106
406,416 177% 312,127
267,626 86%
Western
Cape 1,408,212 1,352,614 96%
1,360,543 138,187 10%
1,292,601
1,292,601 100%
1,634,365
810,958 50%
Totals 7,824,157 7,623,967 97% 7,985,104 5,925,646 74% 7,146,046
7,284,001 102%
8,689,678
3,983,141 46%
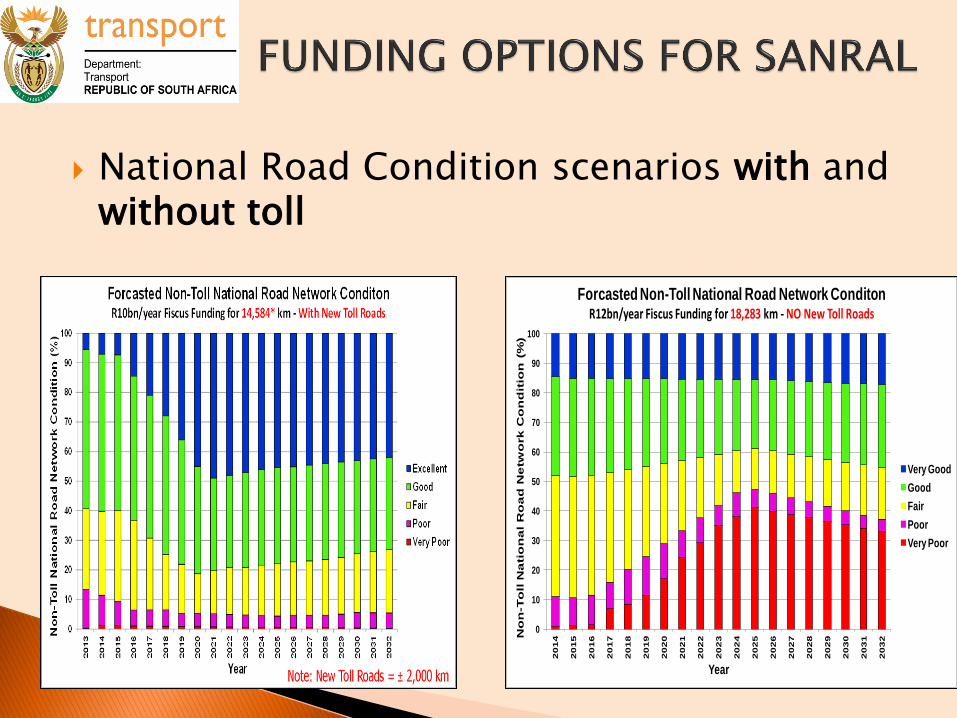
National Road Condition scenarios with and without toll
0
10
20
30
40
50
60
70
80
90
100
20
14
20
15
20
16
20
17
20
18
20
19
20
20
20
21
20
22
20
23
20
24
20
25
20
26
20
27
20
28
20
29
20
30
20
31
20
32N
on
-To
ll N
ati
on
al
Ro
ad
Ne
two
rk
Co
nd
itio
n (
%)
Year
Forcasted Non-Toll National Road Network ConditonR12bn/year Fiscus Funding for 18,283 km - NO New Toll Roads
Very Good
Good
Fair
Poor
Very Poor

Vehicle registration/license fees and traffic fines - income generated
and collected by provincial and local spheres of Government. It is not
necessarily available to transport authorities
Development impact fees - Developer contributions towards infrastructure
provision are taking place - not on a formalized, national basis. Assist local
network improvements, not freeway development & expansion
Shadow tolling - No tolls are levied from road users under this approach.
Instead the shadow tolls are paid by Government to the operator, based on
traffic counts on the road, an agreed rate per vehicle/vehicle type and an
agreed set of performance criteria. The option does not create a new
source of funds, or from making users internalize the external costs of their
travel, but rather from Government commitment to continued financial
support over several years.
25
Tolling – A user based funding mechanism for road infrastructure
development. It enables the mobilisation of substantial capital funds upfront,
usually through debt equity, for the construction of infrastructure such as
freeways. Tolls complement general revenue
User pay principle - provide funding for implementing, maintaining and
upgrading road infrastructure
also is a Travel Demand Management
encourages trip sharing
encourages the use of public transport
Fiscal framework – government funds infrastructure development and
management through its equitable share.
26
27
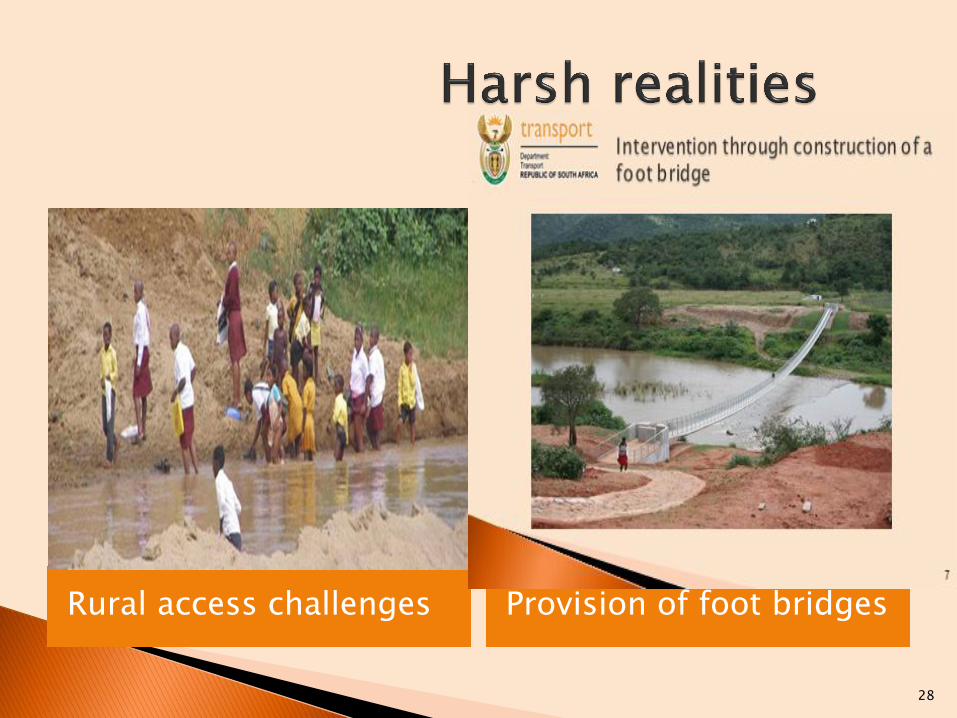
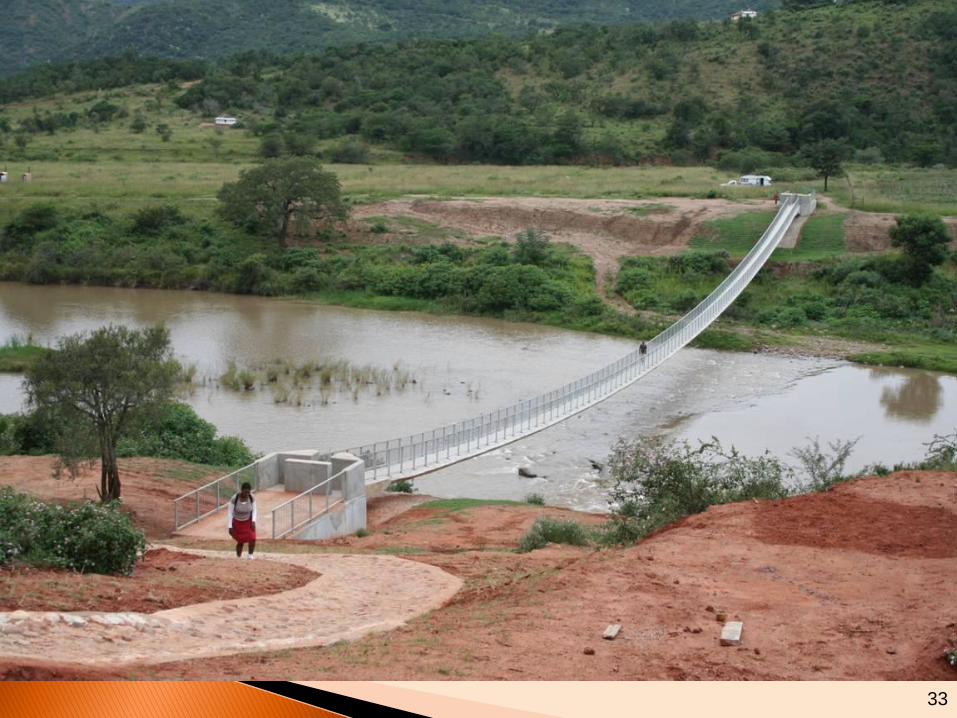
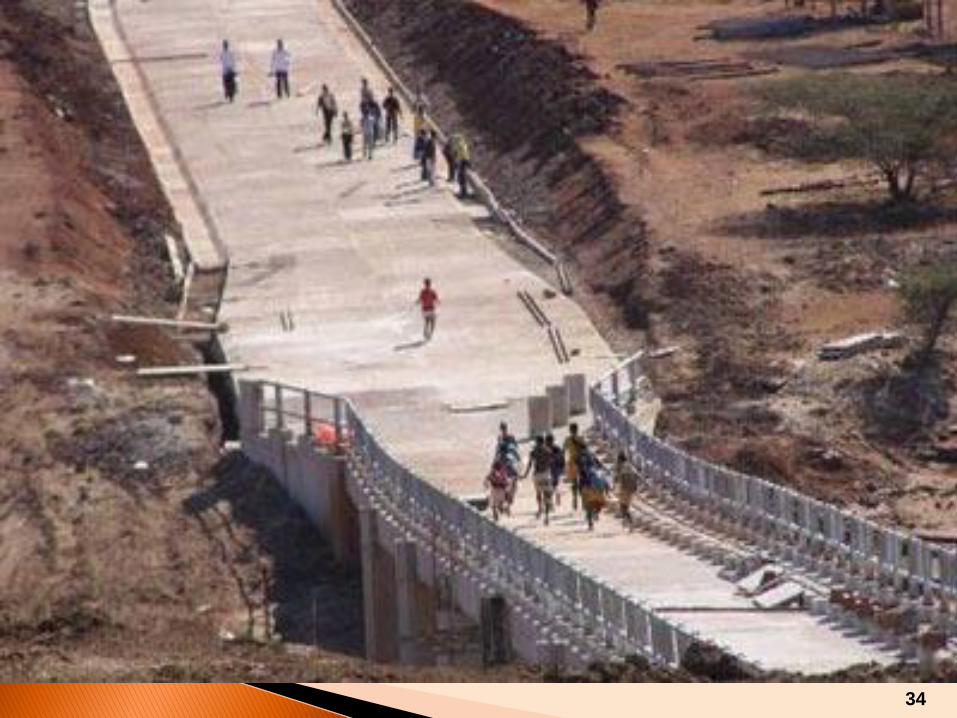
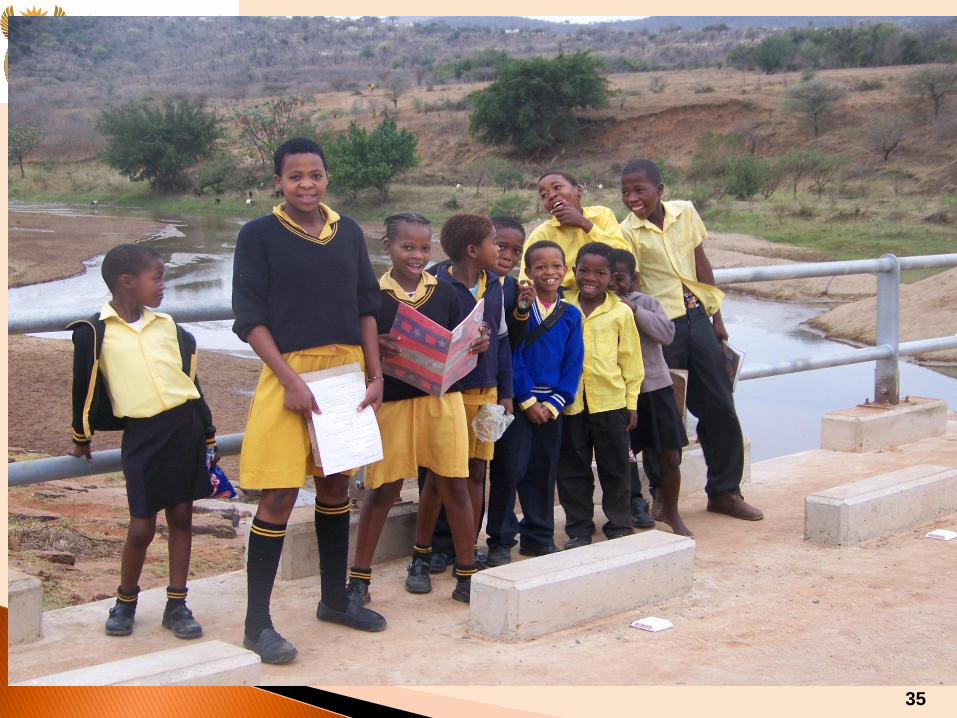
Rural access challenges Provision of foot bridges
28

29

30
31
32
33
34
35
Thank You
36