Embed Size (px)
Citation preview
570455 – Treball Final de Màster
Jesús Pérez González01/09/2014
Facultat d’Economia i EmpresaMàster d’Història EconòmicaTreball Final del Màster
OVERCOMING THE CRISIS: ADDED VALUE EMPLOYMENT IN LARGEST SPANISH FIRMS
JESPERGON 2 ~
Facultat d’Economia i EmpresaMàster d’Història EconòmicaTreball Final de Màster
OVERCOMING THE CRISIS: ADDED VALUE EMPLOYMENT IN LARGEST SPANISH FIRMS
JESPERGON
Overcoming the Crisis:
Added Value Employment in the Largest Spanish Firms, 1971-2012.
A Study of Economic Activities.
Jespergon
Final Job of the Economic History Interdisciplinary UB-UAB-UZ Master's Degree.
Supervised by Dr. Anna Mª Aubanell Jubany, UAB Professor.
Barcelona, September 1, 2014.
® Jespergon: Jesús Pérez González, 2014.
® UB: University of Barcelona, 2014.<http://www.ub.edu/histeco/cat/inici.htm>
® UAB: Autonomous University of Barcelona, 2014.<http://www.ub.edu/histeco/cat/inici.htm>
® UZ: University of Zaragoza, 2014.<http://www.unizar.es/departamentos/estructura_economica/presentacion.html>
~ 3 ~

Facultat d’Economia i EmpresaMàster d’Història EconòmicaTreball Final del Màster
OVERCOMING THE CRISIS: ADDED VALUE EMPLOYMENT IN LARGEST SPANISH FIRMS
JESPERGON 4 ~
Facultat d’Economia i EmpresaMàster d’Història EconòmicaTreball Final de Màster
OVERCOMING THE CRISIS: ADDED VALUE EMPLOYMENT IN LARGEST SPANISH FIRMS
JESPERGON
Al meu fill Vicenç
perquè el papa t'estima molt.
~ 5 ~
Cited in the page 15 of the Spanish version book
Reinvent. Your Second Chance.Dr. Mario Alonso Puig (2010).
Barcelona. Book Club.

Facultat d’Economia i EmpresaMàster d’Història EconòmicaTreball Final del Màster
OVERCOMING THE CRISIS: ADDED VALUE EMPLOYMENT IN LARGEST SPANISH FIRMS
JESPERGON 6 ~
Facultat d’Economia i EmpresaMàster d’Història EconòmicaTreball Final de Màster
OVERCOMING THE CRISIS: ADDED VALUE EMPLOYMENT IN LARGEST SPANISH FIRMS
JESPERGON
Overcoming the Crisis:
Added Value Employment in the Largest Spanish Firms, 1971-2012.
A Study of Economic Activities.
Jespergon.1 Supervised by Dr. Anna Aubanell. September 1, 2014
RESEARCH JOB IN ECONOMIC HISTORY MASTER'S (UB-UAB-UZ)
Abstract
This study describes results of the evolutionary dynamic of the economic activities, and added
value and employment trends, of the largest non-financial Spanish firms. The innovation of this
study is the performance of a longitudinal cross from 1971 to 2012. The goal is to determine which
Spanish economic activities have generated largest wealth: bigger added value and higher
employment. To carry out this mission, this study uses an evolutionary model. It is an annual
scatterplot that correlates employment, measured by quantity of jobs, and added value, measured by
monetary value, of the largest non-financial Spanish firms, measured by operational revenues. The
originality of this study is the division of the dispersion diagram into four quadrants: bottom left
one of low employment and low added value, bottom right one of high employment and low added
value, top left one of low employment and high added value, and top right one of high employment
and high added value.
Keywords: Added Value, Employment, Wealth, Spanish Economic Activities, largest Spanish
firms, Dispersion Diagram, Evolutionary Model.
JEL classification codes: A13, B52, C25, D31, E01, J21, L11, M40.
Resumen
Este estudio describe los resultados de la dinámica evolutiva de las actividades económicas y,
las tendencias de valor añadido y empleo, de las mayores empresas no financieras de España. La
innovación de este estudio es la realización de un corte longitudinal desde 1971 hasta 2012. El
1 Jespergon ©: Jesús Pérez González. <[email protected]>. Graduado en ADE por la UOC.
~ 7 ~
Facultat d’Economia i EmpresaMàster d’Història EconòmicaTreball Final del Màster
OVERCOMING THE CRISIS: ADDED VALUE EMPLOYMENT IN LARGEST SPANISH FIRMS
JESPERGON
objetivo es determinar qué actividades económicas españolas han generado mayor riqueza: mayor
valor añadido y mayor empleo. Para lleva a cabo esta misión, este estudio usa un modelo evolutivo.
Es un diagrama de dispersión annual que correlaciona empleo, medido por la cantidad de puestos de
trabajo, y valor añadido, medido por el valor monetario, de las mayores empresas españolas no
financieras, medidas por los ingresos de explotación. La originalidad de este estudio es la división
del diagrama de dispersión en cuatro cuadrantes: el inferior izquierdo de bajo empleo y bajo valor
añadido, el inferior derecho de alto empleo y bajo valor añadido, el superior izquierdo de bajo
empleo y alto valor añadido y el superior derecho de alto empleo y alto valor añadido.
Palabras clave: Valor añadido, Empleo, Riqueza, Actividades económicas españolas, mayores
empresas españolas, Diagrama de dispersión, Modelo evolucionario.
JEL classification codes: A13, B52, C25, D31, E01, J21, L11, M40.
Introduction
The major consequence of the Great Recession for Spain has been the spectacular rise of
unemployment rate. According to ILO,2 Spain scored top 5 major unemployment harmonized rate
countries in the World —behind Macedonia, Kosovo, Bosnia and Herzegovina, and South Africa
sorted from highest to lowest— in the year 2012. Unemployment harmonized annual rate in Spain
was 25.6 over Spanish active population according to EU statistics 3 or 26.4 according to OECD
database 4 at the end of the year 2013. These data was maximum Spanish unemployment rate from
1987 to 2013. According to euroindicators in January 2014,5 the EU28 and Spanish seasonally-
2: ILO. Ilostat. International Labour Organization. <http://www.ilo.org/ilostat/faces/home/statisticaldata>. [Accessed May 3, 2014].
3: EU. Eurostat. European Commission. <http://epp.eurostat.ec.europa.eu/portal/page/portal/statistics/search_database>. [Accessed April 18, 2014].
4: OECD. StatExtracts. Organisation for Economic co-Operation and Development. <http://stats.oecd.org/>. [Accessed March 2, 2014].
5: Eurostat (2014). Euro area unemployment rate at 12.0% [online open access]. European Commission. News Release Euroindicators, (30/2014 – 28 February 2014). <http://epp.eurostat.ec.europa.eu/cache/ITY_PUBLIC/3-28022014-AP/EN/3-28022014-AP-EN.PDF>. [Accessed April 2, 2014].
8 ~
Facultat d’Economia i EmpresaMàster d’Història EconòmicaTreball Final de Màster
OVERCOMING THE CRISIS: ADDED VALUE EMPLOYMENT IN LARGEST SPANISH FIRMS
JESPERGON
adjusted unemployment rate was 10.8 and 25.8 percentage points, respectively. This data have
scored Spain in the second position —behind Greece— in the ranking of major countries in the
European Union unemployment rate, and fifteen percentage points over the EU28 average.
In this context, value-added economic activities and economic growth without net
employment creation are in discussion in the Spanish society. According to Laborda,6 “the data
appear to assert greater survivability of large companies, especially those of 5,000 workers or
more”. Relevance of this study is largest Spanish firms evolution sorted by economic activities, and
its employment and added value projection in short-term.
The main question of this study is: Which Spanish economic activities had high employment
and high added value in the largest Spanish firms during the period 1971-2012? The secondary
questions are: What was the evolutionary dynamic of these economic activities? What was the
employment and added value trends of these economic activities? What were economic activities
bigger wealth generating during the period 1971-2012? Which was correlation between
employment and added value? Does data aggregation changes results of this study? Can be drawn
some projection of this study in the short-term?
For answering these questions this study is divided in seven chapters without including this
introduction and the appendices. The first chapter is the state of the art about the recent literature of
the Spanish economic activities of the big business in the last forty years. The second chapter is
about the data-set source, methodology description used in the evolutionary model, and discussion
about validity of this study. The third chapter shows results of the evolutionary model of this study,
the «microresults» of the economic activities outside the bottom left quadrant, evolutionary wealth
ranking, and the «macroresults» of the aggregation by quadrants of all economic activities. The
fourth are the answer to the questions. The fifth chapter expose conclusions may be extracted of the
results of this study. The sixth chapter are the extensions about the theme Overcoming the Crisis
that I would wish to investigate in future research with European Funds in a short time. The seventh
chapter are references. And, finally, appendix that it shows the annual results —plotted in the form
of graphics— of the evolutionary model.
6: Laborda, Anna (2012). ¿Cuántas empresas se ha llevado la crisis? Informe Económico ESADE, 12 (January, 2012), 54-63.
~ 9 ~
Facultat d’Economia i EmpresaMàster d’Història EconòmicaTreball Final del Màster
OVERCOMING THE CRISIS: ADDED VALUE EMPLOYMENT IN LARGEST SPANISH FIRMS
JESPERGON
1. Literature review
The majority of experts viewed added value as a multidimensional construct. “There is no one
definition of added value”. “There are a lot of things that could be in there and you could call all of
those added value”. “There are many ways of measuring what it means”. These views reflect the
diversity of perspectives uncovered in the literature review (de Chernatony, Harris & Dall'Olmo,
2000: 46). While some speak of «added value», others talk about «adding value» or «value-added»
(De Chernatony, Harris & Dall'Olmo, 2000: 42). In this study I use the term «added value» and it is
related to an accounting definition.
According to Gallizo (2000a), «value added» is defined by the increase of wealth generated
by the activities of a company in a given period, which is measured by the difference between the
production value reached in the period —sold, stored, and immobilized— and the procurement
related to that volume of activity. Therefore, it is a «value added production». It is also a «gross
value added» —GVA— because it does not compute depreciation and provisions in the section on
operating costs, but such provisions are considered an assignment in the distribution of value added.
It is also a «business value added» directly linked with the GVA of the National Accounts, by
obtaining a classification of income and expenses by nature. In this study the largest Spanish firms
are those who declare higher operational revenue in their annual accounts.
The production approach, which is also called the output approach, measures GDP as the
difference between the aggregation of business GVA less the value of goods and services used in
producing these outputs during an accounting period (Viet, 2009: 4-14). The total economy
comprises the following institutional sectors in the System of National Accounts:
a) Non-financial corporations (divided into public, national private, and foreign controlled);
b) Financial corporations (divided into public, national private, and foreign controlled);
c) General government;
10 ~
Facultat d’Economia i EmpresaMàster d’Història EconòmicaTreball Final de Màster
OVERCOMING THE CRISIS: ADDED VALUE EMPLOYMENT IN LARGEST SPANISH FIRMS
JESPERGON
d) Non-profit institutions serving households; and
e) Households.
The subject of this study are the largest non-financial Spanish firms.
Daems (1987: 73-91)7 developed a test to analyze the underlying factors to the growth of big
firms. He provided some puzzling facts, such as the astonishingly high level of large U.K. firms in
real per capita terms among the European countries or, on the contrary, the surprisingly low level of
Spanish large firms in the same terms. Possible explanations were low R&D levels and the revealed
comparative advantage of a country against the set of sectors more conducive to giant firms. The
comparative advantage of Spain was not conducive to the developing of trademarks, at least until
1970. Oranges and fruits, iron ore, lead, pyrites, wine, and oil were unlikely candidates for
trademarks. Even the late growth of industrial exports was linked to non trademark sectors:
shoemaking and shipbuilding. During the period 1974-1990 Spain begun to show a very
competitive profile in one particular sector typically trademark led: vehicles. Spain was one of the
major world cars exporter in 1990 (Carreras & Tafunell, 1999: 303-304).
Carreras & Tafunell (1999: 281-283) analyzed the sectoral composition of the 200 largest
Spanish firms from 1917 to 1990. In the years 1974 and 1990, ordered by the number of firms, top
five economic sectors were manufacturing, finance, utilities —electricity, gas, water, and telephone
—, construction and public works, and transports. They also showed the distribution of the fifty
largest Spanish manufacturing enterprises sorted by the SIC American sectoral breakdown.8 In the
years 1974 and 1990, the group with greater number of firms is transportation equipment in both
years, followed by chemicals in the year 1974 and electrical machinery in 1990.
This current study is conducted from the point of view of the Spanish economic activities,
rather than an industrial sector study, because service firms —the tertiary sector— are included. In
the same way, this study is not a sectoral economic study because agriculture, livestock and
fisheries —the primary sector— is not included. Summarizing, this study focuses on the largest
non-financial Spanish firms engaged in economic activities of the secondary and tertiary sectors.
7: Work cited in Carreras & Tafunell (1999: 303).
8: SIC: Standard Industrial Classification. A SIC list is online available in the Department of Labor of the United States. <https://www.osha.gov/pls/imis/sic_manual.html>. [Accessed July 17, 2014].
~ 11 ~
Facultat d’Economia i EmpresaMàster d’Història EconòmicaTreball Final del Màster
OVERCOMING THE CRISIS: ADDED VALUE EMPLOYMENT IN LARGEST SPANISH FIRMS
JESPERGON
The most important literature for this study is the Spanish book The Big Firm in Spain. A
process of concentration and dependence (Sánchez, 1998). Joan-Eugeni Sánchez 9 argued that a
double process of concentration and dependence had occurred with the largest firms that were
operating in Spain, considering these as fundamentals in the economic activity. He analyzed the
general features of the largest firms in Spain through the evolution of variables provided by the
annual special issues —The (…) largest Spanish firms— of the Spanish journal Fomento de la
producción, the same dataset I have used for this study. He restricted the sample to the 1,000 largest
Spanish firms, measured by their operational revenue, so do this study but only 711 firms on
average in the period 1971-2012. He wrote an entire chapter to contextualize the structural and
cyclical trends of the Spanish economy during the period 1973-1994. He realized six cross-sections:
1973, 1976, 1981, 1986, 1991, and 1994. The innovation of this study is that I realize a longitudinal
section from 1971 to 2012 of the largest Spanish firms.
Sánchez analyzed changes in the structure of Spanish largest firms through the evolution of
the number of enterprises, operational revenue, added value, own resources, profit or loss, and
apparent and real productivity by sectors —industry, construction, and services— and by economic
activities —the first two digits of the NACE firm—. His results showed that the higher economic
activity by number of firms (table IV.2: 76) and by relative operational revenue (table IV.4: 82) was
big stores. The higher economic activity by relative added value per operational revenue was
communications (table IV.6: 88). The higher economic activity by total people employed was
construction, and by average employment per firm were rail transport in the year 1973 and
communications in 1994 (table V.2: 102). The higher economic activity by apparent productivity,
measured by added value per employee, was energy and water (table V.3: 109). The data source of
this study ends in 2006 and my desire was to get to the present, I have supplemented it with other data
source that has forced me to convert NACE 10 in the economic activities code of the first source.
There is an interesting study of Rodríguez (2011: 7) that analyzed the impact of the current
Economic Recession had on Spanish employment and GVA in 2009 through the correlation of
9: Joan-Eugeni Sánzchez is Professor of Human Geography at the University of Barcelona and scientific consultant to the Center for European Initiatives and Research Foundation in the Mediterranean —CIREM—.
10: NACE: Statistical Classification of Economic Activities in the European Community. <http://ec.europa.eu/eurostat/ramon/nomenclatures/index.cfm?TargetUrl=LST_NOM_DTL&StrNom=NACE_REV2>. [Accessed July 21, 2014]. A Spanish NACE list is online available in CNAE. <http://www.cnae.com.es/lista-actividades.php>. [Accessed July 17, 2014].
12 ~
Facultat d’Economia i EmpresaMàster d’Història EconòmicaTreball Final de Màster
OVERCOMING THE CRISIS: ADDED VALUE EMPLOYMENT IN LARGEST SPANISH FIRMS
JESPERGON
annual variation in real GVA and employment from 2008 to 2009 plotted in four quadrants. It
showed that there were 11 industries in the top right quadrant —GVA and employment growth rates
above the national average—: health, veterinary and social services; public administration;
education; personal services; domestic staff; agriculture, livestock and hunting; hospitality;11
transports and communications; real-estate and business services; food, beverages and tobacco; and,
trade and repair. There were 2 industries in the top left quadrant —GVA growth rate above the
national average and employment growth rate below the national average—: fishing and chemical.
There were 7 industries in the bottom right quadrant —GVA growth rate below the national average
and employment growth rate above the national average—: electric power, gas and water;
manufacture of coke, refined petroleum products and nuclear fuel; financial intermediation; paper,
publishing and printing; rubber and plastics; extraction of energy products; and, machinery and
equipment. Finally, there were 9 industries in the bottom left quadrant —GVA and employment
growth rates below the national average—: transport material; electrical, electronic and optical
equipment; miscellaneous articles; other mineral extraction; leather and footwear; metallurgy and
metal products; textile and confection; other non-metallic mineral products; and, wood and cork.
The originality of this study is because I analyze the correlation between added value and
employment of the secondary and tertiary economic activities of the largest non-financial Spanish
firms during the period 1971-2012 through four quadrants whose meanings are: high added value
and high employment —economic activities located in the top right quadrant—, high added value
and low employment —the top left quadrant—, low added value and high employment —the
bottom right quadrant—, and low added value and low employment —the bottom left quadrant—. I
have not found literature review with this idea.
In the context of the European debate on «jobless growth» in the 1990s, Pianta (2003: 9)
explained that the evidence points to an extensive process of restructuring in many manufacturing
sectors where the growth of value added is not matched anymore by increases in jobs . The idea of
relating employment and added value emerged from Pianta (2003: 6) that related “[...] the most
accurate description of the economic relevance of innovations [measured by share of new products
in sales] to the employment performance [measured by percentage change in employment] of 20
11: Hospitality is referred to the Spanish word hostelería that means: set of services, companies and establishmentsproviding accommodation and food to travelers.
~ 13 ~
Facultat d’Economia i EmpresaMàster d’Història EconòmicaTreball Final del Màster
OVERCOMING THE CRISIS: ADDED VALUE EMPLOYMENT IN LARGEST SPANISH FIRMS
JESPERGON
manufacturing industries in four EU countries [...]” where “ICT industries (computing,
telecommunications, precision instruments and other transport, including aerospace) are generally
in the top right quadrant [...]” and “Traditional industries (textiles, wearing apparel, leather and a
few others) tend to concentrate in the bottom left quadrant [...]”. My hypothesis is that largest added
value employment economic activities would must be high technological or intensive knowledge
ones (Gencat, 2007, 2008, 2009), and these activities would be —or not— bigger employment
generating. I expect that for Spain it will not be so.
Finally, I want to point out that the idea of modeling the evolution of the economic activities
represented by the largest Spanish firms in a dispersion diagram emerged from Hans Rosling,12 and
I believe that this study is the first time Rosling evolutionary model is applied in the correlation of
added value and employment.
Summarizing, this study analyzes evolutionary dynamic of the economic activities, and added
value and employment trends, of the largest non-financial Spanish firms, measured by their
operational revenue, engaged in economic activities of the secondary and tertiary sectors during the
period 1971-2012. The goal is to determine which Spanish economic activities have generated the
largest wealth: bigger added value and higher employment.
12: Rosling, Hans (2006). “The best stats you've ever seen” [open access online]. TED. Filmed on February 2006. <http://www.ted.com/talks/hans_rosling_shows_the_best_stats_you_ve_ever_seen>. [Accessed on June 28, 2014].See also YouTube video: “Hans Rosling's 200 Countries, 200 Years, 4 Minutes – The Joy of Stats – BBC Four”. Updated on November 26, 2010. <http://www.youtube.com/watch?v=jbkSRLYSojo>. [Accessed on November 3, 2012].
14 ~
Facultat d’Economia i EmpresaMàster d’Història EconòmicaTreball Final de Màster
OVERCOMING THE CRISIS: ADDED VALUE EMPLOYMENT IN LARGEST SPANISH FIRMS
JESPERGON
2. Methodology
2.1. The source of the dataset
According to Sánchez (1998: 21), Fomento de la producción dataset is a homogeneous series,
not very common in the landscape of social and statistical information in Spain, and widely
accepted and disseminated in the Spanish business and academic fields. The availability of a series
of about 40 years and collected under the same homogeneous criteria open the option of a
diachronic analysis of great interest.
However, it is important to clarify that business data published by Fomento de la producción
are a voluntary response of the major Spanish companies at the request of the journal, and its
accuracy and veracity is understood due to the objective of social transparency in all
entrepreneurship. The authors of Fomento de la producción have supplemented the missing data
where it has been possible with other information sources, often in very few occasions for self-
esteem. Also these authors want to point out that in any case their work aims to achieve the
infallible qualification because the objective was just to get a guidance document. I subscribe all
these constraints for this study.
The idea of publishing the Spanish journal Fomento de la producción about industry,
commerce and finance in Barcelona was thanks to a journalist from Huesca called Feliciano
Baratech.13 The first exemplar published of this journal was in the year 1945 with fortnightly
appearance. Actually, this journal has a web page where is possible to consult the Spain 25,000
database.14 The query of this online database, and electronic ones —Spain 25,000, Spain 27,000 and
Spain 30,000 (Fomento de la producción, 1988-2011)—, did not produce the expected results
because added value data was not available. Of course, other database were consulted but with
13: Martí Michelena, A. (1990). “Recuerdos de un periodista”. Fomento de la producción, 1002 (Oct. 1, 1990), 8.
14: Fomento de la producción. España 25.000. Online database. <http://www.fomentodigital.com/busqueda/empresa/espana25000.jsp>. [Accessed May 3, 2014].
~ 15 ~
Facultat d’Economia i EmpresaMàster d’Història EconòmicaTreball Final del Màster
OVERCOMING THE CRISIS: ADDED VALUE EMPLOYMENT IN LARGEST SPANISH FIRMS
JESPERGON
failed results because there were not available added value data of the largest Spanish firms.15 More
over, other databases exist but with restricted access.16
So, the next step was consult the availability of the journal Fomento de la producción in the
common catalogue of the universities of Catalonia. The results of this consultation showed that
from 1970 there was a Spanish annual special issue called The (…) largest Spanish firms (Fomento
de la Producción, 1970-2006). The consult in situ of available annual special issues —the whole
collection were available in the National Library of Catalonia— show me the possibility of a
longitudinal section of the largest Spanish firms because operational revenue, quantity of
employment, added value, and economic activity classification of the largest Spanish firms were
available from 1971 to 2006. A further problem was low coverage of the variable added value.
My desire from the beginning was to finish this study closest the current year for analyzing
the involvement of the Economic Recession in Spain —from 2009 to 2013—17 on the employment
and added value of the largest non-financial firms. To meet this objective was necessary to expand
the dataset. Beyond 2006, I only found a dossier within the journal entitled “The first Spanish
15: Dun & Bradstreet (1990). Duns 15.000. Principales empresas españolas. Dun & Bradstreet España, S.A.—— (1992, 1993). Duns 30.000. Principales empresas españolas. Dun & Bradstreet España, S.A. —— (1998). Duns 50.000. Principales empresas españolas. Volumenes 1 y 2. Dun & Bradstreet España, S.A.INE. Encuesta Industrial de Empresas. <http://www.ine.es/jaxi/menu.do?
type=pcaxis&path=/t05/p048/&file=inebase&L=0>. [Accessed July 24, 2014].Banco de España. Central de Balances. <http://www.bde.es/bde/es/areas/cenbal/>. [Accessed July 17, 2014].(2002). Las 1.000 mayores empresas españolas [recurso electrónico]: contiene 6.000 balances de las 1.000
mayores empresas de los ejercicios 1996-2001. La Gaceta de los Negocios with the collaboration of Banco Santander Central Hispano.
(2004). 1.000 mayores empresas españolas [recurso electrónico]: contiene los datos del último ejercicio de las 1.000 mayores empresas españolas. La Gaceta de los Negocios.
(2003, 2005, 2007). “5.000 mayores empresas”. Revista Actualidad Económica. Madrid: Recoletos medios digitales.
16: The empirical study of Besteiro (1991) that took as reference Account 80, "Operations", of the General Accounting Plan of Spain of the year 1973, and consisted in the analyses of the components of the Added Value of Spanish companies in 1979 and 1980, investigating fifty and three sectors in the two-digit level according to NACE with a sample of 102,233 companies in 1979 and 62,545 in 1980. The database was provided by the Center for Data Processing of the State Secretary of Treasury of the Ministry of Economy and Finance of Spain, without which collaboration would have been impossible to carry out her ambitious work.Besteiro Varela, María Avelina (1991). Estudio empírico referido a los años 1979 y 1980 de los componentes
del Valor Añadido de las empresas españolas realizado con datos de la cuenta 80, «Explotación», del PlanGeneral de Contabilidad [open access in Google Scholar]. Revista Española de Financiación y Contabilidad, XXI(66), 67-193.
17: According to Eurostat, Spain had negative real GDP growth rates in the years 2009, 2010, 2012, and 2013. <http://epp.eurostat.ec.europa.eu/tgm/table.do? tab=table&init=1&plugin=1&language=en&pcode=tec00115>.[Accessed, August 5, 2014]. According to the IMF, the Spanish forecast GDP growth rate for 2014 has moved to the positive 1.2 percentagepoints, and 1.6 for 2015. [News published in Spain on July 10, 2014].
16 ~
Facultat d’Economia i EmpresaMàster d’Història EconòmicaTreball Final de Màster
OVERCOMING THE CRISIS: ADDED VALUE EMPLOYMENT IN LARGEST SPANISH FIRMS
JESPERGON
companies to (...)” (Fomento de la producción, 2008-2012) of around 200 companies. So, I
supplemented these data with the online Iberian Analysis System Balances database, called SABI.18
This database has restricted access for students, stores financial company information and
business intelligence for 2,000,000 Spanish firms from 1989 to the current date, and all the
necessary data for this study —NACE 2009 primary code, operational revenue, number of
employees, and added value— were available and exportable. The problems encountered were that
the drop-down menu on the main page did not select the years prior to 2002, the reclassification of
the NACE according to the economic sector classification of the journal, and the faster consumption
of available financial credit for exporting data.19 Finally, I got to export top 500 Spanish firms by
operational revenue from 2006 to 2012.
According to Sánchez (1998: 21-22), simultaneity of two different data sources —Fomento
de la producción and SABI— can break the continuity of the serial homogeneity of this study. The
value of time series to establish the trends is know. It may be questionable in its absolute validity as
timely and quantitative information, but it allows to detect trends in the processes, even the values
may be questionable. This is the case in this methodology. However, this study can be considered
that provides information of interest, especially from an evolutionary point of view.
So, I had the data necessary for my study. The problem was the labor cost of this job. The
solution left was to scan the data; to write all data for each year in a spreadsheet —name of the firm,
name of the economic activity classification, nominal monetary operational revenue, quantity of
employment, and nominal monetary added value—; to order firms by economic activities when the
data source was the journal, or to reclassify firms by economic activities when the data source was
SABI; and, to add the totals. Lack of time has restricted sample size of this study of a total of 67,125
available companies to 28,461 firms, 711 per year on average,20 a coverage on average of 42.4
percentage points for the periods 1971-1986 and 1989-2012. Next table shows the annual coverage
of this study:
18: SABI. Sistema de Análisis de Balances Ibéricos. <http://www.bvdinfo.com/en-gb/products/company-information/national/sabi>. [Accessed on June 6, 2014].
19: Ten days' work in different Universities in two months —when financial credit was restored— were required.20: The constraint of around 660's firms used in this study is because it was the equivalent to four hours of my job.
~ 17 ~
Facultat d’Economia i EmpresaMàster d’Història EconòmicaTreball Final del Màster
OVERCOMING THE CRISIS: ADDED VALUE EMPLOYMENT IN LARGEST SPANISH FIRMS
JESPERGON
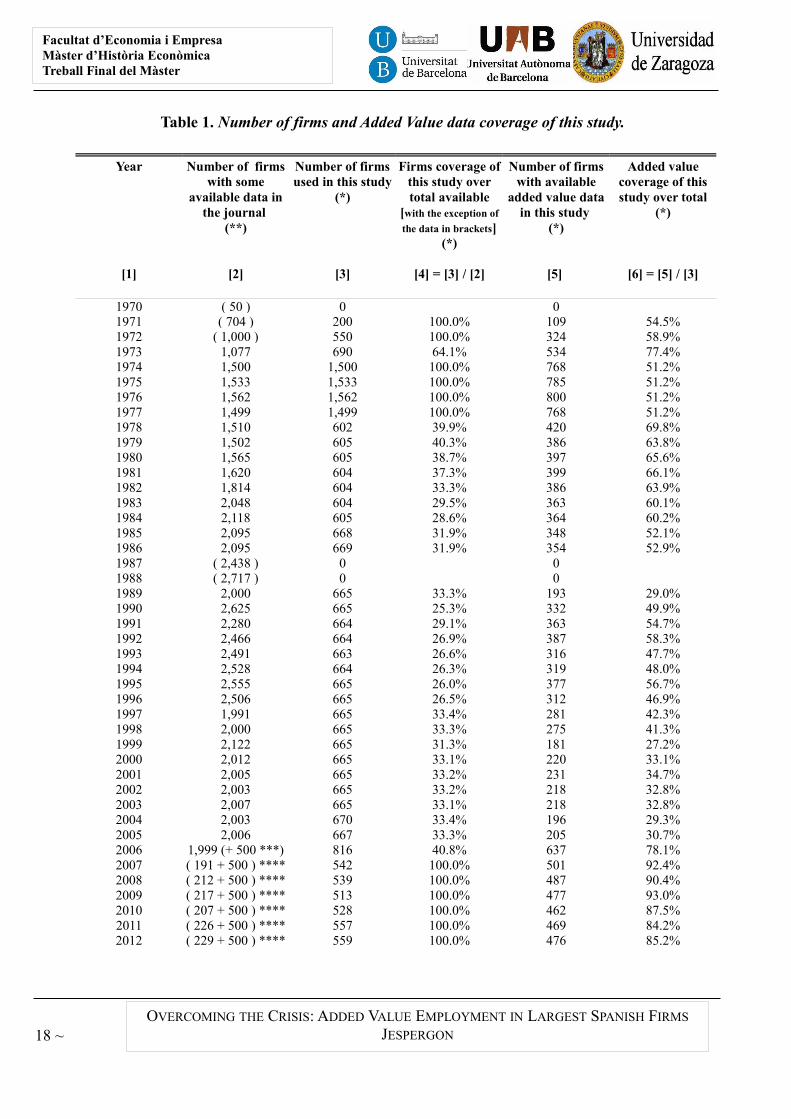
Table 1. Number of firms and Added Value data coverage of this study.
Year
[1]
Number of firmswith some
available data inthe journal
(**)
[2]
Number of firmsused in this study
(*)
[3]
Firms coverage ofthis study overtotal available
[with the exception of
the data in brackets](*)
[4] = [3] / [2]
Number of firmswith available
added value datain this study
(*)
[5]
Added valuecoverage of thisstudy over total
(*)
[6] = [5] / [3]
1970 ( 50 ) 0 01971 ( 704 ) 200 100.0% 109 54.5%1972 ( 1,000 ) 550 100.0% 324 58.9%1973 1,077 690 64.1% 534 77.4%1974 1,500 1,500 100.0% 768 51.2%1975 1,533 1,533 100.0% 785 51.2%1976 1,562 1,562 100.0% 800 51.2%1977 1,499 1,499 100.0% 768 51.2%1978 1,510 602 39.9% 420 69.8%1979 1,502 605 40.3% 386 63.8%1980 1,565 605 38.7% 397 65.6%1981 1,620 604 37.3% 399 66.1%1982 1,814 604 33.3% 386 63.9%1983 2,048 604 29.5% 363 60.1%1984 2,118 605 28.6% 364 60.2%1985 2,095 668 31.9% 348 52.1%1986 2,095 669 31.9% 354 52.9%1987 ( 2,438 ) 0 01988 ( 2,717 ) 0 01989 2,000 665 33.3% 193 29.0%1990 2,625 665 25.3% 332 49.9%1991 2,280 664 29.1% 363 54.7%1992 2,466 664 26.9% 387 58.3%1993 2,491 663 26.6% 316 47.7%1994 2,528 664 26.3% 319 48.0%1995 2,555 665 26.0% 377 56.7%1996 2,506 665 26.5% 312 46.9%1997 1,991 665 33.4% 281 42.3%1998 2,000 665 33.3% 275 41.3%1999 2,122 665 31.3% 181 27.2%2000 2,012 665 33.1% 220 33.1%2001 2,005 665 33.2% 231 34.7%2002 2,003 665 33.2% 218 32.8%2003 2,007 665 33.1% 218 32.8%2004 2,003 670 33.4% 196 29.3%2005 2,006 667 33.3% 205 30.7%2006 1,999 (+ 500 ***) 816 40.8% 637 78.1%2007 ( 191 + 500 ) **** 542 100.0% 501 92.4%2008 ( 212 + 500 ) **** 539 100.0% 487 90.4%2009 ( 217 + 500 ) **** 513 100.0% 477 93.0%2010 ( 207 + 500 ) **** 528 100.0% 462 87.5%2011 ( 226 + 500 ) **** 557 100.0% 469 84.2%2012 ( 229 + 500 ) **** 559 100.0% 476 85.2%
18 ~
Facultat d’Economia i EmpresaMàster d’Història EconòmicaTreball Final de Màster
OVERCOMING THE CRISIS: ADDED VALUE EMPLOYMENT IN LARGEST SPANISH FIRMS
JESPERGON
TOTAL 67,125 28,461 42.4% 15,638 54.9%
Source: (*) Own made. Results of the model.(**) Fomento de la producción (1971-2006).
(***) SABI. TOP500 Spanish firms by operational revenue.(****) Fomento de la producción (2008-2012) & SABI. TOP500.
Notes: The years 1970, 1987 and 1988 have not been included in the total because added value data were not available.The total firms included in the years 1971 and 1972 are the number of firms used in this study —200 and 550 instead of704 and 1,000, respectively— because original source did not offer any added value data for the others companies —504 and 450, respectively—, for this reason the study has full coverage in these years. For the years 1974, 1975, 1976and 1977 the data of this study was in correspondence with the aggregate results of the economic activities carried outby the authors of Fomento de la producción. It was a pity this practice did not continue in subsequent years. The data ofthe year 1974 was available in Fomento de la producción (1975). For the period 2006-2012 the simultaneous use of twodatasets —Fomento de la producción and SABI— causes the existence of duplications. The total firms included in theperiod 2007-2012 are the number of firms used in this study, for this reason the study has full coverage in this period.The journal data override SABI data for all replicas. The year 2007 was available in Fomento de la producción (2008).The dossiers “The first Spanish companies to (...)” of the years 2010, 2011 and 2012 (Fomento de la producción, 2010-2012) offer own resources data instead of the added value data of the firms.
The added values are not available for all the firms because, or there are enterprises that do
not provide some of the components for calculating their added value —SABI has not this problem
because it has full added value coverage—, or there are companies that belong a business group and
the added value is registered in the main firm —the Fomento de la producción dataset showed
results in the form of consolidated accounts—, or firms do not want to show negative added value
in their annual income statement —this is the case of the Fomento de la producción dataset but not
of the SABI dataset—, or there are subsidiary foreign firms deriving added value to their
headquarters. In previously table you can observe that on average the added value coverage of this
study is 54.9 percentage points over total. Obviously, complete coverage exchanges the results of
this study, and it requires that absolute results should be interpreted with caution. However, this
study may be useful to establish trends from the point of view of the evolutionary dynamic of the
economic activities of the largest non-financial Spanish firms. Following, relative added value and
employment calculations are necessary for modelling this study.
2.2. The description of the evolutionary model
This study uses a Rosling evolutionary model to analyze which Spanish economic activities
represented by the largest non-financial Spanish firms, measured by their operational revenue, had
~ 19 ~
Facultat d’Economia i EmpresaMàster d’Història EconòmicaTreball Final del Màster
OVERCOMING THE CRISIS: ADDED VALUE EMPLOYMENT IN LARGEST SPANISH FIRMS
JESPERGON
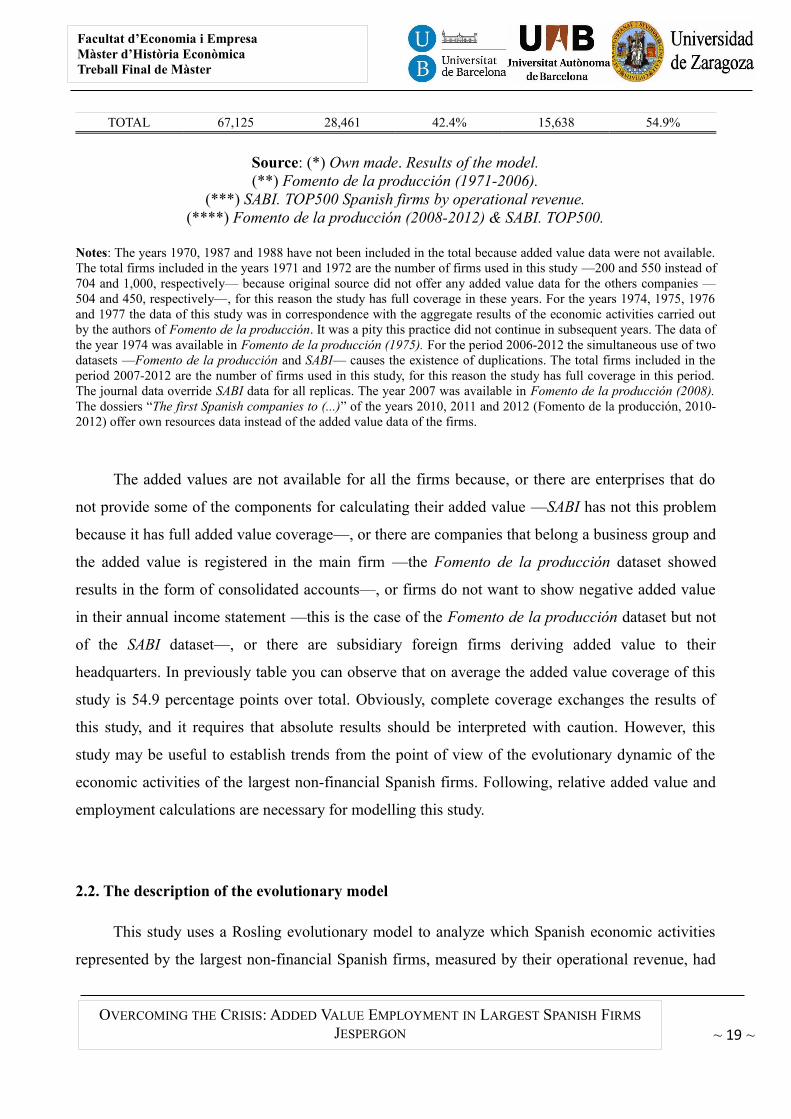
higher added value and bigger employment from 1971 to 2012. The evolutionary model is an
annual 2D-plotted dispersion diagram. The dispersion diagram correlates two variables:
employment and added value. Employment is represented in the horizontal axis and added value in
the vertical axis. Both axis are segmented into two divisions. The first division includes the range
values from 0 to 0.5 and the second one from 0.5 to 1. So, this model presents four quadrants. The
bottom left quadrant indicates low added value and low employment economic activities, the
bottom right one low added value and high employment, the top left one high added value and low
employment, and the top right one high added value and high employment.
Figure 1. Quadrants Structure Modeling.
Source: Own made.
How to calculate which quadrant belongs to an «element»? Given quantity of employment of
an element in a year (EMPi), measured by number of people employed, and tangible added value of
the same element and year (ADDi), measured by real monetary values, of a sample of n elements;
then position of an element (xi,yi) in this 2D-plotted model is calculated as follows:
20 ~
High added valueLow employment
High added valueHigh employment
Low added valueLow employment
Low added valueHigh employment
Facultat d’Economia i EmpresaMàster d’Història EconòmicaTreball Final de Màster
OVERCOMING THE CRISIS: ADDED VALUE EMPLOYMENT IN LARGEST SPANISH FIRMS
JESPERGON
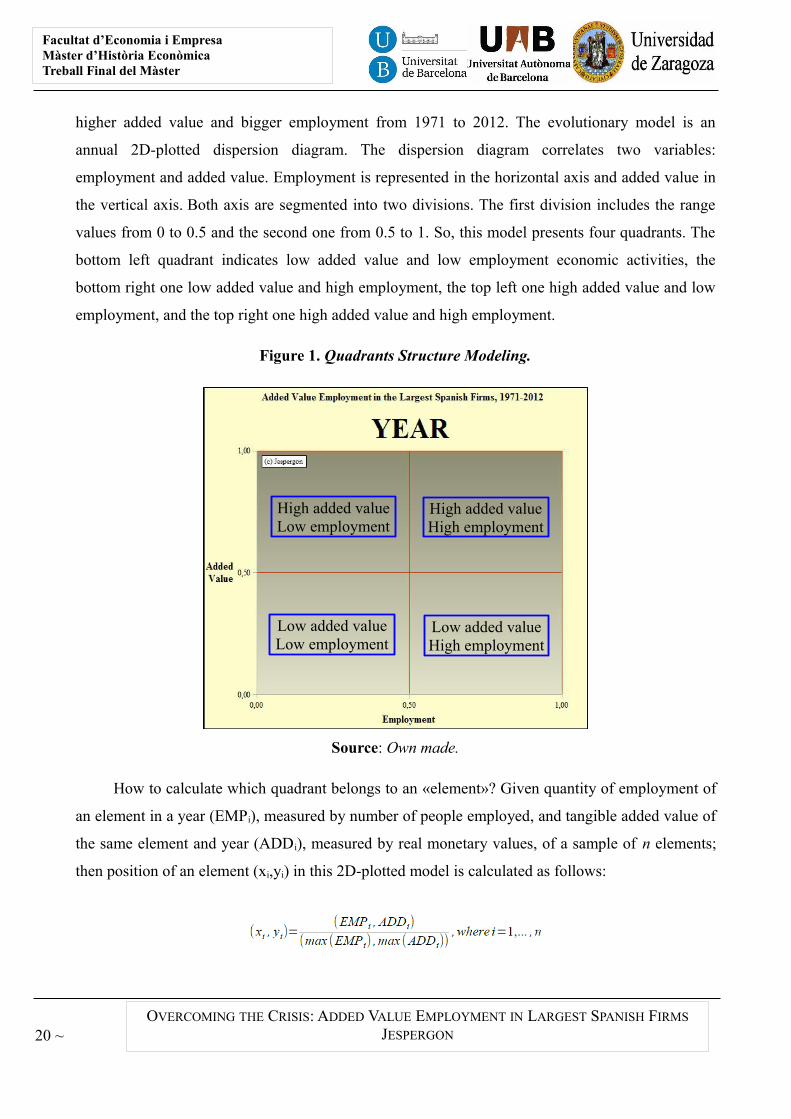
If an element is maximum employment and added value of the sample ( EMP i=max(EMPi)
and ADDi=max(ADDi) ), then position element is the upper right corner ( (xi,yi)=(1,1) ). If an
element is half of maximum employment and added value of the sample ( EMP i=max(EMPi)/2 and
ADDi=max(ADDi)/2 ), then position element is just located in the center ( (xi,yi)=(0.5,0.5) ). If an
element is maximum employment of the sample ( EMP i=max(EMPi) ) and half of maximum added
value of the sample ( ADDi=max(ADDi)/2 ), then position element is located in the right center
( (xi,yi)=(1,0.5) ). All possible combinations may be as following:
When an element equals zero added value ( yi=0 ) may means that, or there are no available
values for this element, or monetary added value is negative ( ADDi<0 ). An element can not be
zero employment quantity. I use the term «element» because the sample may be, or by economic
activities, or by economic sectors, or by individual firms, or by any other classification.
Figure 2. Quadrants Positioning Elements.
Source: Own made.
~ 21 ~
xi=1yi=1
xi=0.5)yi=0.5)
xiϵ(0,0.5]yiϵ[0,0.5]
xiϵ(0,0.5]yiϵ(0.5,1]
xiϵ(0.5,1]yiϵ(0.5,1]
xiϵ(0.5,1]yiϵ[0,0.5]
xi=1yi=0.5
Facultat d’Economia i EmpresaMàster d’Història EconòmicaTreball Final del Màster
OVERCOMING THE CRISIS: ADDED VALUE EMPLOYMENT IN LARGEST SPANISH FIRMS
JESPERGON
The elements of the dispersion diagram are plotted by bubbles. The bubble size is in
correspondence with the variable: operational revenue of the Income Statement or Profit and Loss
Account of an element, measured in nominal monetary value. In conclusion, the evolutionary model
is the result of the consecutive display of the annual dispersion diagrams from 1971 to 2012.
Importantly, both axis —employment and added value— are expressed in relative values to
the maximum value of the sample. So, inflation modifies bubble size because it is the only variable
expressed in absolute values —nominal operational revenue—. Like evolutionary model is plotted
by independent years inflation is not considered. Inflation modifies results when the whole period is
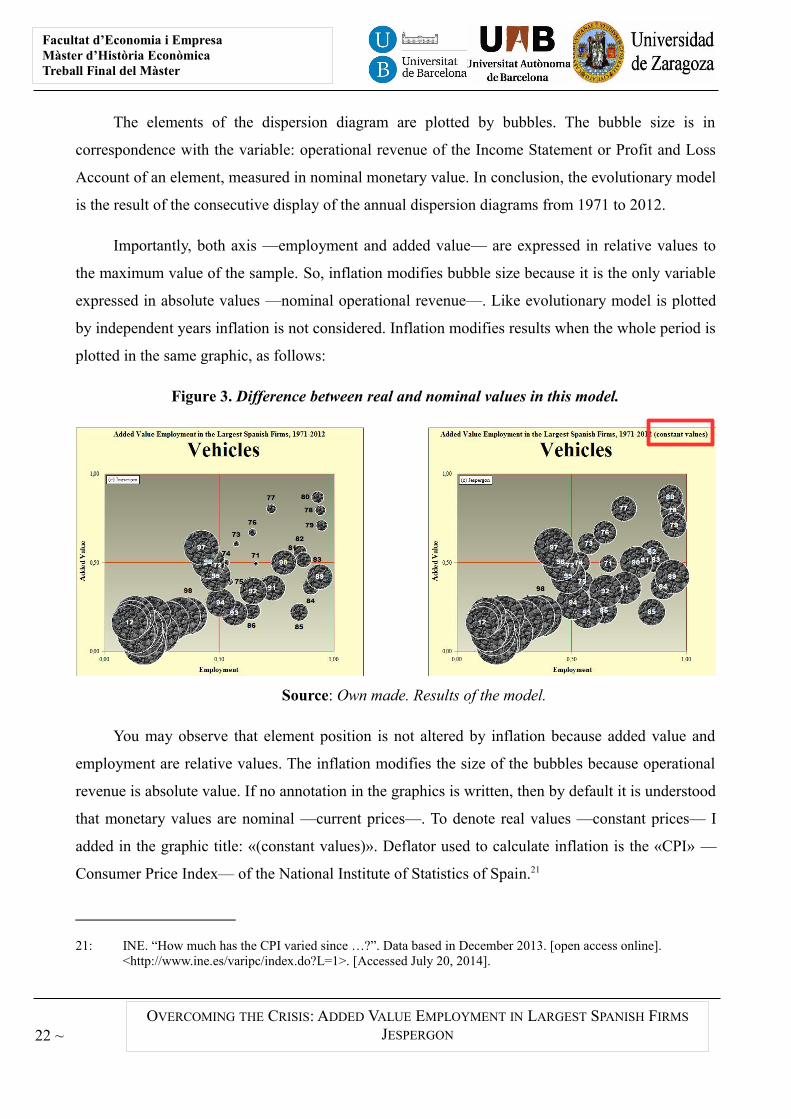
plotted in the same graphic, as follows:
Figure 3. Difference between real and nominal values in this model.
Source: Own made. Results of the model.
You may observe that element position is not altered by inflation because added value and
employment are relative values. The inflation modifies the size of the bubbles because operational
revenue is absolute value. If no annotation in the graphics is written, then by default it is understood
that monetary values are nominal —current prices—. To denote real values —constant prices— I
added in the graphic title: «(constant values)». Deflator used to calculate inflation is the «CPI» —
Consumer Price Index— of the National Institute of Statistics of Spain.21
21: INE. “How much has the CPI varied since …?”. Data based in December 2013. [open access online]. <http://www.ine.es/varipc/index.do?L=1>. [Accessed July 20, 2014].
22 ~
Facultat d’Economia i EmpresaMàster d’Història EconòmicaTreball Final de Màster
OVERCOMING THE CRISIS: ADDED VALUE EMPLOYMENT IN LARGEST SPANISH FIRMS
JESPERGON
2.3. Discussion
I have found eight points that they may be in discussion in this study.
a) According to Jorgenson, Ho & Stiroh,22 modeling of production processes must be respected
as much as possible the reality. Added value concept is an artificial construct considering only
primary inputs and, therefore, does not correspond to the output produced by a particular
industry. So, gross output is the correct way to reproduce the reality, and the added value so
does not.
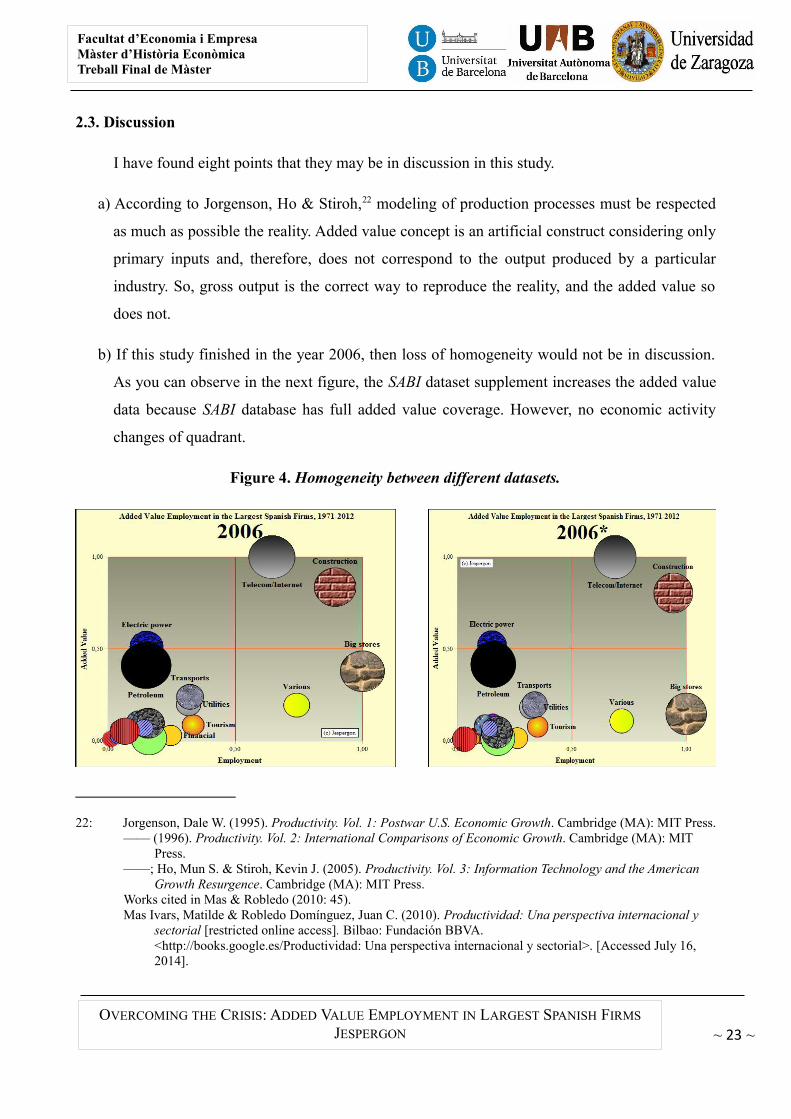
b) If this study finished in the year 2006, then loss of homogeneity would not be in discussion.
As you can observe in the next figure, the SABI dataset supplement increases the added value
data because SABI database has full added value coverage. However, no economic activity
changes of quadrant.
Figure 4. Homogeneity between different datasets.
22: Jorgenson, Dale W. (1995). Productivity. Vol. 1: Postwar U.S. Economic Growth. Cambridge (MA): MIT Press.—— (1996). Productivity. Vol. 2: International Comparisons of Economic Growth. Cambridge (MA): MIT
Press.——; Ho, Mun S. & Stiroh, Kevin J. (2005). Productivity. Vol. 3: Information Technology and the American
Growth Resurgence. Cambridge (MA): MIT Press.Works cited in Mas & Robledo (2010: 45).Mas Ivars, Matilde & Robledo Domínguez, Juan C. (2010). Productividad: Una perspectiva internacional y
sectorial [restricted online access]. Bilbao: Fundación BBVA.<http://books.google.es/Productividad: Una perspectiva internacional y sectorial>. [Accessed July 16, 2014].
~ 23 ~
Facultat d’Economia i EmpresaMàster d’Història EconòmicaTreball Final del Màster
OVERCOMING THE CRISIS: ADDED VALUE EMPLOYMENT IN LARGEST SPANISH FIRMS
JESPERGON
Source: Own made. Results of the model.
The left graphic —2006— shows the results of the top 816 firms by operational revenue of
the mix between Fomento de la producción (2006) and SABI dataset, and 78.1 percentage
points of added value data coverage. The right one —2006*— is the same but without the
supplement of SABI dataset, ergo a sample size of 675 firms with added value data coverage
of 35.3 percentage points. Especially «big stores» is the recipient of SABI supplement as it
increases its value added.
However, in order to maintain a major homogeneity in this study, I did not want to prolong
the time period until 2013, despite the availability of SABI dataset for this year, because I did
not have any available data of the journal Fomento de la producción.
c) I decided to include firms without added value data in my database because the largest
Spanish firms is the study object and originality of this work. If full added value coverage
would has been the strategy, then, as companies were ranked by their operational revenue, this
study would not be about the economic activities of the largest Spanish firms. So, I preferred
to lose accuracy in the added value data with the purpose of maintaining operational revenue
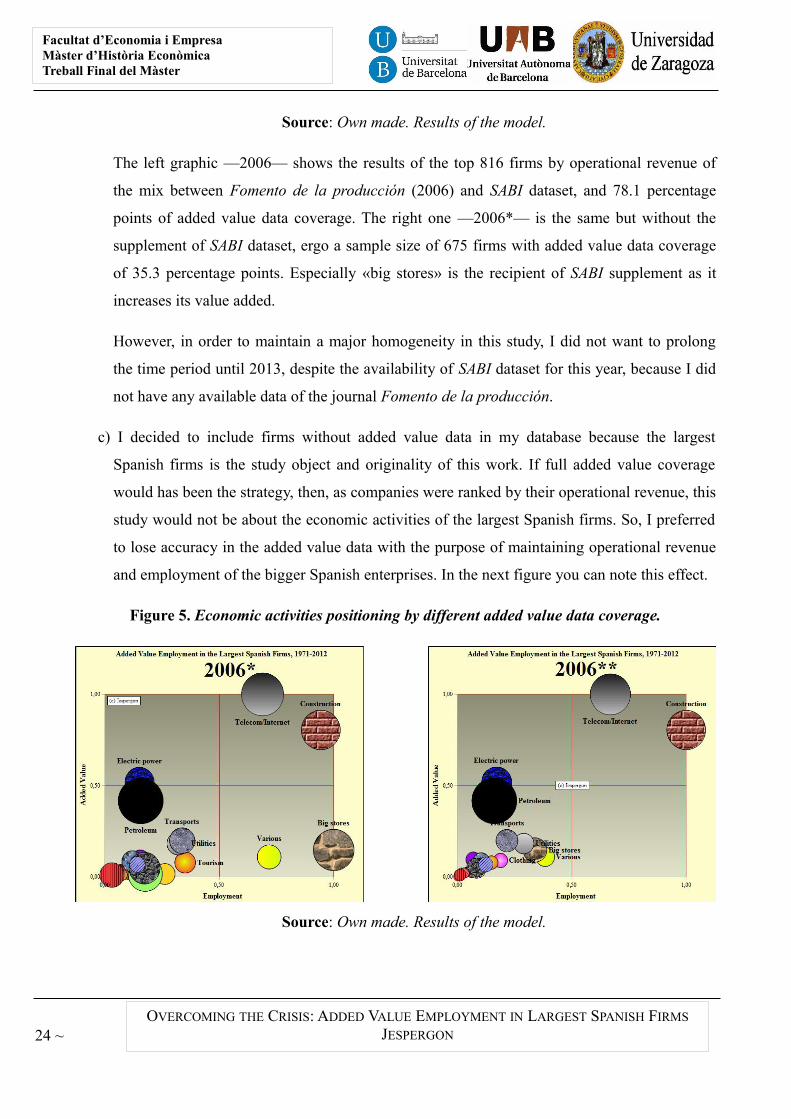
and employment of the bigger Spanish enterprises. In the next figure you can note this effect.
Figure 5. Economic activities positioning by different added value data coverage.
Source: Own made. Results of the model.
24 ~
Facultat d’Economia i EmpresaMàster d’Història EconòmicaTreball Final de Màster
OVERCOMING THE CRISIS: ADDED VALUE EMPLOYMENT IN LARGEST SPANISH FIRMS
JESPERGON
The left graphic —2006*— shows the results of the top 675 firms by operational revenue of
Fomento de la producción (2006) without the supplement of SABI dataset. The right one —
2006**— is the same but with the firms without available added value data removed, ergo a
sample size of 238 firms with full data coverage. Differences are plausible. While
«telecom/Internet», «construction/real-estate», and «electric power» economic activities
maintain their same position in the quadrants; «big stores» and «various» economic activities
have changed of quadrant —from bottom right to bottom left—.
d) The size of the sample, obviously, changes the results. How many companies are included in
the concept «largest Spanish firms»? Top 50, top 500, top 1,000, the first 4,000, or perhaps the
first 8,000 Spanish enterprises. Representative sample size of the largest Spanish firms is
difficult to establish because economic activities positioning in the quadrants change. In the
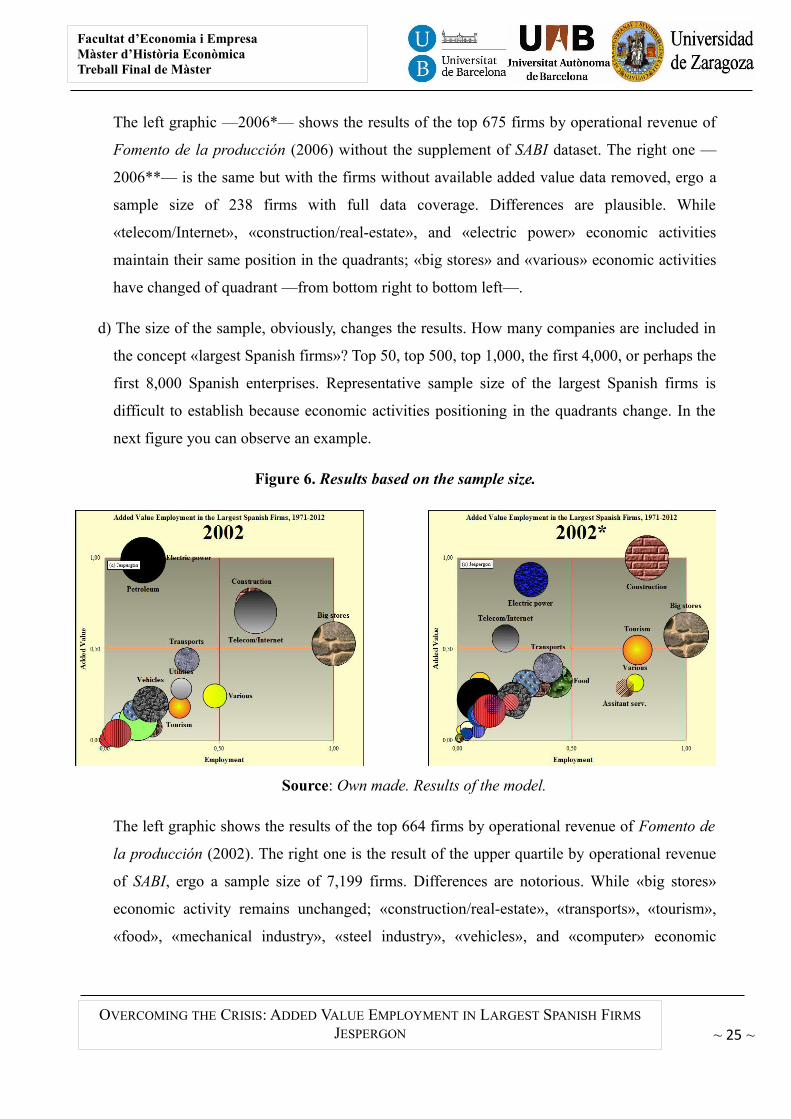
next figure you can observe an example.
Figure 6. Results based on the sample size.
Source: Own made. Results of the model.
The left graphic shows the results of the top 664 firms by operational revenue of Fomento de
la producción (2002). The right one is the result of the upper quartile by operational revenue
of SABI, ergo a sample size of 7,199 firms. Differences are notorious. While «big stores»
economic activity remains unchanged; «construction/real-estate», «transports», «tourism»,
«food», «mechanical industry», «steel industry», «vehicles», and «computer» economic
~ 25 ~
Facultat d’Economia i EmpresaMàster d’Història EconòmicaTreball Final del Màster
OVERCOMING THE CRISIS: ADDED VALUE EMPLOYMENT IN LARGEST SPANISH FIRMS
JESPERGON
activities increase in both employment and added value; «electric power» increases in
employment and decreases in added value; and, «telecom/Internet» and «petroleum» decrease
in both employment and added value.
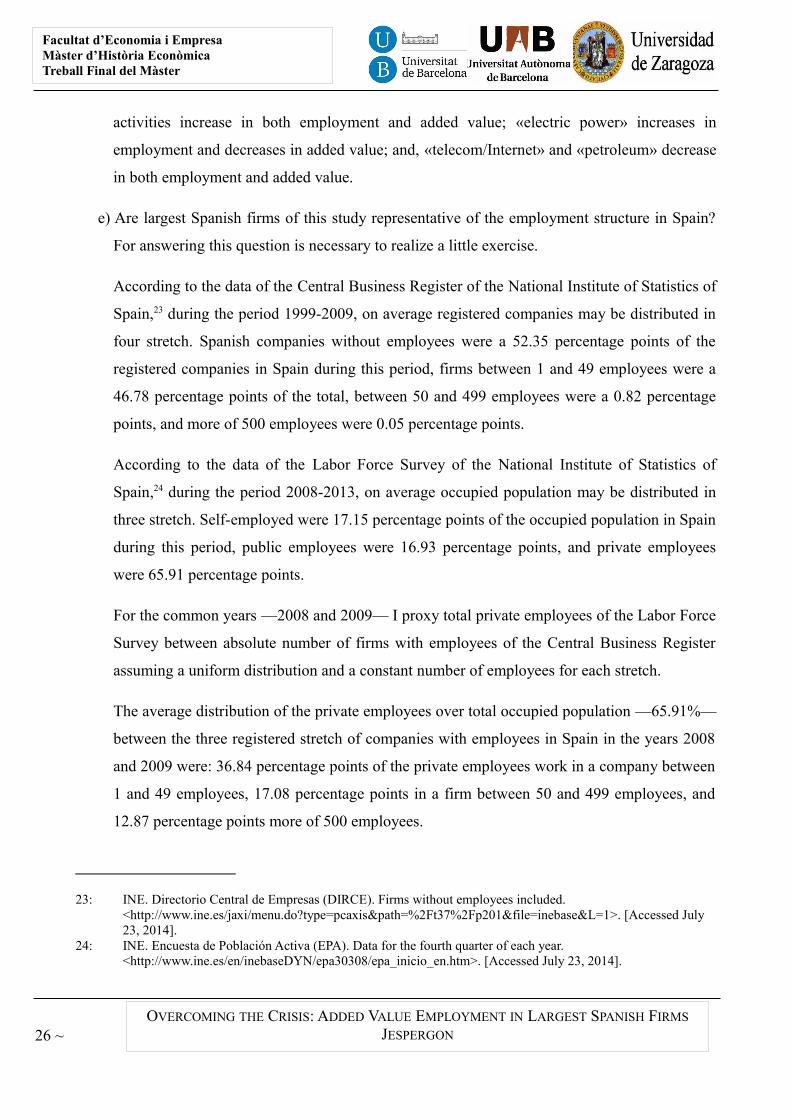
e) Are largest Spanish firms of this study representative of the employment structure in Spain?
For answering this question is necessary to realize a little exercise.
According to the data of the Central Business Register of the National Institute of Statistics of
Spain,23 during the period 1999-2009, on average registered companies may be distributed in
four stretch. Spanish companies without employees were a 52.35 percentage points of the
registered companies in Spain during this period, firms between 1 and 49 employees were a
46.78 percentage points of the total, between 50 and 499 employees were a 0.82 percentage
points, and more of 500 employees were 0.05 percentage points.
According to the data of the Labor Force Survey of the National Institute of Statistics of
Spain,24 during the period 2008-2013, on average occupied population may be distributed in
three stretch. Self-employed were 17.15 percentage points of the occupied population in Spain
during this period, public employees were 16.93 percentage points, and private employees
were 65.91 percentage points.
For the common years —2008 and 2009— I proxy total private employees of the Labor Force
Survey between absolute number of firms with employees of the Central Business Register
assuming a uniform distribution and a constant number of employees for each stretch.
The average distribution of the private employees over total occupied population —65.91%—
between the three registered stretch of companies with employees in Spain in the years 2008
and 2009 were: 36.84 percentage points of the private employees work in a company between
1 and 49 employees, 17.08 percentage points in a firm between 50 and 499 employees, and
12.87 percentage points more of 500 employees.
23: INE. Directorio Central de Empresas (DIRCE). Firms without employees included. <http://www.ine.es/jaxi/menu.do?type=pcaxis&path=%2Ft37%2Fp201&file=inebase&L=1>. [Accessed July 23, 2014].
24: INE. Encuesta de Población Activa (EPA). Data for the fourth quarter of each year. <http://www.ine.es/en/inebaseDYN/epa30308/epa_inicio_en.htm>. [Accessed July 23, 2014].
26 ~
Facultat d’Economia i EmpresaMàster d’Història EconòmicaTreball Final de Màster
OVERCOMING THE CRISIS: ADDED VALUE EMPLOYMENT IN LARGEST SPANISH FIRMS
JESPERGON
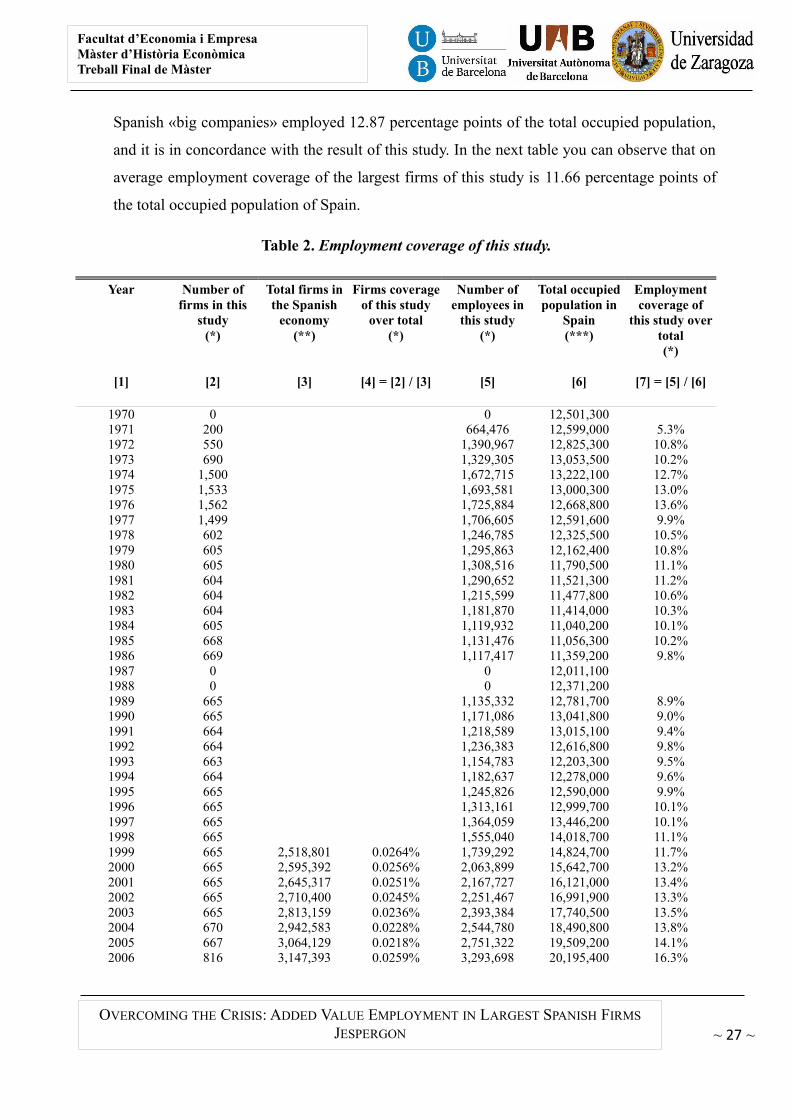
Spanish «big companies» employed 12.87 percentage points of the total occupied population,
and it is in concordance with the result of this study. In the next table you can observe that on
average employment coverage of the largest firms of this study is 11.66 percentage points of
the total occupied population of Spain.
Table 2. Employment coverage of this study.
Year
[1]
Number offirms in this
study(*)
[2]
Total firms inthe Spanish
economy(**)
[3]
Firms coverageof this study
over total(*)
[4] = [2] / [3]
Number ofemployees in
this study(*)
[5]
Total occupiedpopulation in
Spain(***)
[6]
Employmentcoverage of
this study overtotal(*)
[7] = [5] / [6]
1970 0 0 12,501,3001971 200 664,476 12,599,000 5.3%1972 550 1,390,967 12,825,300 10.8%1973 690 1,329,305 13,053,500 10.2%1974 1,500 1,672,715 13,222,100 12.7%1975 1,533 1,693,581 13,000,300 13.0%1976 1,562 1,725,884 12,668,800 13.6%1977 1,499 1,706,605 12,591,600 9.9%1978 602 1,246,785 12,325,500 10.5%1979 605 1,295,863 12,162,400 10.8%1980 605 1,308,516 11,790,500 11.1%1981 604 1,290,652 11,521,300 11.2%1982 604 1,215,599 11,477,800 10.6%1983 604 1,181,870 11,414,000 10.3%1984 605 1,119,932 11,040,200 10.1%1985 668 1,131,476 11,056,300 10.2%1986 669 1,117,417 11,359,200 9.8%1987 0 0 12,011,1001988 0 0 12,371,2001989 665 1,135,332 12,781,700 8.9%1990 665 1,171,086 13,041,800 9.0%1991 664 1,218,589 13,015,100 9.4%1992 664 1,236,383 12,616,800 9.8%1993 663 1,154,783 12,203,300 9.5%1994 664 1,182,637 12,278,000 9.6%1995 665 1,245,826 12,590,000 9.9%1996 665 1,313,161 12,999,700 10.1%1997 665 1,364,059 13,446,200 10.1%1998 665 1,555,040 14,018,700 11.1%1999 665 2,518,801 0.0264% 1,739,292 14,824,700 11.7%2000 665 2,595,392 0.0256% 2,063,899 15,642,700 13.2%2001 665 2,645,317 0.0251% 2,167,727 16,121,000 13.4%2002 665 2,710,400 0.0245% 2,251,467 16,991,900 13.3%2003 665 2,813,159 0.0236% 2,393,384 17,740,500 13.5%2004 670 2,942,583 0.0228% 2,544,780 18,490,800 13.8%2005 667 3,064,129 0.0218% 2,751,322 19,509,200 14.1%2006 816 3,147,393 0.0259% 3,293,698 20,195,400 16.3%
~ 27 ~
Facultat d’Economia i EmpresaMàster d’Història EconòmicaTreball Final del Màster
OVERCOMING THE CRISIS: ADDED VALUE EMPLOYMENT IN LARGEST SPANISH FIRMS
JESPERGON
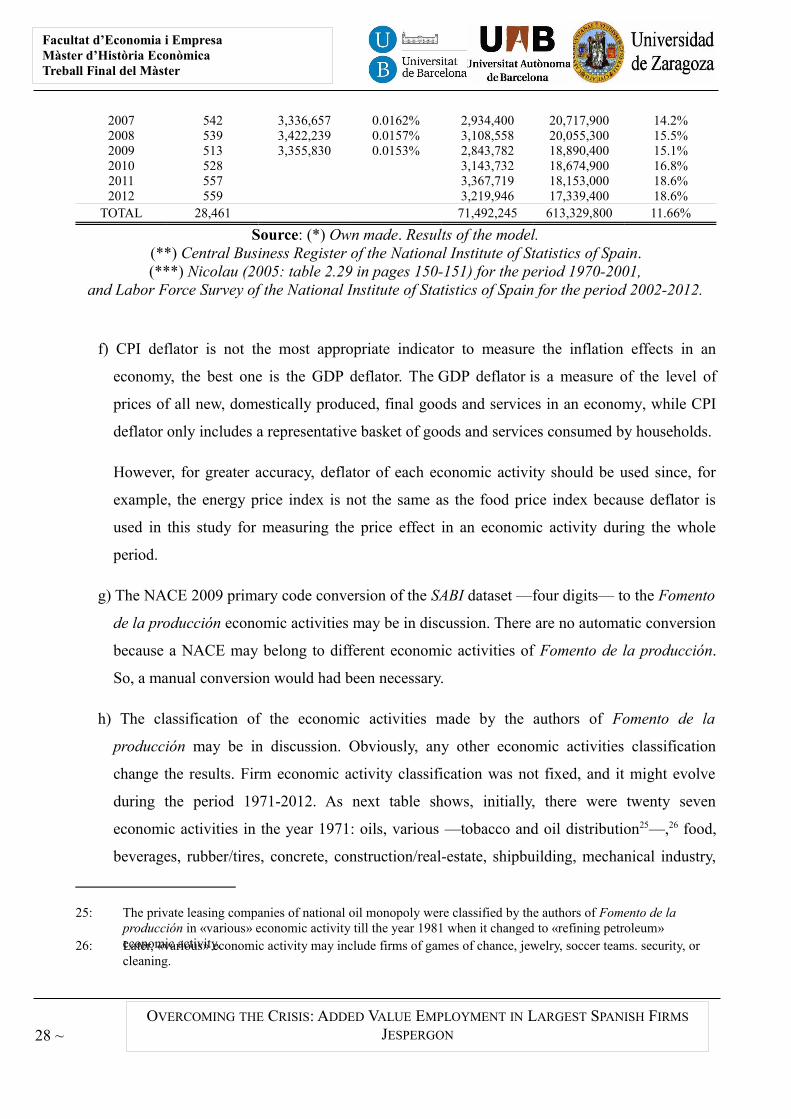
2007 542 3,336,657 0.0162% 2,934,400 20,717,900 14.2%2008 539 3,422,239 0.0157% 3,108,558 20,055,300 15.5%2009 513 3,355,830 0.0153% 2,843,782 18,890,400 15.1%2010 528 3,143,732 18,674,900 16.8%2011 557 3,367,719 18,153,000 18.6%2012 559 3,219,946 17,339,400 18.6%
TOTAL 28,461 71,492,245 613,329,800 11.66%
Source: (*) Own made. Results of the model.(**) Central Business Register of the National Institute of Statistics of Spain.(***) Nicolau (2005: table 2.29 in pages 150-151) for the period 1970-2001,
and Labor Force Survey of the National Institute of Statistics of Spain for the period 2002-2012.
f) CPI deflator is not the most appropriate indicator to measure the inflation effects in an
economy, the best one is the GDP deflator. The GDP deflator is a measure of the level of
prices of all new, domestically produced, final goods and services in an economy, while CPI
deflator only includes a representative basket of goods and services consumed by households.
However, for greater accuracy, deflator of each economic activity should be used since, for
example, the energy price index is not the same as the food price index because deflator is
used in this study for measuring the price effect in an economic activity during the whole
period.
g) The NACE 2009 primary code conversion of the SABI dataset —four digits— to the Fomento
de la producción economic activities may be in discussion. There are no automatic conversion
because a NACE may belong to different economic activities of Fomento de la producción.
So, a manual conversion would had been necessary.
h) The classification of the economic activities made by the authors of Fomento de la
producción may be in discussion. Obviously, any other economic activities classification
change the results. Firm economic activity classification was not fixed, and it might evolve
during the period 1971-2012. As next table shows, initially, there were twenty seven
economic activities in the year 1971: oils, various —tobacco and oil distribution25—,26 food,
beverages, rubber/tires, concrete, construction/real-estate, shipbuilding, mechanical industry,
25: The private leasing companies of national oil monopoly were classified by the authors of Fomento de la producción in «various» economic activity till the year 1981 when it changed to «refining petroleum» economic activity. 26: Later, «various» economic activity may include firms of games of chance, jewelry, soccer teams. security, or cleaning.
28 ~
Facultat d’Economia i EmpresaMàster d’Història EconòmicaTreball Final de Màster
OVERCOMING THE CRISIS: ADDED VALUE EMPLOYMENT IN LARGEST SPANISH FIRMS
JESPERGON
electronic, electric power, pharma industries, electrical equipment, construction material, non-
metallic metallurgical, mining, paper, leather, plastics, milk products, chemical, refining
petroleum,27 utilities, steel industry, textile, vehicles, and glass.
In the year 1972 ten new economic activities were incorporated: commercial, wearing
apparel, publishers,28 big stores, tourism/hospitality, wood and furniture,29 insurance,
transports, holding,30 and advertising agencies.31
In the year 1982 five new economic activities appeared: commercial pharma, appliances,
computer, engineering, and perfumes/detergents; and one more the next year: commercial
vehicles.
The year 1999 authors of Fomento de la producción unified «electric power», «petroleum»,
and some firms of the «utilities» economic activities in the «energy» economic activity. I did
not follow this change because I wished to follow separately the path of this economic
activities. This year appeared a new economic activity: «telecommunications». It was the
aggregation of some firms of «utilities» and «electronic» economic activities. I followed it but
with changes. I aggregated only two electronic firms to «telecom» economic activity, the rest
of electronic firms did not be aggregated and remained in their economic activity.
Telecommunications firms removed from «utilities» economic activity caused that «utilities»
lost its previous role, for this reason I have jointly represented both economic activities in the
results.
27: The «refining petroleum» economic activity was renamed to «petroleum» in the year 1983.
28: The «publishers» economic activity was renamed to «publishing and arts graphics» in the year 1973, and «mass media» in the year 1999.
29: The «wood and furniture» economic activity was renamed to «wood and cork» in the year 1999.30: The «holding» economic activity appeared only two consecutive years in the journal Fomento de la
producción. The first year —1972— this economic activity included the National Institute of Industry —INI—, a Spanish state-owned financing and industrial holding company. However, it did not include the broad range of public national enterprises. The second year —1973— «holding» economic activity included the INI, Rumasa and Ensidesa.
31: The «advertising agencies» economic activity appeared in the year 1972, and it did not come back to appear tillthe year 1982.
~ 29 ~
Facultat d’Economia i EmpresaMàster d’Història EconòmicaTreball Final del Màster
OVERCOMING THE CRISIS: ADDED VALUE EMPLOYMENT IN LARGEST SPANISH FIRMS
JESPERGON
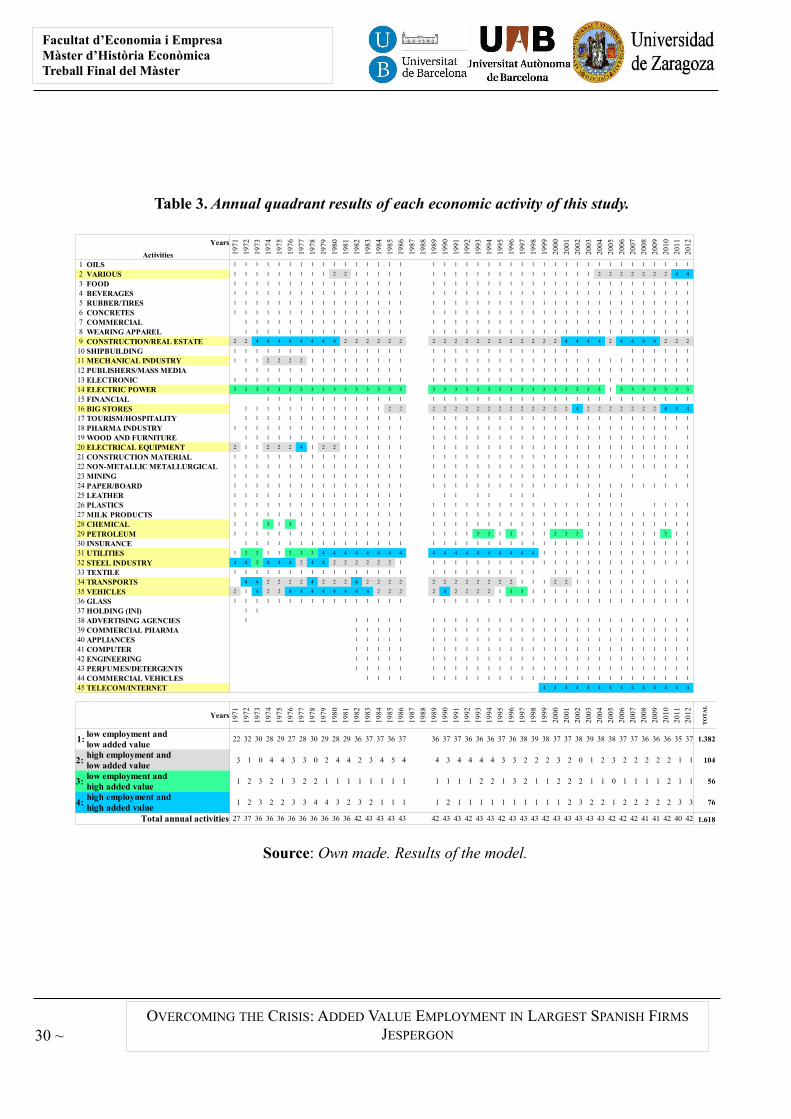
Table 3. Annual quadrant results of each economic activity of this study.
Source: Own made. Results of the model.
30 ~
Years19
71
1972
1973
1974
1975
1976
1977
1978
1979
1980
1981
1982
1983
1984
1985
1986
1987
1988
1989
1990
1991
1992
1993
1994
1995
1996
1997
1998
1999
2000
2001
2002
2003
2004
2005
2006
2007
2008
2009
2010
2011
2012
Activities1 OILS 1 1 1 1 1 1 1 1 1 1 1 1 1 1 1 1 1 1 1 1 1 1 1 1 1 1 1 1 1 1 1 1 1 1 1 1 1 1 1 1
2 VARIOUS 1 1 1 1 1 1 1 1 1 2 2 1 1 1 1 1 1 1 1 1 1 1 1 1 1 1 1 1 1 1 1 2 2 2 2 2 2 2 4 4
3 FOOD 1 1 1 1 1 1 1 1 1 1 1 1 1 1 1 1 1 1 1 1 1 1 1 1 1 1 1 1 1 1 1 1 1 1 1 1 1 1 1 1
4 BEVERAGES 1 1 1 1 1 1 1 1 1 1 1 1 1 1 1 1 1 1 1 1 1 1 1 1 1 1 1 1 1 1 1 1 1 1 1 1 1 1 1 1
5 RUBBER/TIRES 1 1 1 1 1 1 1 1 1 1 1 1 1 1 1 1 1 1 1 1 1 1 1 1 1 1 1 1 1 1 1 1 1 1 1 1 1 1 1 1
6 CONCRETES 1 1 1 1 1 1 1 1 1 1 1 1 1 1 1 1 1 1 1 1 1 1 1 1 1 1 1 1 1 1 1 1 1 1 1 1 1 1 1 1
7 COMMERCIAL 1 1 1 1 1 1 1 1 1 1 1 1 1 1 1 1 1 1 1 1 1 1 1 1 1 1 1 1 1 1 1 1 1 1 1 1 1 1 1
8 WEARING APPAREL 1 1 1 1 1 1 1 1 1 1 1 1 1 1 1 1 1 1 1 1 1 1 1 1 1 1 1 1 1 1 1 1 1 1 1 1 1 1 1
9 CONSTRUCTION/REAL ESTATE 2 2 4 4 4 4 4 4 4 4 2 2 2 2 2 2 2 2 2 2 2 2 2 2 2 2 2 2 4 4 4 4 2 4 4 4 4 2 2 2
10 SHIPBUILDING 1 1 1 1 1 1 1 1 1 1 1 1 1 1 1 1 1 1 1 1 1 1 1 1 1 1 1 1 1 1 1 1 1 1 1 1
11 MECHANICAL INDUSTRY 1 1 1 2 2 2 2 1 1 1 1 1 1 1 1 1 1 1 1 1 1 1 1 1 1 1 1 1 1 1 1 1 1 1 1 1 1 1 1 1
12 PUBLISHERS/MASS MEDIA 1 1 1 1 1 1 1 1 1 1 1 1 1 1 1 1 1 1 1 1 1 1 1 1 1 1 1 1 1 1 1 1 1 1 1 1 1 1 1
13 ELECTRONIC 1 1 1 1 1 1 1 1 1 1 1 1 1 1 1 1 1 1 1 1 1 1 1 1 1 1 1 1 1 1 1 1 1 1 1 1 1 1 1 1
14 ELECTRIC POWER 3 3 3 3 3 3 3 3 3 3 3 3 3 3 3 3 3 3 3 3 3 3 3 3 3 3 3 3 3 3 3 3 1 3 3 3 3 3 3 3
15 FINANCIAL 1 1 1 1 1 1 1 1 1 1 1 1 1 1 1 1 1 1 1 1 1 1 1 1 1 1 1 1 1 1 1 1 1 1 1 1 1
16 BIG STORES 1 1 1 1 1 1 1 1 1 1 1 1 1 2 2 2 2 2 2 2 2 2 2 2 2 2 2 2 4 2 2 2 2 2 2 2 4 4 4
17 TOURISM/HOSPITALITY 1 1 1 1 1 1 1 1 1 1 1 1 1 1 1 1 1 1 1 1 1 1 1 1 1 1 1 1 1 1 1 1 1 1 1 1 1 1 1
18 PHARMA INDUSTRY 1 1 1 1 1 1 1 1 1 1 1 1 1 1 1 1 1 1 1 1 1 1 1 1 1 1 1 1 1 1 1 1 1 1 1 1 1 1 1 1
19 WOOD AND FURNITURE 1 1 1 1 1 1 1 1 1 1 1 1 1 1 1 1 1 1 1 1 1 1 1 1 1 1 1 1 1 1 1 1 1 1 1 1 1 1
20 ELECTRICAL EQUIPMENT 2 1 1 2 2 2 4 1 2 2 1 1 1 1 1 1 1 1 1 1 1 1 1 1 1 1 1 1 1 1 1 1 1 1 1 1 1 1 1 1
21 CONSTRUCTION MATERIAL 1 1 1 1 1 1 1 1 1 1 1 1 1 1 1 1 1 1 1 1 1 1 1 1 1 1 1 1 1 1 1 1 1 1 1 1 1 1 1 1
22 NON-METALLIC METALLURGICAL 1 1 1 1 1 1 1 1 1 1 1 1 1 1 1 1 1 1 1 1 1 1 1 1 1 1 1 1 1 1 1 1 1 1 1 1 1 1 1 1
23 MINING 1 1 1 1 1 1 1 1 1 1 1 1 1 1 1 1 1 1 1 1 1 1 1 1 1 1 1 1 1 1 1 1 1 1 1
24 PAPER/BOARD 1 1 1 1 1 1 1 1 1 1 1 1 1 1 1 1 1 1 1 1 1 1 1 1 1 1 1 1 1 1 1 1 1 1 1 1 1 1 1 1
25 LEATHER 1 1 1 1 1 1 1 1 1 1 1 1 1 1 1 1 1 1 1 1 1 1 1 1 1 1 1
26 PLASTICS 1 1 1 1 1 1 1 1 1 1 1 1 1 1 1 1 1 1 1 1 1 1 1 1 1 1 1 1 1 1 1 1 1 1 1 1 1 1
27 MILK PRODUCTS 1 1 1 1 1 1 1 1 1 1 1 1 1 1 1 1 1 1 1 1 1 1 1 1 1 1 1 1 1 1 1 1 1 1 1 1 1 1 1 1
28 CHEMICAL 1 1 1 3 1 3 1 1 1 1 1 1 1 1 1 1 1 1 1 1 1 1 1 1 1 1 1 1 1 1 1 1 1 1 1 1 1 1 1 1
29 PETROLEUM 1 1 1 1 1 1 1 1 1 1 1 1 1 1 1 1 1 1 1 1 3 3 1 3 1 1 1 3 3 3 1 1 1 1 1 1 1 3 1 1
30 INSURANCE 1 1 1 1 1 1 1 1 1 1 1 1 1 1 1 1 1 1 1 1 1 1 1 1 1 1 1 1 1 1 1 1 1 1 1 1 1 1 1
31 UTILITIES 1 3 3 1 1 3 3 3 4 4 4 4 4 4 4 4 4 4 4 4 4 4 4 4 4 4 1 1 1 1 1 1 1 1 1 1 1 1 1 1
32 STEEL INDUSTRY 4 4 3 4 4 4 2 4 4 2 2 2 2 2 2 1 1 1 1 1 1 1 1 1 1 1 1 1 1 1 1 1 1 1 1 1 1 1 1 1
33 TEXTILE 1 1 1 1 1 1 1 1 1 1 1 1 1 1 1 1 1 1 1 1 1 1 1 1 1 1 1 1 1 1 1 1 1 1 1
34 TRANSPORTS 4 4 2 2 2 2 4 2 2 2 4 2 2 2 2 2 2 2 2 2 2 2 2 1 1 1 2 2 1 1 1 1 1 1 1 1 1 1 1
35 VEHICLES 2 1 4 2 2 4 4 4 4 4 4 4 4 2 2 2 2 4 2 2 2 2 1 3 3 1 1 1 1 1 1 1 1 1 1 1 1 1 1 1
36 GLASS 1 1 1 1 1 1 1 1 1 1 1 1 1 1 1 1 1 1 1 1 1 1 1 1 1 1 1 1 1 1 1 1 1 1 1 1 1 1 1 1
37 HOLDING (INI) 1 1
38 ADVERTISING AGENCIES 1 1 1 1 1 1 1 1 1 1 1 1 1 1 1 1 1 1 1 1 1 1 1 1 1 1 1 1 1 1
39 COMMERCIAL PHARMA 1 1 1 1 1 1 1 1 1 1 1 1 1 1 1 1 1 1 1 1 1 1 1 1 1 1 1 1 1
40 APPLIANCES 1 1 1 1 1 1 1 1 1 1 1 1 1 1 1 1 1 1 1 1 1 1 1 1 1 1 1 1 1
41 COMPUTER 1 1 1 1 1 1 1 1 1 1 1 1 1 1 1 1 1 1 1 1 1 1 1 1 1 1 1 1 1
42 ENGINEERING 1 1 1 1 1 1 1 1 1 1 1 1 1 1 1 1 1 1 1 1 1 1 1 1 1 1 1 1 1
43 PERFUMES/DETERGENTS 1 1 1 1 1 1 1 1 1 1 1 1 1 1 1 1 1 1 1 1 1 1 1 1 1 1 1 1 1
44 COMMERCIAL VEHICLES 1 1 1 1 1 1 1 1 1 1 1 1 1 1 1 1 1 1 1 1 1 1 1 1 1 1 1 1
45 TELECOM/INTERNET 4 4 4 4 4 4 4 4 4 4 4 4 4 4
Years
1971
1972
1973
1974
1975
1976
1977
1978
1979
1980
1981
1982
1983
1984
1985
1986
1987
1988
1989
1990
1991
1992
1993
1994
1995
1996
1997
1998
1999
2000
2001
2002
2003
2004
2005
2006
2007
2008
2009
2010
2011
2012
TO
TA
L
1: 22 32 30 28 29 27 28 30 29 28 29 36 37 37 36 37 36 37 37 36 36 36 37 36 38 39 38 37 37 38 39 38 38 37 37 36 36 36 35 37 1.382
2: 3 1 0 4 4 3 3 0 2 4 4 2 3 4 5 4 4 3 4 4 4 4 3 3 2 2 2 3 2 0 1 2 3 2 2 2 2 2 1 1 104
3: 1 2 3 2 1 3 2 2 1 1 1 1 1 1 1 1 1 1 1 1 2 2 1 3 2 1 1 2 2 2 1 1 0 1 1 1 1 2 1 1 56
4: 1 2 3 2 2 3 3 4 4 3 2 3 2 1 1 1 1 2 1 1 1 1 1 1 1 1 1 1 2 3 2 2 1 2 2 2 2 2 3 3 76
Total annual activities 27 37 36 36 36 36 36 36 36 36 36 42 43 43 43 43 42 43 43 42 43 43 42 43 43 43 42 43 43 43 43 43 42 42 42 41 41 42 40 42 1.618
low employment and low added valuehigh employment and low added valuelow employment and high added valuehigh employment and high added value
Facultat d’Economia i EmpresaMàster d’Història EconòmicaTreball Final de Màster
OVERCOMING THE CRISIS: ADDED VALUE EMPLOYMENT IN LARGEST SPANISH FIRMS
JESPERGON
3. Results
The expected results should must show a continuous path in correspondence with an
evolutionary model in constant adaption to its environment in the absence of radical changes —
technological revolutions—, incremental changes —products, services, processes, market or
organizational innovations—, or internal or external perturbations —political, economic,
sociological, cultural, artificial or natural—.
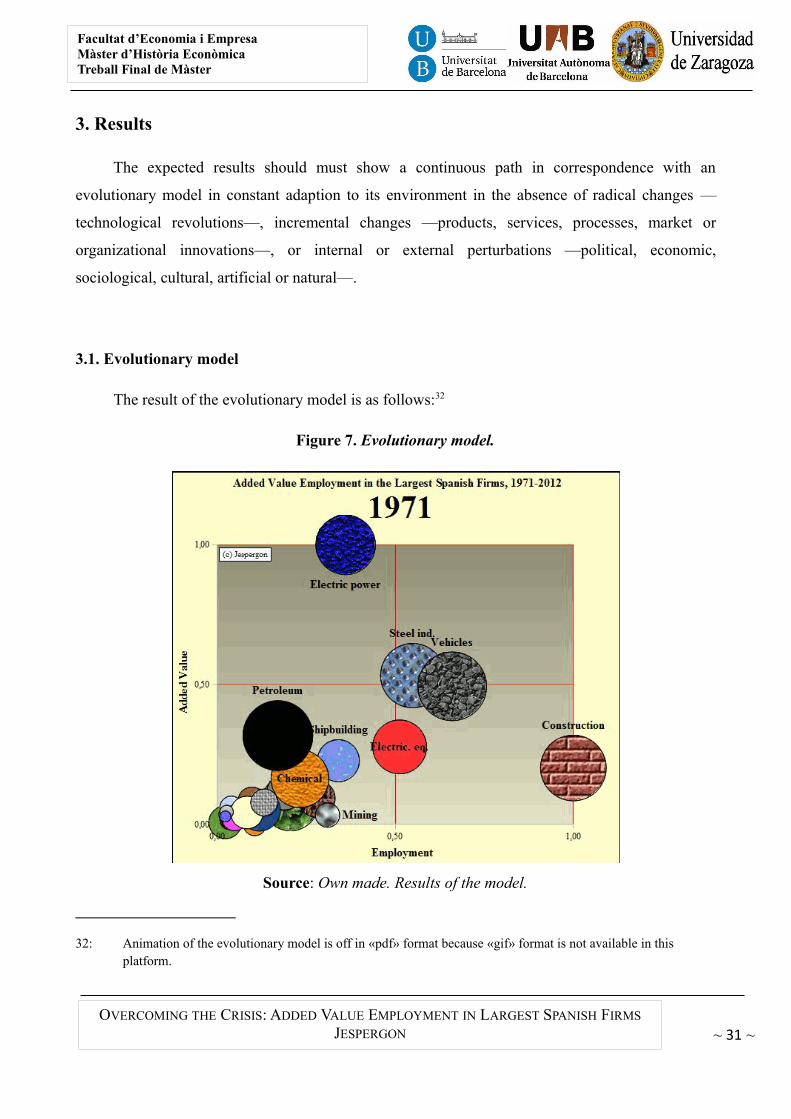
3.1. Evolutionary model
The result of the evolutionary model is as follows:32
Figure 7. Evolutionary model.
Source: Own made. Results of the model.
32: Animation of the evolutionary model is off in «pdf» format because «gif» format is not available in this platform.
~ 31 ~
Facultat d’Economia i EmpresaMàster d’Història EconòmicaTreball Final del Màster
OVERCOMING THE CRISIS: ADDED VALUE EMPLOYMENT IN LARGEST SPANISH FIRMS
JESPERGON
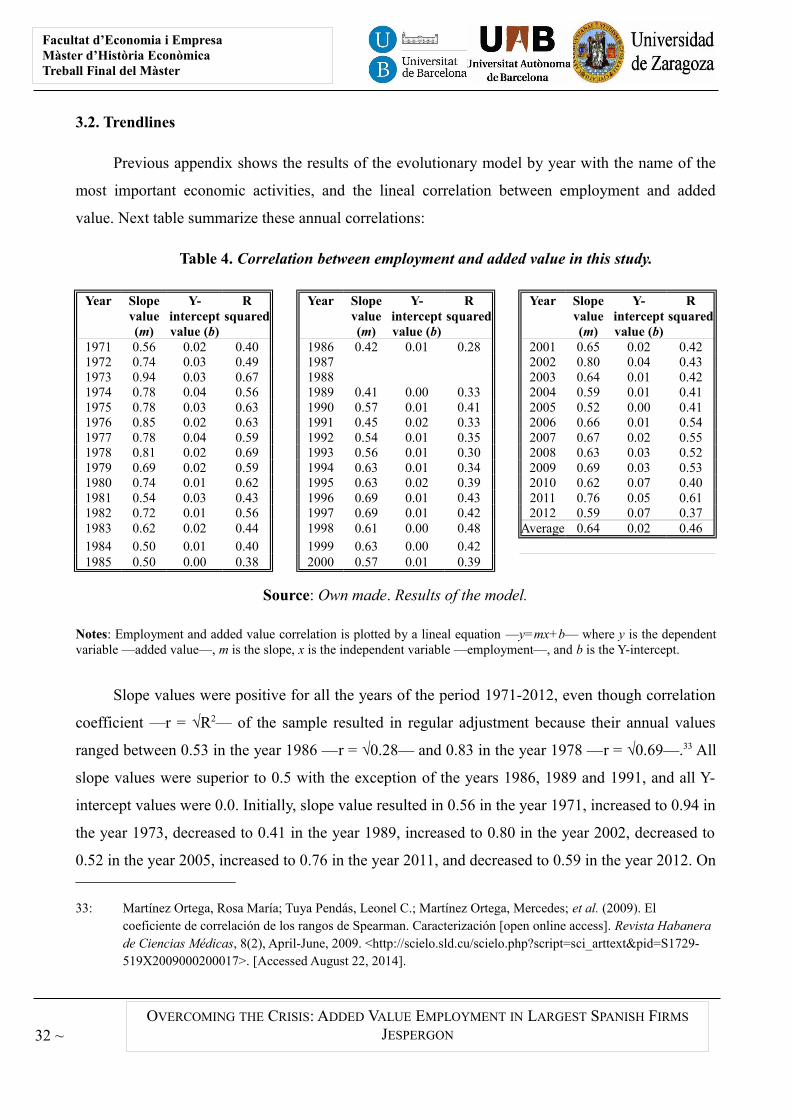
3.2. Trendlines
Previous appendix shows the results of the evolutionary model by year with the name of the
most important economic activities, and the lineal correlation between employment and added
value. Next table summarize these annual correlations:
Table 4. Correlation between employment and added value in this study.
Year Slopevalue(m)
Y-interceptvalue (b)
Rsquared
Year Slopevalue(m)
Y-interceptvalue (b)
Rsquared
Year Slopevalue(m)
Y-interceptvalue (b)
Rsquared
1971 0.56 0.02 0.40 1986 0.42 0.01 0.28 2001 0.65 0.02 0.421972 0.74 0.03 0.49 1987 2002 0.80 0.04 0.431973 0.94 0.03 0.67 1988 2003 0.64 0.01 0.421974 0.78 0.04 0.56 1989 0.41 0.00 0.33 2004 0.59 0.01 0.411975 0.78 0.03 0.63 1990 0.57 0.01 0.41 2005 0.52 0.00 0.411976 0.85 0.02 0.63 1991 0.45 0.02 0.33 2006 0.66 0.01 0.541977 0.78 0.04 0.59 1992 0.54 0.01 0.35 2007 0.67 0.02 0.551978 0.81 0.02 0.69 1993 0.56 0.01 0.30 2008 0.63 0.03 0.521979 0.69 0.02 0.59 1994 0.63 0.01 0.34 2009 0.69 0.03 0.531980 0.74 0.01 0.62 1995 0.63 0.02 0.39 2010 0.62 0.07 0.401981 0.54 0.03 0.43 1996 0.69 0.01 0.43 2011 0.76 0.05 0.611982 0.72 0.01 0.56 1997 0.69 0.01 0.42 2012 0.59 0.07 0.371983 0.62 0.02 0.44 1998 0.61 0.00 0.48 Average 0.64 0.02 0.461984 0.50 0.01 0.40 1999 0.63 0.00 0.421985 0.50 0.00 0.38 2000 0.57 0.01 0.39
Source: Own made. Results of the model.
Notes: Employment and added value correlation is plotted by a lineal equation —y=mx+b— where y is the dependentvariable —added value—, m is the slope, x is the independent variable —employment—, and b is the Y-intercept.
Slope values were positive for all the years of the period 1971-2012, even though correlation
coefficient —r = √R2— of the sample resulted in regular adjustment because their annual values
ranged between 0.53 in the year 1986 —r = √0.28— and 0.83 in the year 1978 —r = √0.69—.33 All
slope values were superior to 0.5 with the exception of the years 1986, 1989 and 1991, and all Y-
intercept values were 0.0. Initially, slope value resulted in 0.56 in the year 1971, increased to 0.94 in
the year 1973, decreased to 0.41 in the year 1989, increased to 0.80 in the year 2002, decreased to
0.52 in the year 2005, increased to 0.76 in the year 2011, and decreased to 0.59 in the year 2012. On
33: Martínez Ortega, Rosa María; Tuya Pendás, Leonel C.; Martínez Ortega, Mercedes; et al. (2009). El coeficiente de correlación de los rangos de Spearman. Caracterización [open online access]. Revista Habanera de Ciencias Médicas, 8(2), April-June, 2009. <http://scielo.sld.cu/scielo.php?script=sci_arttext&pid=S1729-519X2009000200017>. [Accessed August 22, 2014].
32 ~
Facultat d’Economia i EmpresaMàster d’Història EconòmicaTreball Final de Màster
OVERCOMING THE CRISIS: ADDED VALUE EMPLOYMENT IN LARGEST SPANISH FIRMS
JESPERGON
average, correlation between employment and added value resulted in 0.02 Y-intercept and 0.64
slope values, and 0.68 correlation coefficient —R squared value of 0.46—.
Appendix shows that, of a total of forty five activities, thirty two are in the bottom left
quadrant —low employment and low added value—: oils, food, beverages, rubber/tires, concretes,
commercial, wearing apparel, shipbuilding, publishers/mass media, electronic, financial,
tourism/hospitality, pharma industry, wood and furniture, construction material, non-metallic
metallurgical, mining, paper/board, leather, plastics, milk products, insurance, textile, glass,
holding, advertising agencies, commercial pharma, appliances, computer, engineering,
perfumes/detergents, and commercial vehicles; and, thirteen sectors are outside this quadrant.
Now is time to analyze these outsiders.
3.3. The ««microresults»» of the outsiders
For all graphs in this section, the left graphics show the results of a single economic activity
throughout the whole period in the evolutionary model in constant values, and the right graphics
show the annual quadrant positioning of employment and value added of this economic activity
with their respective lineal trends. If employment and added value positioning data are lower than
0.5, then economic activity is inside the bottom left quadrant —low employment and low added
value—. If employment positioning data is higher than 0.5 and added value positioning data is
lower than 0.5, then economic activity is inside the bottom right quadrant —high employment and
low added value—. If employment positioning data is lower than 0.5 and added value positioning
data is higher than 0.5, then economic activity is inside the top left quadrant —low employment and
low added value—. If employment and added value positioning data are higher than 0.5, then
economic activity is inside the top right quadrant —high employment and high added value—.
Remember that all graphs do not show values for 1987 and 1988 due to the absence of added
value data in the original data source.
The disaggregation of the economic activities outside the bottom left quadrant are as follow:
~ 33 ~
Facultat d’Economia i EmpresaMàster d’Història EconòmicaTreball Final del Màster
OVERCOMING THE CRISIS: ADDED VALUE EMPLOYMENT IN LARGEST SPANISH FIRMS
JESPERGON
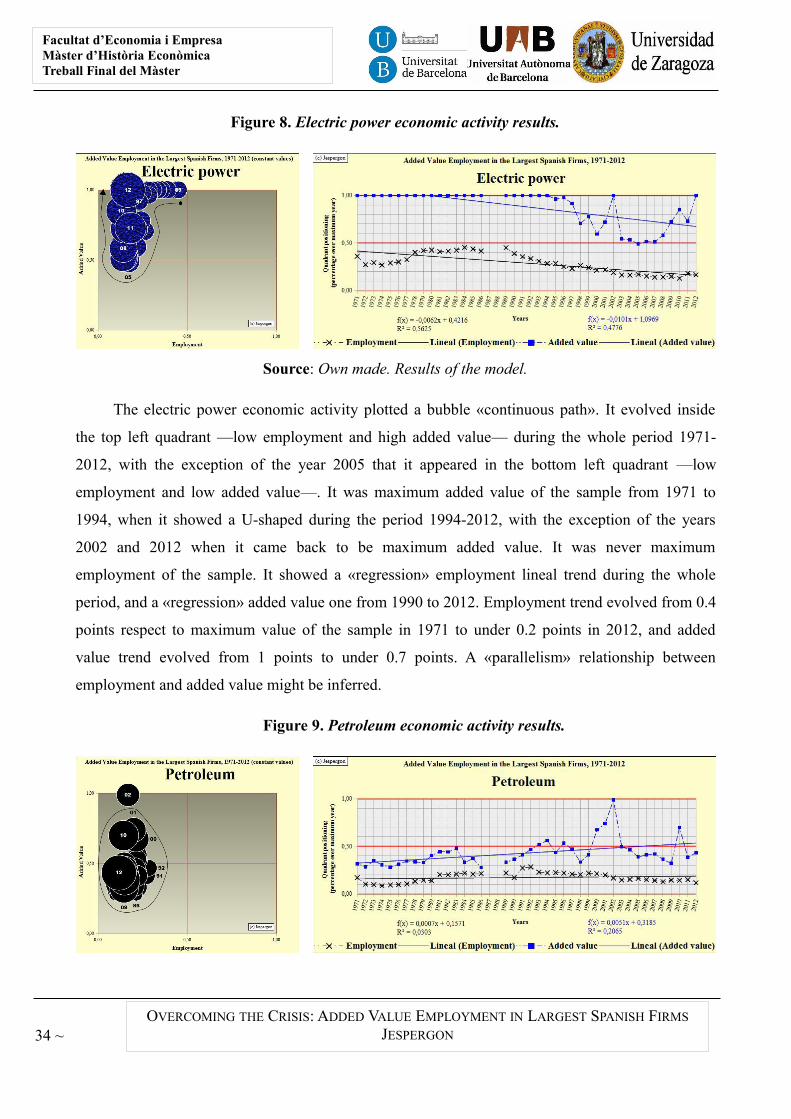
Figure 8. Electric power economic activity results.
Source: Own made. Results of the model.
The electric power economic activity plotted a bubble «continuous path». It evolved inside
the top left quadrant —low employment and high added value— during the whole period 1971-
2012, with the exception of the year 2005 that it appeared in the bottom left quadrant —low
employment and low added value—. It was maximum added value of the sample from 1971 to
1994, when it showed a U-shaped during the period 1994-2012, with the exception of the years
2002 and 2012 when it came back to be maximum added value. It was never maximum
employment of the sample. It showed a «regression» employment lineal trend during the whole
period, and a «regression» added value one from 1990 to 2012. Employment trend evolved from 0.4
points respect to maximum value of the sample in 1971 to under 0.2 points in 2012, and added
value trend evolved from 1 points to under 0.7 points. A «parallelism» relationship between
employment and added value might be inferred.
Figure 9. Petroleum economic activity results.
34 ~
Facultat d’Economia i EmpresaMàster d’Història EconòmicaTreball Final de Màster
OVERCOMING THE CRISIS: ADDED VALUE EMPLOYMENT IN LARGEST SPANISH FIRMS
JESPERGON
Source: Own made. Results of the model.
The petroleum economic activity plotted a bubble «cumulus» with a positive bubble
«mutation» in the year 2002. It evolved inside the bottom left quadrant —low employment and low
added value— during the whole period 1971-2012, with the exception of the years 1993, 1994,
1996, 2000-2002, and 2010 that they appeared in the top left quadrant —low employment and high
added value—. It was never maximum added value and employment of the sample. It showed a
«constant» employment lineal trend during the whole period with a value near to 0.2 points, and a
«progress» added value one. Added value trend evolved from above 0.3 points in 1971 to above 0.5
points in 2012. Two fast up and down «mutations» need to be mentioned. The first one from 1998
to 2003 when it got its maximum added value scored in the year 2002, and the second one from
2008 to 2011. A «divergence» relationship between employment and added value might be inferred.
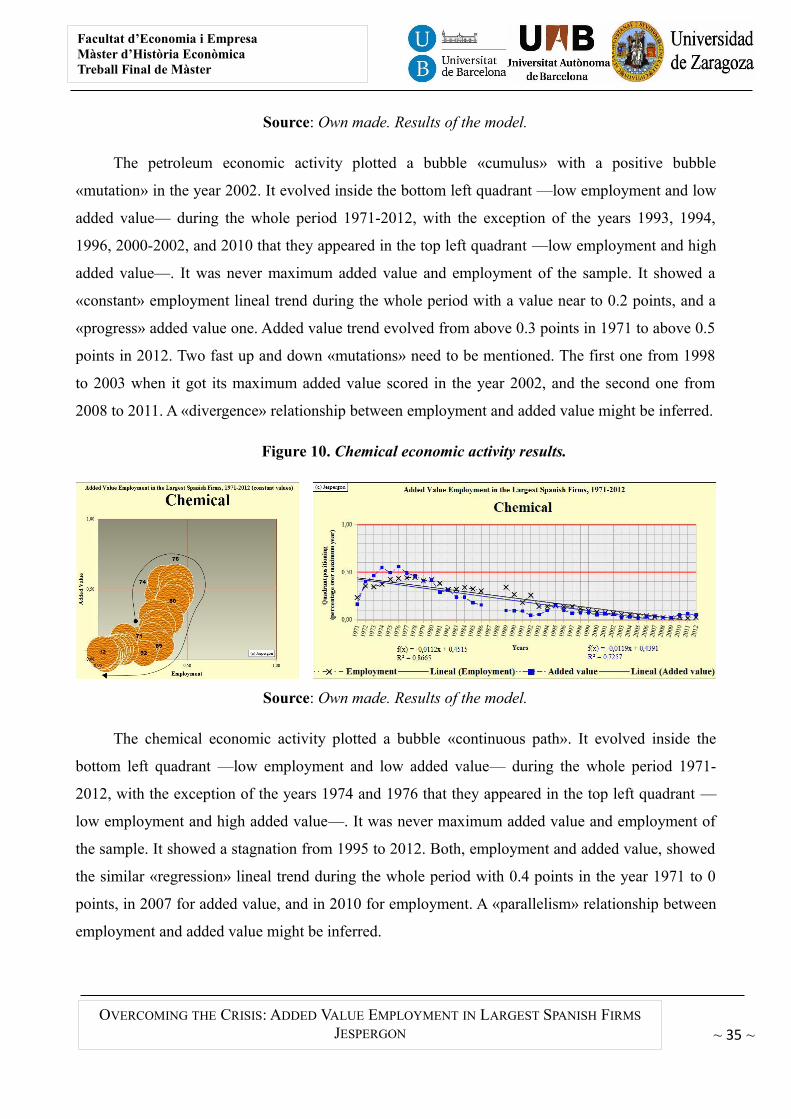
Figure 10. Chemical economic activity results.
Source: Own made. Results of the model.
The chemical economic activity plotted a bubble «continuous path». It evolved inside the
bottom left quadrant —low employment and low added value— during the whole period 1971-
2012, with the exception of the years 1974 and 1976 that they appeared in the top left quadrant —
low employment and high added value—. It was never maximum added value and employment of
the sample. It showed a stagnation from 1995 to 2012. Both, employment and added value, showed
the similar «regression» lineal trend during the whole period with 0.4 points in the year 1971 to 0
points, in 2007 for added value, and in 2010 for employment. A «parallelism» relationship between
employment and added value might be inferred.
~ 35 ~
Facultat d’Economia i EmpresaMàster d’Història EconòmicaTreball Final del Màster
OVERCOMING THE CRISIS: ADDED VALUE EMPLOYMENT IN LARGEST SPANISH FIRMS
JESPERGON
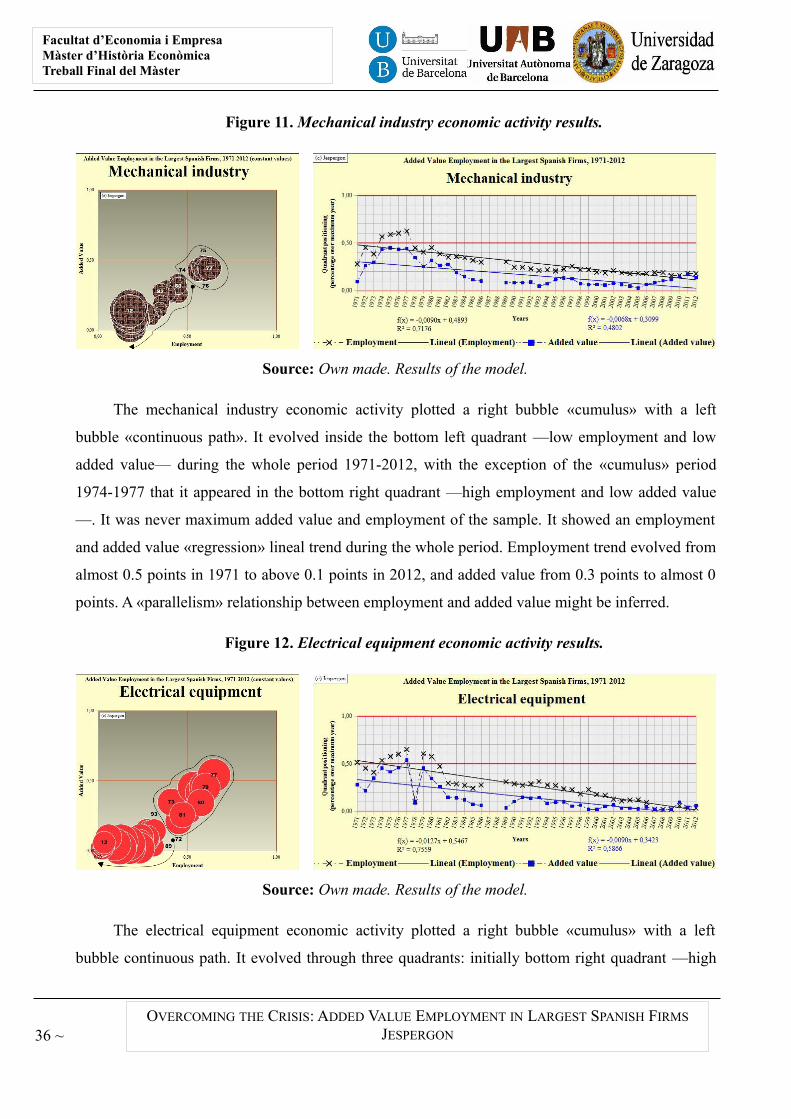
Figure 11. Mechanical industry economic activity results.
Source: Own made. Results of the model.
The mechanical industry economic activity plotted a right bubble «cumulus» with a left
bubble «continuous path». It evolved inside the bottom left quadrant —low employment and low
added value— during the whole period 1971-2012, with the exception of the «cumulus» period
1974-1977 that it appeared in the bottom right quadrant —high employment and low added value
—. It was never maximum added value and employment of the sample. It showed an employment
and added value «regression» lineal trend during the whole period. Employment trend evolved from
almost 0.5 points in 1971 to above 0.1 points in 2012, and added value from 0.3 points to almost 0
points. A «parallelism» relationship between employment and added value might be inferred.
Figure 12. Electrical equipment economic activity results.
Source: Own made. Results of the model.
The electrical equipment economic activity plotted a right bubble «cumulus» with a left
bubble continuous path. It evolved through three quadrants: initially bottom right quadrant —high
36 ~
Facultat d’Economia i EmpresaMàster d’Història EconòmicaTreball Final de Màster
OVERCOMING THE CRISIS: ADDED VALUE EMPLOYMENT IN LARGEST SPANISH FIRMS
JESPERGON
employment and low added value— in the year 1971, after bottom left one —low employment and
low added value— till 1974, again bottom right one till 1976, after top right one —high
employment and high added value— in 1977, again bottom left one in 1978, again bottom right one
till 1980, and finally again bottom left one till 2012. It was never maximum added value and
employment of the sample. It showed an employment and added value «regression» lineal trend
during the whole period with a negative «mutation» in the year 1978. Employment trend evolved
from above 0.50 points in 1971 to almost 0 points in 2012, and added value trend from above 0.3
points to 0 points. A «parallelism» relationship between employment and added value might be
inferred.
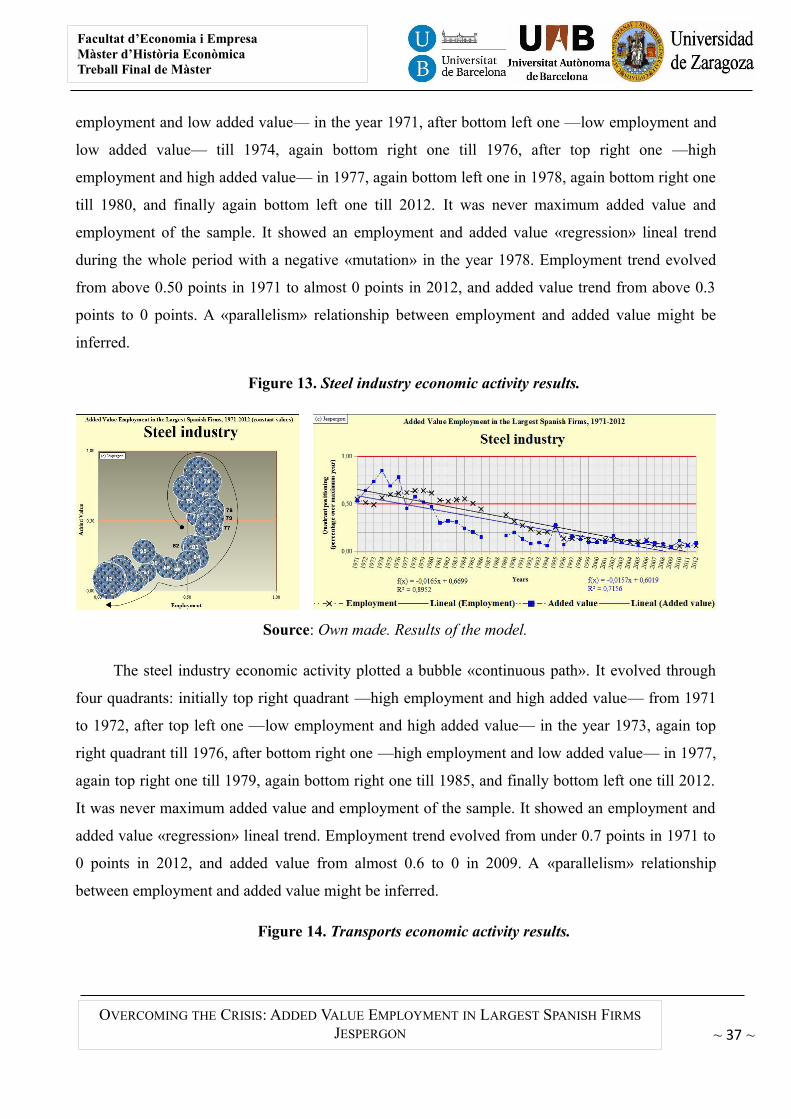
Figure 13. Steel industry economic activity results.
Source: Own made. Results of the model.
The steel industry economic activity plotted a bubble «continuous path». It evolved through
four quadrants: initially top right quadrant —high employment and high added value— from 1971
to 1972, after top left one —low employment and high added value— in the year 1973, again top
right quadrant till 1976, after bottom right one —high employment and low added value— in 1977,
again top right one till 1979, again bottom right one till 1985, and finally bottom left one till 2012.
It was never maximum added value and employment of the sample. It showed an employment and
added value «regression» lineal trend. Employment trend evolved from under 0.7 points in 1971 to
0 points in 2012, and added value from almost 0.6 to 0 in 2009. A «parallelism» relationship
between employment and added value might be inferred.
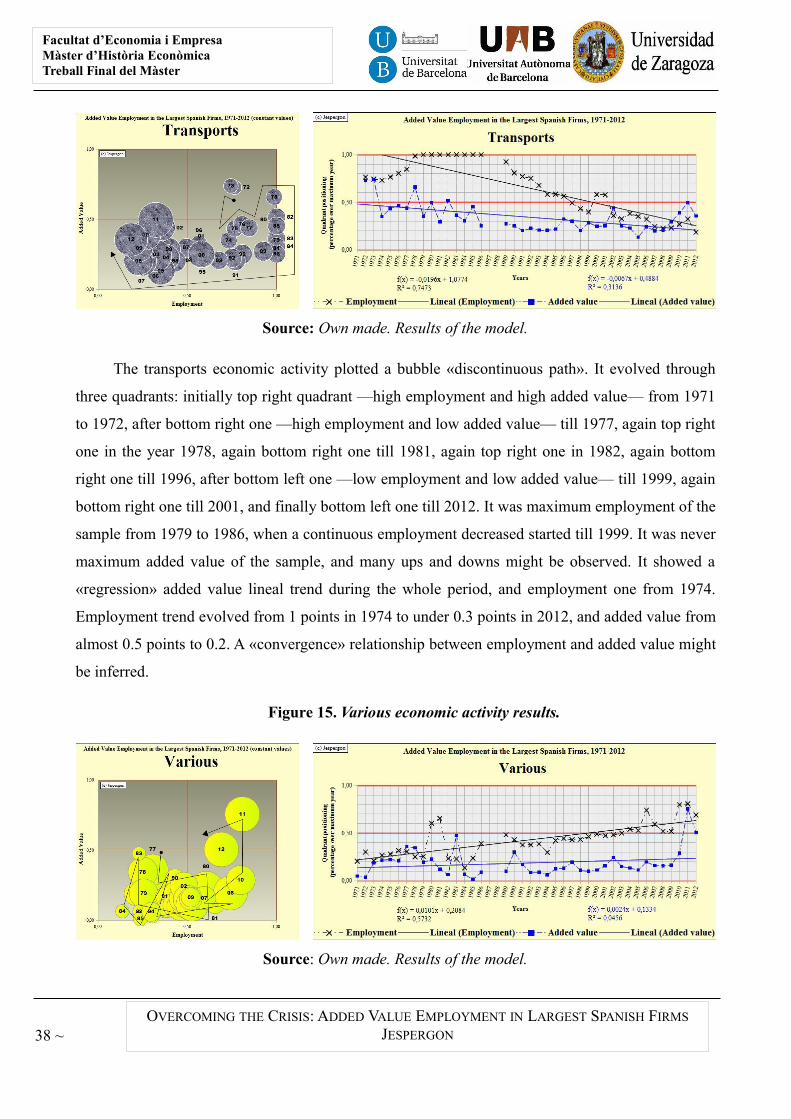
Figure 14. Transports economic activity results.
~ 37 ~
Facultat d’Economia i EmpresaMàster d’Història EconòmicaTreball Final del Màster
OVERCOMING THE CRISIS: ADDED VALUE EMPLOYMENT IN LARGEST SPANISH FIRMS
JESPERGON
Source: Own made. Results of the model.
The transports economic activity plotted a bubble «discontinuous path». It evolved through
three quadrants: initially top right quadrant —high employment and high added value— from 1971
to 1972, after bottom right one —high employment and low added value— till 1977, again top right
one in the year 1978, again bottom right one till 1981, again top right one in 1982, again bottom
right one till 1996, after bottom left one —low employment and low added value— till 1999, again
bottom right one till 2001, and finally bottom left one till 2012. It was maximum employment of the
sample from 1979 to 1986, when a continuous employment decreased started till 1999. It was never
maximum added value of the sample, and many ups and downs might be observed. It showed a
«regression» added value lineal trend during the whole period, and employment one from 1974.
Employment trend evolved from 1 points in 1974 to under 0.3 points in 2012, and added value from
almost 0.5 points to 0.2. A «convergence» relationship between employment and added value might
be inferred.
Figure 15. Various economic activity results.
Source: Own made. Results of the model.
38 ~
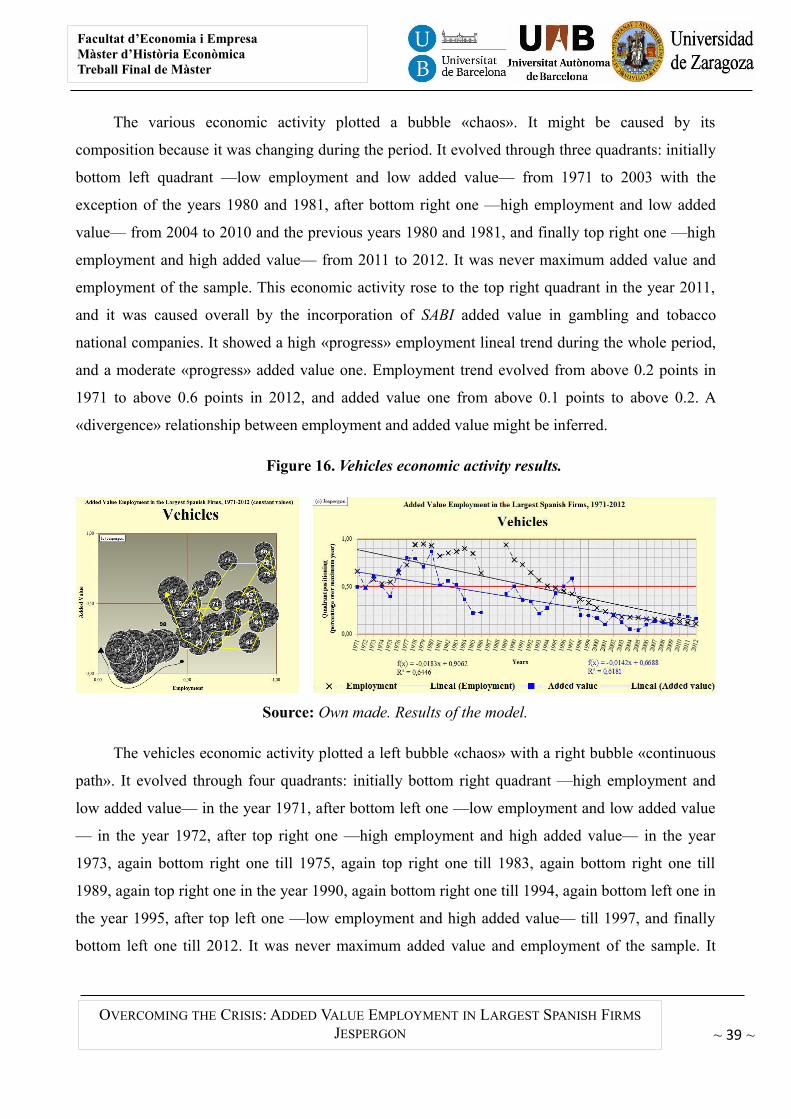
Facultat d’Economia i EmpresaMàster d’Història EconòmicaTreball Final de Màster
OVERCOMING THE CRISIS: ADDED VALUE EMPLOYMENT IN LARGEST SPANISH FIRMS
JESPERGON
The various economic activity plotted a bubble «chaos». It might be caused by its
composition because it was changing during the period. It evolved through three quadrants: initially
bottom left quadrant —low employment and low added value— from 1971 to 2003 with the
exception of the years 1980 and 1981, after bottom right one —high employment and low added
value— from 2004 to 2010 and the previous years 1980 and 1981, and finally top right one —high
employment and high added value— from 2011 to 2012. It was never maximum added value and
employment of the sample. This economic activity rose to the top right quadrant in the year 2011,
and it was caused overall by the incorporation of SABI added value in gambling and tobacco
national companies. It showed a high «progress» employment lineal trend during the whole period,
and a moderate «progress» added value one. Employment trend evolved from above 0.2 points in
1971 to above 0.6 points in 2012, and added value one from above 0.1 points to above 0.2. A
«divergence» relationship between employment and added value might be inferred.
Figure 16. Vehicles economic activity results.
Source: Own made. Results of the model.
The vehicles economic activity plotted a left bubble «chaos» with a right bubble «continuous
path». It evolved through four quadrants: initially bottom right quadrant —high employment and
low added value— in the year 1971, after bottom left one —low employment and low added value
— in the year 1972, after top right one —high employment and high added value— in the year
1973, again bottom right one till 1975, again top right one till 1983, again bottom right one till
1989, again top right one in the year 1990, again bottom right one till 1994, again bottom left one in
the year 1995, after top left one —low employment and high added value— till 1997, and finally
bottom left one till 2012. It was never maximum added value and employment of the sample. It
~ 39 ~
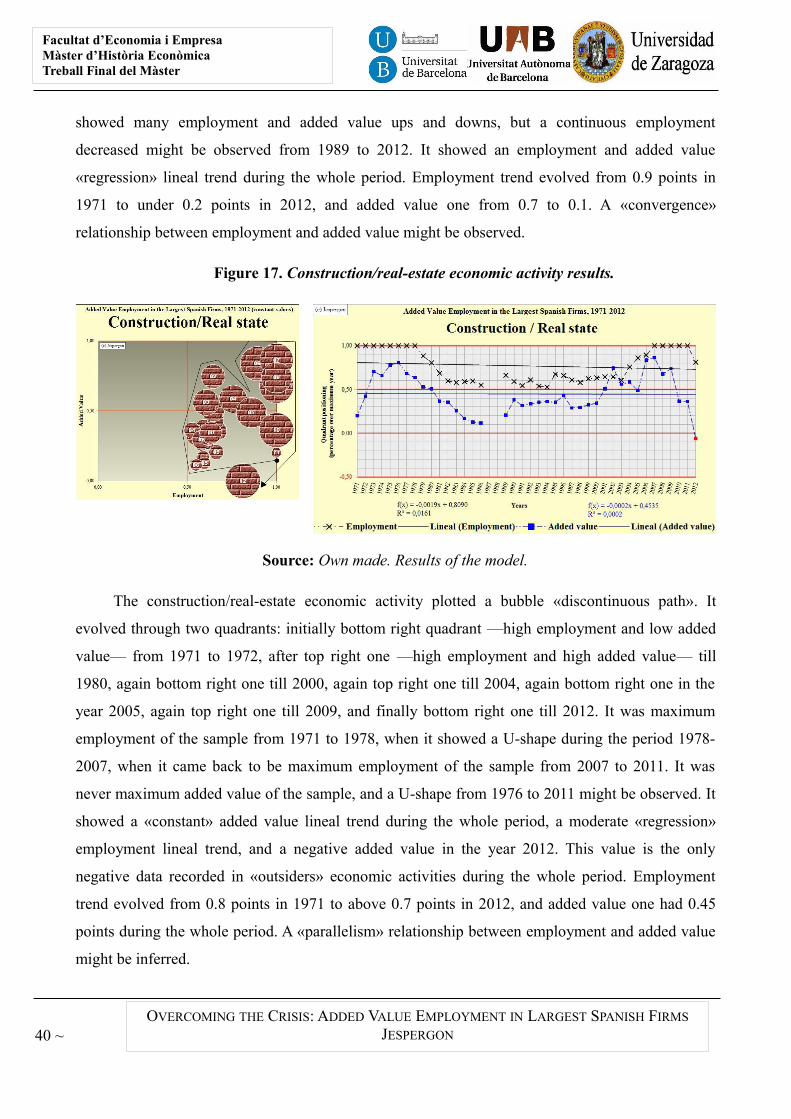
Facultat d’Economia i EmpresaMàster d’Història EconòmicaTreball Final del Màster
OVERCOMING THE CRISIS: ADDED VALUE EMPLOYMENT IN LARGEST SPANISH FIRMS
JESPERGON
showed many employment and added value ups and downs, but a continuous employment
decreased might be observed from 1989 to 2012. It showed an employment and added value
«regression» lineal trend during the whole period. Employment trend evolved from 0.9 points in
1971 to under 0.2 points in 2012, and added value one from 0.7 to 0.1. A «convergence»
relationship between employment and added value might be observed.
Figure 17. Construction/real-estate economic activity results.
Source: Own made. Results of the model.
The construction/real-estate economic activity plotted a bubble «discontinuous path». It
evolved through two quadrants: initially bottom right quadrant —high employment and low added
value— from 1971 to 1972, after top right one —high employment and high added value— till
1980, again bottom right one till 2000, again top right one till 2004, again bottom right one in the
year 2005, again top right one till 2009, and finally bottom right one till 2012. It was maximum
employment of the sample from 1971 to 1978, when it showed a U-shape during the period 1978-
2007, when it came back to be maximum employment of the sample from 2007 to 2011. It was
never maximum added value of the sample, and a U-shape from 1976 to 2011 might be observed. It
showed a «constant» added value lineal trend during the whole period, a moderate «regression»
employment lineal trend, and a negative added value in the year 2012. This value is the only
negative data recorded in «outsiders» economic activities during the whole period. Employment
trend evolved from 0.8 points in 1971 to above 0.7 points in 2012, and added value one had 0.45
points during the whole period. A «parallelism» relationship between employment and added value
might be inferred.
40 ~
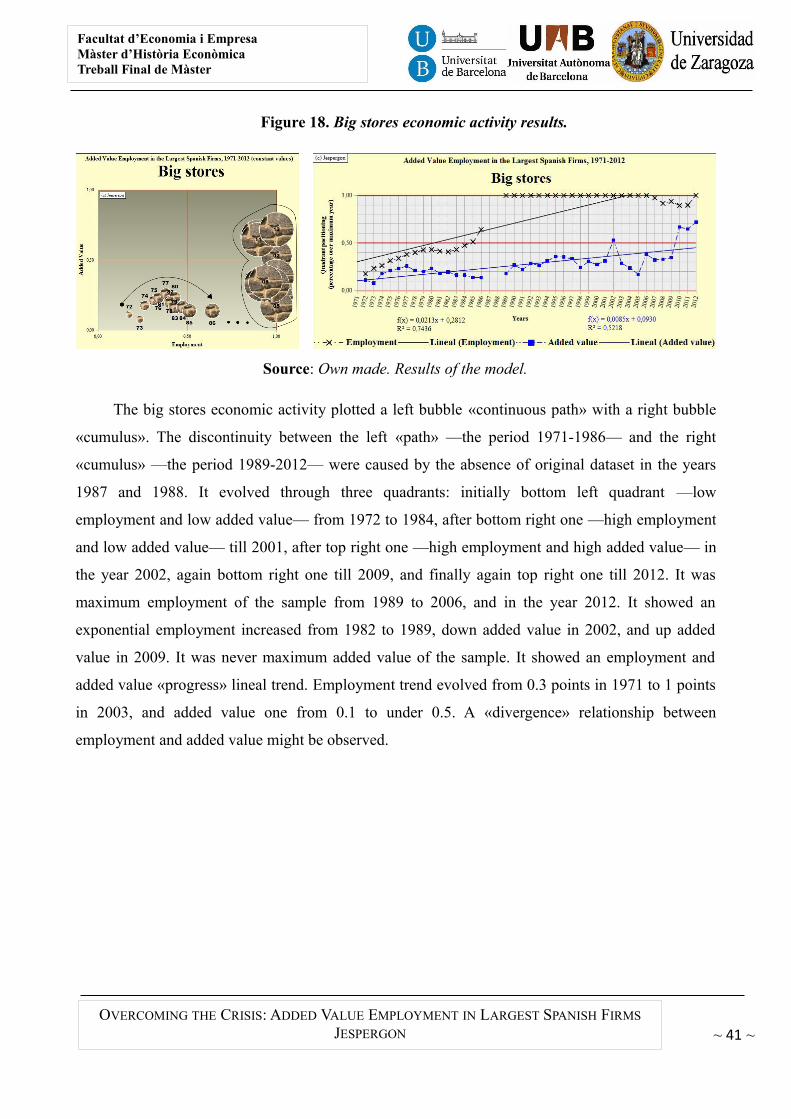
Facultat d’Economia i EmpresaMàster d’Història EconòmicaTreball Final de Màster
OVERCOMING THE CRISIS: ADDED VALUE EMPLOYMENT IN LARGEST SPANISH FIRMS
JESPERGON
Figure 18. Big stores economic activity results.
Source: Own made. Results of the model.
The big stores economic activity plotted a left bubble «continuous path» with a right bubble
«cumulus». The discontinuity between the left «path» —the period 1971-1986— and the right
«cumulus» —the period 1989-2012— were caused by the absence of original dataset in the years
1987 and 1988. It evolved through three quadrants: initially bottom left quadrant —low
employment and low added value— from 1972 to 1984, after bottom right one —high employment
and low added value— till 2001, after top right one —high employment and high added value— in
the year 2002, again bottom right one till 2009, and finally again top right one till 2012. It was
maximum employment of the sample from 1989 to 2006, and in the year 2012. It showed an
exponential employment increased from 1982 to 1989, down added value in 2002, and up added
value in 2009. It was never maximum added value of the sample. It showed an employment and
added value «progress» lineal trend. Employment trend evolved from 0.3 points in 1971 to 1 points
in 2003, and added value one from 0.1 to under 0.5. A «divergence» relationship between
employment and added value might be observed.
~ 41 ~
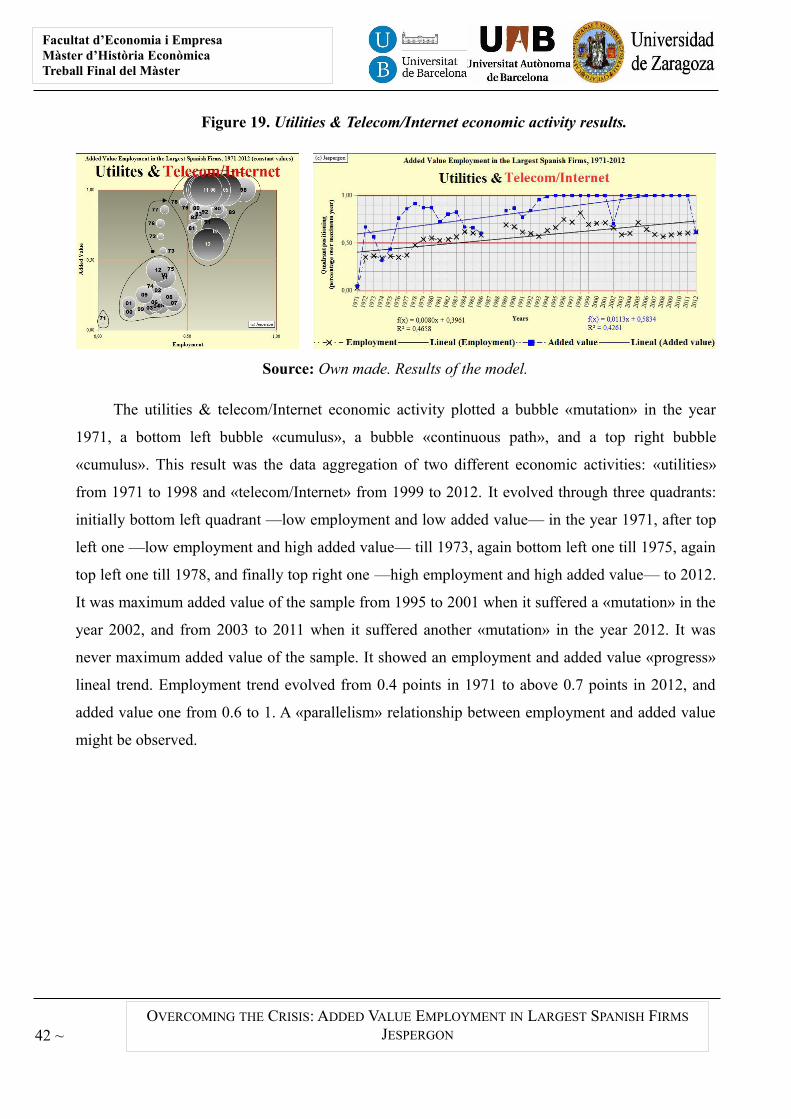
Facultat d’Economia i EmpresaMàster d’Història EconòmicaTreball Final del Màster
OVERCOMING THE CRISIS: ADDED VALUE EMPLOYMENT IN LARGEST SPANISH FIRMS
JESPERGON
Figure 19. Utilities & Telecom/Internet economic activity results.
Source: Own made. Results of the model.
The utilities & telecom/Internet economic activity plotted a bubble «mutation» in the year
1971, a bottom left bubble «cumulus», a bubble «continuous path», and a top right bubble
«cumulus». This result was the data aggregation of two different economic activities: «utilities»
from 1971 to 1998 and «telecom/Internet» from 1999 to 2012. It evolved through three quadrants:
initially bottom left quadrant —low employment and low added value— in the year 1971, after top
left one —low employment and high added value— till 1973, again bottom left one till 1975, again
top left one till 1978, and finally top right one —high employment and high added value— to 2012.
It was maximum added value of the sample from 1995 to 2001 when it suffered a «mutation» in the
year 2002, and from 2003 to 2011 when it suffered another «mutation» in the year 2012. It was
never maximum added value of the sample. It showed an employment and added value «progress»
lineal trend. Employment trend evolved from 0.4 points in 1971 to above 0.7 points in 2012, and
added value one from 0.6 to 1. A «parallelism» relationship between employment and added value
might be observed.
42 ~
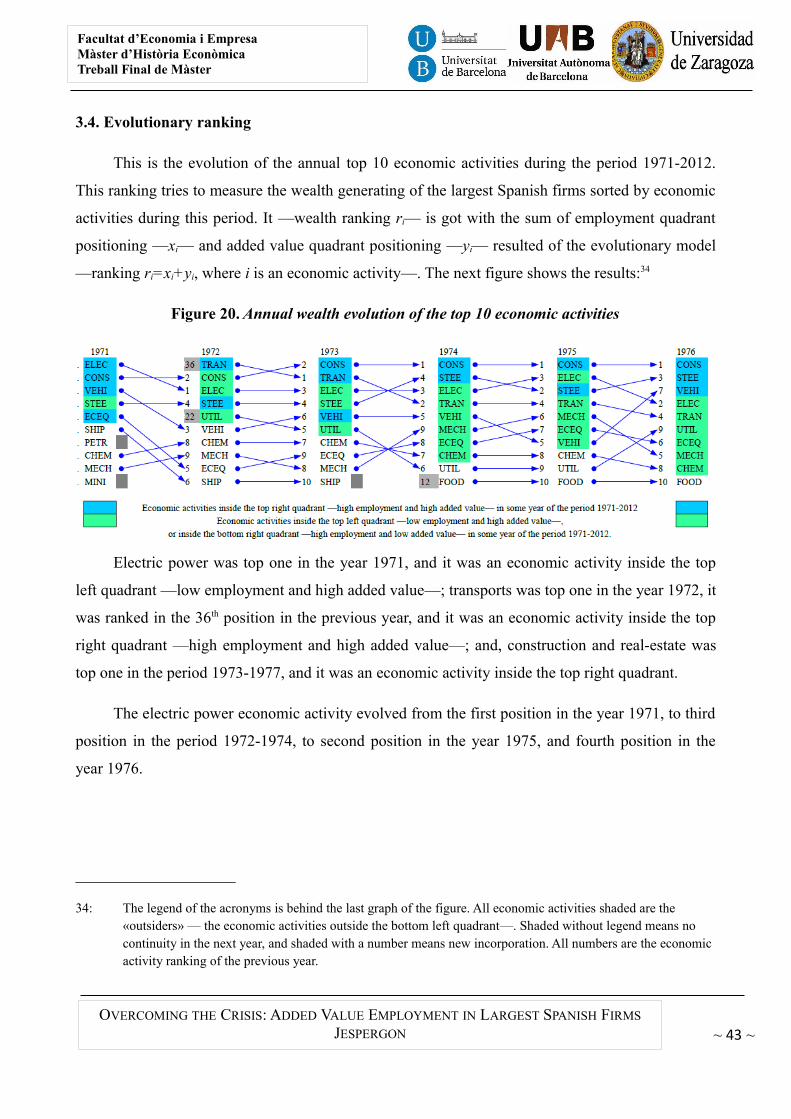
Facultat d’Economia i EmpresaMàster d’Història EconòmicaTreball Final de Màster
OVERCOMING THE CRISIS: ADDED VALUE EMPLOYMENT IN LARGEST SPANISH FIRMS
JESPERGON
3.4. Evolutionary ranking
This is the evolution of the annual top 10 economic activities during the period 1971-2012.
This ranking tries to measure the wealth generating of the largest Spanish firms sorted by economic
activities during this period. It —wealth ranking ri— is got with the sum of employment quadrant
positioning —xi— and added value quadrant positioning —yi— resulted of the evolutionary model
—ranking ri=xi+yi, where i is an economic activity—. The next figure shows the results:34
Figure 20. Annual wealth evolution of the top 10 economic activities
Electric power was top one in the year 1971, and it was an economic activity inside the top
left quadrant —low employment and high added value—; transports was top one in the year 1972, it
was ranked in the 36th position in the previous year, and it was an economic activity inside the top
right quadrant —high employment and high added value—; and, construction and real-estate was
top one in the period 1973-1977, and it was an economic activity inside the top right quadrant.
The electric power economic activity evolved from the first position in the year 1971, to third
position in the period 1972-1974, to second position in the year 1975, and fourth position in the
year 1976.
34: The legend of the acronyms is behind the last graph of the figure. All economic activities shaded are the «outsiders» — the economic activities outside the bottom left quadrant—. Shaded without legend means no continuity in the next year, and shaded with a number means new incorporation. All numbers are the economic activity ranking of the previous year.
~ 43 ~
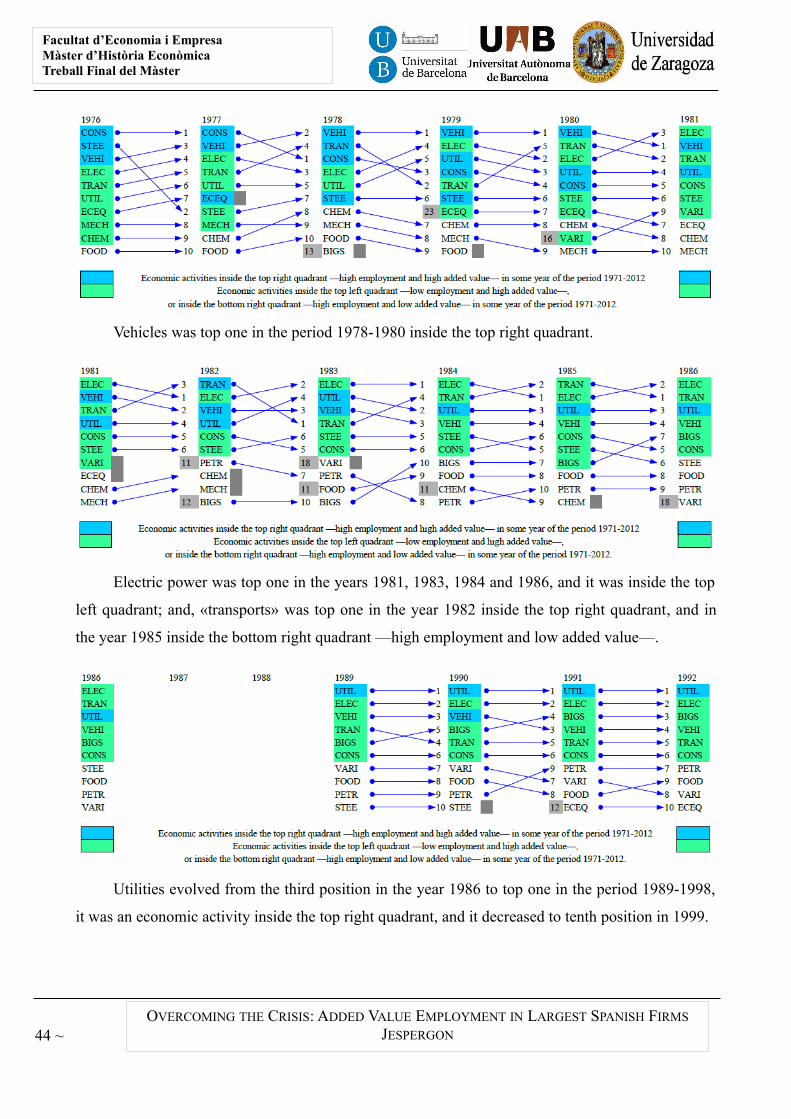
Facultat d’Economia i EmpresaMàster d’Història EconòmicaTreball Final del Màster
OVERCOMING THE CRISIS: ADDED VALUE EMPLOYMENT IN LARGEST SPANISH FIRMS
JESPERGON
Vehicles was top one in the period 1978-1980 inside the top right quadrant.
Electric power was top one in the years 1981, 1983, 1984 and 1986, and it was inside the top
left quadrant; and, «transports» was top one in the year 1982 inside the top right quadrant, and in
the year 1985 inside the bottom right quadrant —high employment and low added value—.
Utilities evolved from the third position in the year 1986 to top one in the period 1989-1998,
it was an economic activity inside the top right quadrant, and it decreased to tenth position in 1999.
44 ~
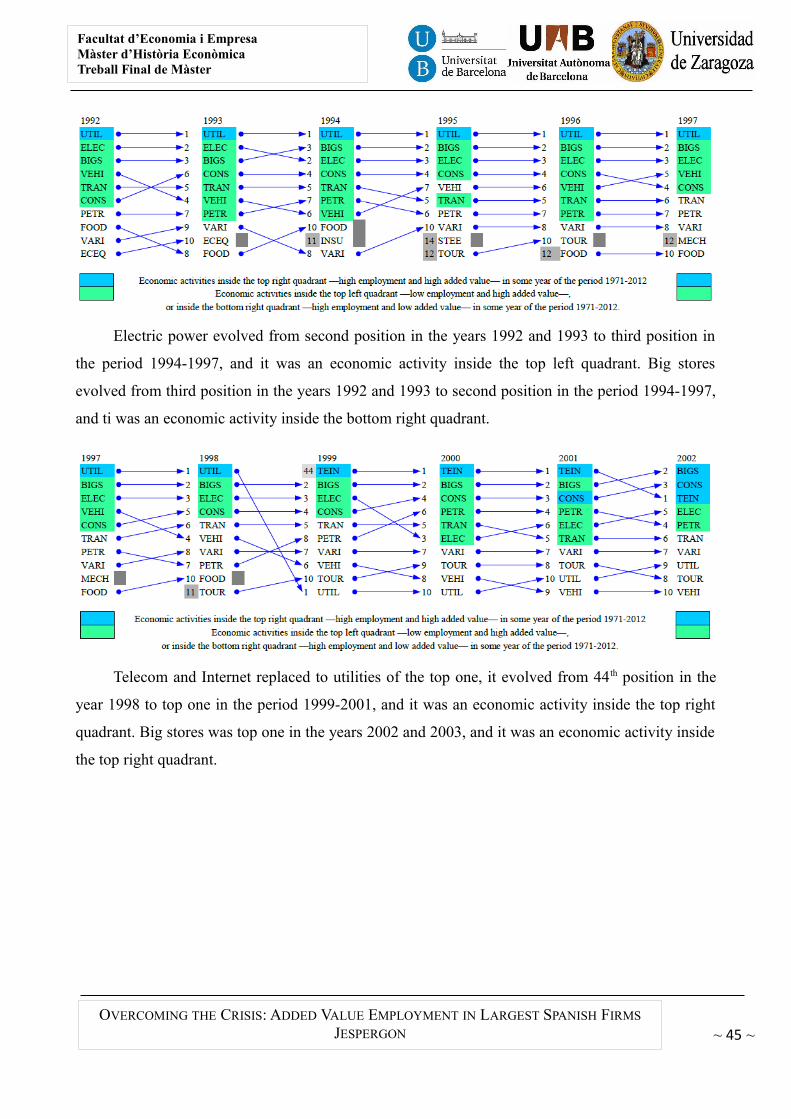
Facultat d’Economia i EmpresaMàster d’Història EconòmicaTreball Final de Màster
OVERCOMING THE CRISIS: ADDED VALUE EMPLOYMENT IN LARGEST SPANISH FIRMS
JESPERGON
Electric power evolved from second position in the years 1992 and 1993 to third position in
the period 1994-1997, and it was an economic activity inside the top left quadrant. Big stores
evolved from third position in the years 1992 and 1993 to second position in the period 1994-1997,
and ti was an economic activity inside the bottom right quadrant.
Telecom and Internet replaced to utilities of the top one, it evolved from 44th position in the
year 1998 to top one in the period 1999-2001, and it was an economic activity inside the top right
quadrant. Big stores was top one in the years 2002 and 2003, and it was an economic activity inside
the top right quadrant.
~ 45 ~
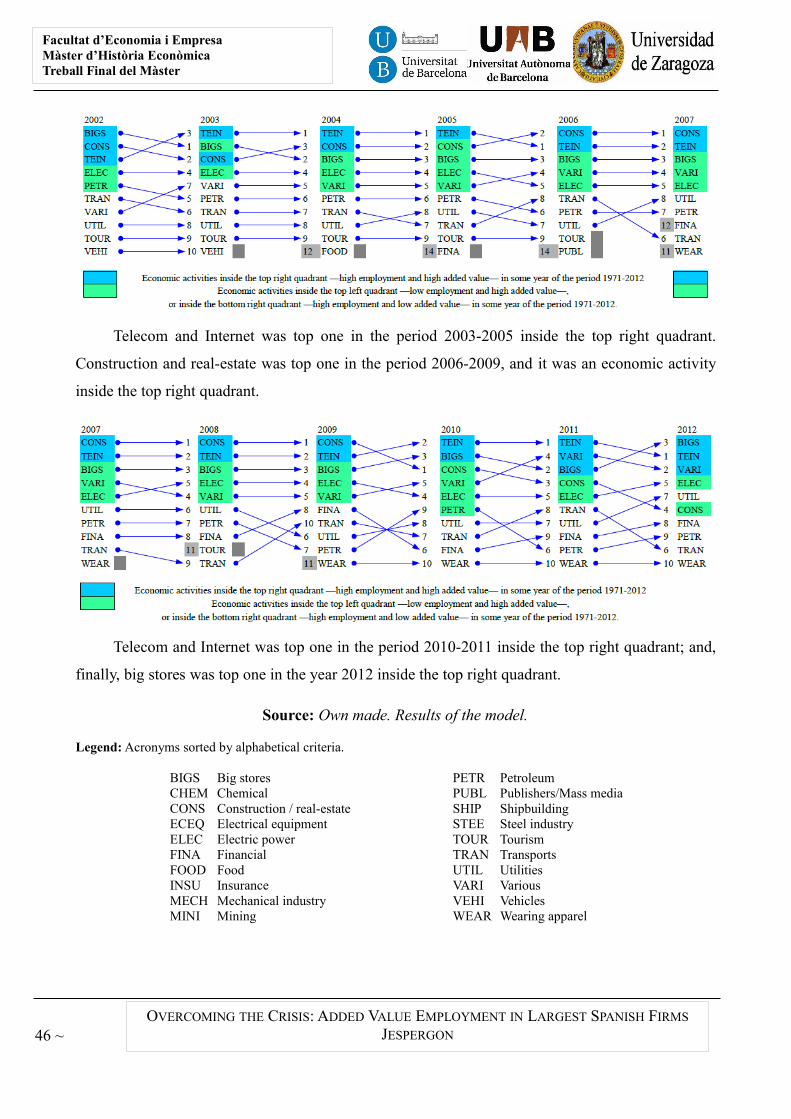
Facultat d’Economia i EmpresaMàster d’Història EconòmicaTreball Final del Màster
OVERCOMING THE CRISIS: ADDED VALUE EMPLOYMENT IN LARGEST SPANISH FIRMS
JESPERGON
Telecom and Internet was top one in the period 2003-2005 inside the top right quadrant.
Construction and real-estate was top one in the period 2006-2009, and it was an economic activity
inside the top right quadrant.
Telecom and Internet was top one in the period 2010-2011 inside the top right quadrant; and,
finally, big stores was top one in the year 2012 inside the top right quadrant.
Source: Own made. Results of the model.
Legend: Acronyms sorted by alphabetical criteria.
BIGS Big stores PETR PetroleumCHEM Chemical PUBL Publishers/Mass mediaCONS Construction / real-estate SHIP ShipbuildingECEQ Electrical equipment STEE Steel industryELEC Electric power TOUR TourismFINA Financial TRAN TransportsFOOD Food UTIL UtilitiesINSU Insurance VARI VariousMECH Mechanical industry VEHI VehiclesMINI Mining WEAR Wearing apparel
46 ~
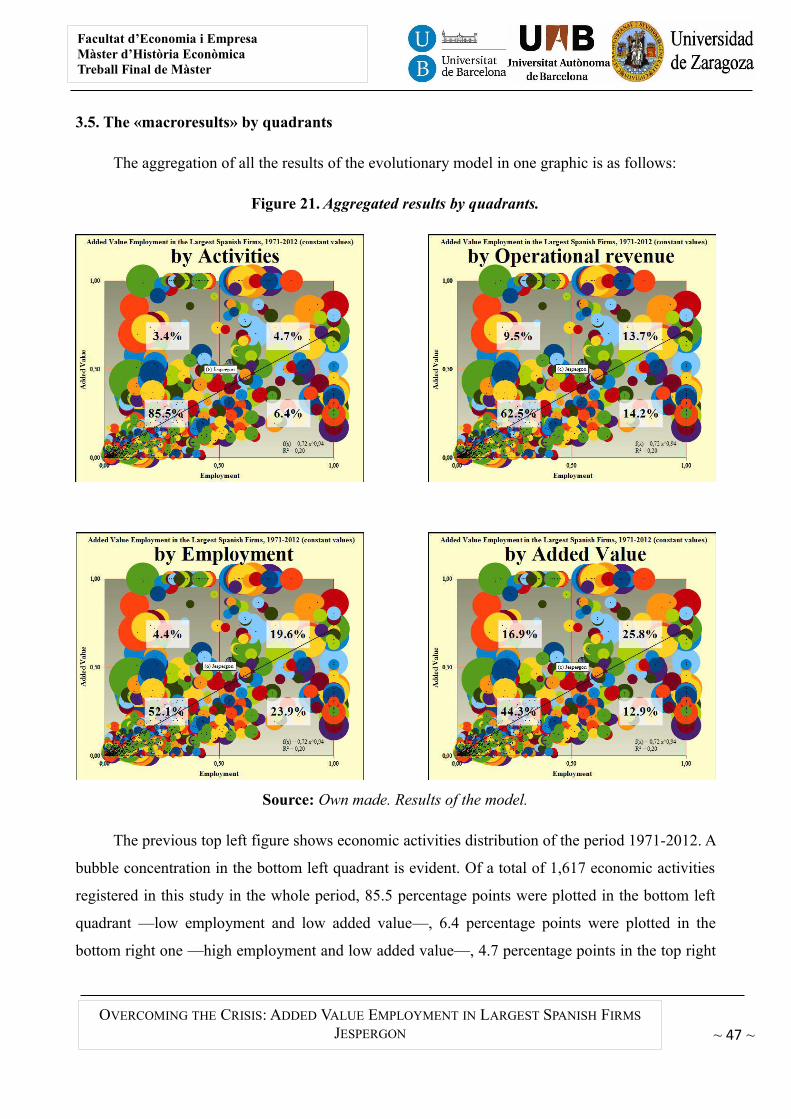
Facultat d’Economia i EmpresaMàster d’Història EconòmicaTreball Final de Màster
OVERCOMING THE CRISIS: ADDED VALUE EMPLOYMENT IN LARGEST SPANISH FIRMS
JESPERGON
3.5. The «macroresults» by quadrants
The aggregation of all the results of the evolutionary model in one graphic is as follows:
Figure 21. Aggregated results by quadrants.
Source: Own made. Results of the model.
The previous top left figure shows economic activities distribution of the period 1971-2012. A
bubble concentration in the bottom left quadrant is evident. Of a total of 1,617 economic activities
registered in this study in the whole period, 85.5 percentage points were plotted in the bottom left
quadrant —low employment and low added value—, 6.4 percentage points were plotted in the
bottom right one —high employment and low added value—, 4.7 percentage points in the top right
~ 47 ~
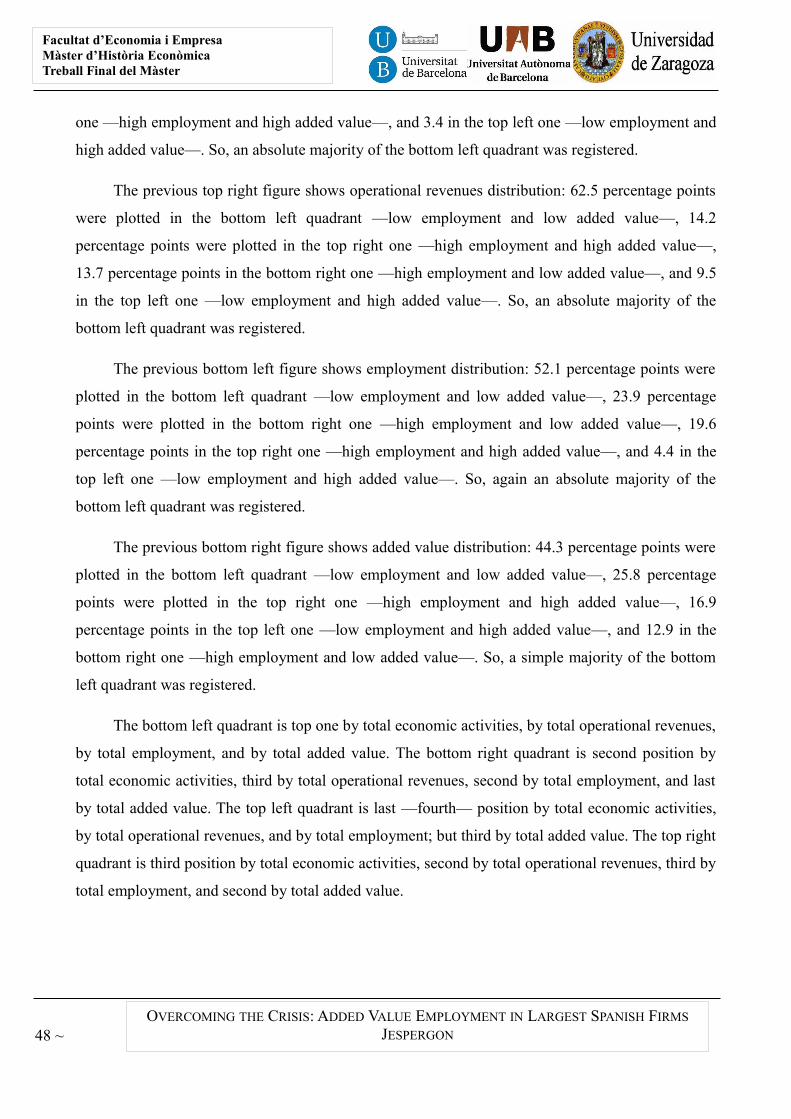
Facultat d’Economia i EmpresaMàster d’Història EconòmicaTreball Final del Màster
OVERCOMING THE CRISIS: ADDED VALUE EMPLOYMENT IN LARGEST SPANISH FIRMS
JESPERGON
one —high employment and high added value—, and 3.4 in the top left one —low employment and
high added value—. So, an absolute majority of the bottom left quadrant was registered.
The previous top right figure shows operational revenues distribution: 62.5 percentage points
were plotted in the bottom left quadrant —low employment and low added value—, 14.2
percentage points were plotted in the top right one —high employment and high added value—,
13.7 percentage points in the bottom right one —high employment and low added value—, and 9.5
in the top left one —low employment and high added value—. So, an absolute majority of the
bottom left quadrant was registered.
The previous bottom left figure shows employment distribution: 52.1 percentage points were
plotted in the bottom left quadrant —low employment and low added value—, 23.9 percentage
points were plotted in the bottom right one —high employment and low added value—, 19.6
percentage points in the top right one —high employment and high added value—, and 4.4 in the
top left one —low employment and high added value—. So, again an absolute majority of the
bottom left quadrant was registered.
The previous bottom right figure shows added value distribution: 44.3 percentage points were
plotted in the bottom left quadrant —low employment and low added value—, 25.8 percentage
points were plotted in the top right one —high employment and high added value—, 16.9
percentage points in the top left one —low employment and high added value—, and 12.9 in the
bottom right one —high employment and low added value—. So, a simple majority of the bottom
left quadrant was registered.
The bottom left quadrant is top one by total economic activities, by total operational revenues,
by total employment, and by total added value. The bottom right quadrant is second position by
total economic activities, third by total operational revenues, second by total employment, and last
by total added value. The top left quadrant is last —fourth— position by total economic activities,
by total operational revenues, and by total employment; but third by total added value. The top right
quadrant is third position by total economic activities, second by total operational revenues, third by
total employment, and second by total added value.
48 ~
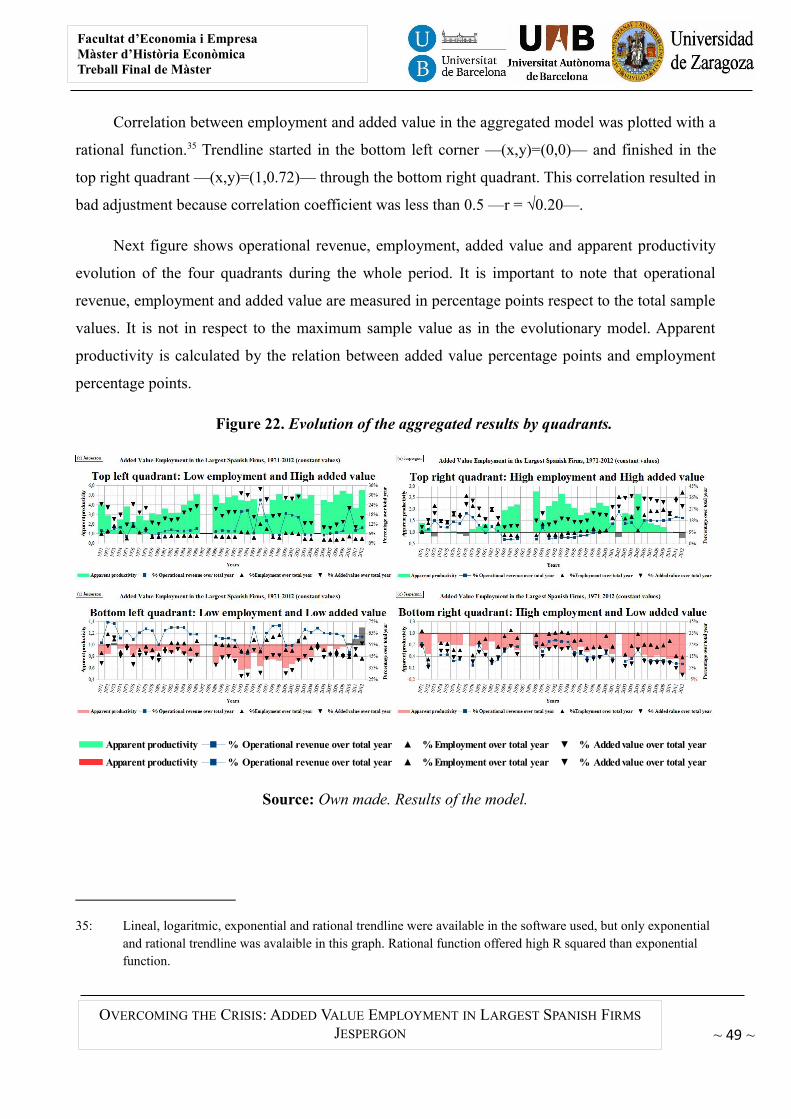
Facultat d’Economia i EmpresaMàster d’Història EconòmicaTreball Final de Màster
OVERCOMING THE CRISIS: ADDED VALUE EMPLOYMENT IN LARGEST SPANISH FIRMS
JESPERGON
Correlation between employment and added value in the aggregated model was plotted with a
rational function.35 Trendline started in the bottom left corner —(x,y)=(0,0)— and finished in the
top right quadrant —(x,y)=(1,0.72)— through the bottom right quadrant. This correlation resulted in
bad adjustment because correlation coefficient was less than 0.5 —r = √0.20—.
Next figure shows operational revenue, employment, added value and apparent productivity
evolution of the four quadrants during the whole period. It is important to note that operational
revenue, employment and added value are measured in percentage points respect to the total sample
values. It is not in respect to the maximum sample value as in the evolutionary model. Apparent
productivity is calculated by the relation between added value percentage points and employment
percentage points.
Figure 22. Evolution of the aggregated results by quadrants.
Source: Own made. Results of the model.
35: Lineal, logaritmic, exponential and rational trendline were available in the software used, but only exponential and rational trendline was avalaible in this graph. Rational function offered high R squared than exponential function.
~ 49 ~
Apparent productivity % Operational revenue over total year % Employment over total year % Added value over total year
Apparent productivity % Operational revenue over total year % Employment over total year % Added value over total year
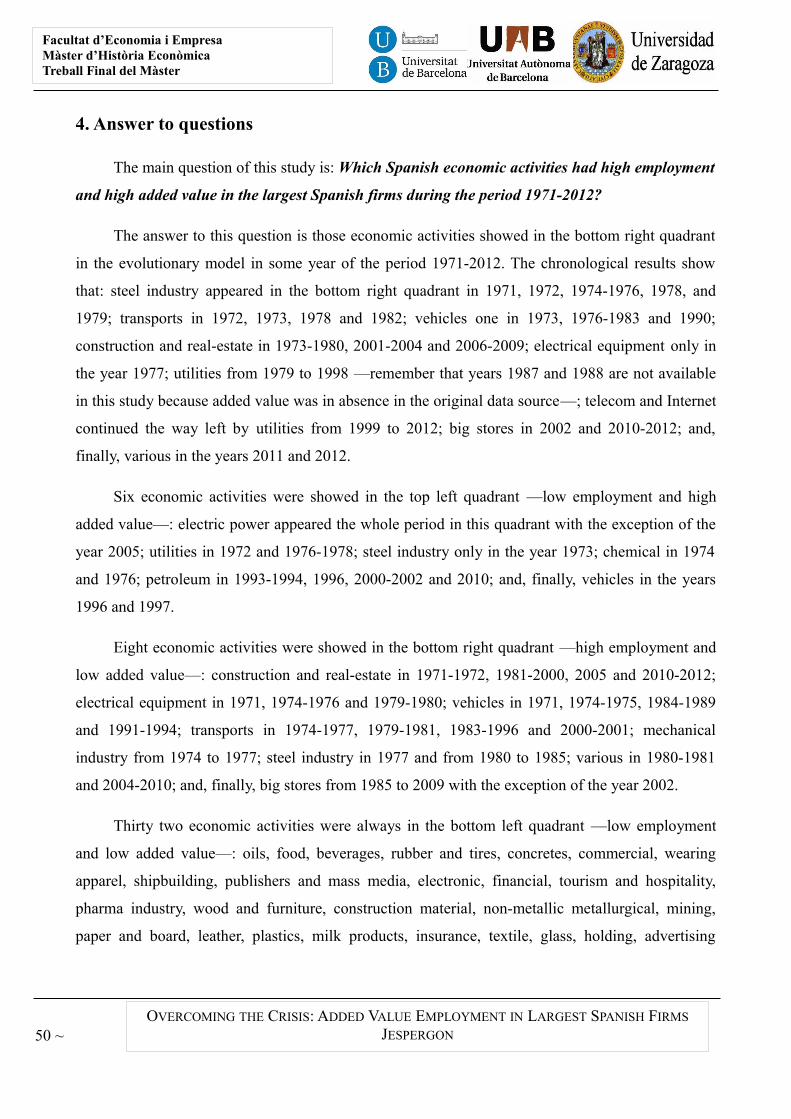
Facultat d’Economia i EmpresaMàster d’Història EconòmicaTreball Final del Màster
OVERCOMING THE CRISIS: ADDED VALUE EMPLOYMENT IN LARGEST SPANISH FIRMS
JESPERGON
4. Answer to questions
The main question of this study is: Which Spanish economic activities had high employment
and high added value in the largest Spanish firms during the period 1971-2012?
The answer to this question is those economic activities showed in the bottom right quadrant
in the evolutionary model in some year of the period 1971-2012. The chronological results show
that: steel industry appeared in the bottom right quadrant in 1971, 1972, 1974-1976, 1978, and
1979; transports in 1972, 1973, 1978 and 1982; vehicles one in 1973, 1976-1983 and 1990;
construction and real-estate in 1973-1980, 2001-2004 and 2006-2009; electrical equipment only in
the year 1977; utilities from 1979 to 1998 —remember that years 1987 and 1988 are not available
in this study because added value was in absence in the original data source—; telecom and Internet
continued the way left by utilities from 1999 to 2012; big stores in 2002 and 2010-2012; and,
finally, various in the years 2011 and 2012.
Six economic activities were showed in the top left quadrant —low employment and high
added value—: electric power appeared the whole period in this quadrant with the exception of the
year 2005; utilities in 1972 and 1976-1978; steel industry only in the year 1973; chemical in 1974
and 1976; petroleum in 1993-1994, 1996, 2000-2002 and 2010; and, finally, vehicles in the years
1996 and 1997.
Eight economic activities were showed in the bottom right quadrant —high employment and
low added value—: construction and real-estate in 1971-1972, 1981-2000, 2005 and 2010-2012;
electrical equipment in 1971, 1974-1976 and 1979-1980; vehicles in 1971, 1974-1975, 1984-1989
and 1991-1994; transports in 1974-1977, 1979-1981, 1983-1996 and 2000-2001; mechanical
industry from 1974 to 1977; steel industry in 1977 and from 1980 to 1985; various in 1980-1981
and 2004-2010; and, finally, big stores from 1985 to 2009 with the exception of the year 2002.
Thirty two economic activities were always in the bottom left quadrant —low employment
and low added value—: oils, food, beverages, rubber and tires, concretes, commercial, wearing
apparel, shipbuilding, publishers and mass media, electronic, financial, tourism and hospitality,
pharma industry, wood and furniture, construction material, non-metallic metallurgical, mining,
paper and board, leather, plastics, milk products, insurance, textile, glass, holding, advertising
50 ~
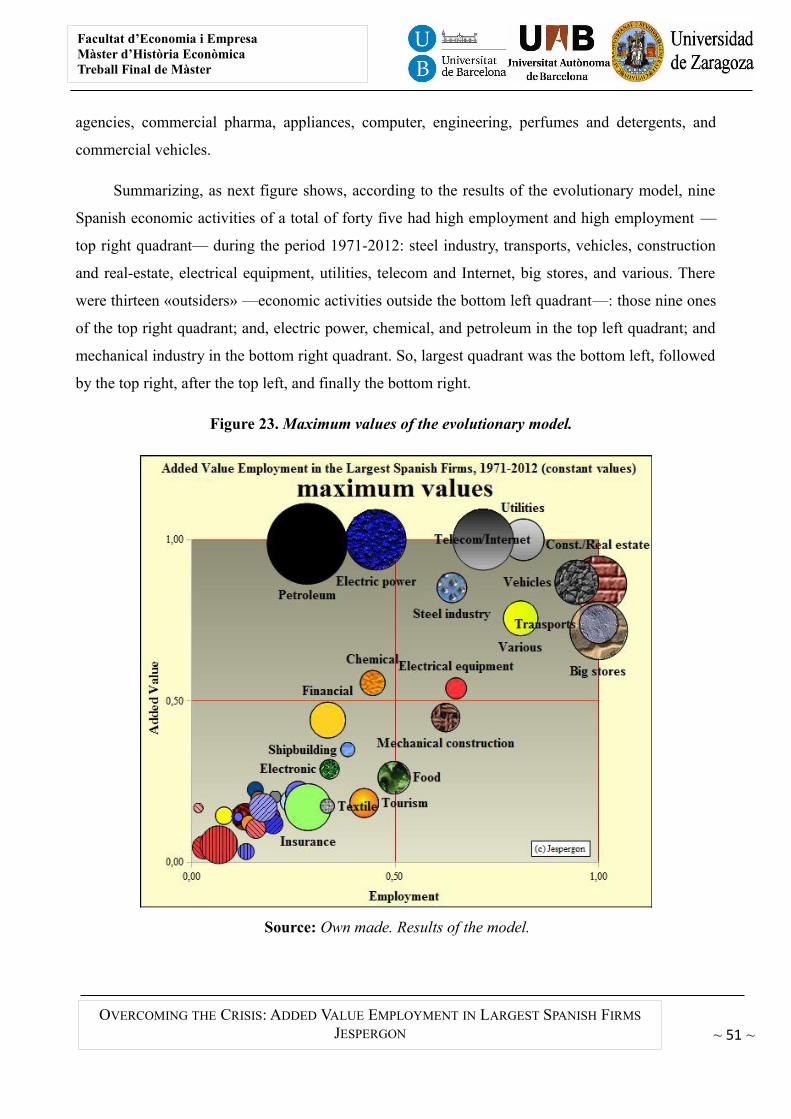
Facultat d’Economia i EmpresaMàster d’Història EconòmicaTreball Final de Màster
OVERCOMING THE CRISIS: ADDED VALUE EMPLOYMENT IN LARGEST SPANISH FIRMS
JESPERGON
agencies, commercial pharma, appliances, computer, engineering, perfumes and detergents, and
commercial vehicles.
Summarizing, as next figure shows, according to the results of the evolutionary model, nine
Spanish economic activities of a total of forty five had high employment and high employment —
top right quadrant— during the period 1971-2012: steel industry, transports, vehicles, construction
and real-estate, electrical equipment, utilities, telecom and Internet, big stores, and various. There
were thirteen «outsiders» —economic activities outside the bottom left quadrant—: those nine ones
of the top right quadrant; and, electric power, chemical, and petroleum in the top left quadrant; and
mechanical industry in the bottom right quadrant. So, largest quadrant was the bottom left, followed
by the top right, after the top left, and finally the bottom right.
Figure 23. Maximum values of the evolutionary model.
Source: Own made. Results of the model.
~ 51 ~
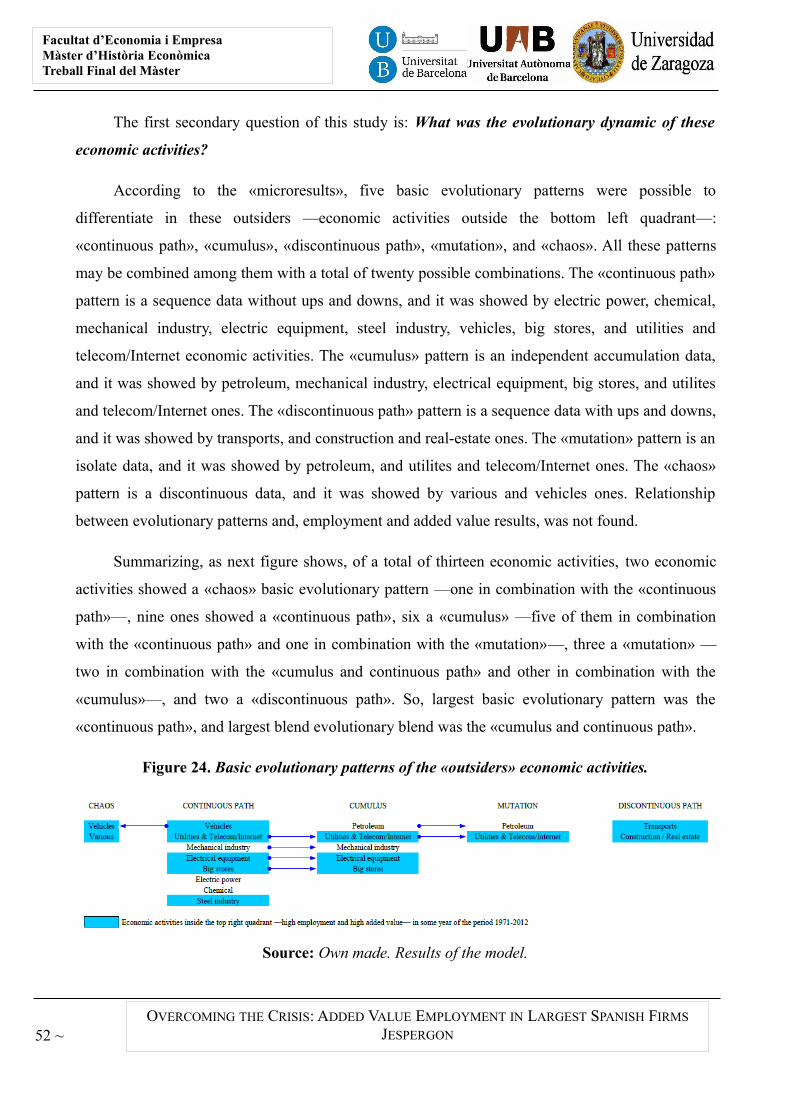
Facultat d’Economia i EmpresaMàster d’Història EconòmicaTreball Final del Màster
OVERCOMING THE CRISIS: ADDED VALUE EMPLOYMENT IN LARGEST SPANISH FIRMS
JESPERGON
The first secondary question of this study is: What was the evolutionary dynamic of these
economic activities?
According to the «microresults», five basic evolutionary patterns were possible to
differentiate in these outsiders —economic activities outside the bottom left quadrant—:
«continuous path», «cumulus», «discontinuous path», «mutation», and «chaos». All these patterns
may be combined among them with a total of twenty possible combinations. The «continuous path»
pattern is a sequence data without ups and downs, and it was showed by electric power, chemical,
mechanical industry, electric equipment, steel industry, vehicles, big stores, and utilities and
telecom/Internet economic activities. The «cumulus» pattern is an independent accumulation data,
and it was showed by petroleum, mechanical industry, electrical equipment, big stores, and utilites
and telecom/Internet ones. The «discontinuous path» pattern is a sequence data with ups and downs,
and it was showed by transports, and construction and real-estate ones. The «mutation» pattern is an
isolate data, and it was showed by petroleum, and utilites and telecom/Internet ones. The «chaos»
pattern is a discontinuous data, and it was showed by various and vehicles ones. Relationship
between evolutionary patterns and, employment and added value results, was not found.
Summarizing, as next figure shows, of a total of thirteen economic activities, two economic
activities showed a «chaos» basic evolutionary pattern —one in combination with the «continuous
path»—, nine ones showed a «continuous path», six a «cumulus» —five of them in combination
with the «continuous path» and one in combination with the «mutation»—, three a «mutation» —
two in combination with the «cumulus and continuous path» and other in combination with the
«cumulus»—, and two a «discontinuous path». So, largest basic evolutionary pattern was the
«continuous path», and largest blend evolutionary blend was the «cumulus and continuous path».
Figure 24. Basic evolutionary patterns of the «outsiders» economic activities.
Source: Own made. Results of the model.
52 ~
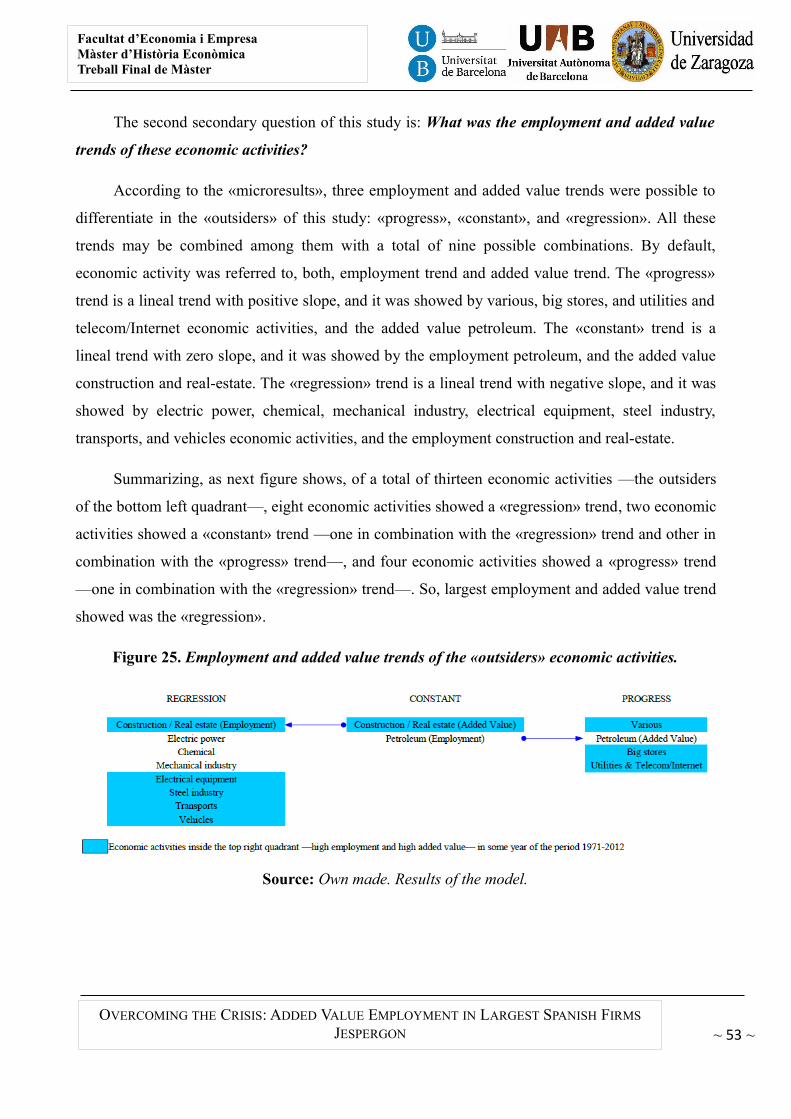
Facultat d’Economia i EmpresaMàster d’Història EconòmicaTreball Final de Màster
OVERCOMING THE CRISIS: ADDED VALUE EMPLOYMENT IN LARGEST SPANISH FIRMS
JESPERGON
The second secondary question of this study is: What was the employment and added value
trends of these economic activities?
According to the «microresults», three employment and added value trends were possible to
differentiate in the «outsiders» of this study: «progress», «constant», and «regression». All these
trends may be combined among them with a total of nine possible combinations. By default,
economic activity was referred to, both, employment trend and added value trend. The «progress»
trend is a lineal trend with positive slope, and it was showed by various, big stores, and utilities and
telecom/Internet economic activities, and the added value petroleum. The «constant» trend is a
lineal trend with zero slope, and it was showed by the employment petroleum, and the added value
construction and real-estate. The «regression» trend is a lineal trend with negative slope, and it was
showed by electric power, chemical, mechanical industry, electrical equipment, steel industry,
transports, and vehicles economic activities, and the employment construction and real-estate.
Summarizing, as next figure shows, of a total of thirteen economic activities —the outsiders
of the bottom left quadrant—, eight economic activities showed a «regression» trend, two economic
activities showed a «constant» trend —one in combination with the «regression» trend and other in
combination with the «progress» trend—, and four economic activities showed a «progress» trend
—one in combination with the «regression» trend—. So, largest employment and added value trend
showed was the «regression».
Figure 25. Employment and added value trends of the «outsiders» economic activities.
Source: Own made. Results of the model.
~ 53 ~
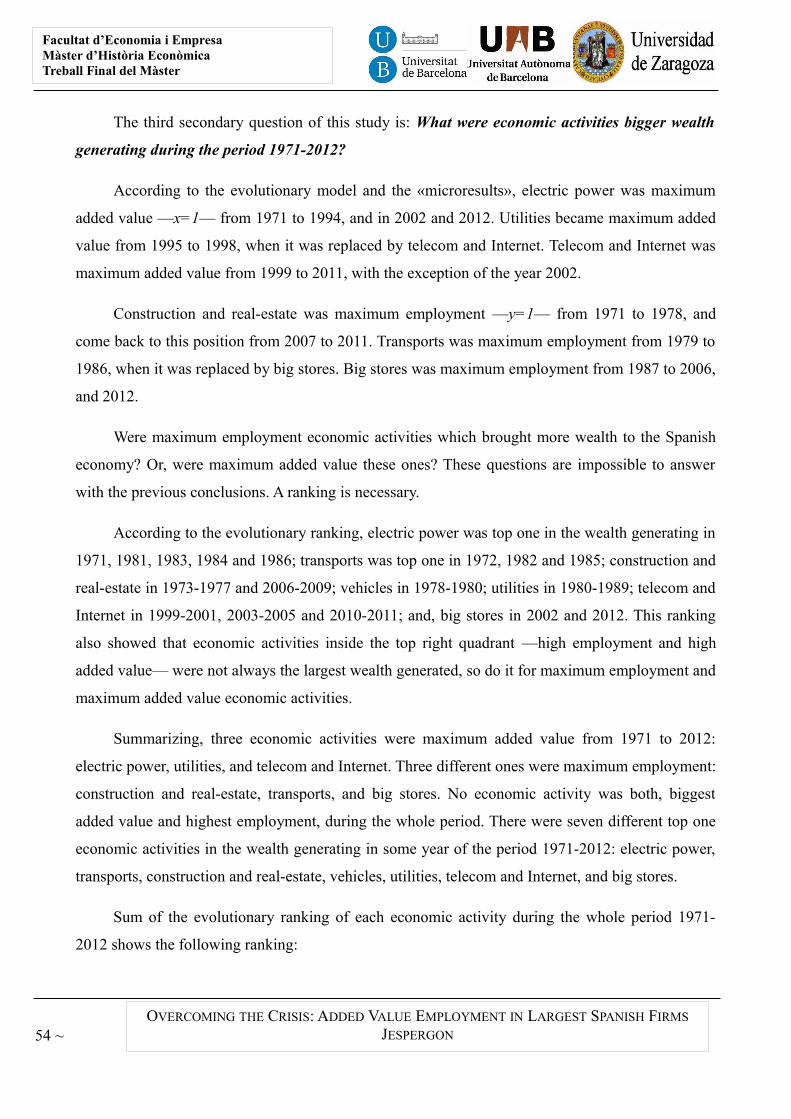
Facultat d’Economia i EmpresaMàster d’Història EconòmicaTreball Final del Màster
OVERCOMING THE CRISIS: ADDED VALUE EMPLOYMENT IN LARGEST SPANISH FIRMS
JESPERGON
The third secondary question of this study is: What were economic activities bigger wealth
generating during the period 1971-2012?
According to the evolutionary model and the «microresults», electric power was maximum
added value —x=1— from 1971 to 1994, and in 2002 and 2012. Utilities became maximum added
value from 1995 to 1998, when it was replaced by telecom and Internet. Telecom and Internet was
maximum added value from 1999 to 2011, with the exception of the year 2002.
Construction and real-estate was maximum employment —y=1— from 1971 to 1978, and
come back to this position from 2007 to 2011. Transports was maximum employment from 1979 to
1986, when it was replaced by big stores. Big stores was maximum employment from 1987 to 2006,
and 2012.
Were maximum employment economic activities which brought more wealth to the Spanish
economy? Or, were maximum added value these ones? These questions are impossible to answer
with the previous conclusions. A ranking is necessary.
According to the evolutionary ranking, electric power was top one in the wealth generating in
1971, 1981, 1983, 1984 and 1986; transports was top one in 1972, 1982 and 1985; construction and
real-estate in 1973-1977 and 2006-2009; vehicles in 1978-1980; utilities in 1980-1989; telecom and
Internet in 1999-2001, 2003-2005 and 2010-2011; and, big stores in 2002 and 2012. This ranking
also showed that economic activities inside the top right quadrant —high employment and high
added value— were not always the largest wealth generated, so do it for maximum employment and
maximum added value economic activities.
Summarizing, three economic activities were maximum added value from 1971 to 2012:
electric power, utilities, and telecom and Internet. Three different ones were maximum employment:
construction and real-estate, transports, and big stores. No economic activity was both, biggest
added value and highest employment, during the whole period. There were seven different top one
economic activities in the wealth generating in some year of the period 1971-2012: electric power,
transports, construction and real-estate, vehicles, utilities, telecom and Internet, and big stores.
Sum of the evolutionary ranking of each economic activity during the whole period 1971-
2012 shows the following ranking:
54 ~
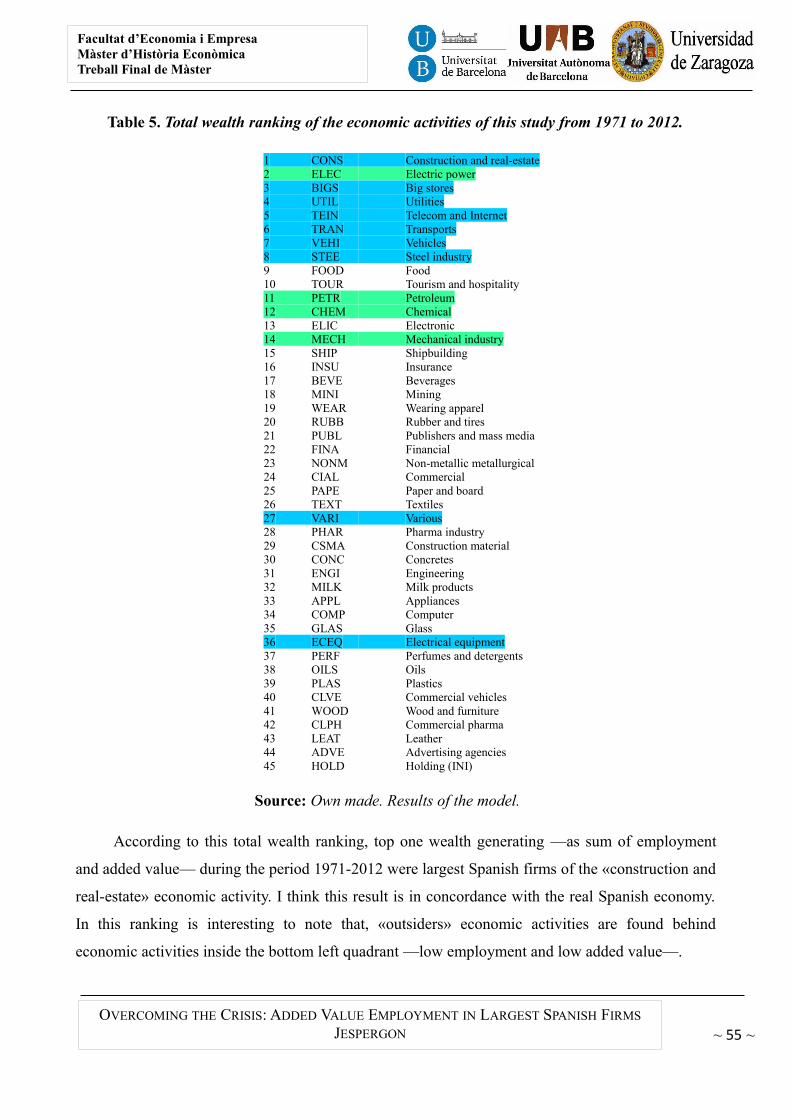
Facultat d’Economia i EmpresaMàster d’Història EconòmicaTreball Final de Màster
OVERCOMING THE CRISIS: ADDED VALUE EMPLOYMENT IN LARGEST SPANISH FIRMS
JESPERGON
Table 5. Total wealth ranking of the economic activities of this study from 1971 to 2012.
1 CONS Construction and real-estate2 ELEC Electric power3 BIGS Big stores4 UTIL Utilities5 TEIN Telecom and Internet6 TRAN Transports7 VEHI Vehicles8 STEE Steel industry9 FOOD Food10 TOUR Tourism and hospitality11 PETR Petroleum12 CHEM Chemical13 ELIC Electronic14 MECH Mechanical industry15 SHIP Shipbuilding16 INSU Insurance17 BEVE Beverages18 MINI Mining19 WEAR Wearing apparel20 RUBB Rubber and tires21 PUBL Publishers and mass media22 FINA Financial23 NONM Non-metallic metallurgical24 CIAL Commercial25 PAPE Paper and board26 TEXT Textiles27 VARI Various28 PHAR Pharma industry29 CSMA Construction material30 CONC Concretes31 ENGI Engineering32 MILK Milk products33 APPL Appliances34 COMP Computer35 GLAS Glass36 ECEQ Electrical equipment37 PERF Perfumes and detergents38 OILS Oils39 PLAS Plastics40 CLVE Commercial vehicles41 WOOD Wood and furniture42 CLPH Commercial pharma43 LEAT Leather44 ADVE Advertising agencies45 HOLD Holding (INI)
Source: Own made. Results of the model.
According to this total wealth ranking, top one wealth generating —as sum of employment
and added value— during the period 1971-2012 were largest Spanish firms of the «construction and
real-estate» economic activity. I think this result is in concordance with the real Spanish economy.
In this ranking is interesting to note that, «outsiders» economic activities are found behind
economic activities inside the bottom left quadrant —low employment and low added value—.
~ 55 ~
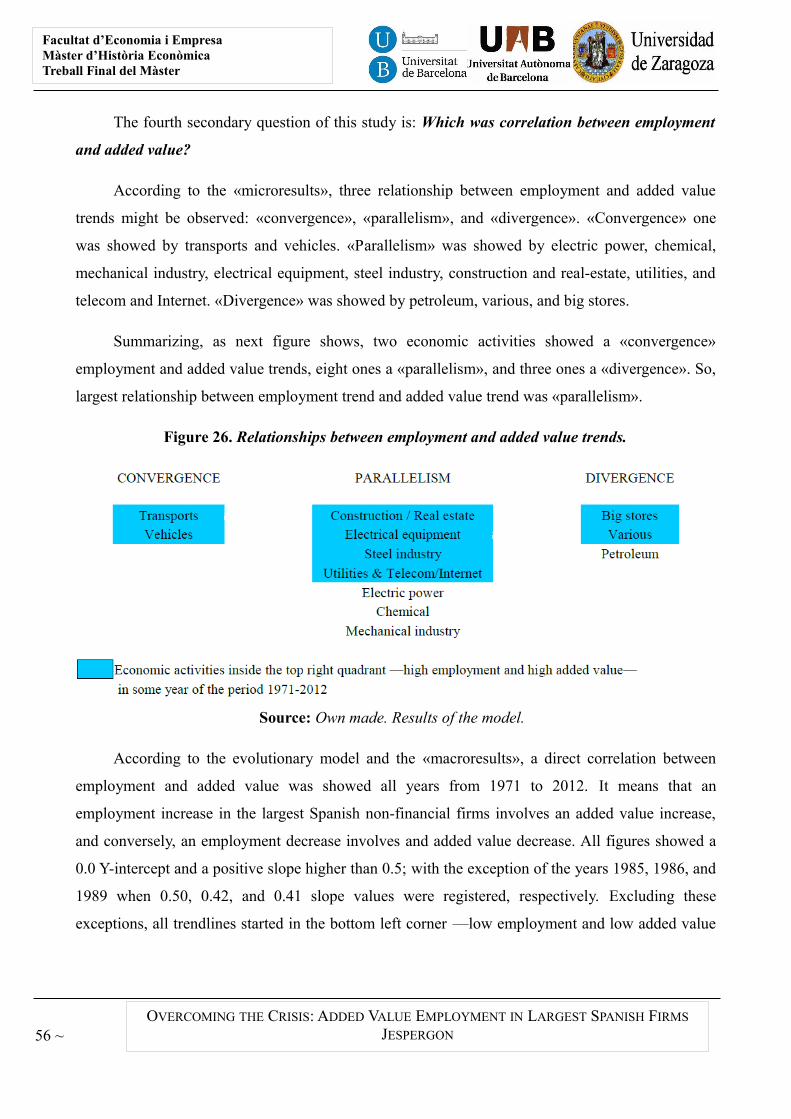
Facultat d’Economia i EmpresaMàster d’Història EconòmicaTreball Final del Màster
OVERCOMING THE CRISIS: ADDED VALUE EMPLOYMENT IN LARGEST SPANISH FIRMS
JESPERGON
The fourth secondary question of this study is: Which was correlation between employment
and added value?
According to the «microresults», three relationship between employment and added value
trends might be observed: «convergence», «parallelism», and «divergence». «Convergence» one
was showed by transports and vehicles. «Parallelism» was showed by electric power, chemical,
mechanical industry, electrical equipment, steel industry, construction and real-estate, utilities, and
telecom and Internet. «Divergence» was showed by petroleum, various, and big stores.
Summarizing, as next figure shows, two economic activities showed a «convergence»
employment and added value trends, eight ones a «parallelism», and three ones a «divergence». So,
largest relationship between employment trend and added value trend was «parallelism».
Figure 26. Relationships between employment and added value trends.
Source: Own made. Results of the model.
According to the evolutionary model and the «macroresults», a direct correlation between
employment and added value was showed all years from 1971 to 2012. It means that an
employment increase in the largest Spanish non-financial firms involves an added value increase,
and conversely, an employment decrease involves and added value decrease. All figures showed a
0.0 Y-intercept and a positive slope higher than 0.5; with the exception of the years 1985, 1986, and
1989 when 0.50, 0.42, and 0.41 slope values were registered, respectively. Excluding these
exceptions, all trendlines started in the bottom left corner —low employment and low added value
56 ~
Facultat d’Economia i EmpresaMàster d’Història EconòmicaTreball Final de Màster
OVERCOMING THE CRISIS: ADDED VALUE EMPLOYMENT IN LARGEST SPANISH FIRMS
JESPERGON
—, intersected the bottom right quadrant —high employment and low added value—, and finished
in the top right quadrant —high employment and high added value—.
As next figure shows, when employment was maximum —x=1 in the trendlines—, maximum
added value was in 1973, and minimum one in 1989. Six stages might be observed. Three
«progress» stages in 1971-1973, 1989-2002 and 2005-2011; and three «regression» stages in 1973-
1989, 2002-2005 and 2011-2012. These stages might concurred, or not, with some important
perturbation of the World, or the Spanish, economic history.
Figure 27. Correlation between added value and maximum employment.
Source: Own made. Results of the model.
The fifth secondary question of this study is: Does data aggregation changes results of this
study?
Yes, data aggregation changes the results of this study. Other different conclusion can be
extracted of the evolutionary ranking. Economic activities inside the bottom left quadrant got scores
above «outsiders» ones. This last conclusion is not in concordance with the idea of «synergy».
Synergy may be understood as disaggregated data generates more value than aggregated data.
According to the «macroresults», aggregation of the economic activities by quadrants shows that
bottom left quadrant get bigger results by number of economic activities, by operational revenues,
by employment, and by added value than the «outsiders» quadrants. So, the largest wealth
generating in this study is bottom left quadrant, when economic activities are aggregated by
quadrants. However, according to the evolution of the aggregated results by quadrants figure, this
quadrant has a negative apparent productivity.
~ 57 ~
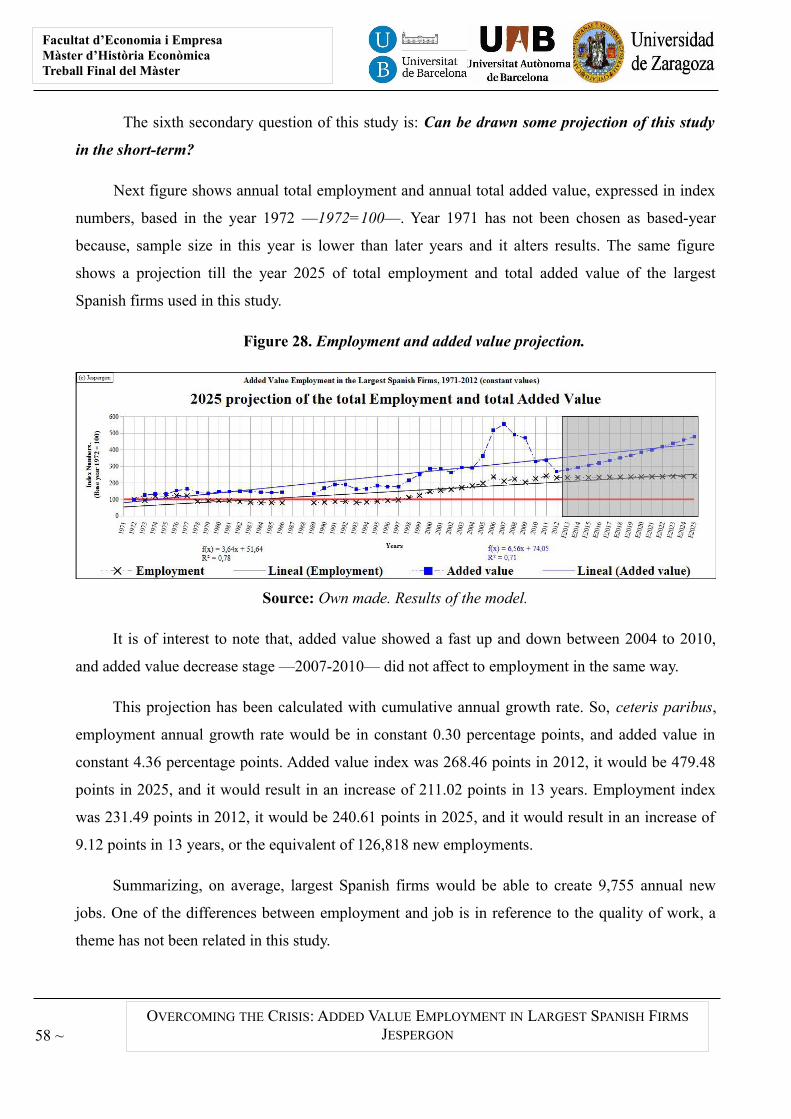
Facultat d’Economia i EmpresaMàster d’Història EconòmicaTreball Final del Màster
OVERCOMING THE CRISIS: ADDED VALUE EMPLOYMENT IN LARGEST SPANISH FIRMS
JESPERGON
The sixth secondary question of this study is: Can be drawn some projection of this study
in the short-term?
Next figure shows annual total employment and annual total added value, expressed in index
numbers, based in the year 1972 —1972=100—. Year 1971 has not been chosen as based-year
because, sample size in this year is lower than later years and it alters results. The same figure
shows a projection till the year 2025 of total employment and total added value of the largest
Spanish firms used in this study.
Figure 28. Employment and added value projection.
Source: Own made. Results of the model.
It is of interest to note that, added value showed a fast up and down between 2004 to 2010,
and added value decrease stage —2007-2010— did not affect to employment in the same way.
This projection has been calculated with cumulative annual growth rate. So, ceteris paribus,
employment annual growth rate would be in constant 0.30 percentage points, and added value in
constant 4.36 percentage points. Added value index was 268.46 points in 2012, it would be 479.48
points in 2025, and it would result in an increase of 211.02 points in 13 years. Employment index
was 231.49 points in 2012, it would be 240.61 points in 2025, and it would result in an increase of
9.12 points in 13 years, or the equivalent of 126,818 new employments.
Summarizing, on average, largest Spanish firms would be able to create 9,755 annual new
jobs. One of the differences between employment and job is in reference to the quality of work, a
theme has not been related in this study.
58 ~
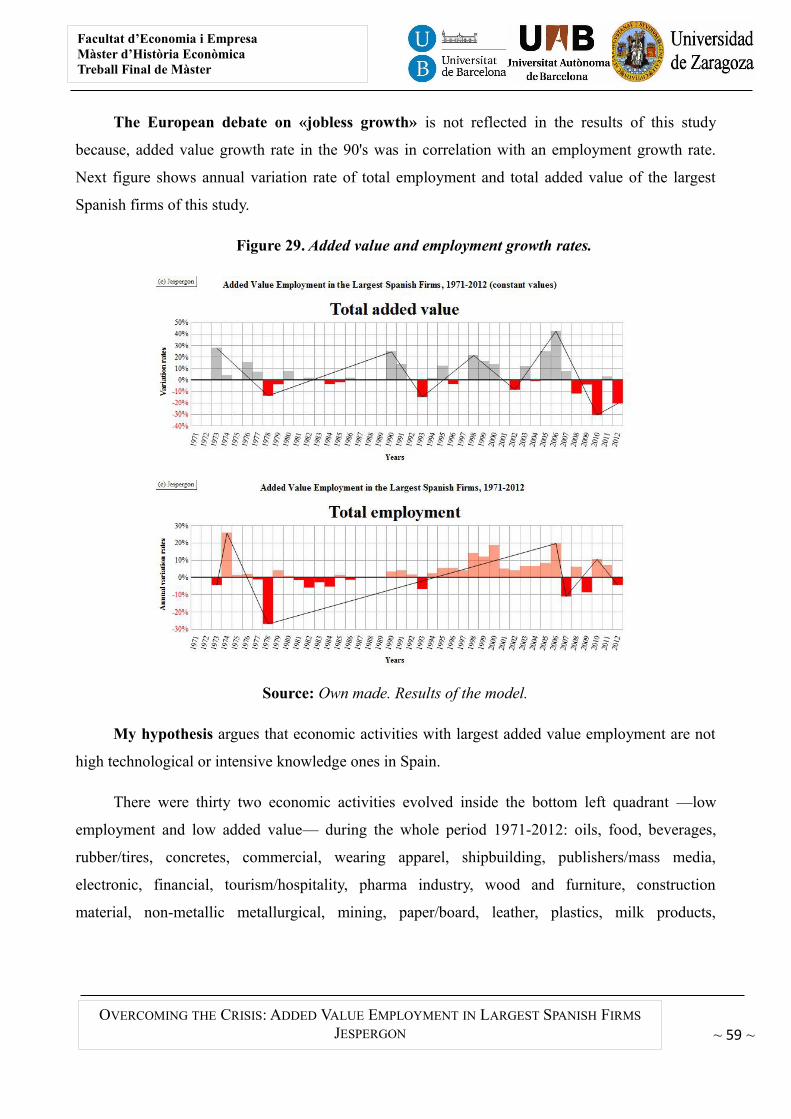
Facultat d’Economia i EmpresaMàster d’Història EconòmicaTreball Final de Màster
OVERCOMING THE CRISIS: ADDED VALUE EMPLOYMENT IN LARGEST SPANISH FIRMS
JESPERGON
The European debate on «jobless growth» is not reflected in the results of this study
because, added value growth rate in the 90's was in correlation with an employment growth rate.
Next figure shows annual variation rate of total employment and total added value of the largest
Spanish firms of this study.
Figure 29. Added value and employment growth rates.
Source: Own made. Results of the model.
My hypothesis argues that economic activities with largest added value employment are not
high technological or intensive knowledge ones in Spain.
There were thirty two economic activities evolved inside the bottom left quadrant —low
employment and low added value— during the whole period 1971-2012: oils, food, beverages,
rubber/tires, concretes, commercial, wearing apparel, shipbuilding, publishers/mass media,
electronic, financial, tourism/hospitality, pharma industry, wood and furniture, construction
material, non-metallic metallurgical, mining, paper/board, leather, plastics, milk products,
~ 59 ~
Facultat d’Economia i EmpresaMàster d’Història EconòmicaTreball Final del Màster
OVERCOMING THE CRISIS: ADDED VALUE EMPLOYMENT IN LARGEST SPANISH FIRMS
JESPERGON
insurance, textile, glass, holding, advertising agencies, commercial pharma, appliances, computer,
engineering, perfumes/detergents, and commercial vehicles.
This result is partially in concordance with Mario Pianta because, traditional industries are
showed in the bottom left quadrant —low employment and low added value— but, high technology
activities —pharma industry, appliances and electronic— and intensive knowledge ones —
financial, insurance, computer, and engineering— are observed.
There were nine economic activities evolved inside the top right quadrant —high employment
and high added value— in some year of the period 1971-2012: various, construction and real-estate,
electrical equipment, big stores, steel industry, transports, vehicles, utilities, and telecom and
Internet. This result is partially in concordance with Mario Pianta because, ICT industries are
showed in the top rigth quadrant —high employment and high added value— but, others non-ICT
industries are observed.
Medium-high technology activities —electrical equipment and vehicles— and intensive
knowledge one —telecom and Internet— were showed in the top right quadrant .
There were four economic activities that evolved outside the bottom left and the top right
quadrants, the bottom right one —high employment and low added value— and the top left one —
low employment and high added value— in some year of the period 1971-2012: chemical, electric
power, mechanical industry, and petroleum.
There was no intensive knowledge economic activity in the top left and bottom right
quadrants, but medium-high technology activities —chemical and mechanical industry— were
showed.
Summarizing, as next figure shows, three high technology and four intensive knowledge
activities were in the bottom left quadrant during the period 1971-2012, two medium-high
technology and one intensive knowledge activities were some year in the top right quadrant, and
two medium-high technology activities were some year in the top left or bottom right quadrants. So,
my hypothesis has resulted failed because, medium-high technology and intensive knowledge
activities were observed in the top right quadrant.
60 ~
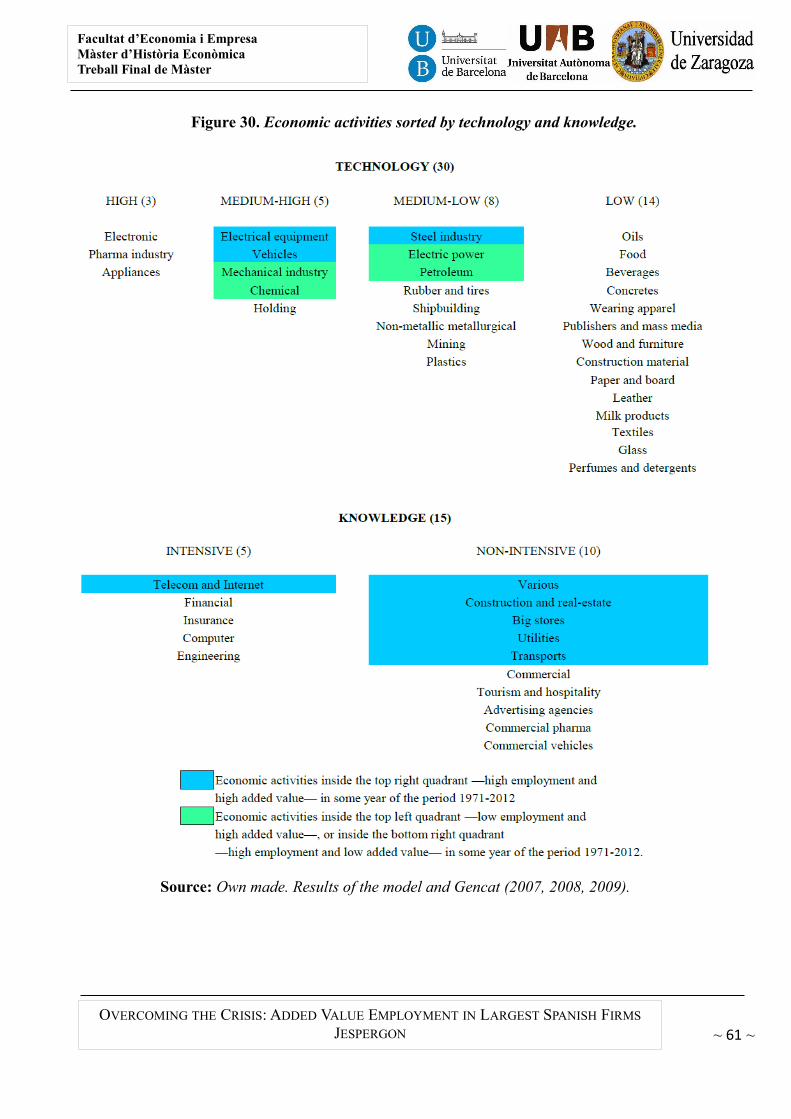
Facultat d’Economia i EmpresaMàster d’Història EconòmicaTreball Final de Màster
OVERCOMING THE CRISIS: ADDED VALUE EMPLOYMENT IN LARGEST SPANISH FIRMS
JESPERGON
Figure 30. Economic activities sorted by technology and knowledge.
Source: Own made. Results of the model and Gencat (2007, 2008, 2009).
~ 61 ~
Facultat d’Economia i EmpresaMàster d’Història EconòmicaTreball Final del Màster
OVERCOMING THE CRISIS: ADDED VALUE EMPLOYMENT IN LARGEST SPANISH FIRMS
JESPERGON
5. Conclusions
Previous conclusions show that, there were nine economic activities with some data registered
inside the top right quadrant —high employment and high added value—: steel industry, transports,
vehicles, construction and real-estate, electrical equipment, utilities, telecom and Internet, big
stores, and various. Medium-high and medium-low technology activities —electrical equipment and
vehicles, and steel industry, respectively—, and non-intensive knowledge ones —various,
construction and real-estate, big stores, utilities and transports— were observed in this quadrant.
There were thirteen «outsiders» economic activities —outside the bottom left quadrant—: the
before ones related and; mechanical industry and chemical —medium-high technology activities—,
and electric power and petroleum —medium-low technology activities—. All high technology —
electronic, pharma industry, and appliances—, and intensive knowledge activities —financial,
insurance, computer, and engineering—, with the exception of telecom and Internet, were observed
in the bottom left quadrant —low employment and low added value—.
The basic evolutionary dynamic patterns more observed was «continuous path» and, the blend
one, this pattern in combination with «cumulus». Employment and added value trends more
observed was «regression». The relationship between employment and added value trends more
observed was «parallelism».
Summarizing, as global conclusion, a continuous parallel regression path might be observed
in the largest Spanish firms from 1971 to 2012.
However, there are expectations. There was one economic activity with only added value
«progress» trend: petroleum; and, there were four ones with an employment and added value
«progress» trend: various, big stores, and utilities and telecom/Internet. All these last ones showed a
«divergence» relationship between employment and added value trends: various and big stores with
employment trend higher than added value one; and, conversely, utilities and telecom/Internet with
added value trend higher than employment one.
Seven economic activities were top one in the wealth generating —as sum of employment and
added value— in some year from 1971 to 2012: electric power, transports, construction and real-
estate, vehicles, utilities, telecom and Internet, and big stores. All those with a presence in top right
62 ~
Facultat d’Economia i EmpresaMàster d’Història EconòmicaTreball Final de Màster
OVERCOMING THE CRISIS: ADDED VALUE EMPLOYMENT IN LARGEST SPANISH FIRMS
JESPERGON
quadrant, with the exception of electric power that belong to top left one. Top one wealth generating
—according to this study definition— during the period 1971-2012 were largest Spanish firms of
the «construction and real-estate» economic activity.
Is interesting to note that, though construction and real-estate showed a fast decreased added
value from 2007 to 2012 —0.9 points in quadrant positioning in the evolutionary model—,
employment decreased only 0.2 points. It is caused by the subcontracting system of the largest
Spanish construction firms. About 90% employees in a building or civil engineering were
subcontracted. So, bursting of the Spanish housing bubble in 2007 36 has affected much more
medium and small indirect companies in the construction sector than big business.
Three economic activities were maximum added value in some year in this study: electric
power, utilities, and telecom and Internet. And, other three different ones were maximum
employment: transports, construction and real-estate, and big stores. Only three economic activities
showed a «progress» trend: big stores, utilites, and telecom/Internet. Big stores had an employment
trend higher than added value trend, and utilities and telecom/Internet had an added value trend
higher than added value trend. Big stores and utilities are non-intensive knowledge activity, and
telecom/Internet is intensive one.
Summarizing, as global conclusion, expectations in short-term are high added value in non-
intensive knowledge utilities and intensive knowledge telecom/Internet, and high employment in
non-intensive knowledge big stores.
However, projection of total employment and total added value of the largest Spanish firms of
this study shows, ceteris paribus, scarce 126,818 new jobs could be created from 2012 to 2025.
This new employment volume is only 2.09 percentage points 37 or 2.17 percentage points 38 of the
2013 Spanish unemployment harmonized annual volume.
36: Domínguez, Gonzalo Bernardos (2009). Creación y destrucción de la burbuja inmobiliaria en España. Información Comercial Española, ICE: Revista de economía, (850), 23-40. <http://www.revistasice.com/cachepdf/ICE_850_23-40__D61AD153DA611CB998035C2497D74303.pdf>. [Accessed May 4, 2014].
37: According to Eurostats. “Harmonised unemployment rates (%) - monthly data (ei_lmhr_m), Spain 1986-2013”.<http://appsso.eurostat.ec.europa.eu/nui/show.do?dataset=ei_lmhr_m&lang=en>. [Accessed April 18, 2014].
38: According to OECD. “Short-Term Labour Market Statistics: Harmonised Unemployment Rates (HURs), Spain
1987-2013”. <http://stats.oecd.org/index.aspx?queryid=36324>. [Accessed March 2, 2014].
~ 63 ~
Facultat d’Economia i EmpresaMàster d’Història EconòmicaTreball Final del Màster
OVERCOMING THE CRISIS: ADDED VALUE EMPLOYMENT IN LARGEST SPANISH FIRMS
JESPERGON
6. Future research
Mission of this study has been carried out because evolutionary model has been constructed,
results have been showed and, questions have been answered. Of course, these results open a wide
range of new value-added knowledge. First one is analysis of the results of the evolutionary model.
Second one may be studies of individual largest business, a geographical pattern one, an
international comparison one, or an evolutionary dynamic patterns one.
This study is part of a project called Overcoming the Crisis: Techno Unemployment in Spain
in the long-term. It tries to answer the question: What technical change is necessary for that an
unemployed, that wish to work, find a job? The next step in this major study would be carry out
it for the United States because he is the technological leader. The comparison between United
States and Spain would show that Spain has «techno unemployment».
This study is part of a big project called Overcoming the Crisis that try to explain the more
severe social consequences of the «Great Recession» for Spain: the unemployment.
The aim of this study is to present an EU project in the Horizon 2020 programme for getting
research funds.
7. References
Carreras, Albert & Tafunell, Xavier (1999). “Spain: Big manufacturing firms between state and market, 1917-1990”. In: Chandler Jr., Alfred D.; Amatori, Franco & Hikino, Takashi (eds.).Big Business and the Wealth of Nations. New York: Cambridge University Press (first paperback edition: 1999).
Daems, Herman (1987). “The Size of the Firm: Theoretical and Empirical Reflections on European Industrial Hierarchies”. In: Fondazione Assi. Piccola e grande impresa: un problema storico. Milano: Franco Angeli Libri.
64 ~
Facultat d’Economia i EmpresaMàster d’Història EconòmicaTreball Final de Màster
OVERCOMING THE CRISIS: ADDED VALUE EMPLOYMENT IN LARGEST SPANISH FIRMS
JESPERGON
De Chernatony, Leslie; Harris, Fiona & Dall'Olmo Riley, Francesca (2000). Added value: its nature,roles and sustainability [open access in Scholar Google]. European Journal of marketing, 34(1/2), 39-56.
Fomento de la producción (1970). Las 400 mayores empresas industriales en España. Fomento de la producción, 608 (November 15, 1971).
——— (1971). Las 700 mayores empresas industriales en España. Fomento de la producción, 627 (October 1, 1972).
——— (1972). Las 1.000 mayores empresas industriales en España. Fomento de la producción, 648 (September 15, 1973).
——— (1973). Estudio de las mayores 1.000 empresas españolas. Fomento de la producción, 671 (October 1, 1974).
——— (1974). Estudio de las mayores 1.500 empresas españolas. Fomento de la producción, (October 15, 1975).
——— (1975, 1976, 1977, 1978, 1979, 1980, 1981). Las 1.500 mayores empresas españolas. Fomento de la producción, (October 15, 1976), 738 (October 15, 1977), 758 (October, 1978), 779 (October, 1979), (September, 1980), (September, 1981), (September, 1982) respectively.
——— (1982). Las 1.800 mayores empresas españolas. Fomento de la producción, (September, 1983).
——— (1983, 1984, 1985, 1986, 1997, 1998, 1999, 2000, 2001, 2002, 2003, 2004, 2005, 2006). Las 2.000 mayores empresas españolas. Fomento de la producción, 883 (September, 1984), 904 (September, 1985), (September, 1986), (September, 1987), (October, 1998), (October, 1999), (October, 2000), (October, 2001), (October, 2002), (October, 2003), (October, 2004), 1249 (October, 2005), 1261 (October, 2006), 1273 (October, 2007) respectively.
——— (1987, 1988, 1989, 1990, 1991, 1992, 1993, 1994, 1995, 1996). Las 2.500 mayores empresas españolas. Fomento de la producción, (September, 1988), (September, 1989), (October, 1990), 1024 (October, 1991), (October, 1992), (October, 1993), (October, 1994), (October, 1995), (October, 1996), (October, 1997) respectively.
——— (1988, 2000, 2008, 2009, 2010, 2011). España 25.000. Fomento de la producción. CD-Rom.
——— (1995, 1997, 2001, 2005). España 30.000. Fomento de la producción. CD-Rom.
——— (2007). España 27.000. Fomento de la producción. CD-Rom.
——— (2008). “Dossier. Las primeras empresas españolas en 2008”. Fomento de la producción, 1232, 23-41.
~ 65 ~
Facultat d’Economia i EmpresaMàster d’Història EconòmicaTreball Final del Màster
OVERCOMING THE CRISIS: ADDED VALUE EMPLOYMENT IN LARGEST SPANISH FIRMS
JESPERGON
——— (2009). “Dossier. Las primeras empresas españolas en 2009”. Fomento de la producción, 1295, 17-23.
——— (2010). “Dossier. Las primeras empresas españolas en 2010”. Fomento de la producción, 1306, 15-21.
——— (2011). “Dossier. Las primeras empresas españolas en 2011”. Fomento de la producción, 1317, 21-28.
——— (2012). “Dossier. Las primeras empresas españolas en 2012”. Fomento de la producción, 1327, 19-26.
Gallizo Larraz, José Luis (2000a). “I. Concepto de Valor Añadido” [open access online]. In: El Estado de Valor Añadido. Zaragoza: 5campus.com. Financial Accounting. <http://www.ciberconta.unizar.es/leccion/cf009/100.htm>. [Accessed July 8, 2014].
Gencat (2007, 2008, 2009). Ocupació en activitats d'alt valor afegit [open access online]. Service studies and statistics of the Labor Department of the Generalitat de Catalunya. March, 2007. <http://www.gencat.cat/treball/doc/doc_11057951_1.pdf>. March, 2008. <http://www.gencat.cat/treball/doc/doc_45309089_1.pdf>. September, 2009. <http://observatoriempresaiocupacio.gencat.cat/web/.content/generic/documents/treball/estudis/ocupacio_alt_valor_afegit/2009/arxiu/ni_ocupacio_valor_afegit_setembre_09.pdf>. [Accessed June 21, 2014].
Nicolau, Roser (2005). “Capítulo 2. Población, salud y actividad”. In: Carreras, Albert & Tafunell, Xavier (coord.). Estadísticas históricas de España: siglos XIX-XX. Bilbao: Fundación BBVA (second revised and enlarged edition), pp. 77-154.
Pianta, Mario (2003). “Innovation and Employment” [open access online]. In: Fagerberg, J.; Mowery, D. & Nelson, R. (eds.). Handbook of Innovation. Oxford University Press (forth. edition). <http://www.epoc.uni-bremen.de/publications/pup2003/files/Brussels_Pianta_2003.PDF>. [Accessed February 5, 2014].
Rodríguez Nuño, Vicente (2011). Comportamiento de empleo y del VAB en treinta ramas de actividad de la economía española en 2009 [open access online]. Economic Bulletin of the Spanish Commercial Information, 3010 (April 2011), 3-12. <http://www.revistasice.com/BICE/April2011/3010.pdf>. [Accessed July 16, 2014].
Sánchez, Joan-Eugeni (1998). La Gran Empresa en España. Un proceso de dependencia y concentración. Madrid: Consejo Económico y Social (Colección Estudios, 55).
Viet, Vu Quang (2009). GDP by production approach: A general introduction with emphasis on anintegrated economic data collection framework [open access online]. New York: UnitedNations Statistics Division. <http://unstats.un.org/unsd/China_UNSD_Project/GDP%20by%20production%20approach.pdf>. [Accessed June 20, 2014].
66 ~
Facultat d’Economia i EmpresaMàster d’Història EconòmicaTreball Final de Màster
OVERCOMING THE CRISIS: ADDED VALUE EMPLOYMENT IN LARGEST SPANISH FIRMS
JESPERGON
APPENDIX
Annual results of the evolutionary model.
~ 67 ~
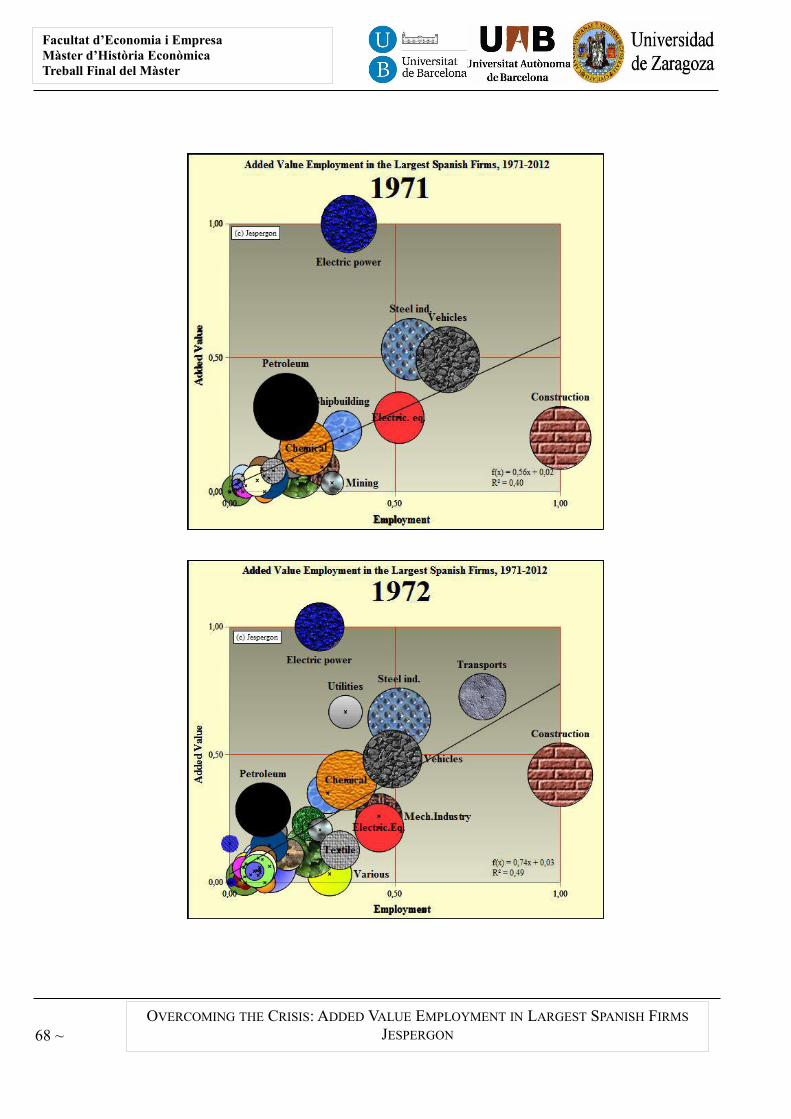
Facultat d’Economia i EmpresaMàster d’Història EconòmicaTreball Final del Màster
OVERCOMING THE CRISIS: ADDED VALUE EMPLOYMENT IN LARGEST SPANISH FIRMS
JESPERGON 68 ~
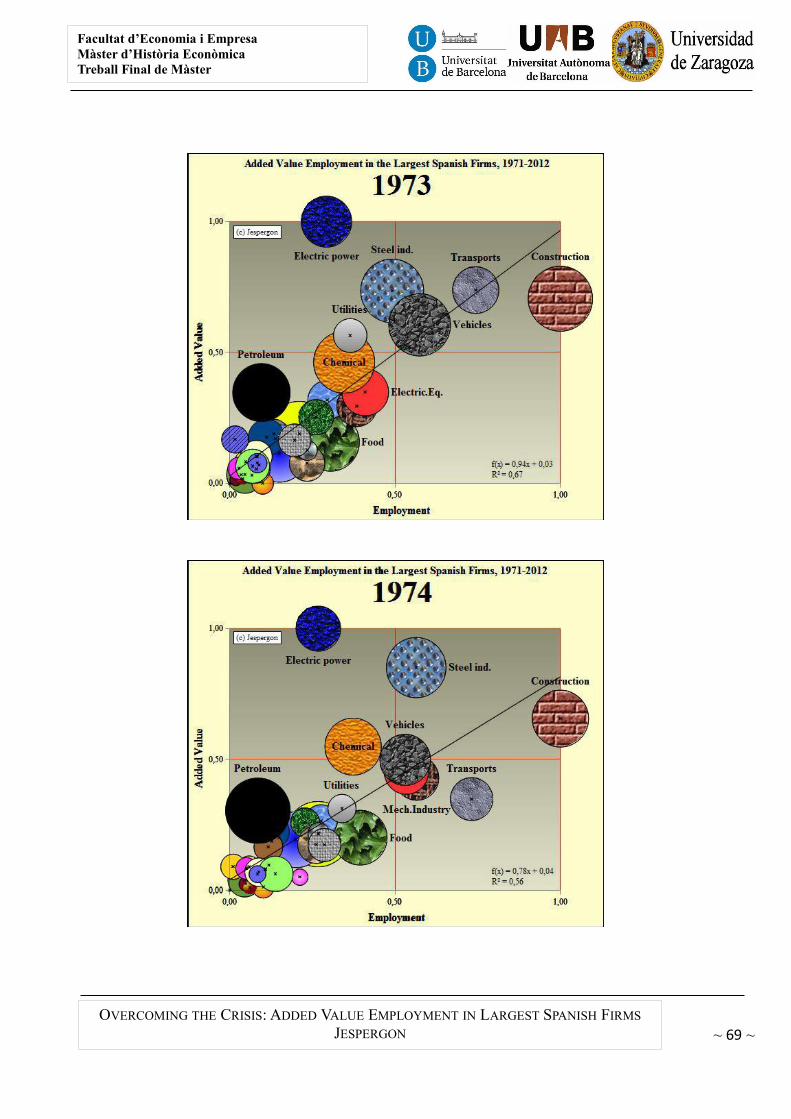
Facultat d’Economia i EmpresaMàster d’Història EconòmicaTreball Final de Màster
OVERCOMING THE CRISIS: ADDED VALUE EMPLOYMENT IN LARGEST SPANISH FIRMS
JESPERGON ~ 69 ~
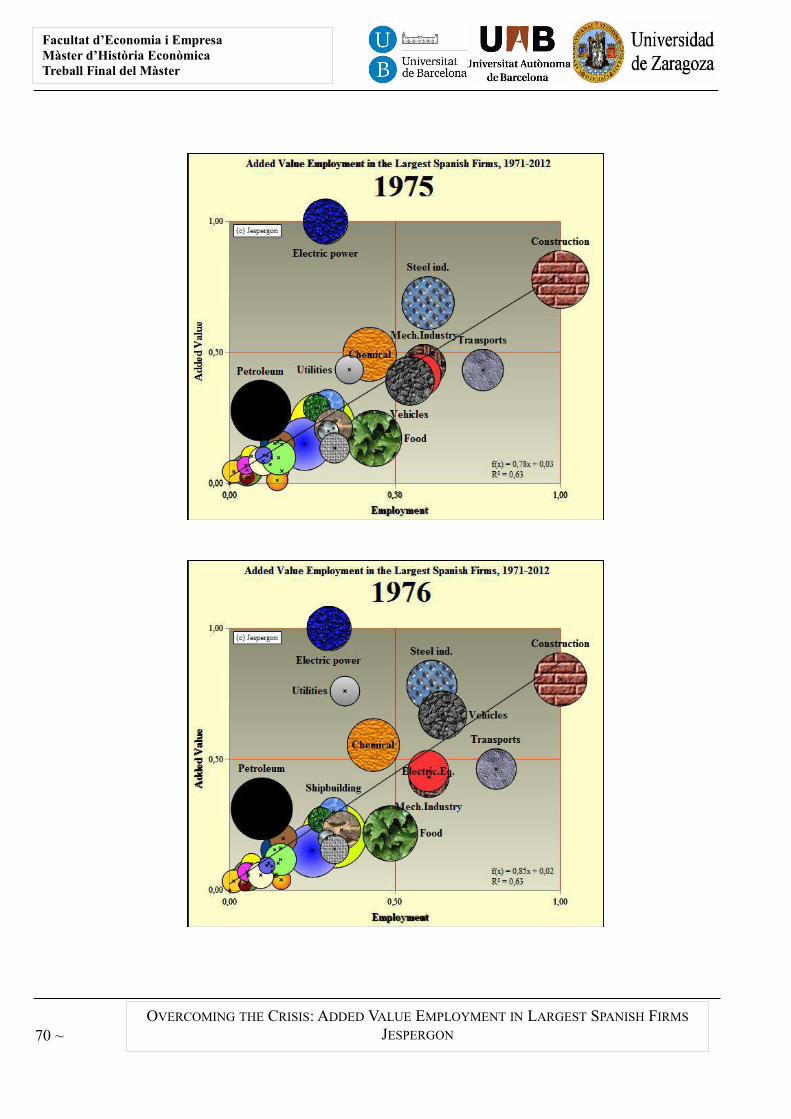
Facultat d’Economia i EmpresaMàster d’Història EconòmicaTreball Final del Màster
OVERCOMING THE CRISIS: ADDED VALUE EMPLOYMENT IN LARGEST SPANISH FIRMS
JESPERGON 70 ~
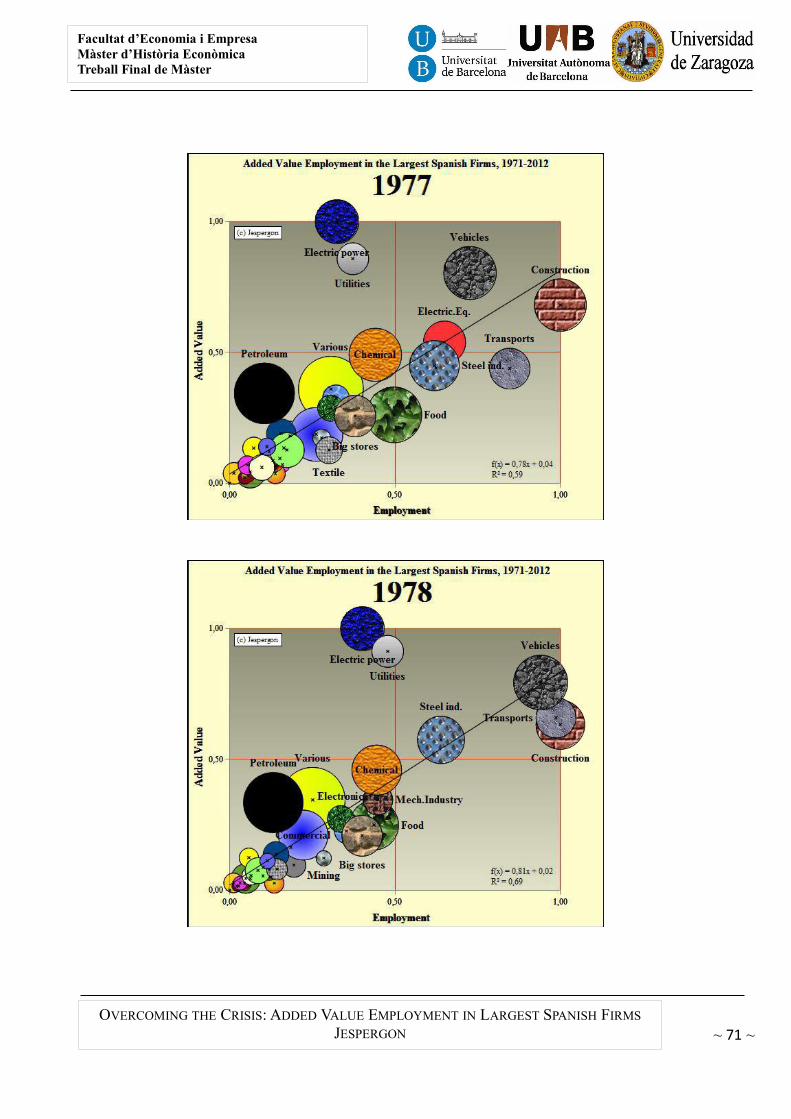
Facultat d’Economia i EmpresaMàster d’Història EconòmicaTreball Final de Màster
OVERCOMING THE CRISIS: ADDED VALUE EMPLOYMENT IN LARGEST SPANISH FIRMS
JESPERGON ~ 71 ~
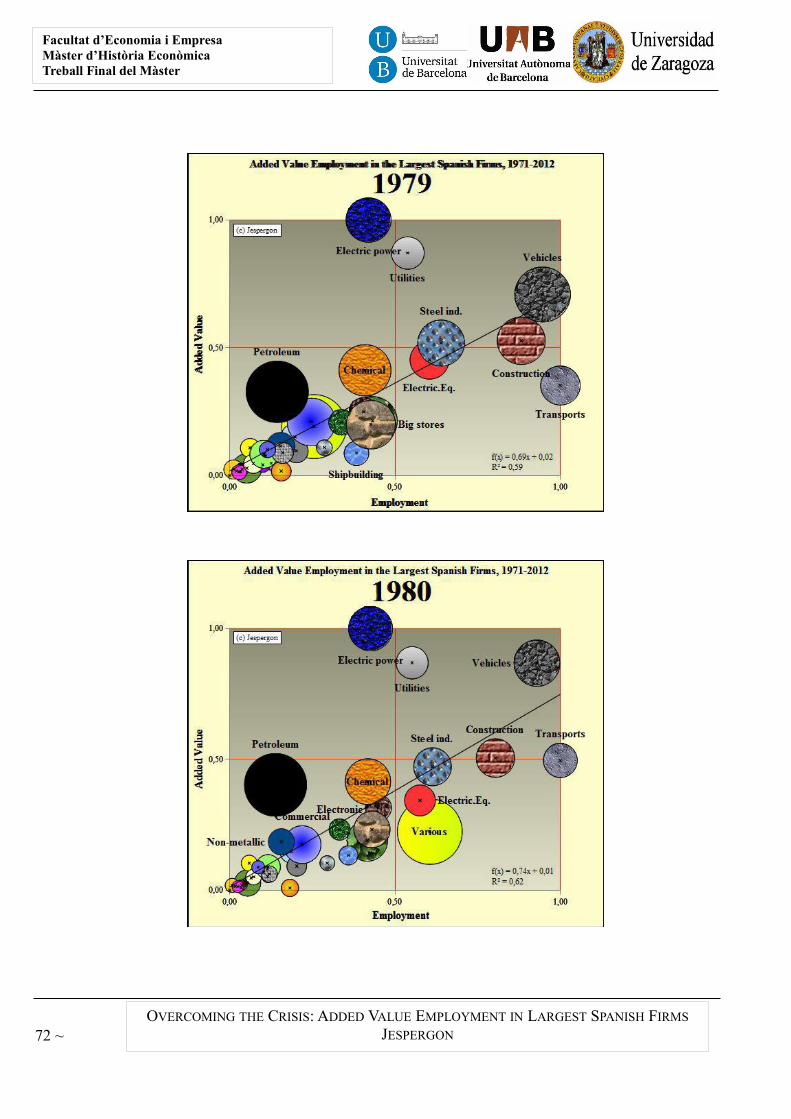
Facultat d’Economia i EmpresaMàster d’Història EconòmicaTreball Final del Màster
OVERCOMING THE CRISIS: ADDED VALUE EMPLOYMENT IN LARGEST SPANISH FIRMS
JESPERGON 72 ~
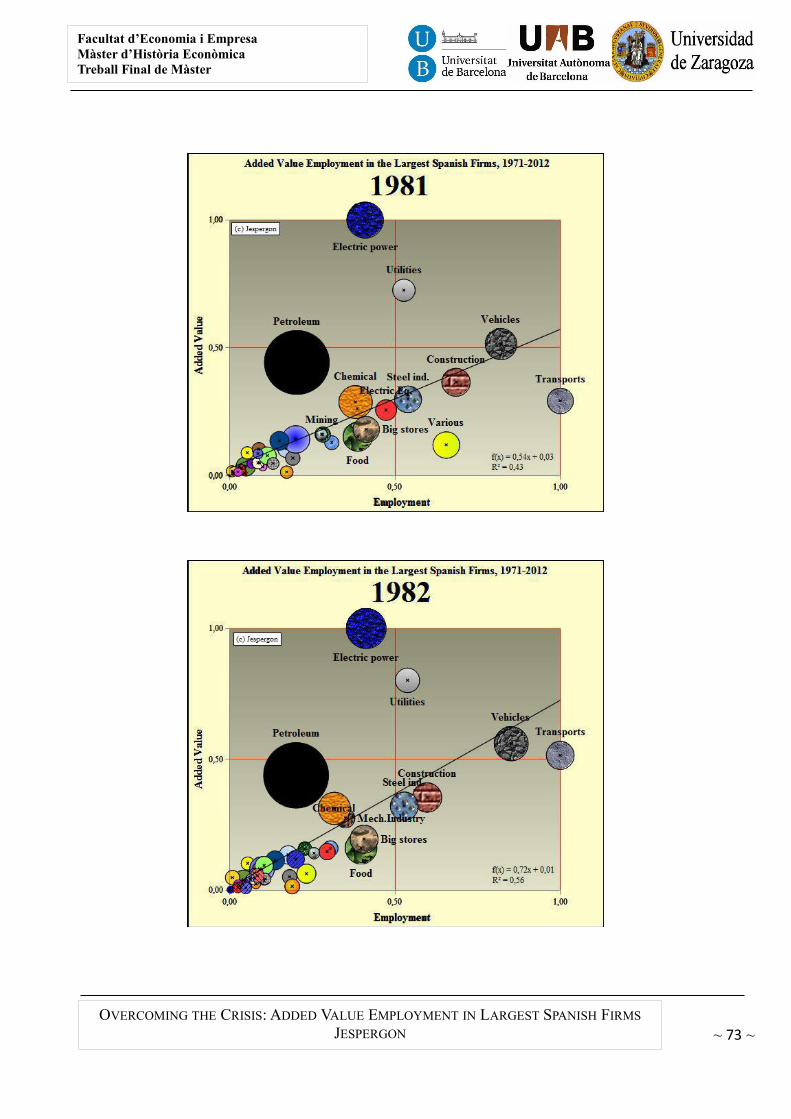
Facultat d’Economia i EmpresaMàster d’Història EconòmicaTreball Final de Màster
OVERCOMING THE CRISIS: ADDED VALUE EMPLOYMENT IN LARGEST SPANISH FIRMS
JESPERGON ~ 73 ~
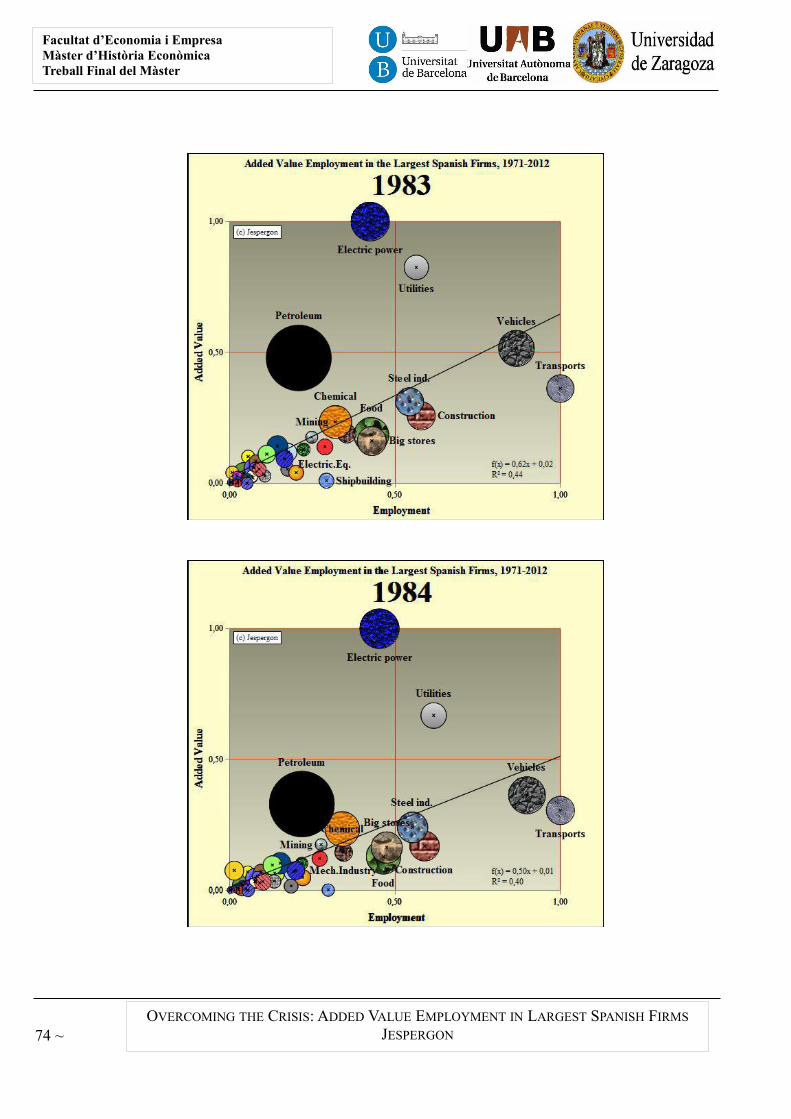
Facultat d’Economia i EmpresaMàster d’Història EconòmicaTreball Final del Màster
OVERCOMING THE CRISIS: ADDED VALUE EMPLOYMENT IN LARGEST SPANISH FIRMS
JESPERGON 74 ~
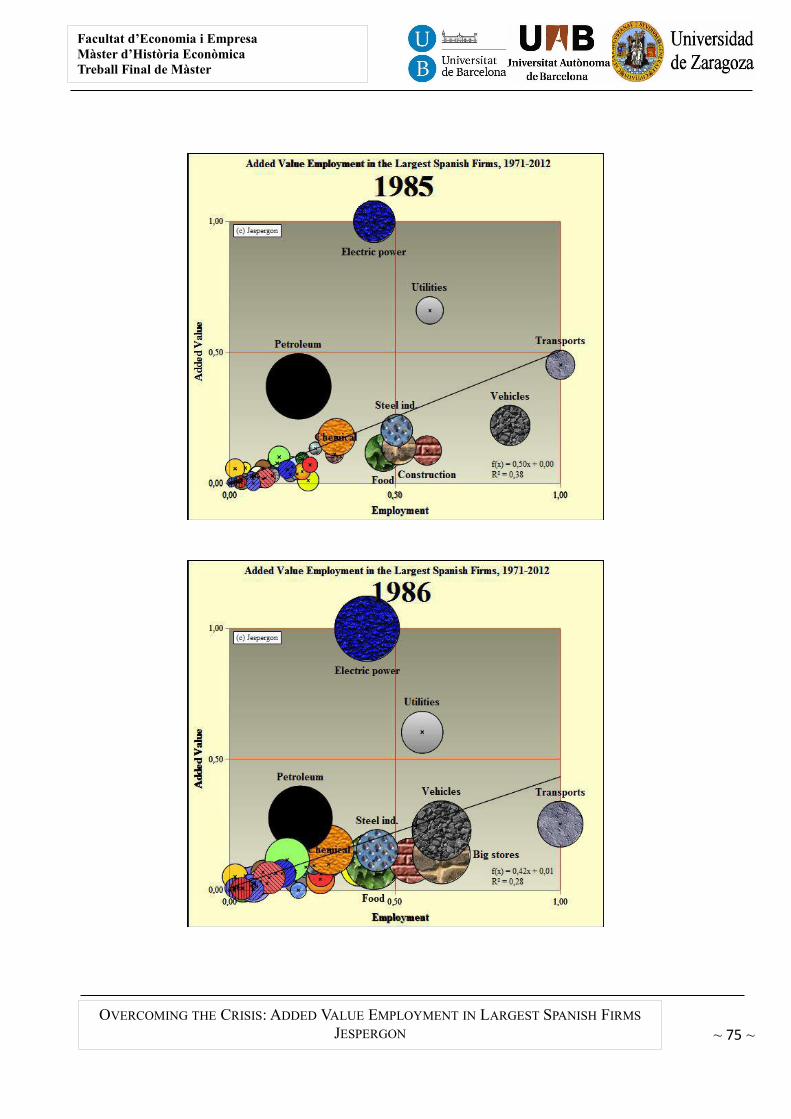
Facultat d’Economia i EmpresaMàster d’Història EconòmicaTreball Final de Màster
OVERCOMING THE CRISIS: ADDED VALUE EMPLOYMENT IN LARGEST SPANISH FIRMS
JESPERGON ~ 75 ~
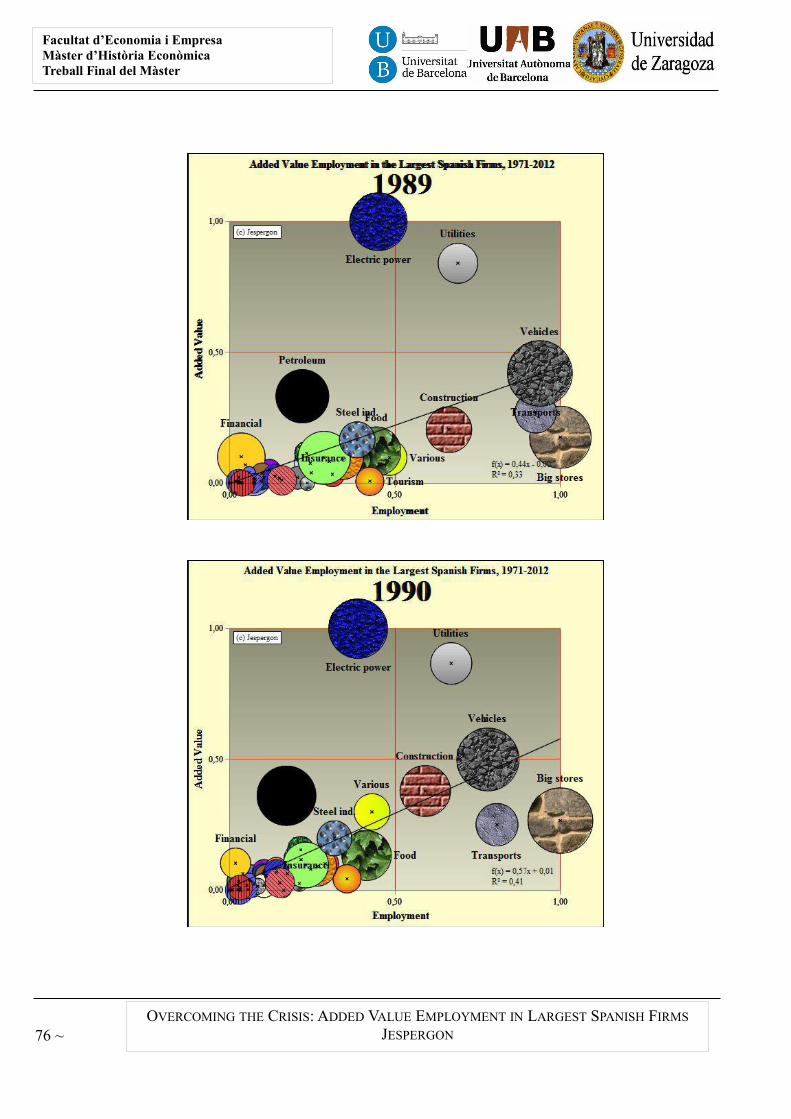
Facultat d’Economia i EmpresaMàster d’Història EconòmicaTreball Final del Màster
OVERCOMING THE CRISIS: ADDED VALUE EMPLOYMENT IN LARGEST SPANISH FIRMS
JESPERGON 76 ~
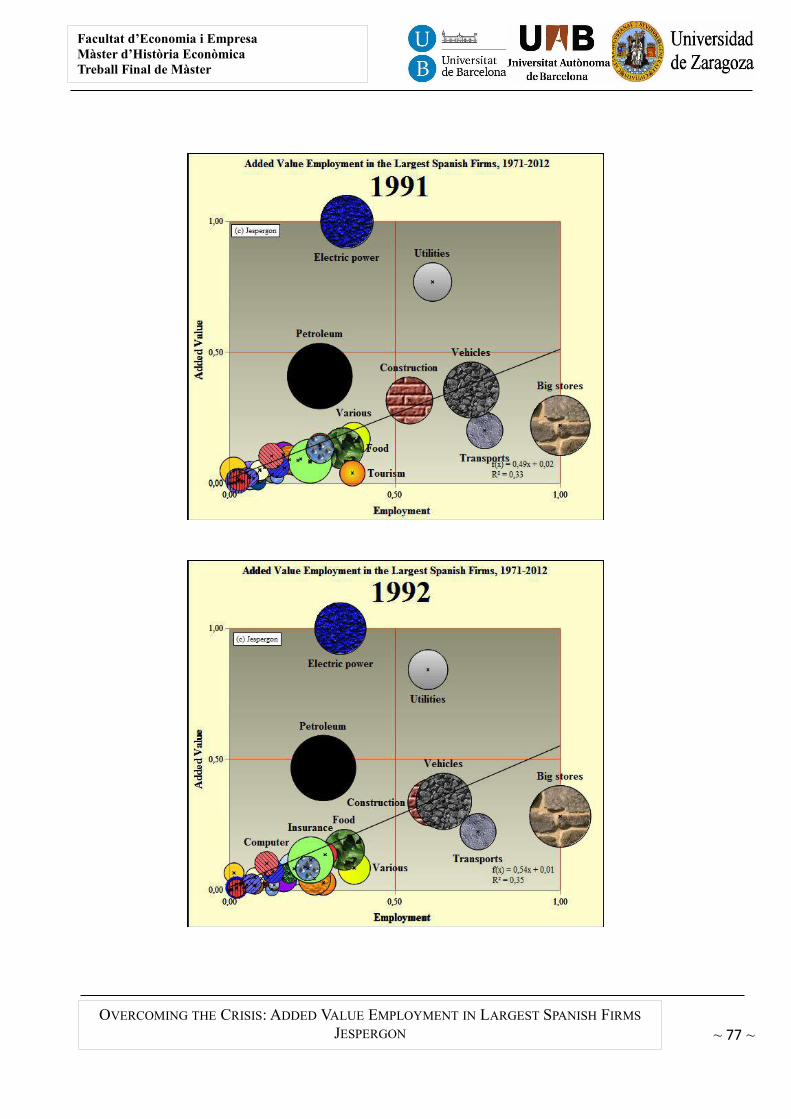
Facultat d’Economia i EmpresaMàster d’Història EconòmicaTreball Final de Màster
OVERCOMING THE CRISIS: ADDED VALUE EMPLOYMENT IN LARGEST SPANISH FIRMS
JESPERGON ~ 77 ~
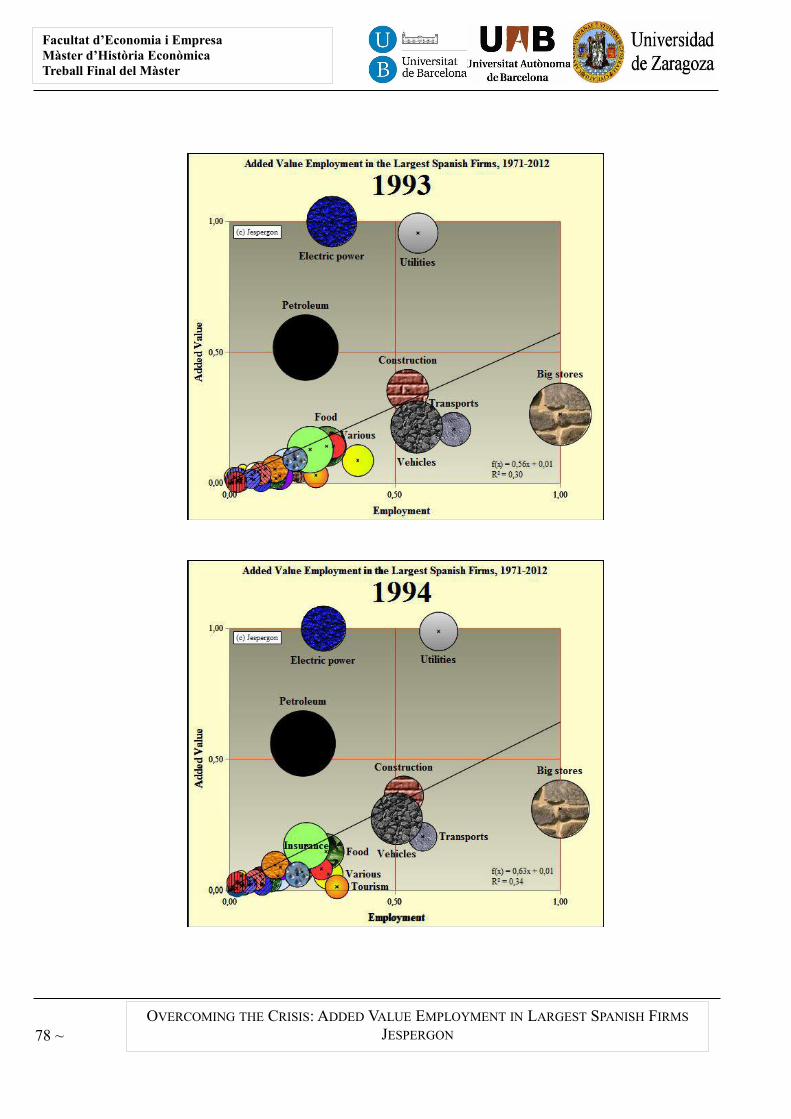
Facultat d’Economia i EmpresaMàster d’Història EconòmicaTreball Final del Màster
OVERCOMING THE CRISIS: ADDED VALUE EMPLOYMENT IN LARGEST SPANISH FIRMS
JESPERGON 78 ~
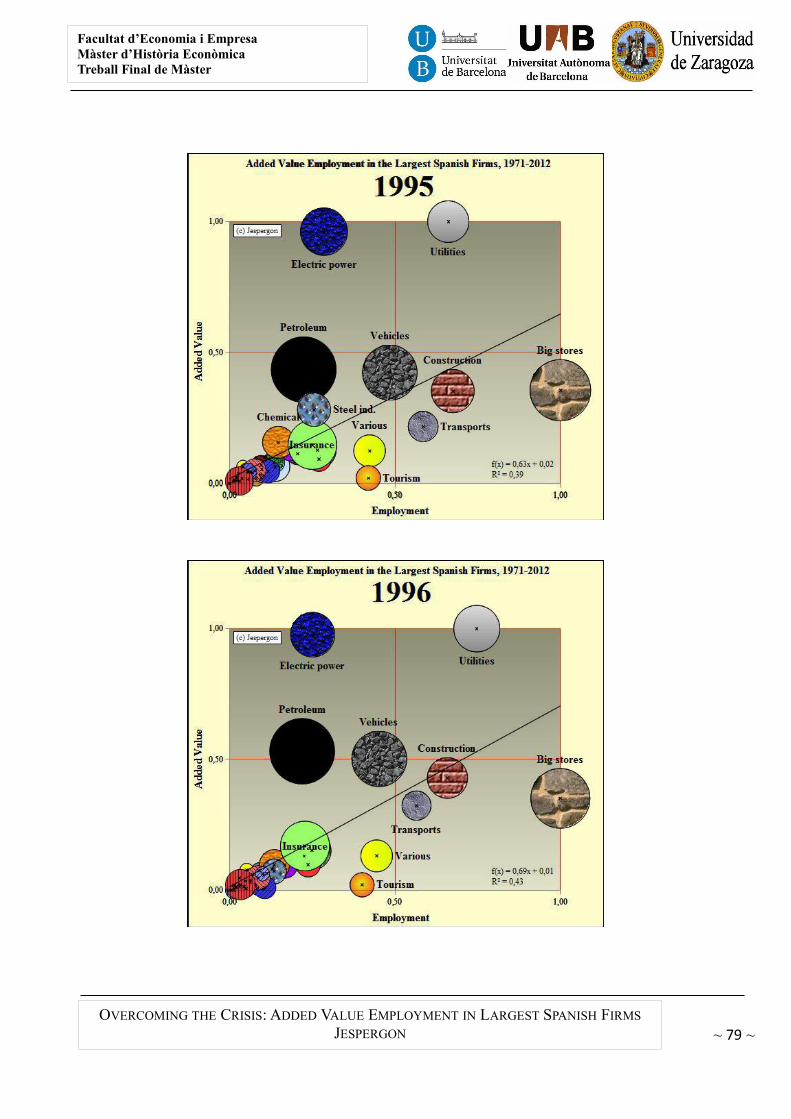
Facultat d’Economia i EmpresaMàster d’Història EconòmicaTreball Final de Màster
OVERCOMING THE CRISIS: ADDED VALUE EMPLOYMENT IN LARGEST SPANISH FIRMS
JESPERGON ~ 79 ~
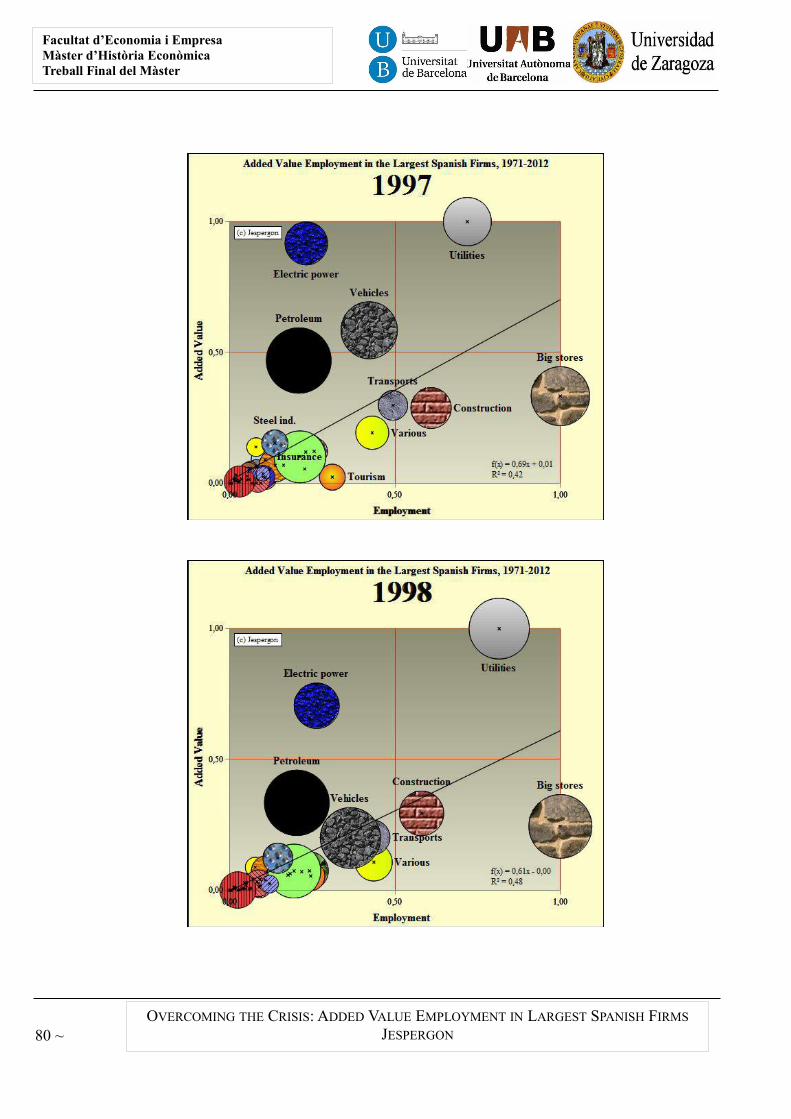
Facultat d’Economia i EmpresaMàster d’Història EconòmicaTreball Final del Màster
OVERCOMING THE CRISIS: ADDED VALUE EMPLOYMENT IN LARGEST SPANISH FIRMS
JESPERGON 80 ~
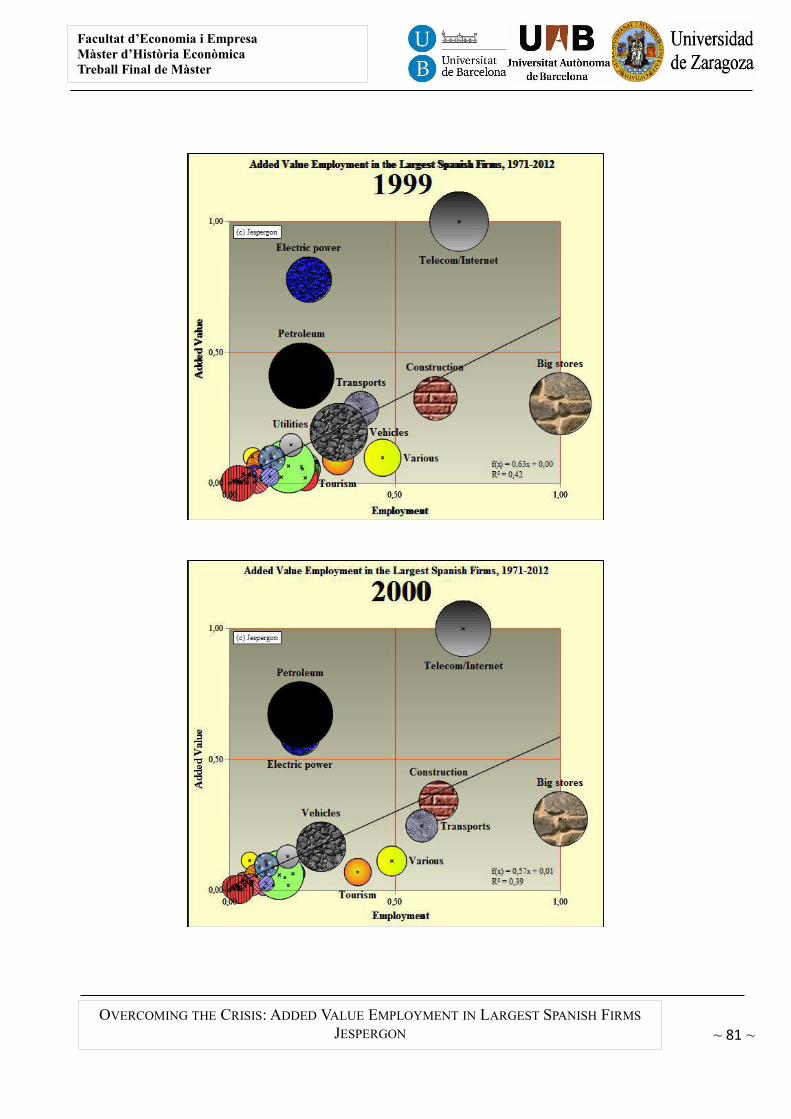
Facultat d’Economia i EmpresaMàster d’Història EconòmicaTreball Final de Màster
OVERCOMING THE CRISIS: ADDED VALUE EMPLOYMENT IN LARGEST SPANISH FIRMS
JESPERGON ~ 81 ~
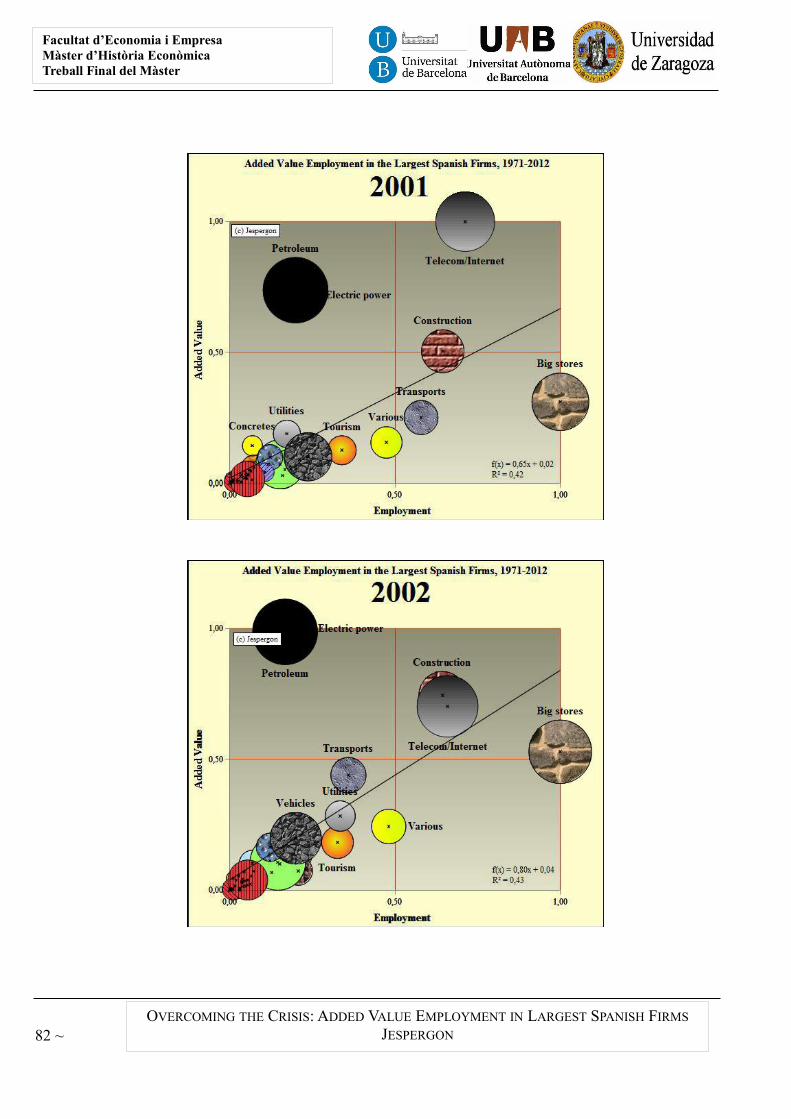
Facultat d’Economia i EmpresaMàster d’Història EconòmicaTreball Final del Màster
OVERCOMING THE CRISIS: ADDED VALUE EMPLOYMENT IN LARGEST SPANISH FIRMS
JESPERGON 82 ~
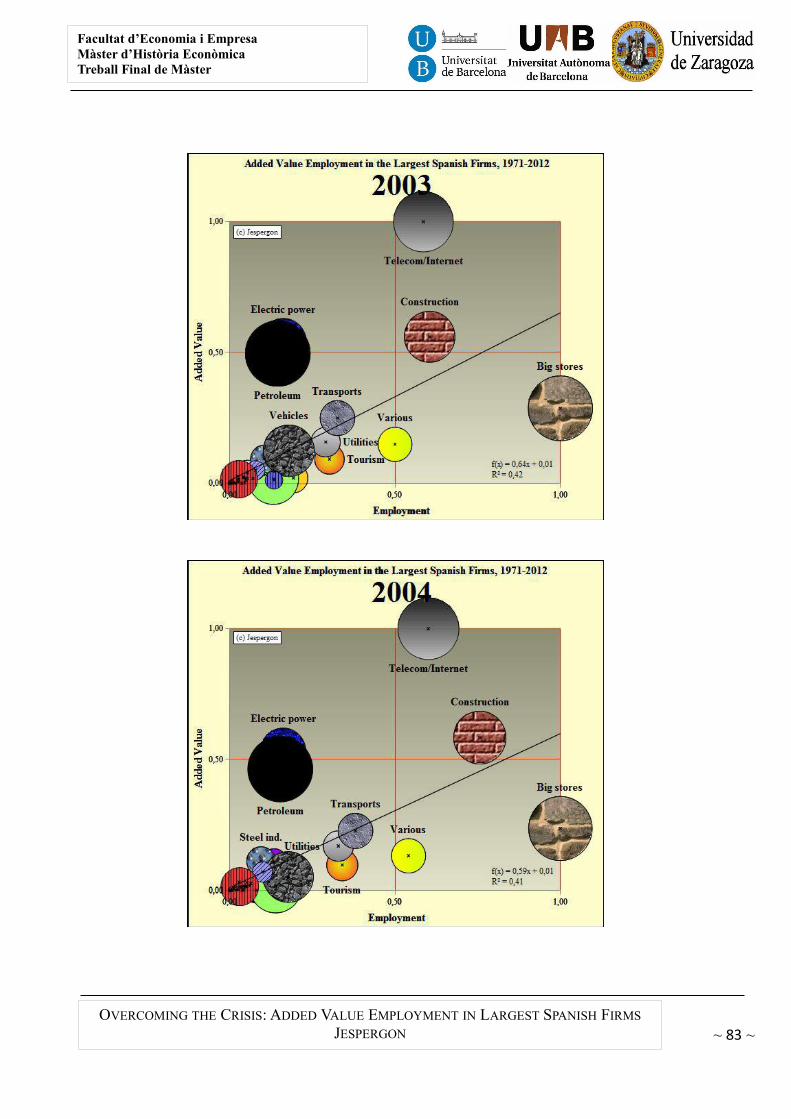
Facultat d’Economia i EmpresaMàster d’Història EconòmicaTreball Final de Màster
OVERCOMING THE CRISIS: ADDED VALUE EMPLOYMENT IN LARGEST SPANISH FIRMS
JESPERGON ~ 83 ~
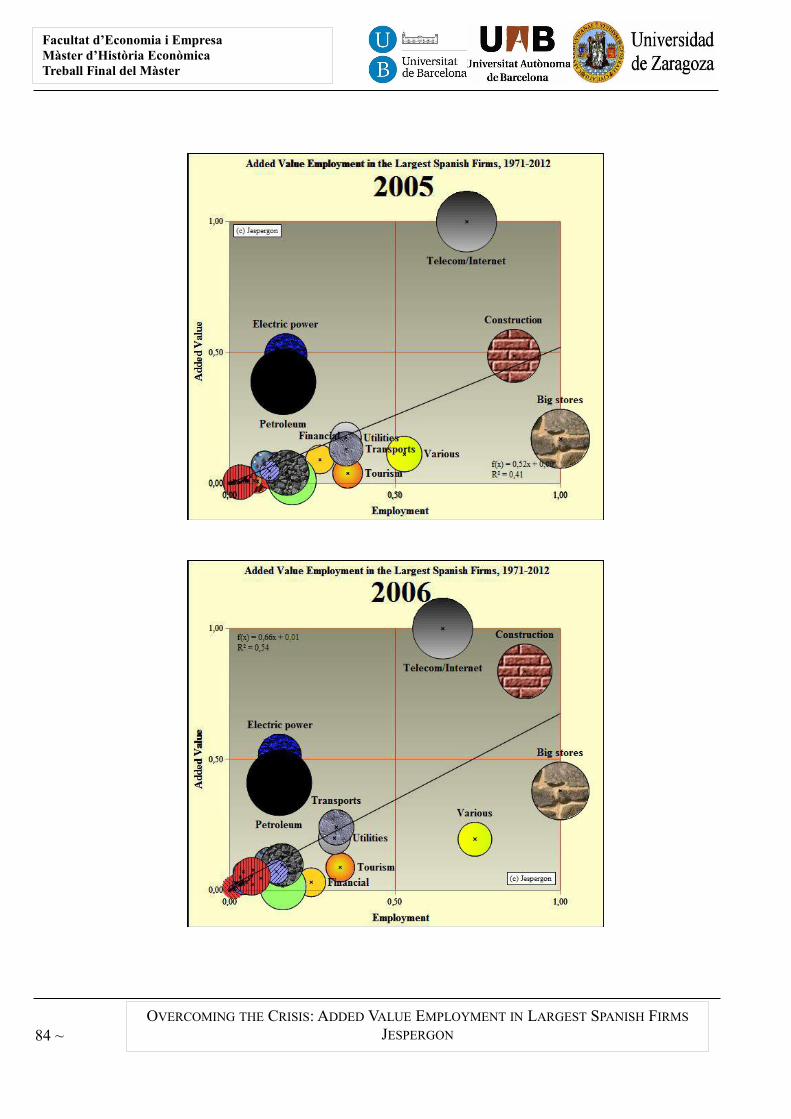
Facultat d’Economia i EmpresaMàster d’Història EconòmicaTreball Final del Màster
OVERCOMING THE CRISIS: ADDED VALUE EMPLOYMENT IN LARGEST SPANISH FIRMS
JESPERGON 84 ~
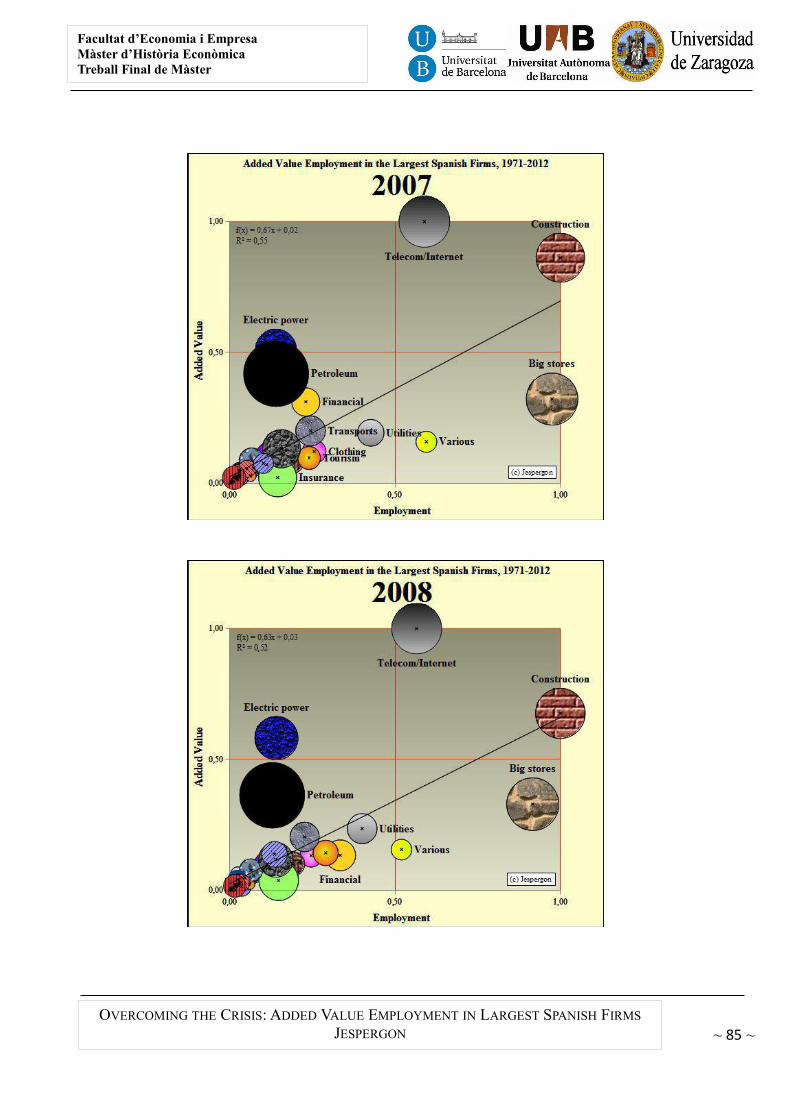
Facultat d’Economia i EmpresaMàster d’Història EconòmicaTreball Final de Màster
OVERCOMING THE CRISIS: ADDED VALUE EMPLOYMENT IN LARGEST SPANISH FIRMS
JESPERGON ~ 85 ~
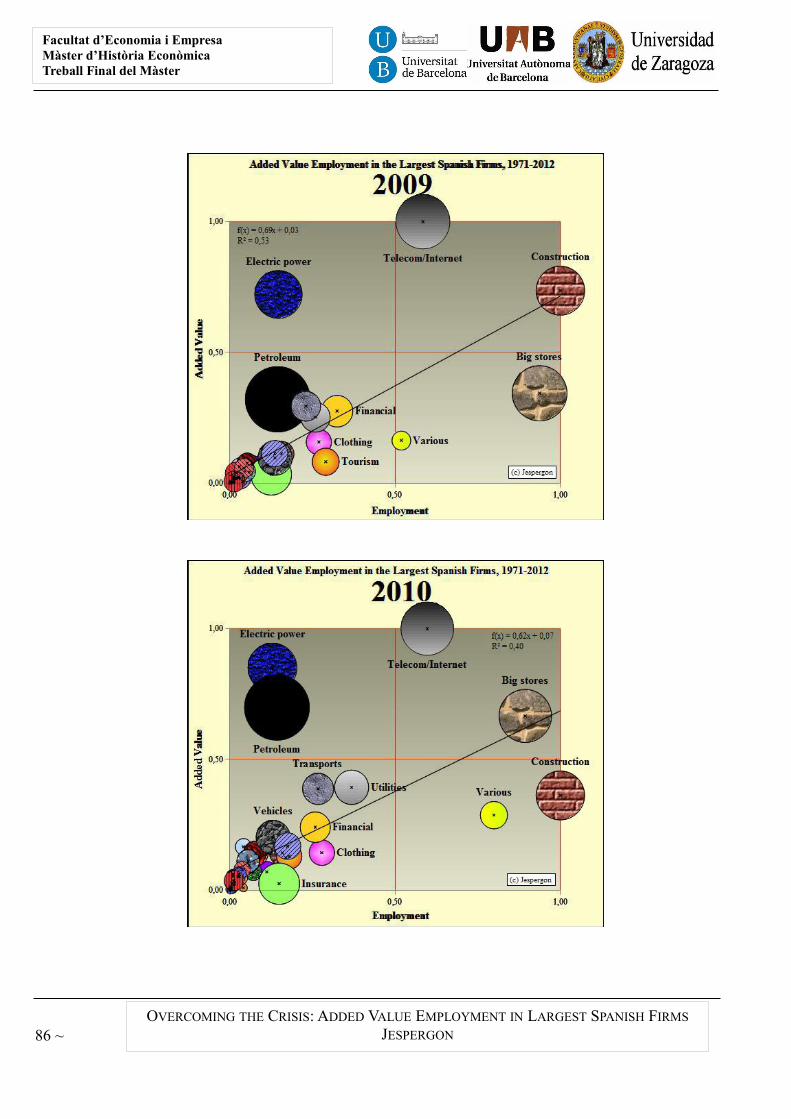
Facultat d’Economia i EmpresaMàster d’Història EconòmicaTreball Final del Màster
OVERCOMING THE CRISIS: ADDED VALUE EMPLOYMENT IN LARGEST SPANISH FIRMS
JESPERGON 86 ~
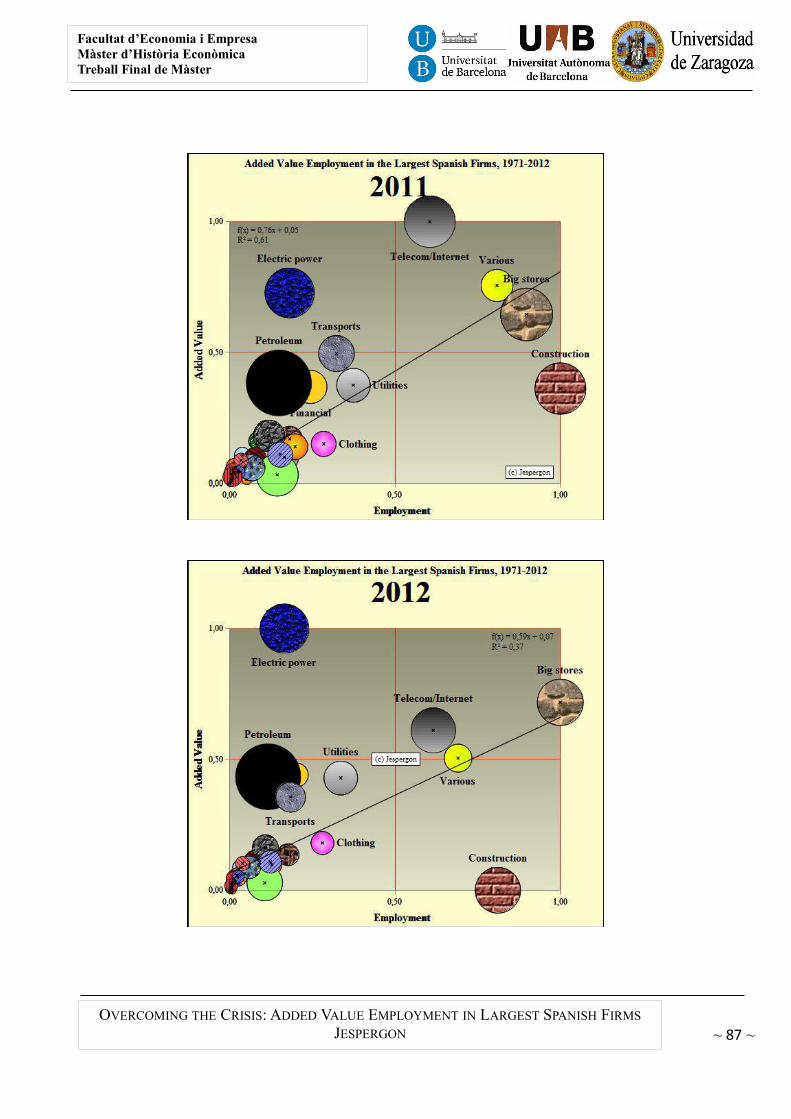
Facultat d’Economia i EmpresaMàster d’Història EconòmicaTreball Final de Màster
OVERCOMING THE CRISIS: ADDED VALUE EMPLOYMENT IN LARGEST SPANISH FIRMS
JESPERGON ~ 87 ~