Embed Size (px)
Citation preview

Ulster Bank Northern Ireland Purchasing Managers Index (PMI)
Includes analysis of Global, Eurozone, UK, UK Regions, NI &
Republic of Ireland economic performance by sector
May 2015 Survey Update
Issued 8th
June 2015
Richard Ramsey Chief Economist Northern Ireland
www.ulstereconomix.com [email protected]
Twitter @UB_Economics

PMI SurveysPurchasing Managers’
Indexes (PMIs) are monthly surveys of private sector companies
which provide an advance indication of what is happening in the private sector economy
by tracking variables such as output, new orders, employment and
prices across different
sectors.
Index numbers are calculated from the percentages of respondents
reporting an
improvement, no change or decline on the previous month. These indices vary from 0 to
100 with readings of 50.0 signalling no change on the previous month. Readings above
50.0 signal an increase or improvement; readings below 50.0 signal a decline or
deterioration. The greater the divergence from 50.0 the greater
the rate of change
(expansion or contraction). The indices are seasonally adjusted
to take into consideration
expected variations for the time of year, such as summer shutdowns or holidays.
< 50.0 = Contraction 50.0 = No Change > 50.0 = Expansion
Data at a sector level are more volatile and 3‐month moving averages
have been used to
more accurately identify the broad trends.
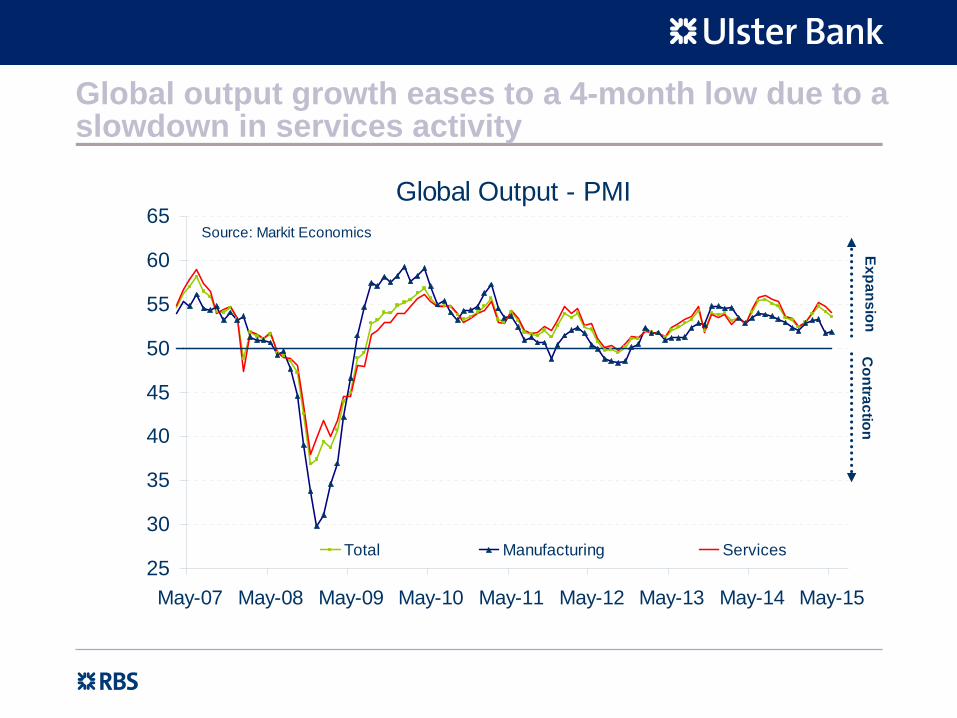
Global output growth eases to a 4-month low due to a slowdown in services activity
Global Output - PMI
25
30
35
40
45
50
55
60
65
May-07 May-08 May-09 May-10 May-11 May-12 May-13 May-14 May-15
Total Manufacturing Services
Source: Markit Economics
ExpansionC
ontraction

EZ manufacturing & services sectors growth eases slightly with retail returning to growth for the 1st time in 14mths
Eurozone PMIs: Output
25
30
35
40
45
50
55
60
65
May-07 May-08 May-09 May-10 May-11 May-12 May-13 May-14 May-15
Composite (M&S) Manufacturing Services
Construction Retail No Change
Source: Markit Economics Expansion
Contraction

The Eurozone’s composite PMI signals economic growth rate rising in H1 2015
EZ GDP versus EZ Composite PMIComposite excludes construction
20
30
40
50
60
70
2007 Q2 2009 Q2 2011 Q2 2013 Q2 2015 Q2*
PMI Index
-3-2.5-2-1.5-1-0.500.511.52
GDP % Q/Q
GDP Q/Q PMI
Source: Bloomberg & Markit Economic, * PMI refers to average for April & May
EZ Q1-15 GDP 0.4%

The RoI is ranked 1st in terms of manufacturing output growth performance again in May
PMIs: Manufacturing Output May 2015
35 40 45 50 55 60 65
BrazilIndonesia
S.KoreaGreeceFrance
DenmarkTaiwan
ChinaRussia
S.AfricaTurkey
SingaporeCanada
SwitzerlandJapanGlobal
GermanyN.Zealand*
AustriaUK
AustraliaEUEZNI
MexicoPoland
IndiaUS
Czech RepublicNetherlands
VietnamItaly
SpainIreland
Source: Markit Economics Output Indices, *March
UK, RoI & NI
€

The Republic of Ireland, Spain & the UK posted the fastest rates of service sector output growth in May
PMIs: Services Output May 2015
35 40 45 50 55 60 65
BrazilAustralia
IndiaJapan
Emerging MarketsItaly
RussiaFrance
GermanyChina
EZGlobal
EUDeveloped Markets
NIUS*UK
SpainIreland
Source: Markit Economics Output Indices
€

Ireland & France saw growth accelerate in May whereas other economies reported a slowdown
Composite PMIs (Manufacturing & Services ** Excludes Construction**)
25
30
35
40
45
50
55
60
65
May-07 May-08 May-09 May-10 May-11 May-12 May-13 May-14 May-15
Source: Markit Economics PMIs
Contraction
Expansion

US, EZ, UK & China PMIs posted a slowdown in growth in May. Japan saw a pick-up in its growth rate
Composite PMIs (Manufacturing & Services ** Excludes Construction**)
30
35
40
45
50
55
60
65
May-08 May-09 May-10 May-11 May-12 May-13 May-14 May-15
Eurozone US (Markit) China Japan UK
Source: Markit Economics PMIs, US begins Jul-11
ExpansionC
ontraction

All manufacturing PMIs improved in May relative to April
Manufacturing PMIs
25
30
35
40
45
50
55
60
65
May-08 May-09 May-10 May-11 May-12 May-13 May-14 May-15
US (ISM) China Japan Eurozone No Change
Source: Markit Economics
Contraction
Expansion

Diverging Emerging Markets performance with Russia improving but Brazil’s recession deepens
Composite PMIs (Manufacturing & Services ** Excludes Construction**)
30
35
40
45
50
55
60
65
May-07 May-08 May-09 May-10 May-11 May-12 May-13 May-14 May-15
Brazil Russia India Emerging Markets
Source: Markit Economics
Contraction
Expansion

Australia’s services & manufacturing sectors on opposite sides of the 50 threshold in May
Australia - PMI
30
35
40
45
50
55
60
65
May-07 May-09 May-11 May-13 May-15
Manufacturing Services No Change
Source: Markit Economics PMIs
Contraction
Expansion

NI posts its fastest rate of output growth in 7 months but continues to lag behind the UK & RoI
Private Sector Business Activity - PMIs
30
35
40
45
50
55
60
65
May-03 May-05 May-07 May-09 May-11 May-13 May-15
NI UK RoI
Source: Markit & Ulster Bank NI PMI50 = threshold between expansion / contraction
Expansion
Contraction
**PMI Surveys Exclude Agriculture & Public Sector**

PMI suggests growth in DFP’s private sector composite index throughout 2014 but recovery stalls in H1 2015
NI Private Sector Output Index Versus NI PMI
-6-5-4-3-2-1
012345
2005 Q2 2007 Q2 2009 Q2 2011 Q2 2013 Q2 2015 Q2*
NICEI Q/Q%
30
35
40
45
50
55
60
65PMI NICEI Left Hand Scale PMI Right Hand Scale
Source: DFP NI Composite Economic Index (NICEI) & Ulster Bank / Markit Economics NI PMI,Q2 2014 is latest data for NICEI.*Q2 refers to average of April & May for the PMI only
50 mark is the threshold for expansion / contraction with PMI Expansion
Contraction

2014 was the first year in 7 years that business activity, new orders, employment & export orders all expanded
NI Private Sector Performance (PMI)
30
35
40
45
50
55
60
2007 2008 2009 2010 2011 2012 2013 2014
PMI Index
Business Activity New Orders Employment Export Orders ExpansionC
ontraction
Source: Markit Economics & Ulster Bank NI

NI recovery took hold in H2-13, all indicators improved in H1- 14 & eased in H2-14. Exports & business activity fell in H1-15
NI Private Sector Performance (PMI)
30
35
40
45
50
55
60
65
2006
H220
07H1
2007
H220
08H1
2008
H220
09H1
2009
H220
10H1
2010
H220
11H1
2011
H220
12H1
2012
H220
13H1
2013
H220
14H1
2014
H220
15H1*
PMI Index
Business Activity New Orders Employment Export Orders
ExpansionC
ontraction
Source: Markit Economics & Ulster Bank NI PMI, * refers to 5 months to May 2015

NI firms report a marked pick-up in business activity and new orders with employment growth continuing
NI Private Sector ActivityMonthly
30
35
40
45
50
55
60
65
70
May-03 May-05 May-07 May-09 May-11 May-13 May-15
Business Activity New Business Employment
Source: Markit Economics & Ulster Bank NI PMI
ExpansionC
ontraction
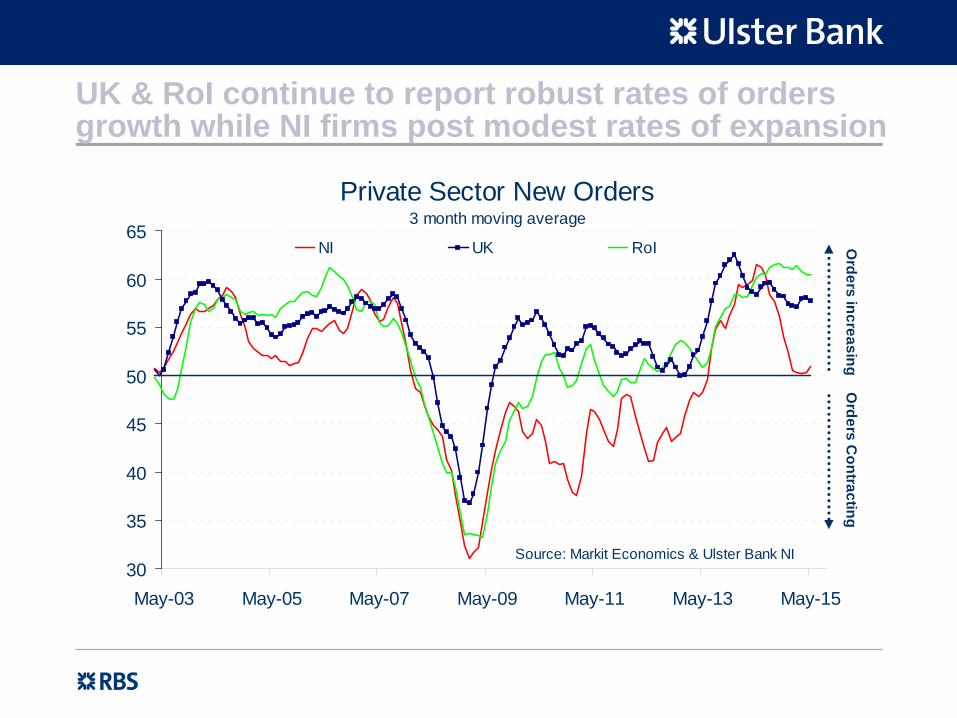
UK & RoI continue to report robust rates of orders growth while NI firms post modest rates of expansion
Private Sector New Orders3 month moving average
30
35
40
45
50
55
60
65
May-03 May-05 May-07 May-09 May-11 May-13 May-15
NI UK RoI
Source: Markit Economics & Ulster Bank NI
Orders increasing
Orders C
ontracting

Backlogs of work continue to grow in the UK & RoI but NI posts an 8th month of contraction
Private Sector Backlogs3 month moving average
30
35
40
45
50
55
60
May-03 May-05 May-07 May-09 May-11 May-13 May-15
NI UK RoI
Source: Markit Economics & Ulster Bank NI PMI
Increasing D
ecreasing

Export orders flat or falling in each of the last 7 months with £/€ exchange rate impacting on price competitiveness
NI New Export BusinessMonthly
20
30
40
50
60
70
May-03 May-05 May-07 May-09 May-11 May-13 May-15
New Export Orders No Change
Source: Markit Economics & Ulster Bank NI PMI
Expansion
Contraction

PMI signals fastest rate of jobs growth in 7yrs in Q2 but rate of jobs growth eases sharply in H2-14 but rebounds in H1-15
NI Employment: PMI v QES**
35
40
45
50
55
60
2005 Q2 2007 Q2 2009 Q2 2011 Q2 2013 Q2 2015 Q2*
PMI Index
-1.5%
-1.3%
-1.0%
-0.8%
-0.5%
-0.3%
0.0%
0.3%
0.5%
0.8%
1.0%Q/Q
PMI Employment Index No Change QES Q/Q
**QES is DFP's official Quarterly Employment Survey of the number of jobs in NI & includes public sector
Discontinuity in QES Series
Job Losses
Job gains
Source: DFP, Ulster Bank & Markit Economics, PMI Index 50.0 denotes threshold between expansion / contraction. * average of April & May for PMI only

RoI firms report a pick-up in employment growth in May with NI & UK maintaining their April rates of growth
Private Sector Employment LevelsMonthly
30
35
40
45
50
55
60
May-03 May-05 May-07 May-09 May-11 May-13 May-15
NI UK RoI
Source: Markit Economics & Ulster Bank NI
Job Gains
Job Losses

Inflationary pressures remain subdued but have been picking up whereas output prices continue to fall
NI Private Sector Profit Squeeze3 Month Moving Average
30
40
50
60
70
80
May-03 May-05 May-07 May-09 May-11 May-13 May-15
Output Prices Input Prices No Change
InflationD
eflation
Source: Markit Economics & Ulster Bank NI PMI
Profits squeeze
Price of goods & services rising

Regional Comparisons

All UK regions report output growth in May
Output / Business ActivityMay 2015
50 = No change
60.9
52.751.9
55.8
40
45
50
55
60
65
NE Wal East Lon UK NW SE SW WM EM Y&H NI Scot RoI
PMI Index
ExpansionC
ontraction
Source: Markit Economics & Ulster Bank NI PMI

Most of the UK regions posted strong rates of growth over the last 3 months but rates of growth weak for Scotland & NI
Output / Business Activity 3 months to May 2015
50 = No change
57.5
60.1
50.7
40
45
50
55
60
65
Lon NE Wal SE WM UK East Y&H NW SW EM Scot NI RoI
PMI Index
Source: Markit Economics & Ulster Bank NI PMI
Expansion
Contraction

The RoI reported the fastest rate of growth in business activity over the last 12 months & Scotland the slowest
Output / Business Activity12 months to May 2015
50 = No change
53.2
57.6
60.4
44
47
50
53
56
59
62
65
NE Wal Lon SE WM East UK Y&H NW EM SW NI Scot RoI
PMI Index
ExpansionC
ontractionSource: Markit Economics & Ulster Bank NI PMI

The RoI posts the fastest rate of employment growth while Scotland records the slowest pace of job creation
Employment LevelsMay 2015
50 = No change
51.6
53.0
59.8
52.7
55.7
46
48
50
52
54
56
58
60
62
East Wal SW NW WM UK Lon Y&H EM NI SE NE Scot RoI
PMI Index
IncreasingD
ecreasing
Source: Markit Economics & Ulster Bank NI PMI
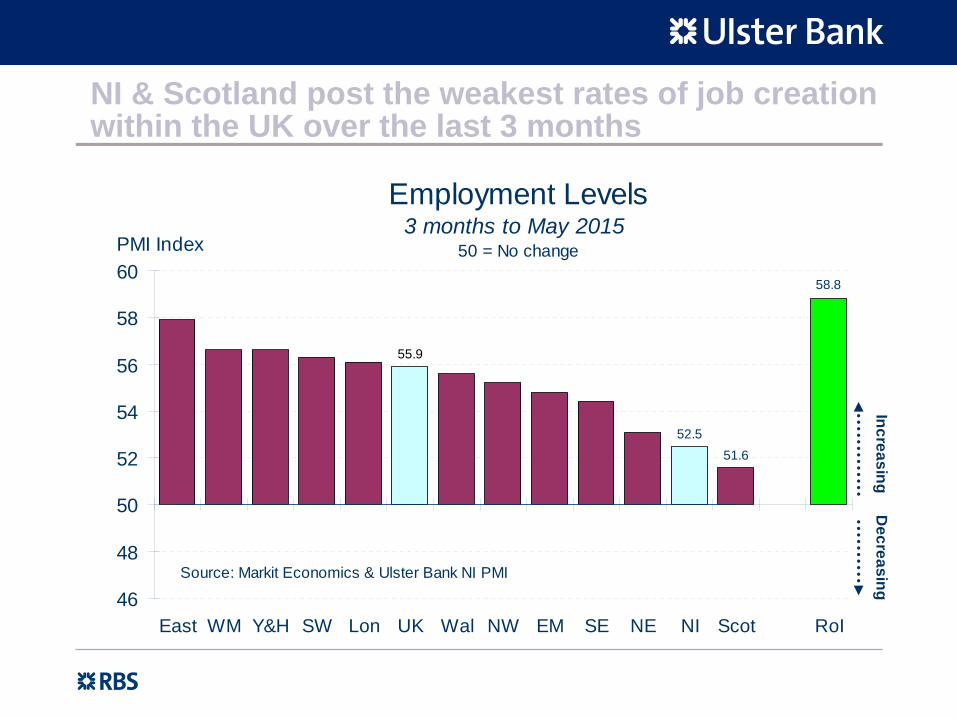
NI & Scotland post the weakest rates of job creation within the UK over the last 3 months
Employment Levels3 months to May 2015
50 = No change
52.5
55.9
51.6
58.8
46
48
50
52
54
56
58
60
East WM Y&H SW Lon UK Wal NW EM SE NE NI Scot RoI
PMI Index
IncreasingD
ecreasing
Source: Markit Economics & Ulster Bank NI PMI

Scotland, the North East & NI posted the weakest rates of jobs growth over the last year with the RoI the strongest
Employment Levels 12 months to May 2015
50 = No change
56.1
52.5
58.4
46
48
50
52
54
56
58
60
East WM Y&H UK Lon SW NW SE EM Wal Scot NI NE RoI
PMI Index
IncreasingD
ecreasingSource: Markit Economics & Ulster Bank NI PMI

Sectoral Comparisons

UK manufacturing & services output growth eases in May with construction reporting a pick-up in its growth rate
UK Business Activity / Output - PMIs
20
30
40
50
60
70
May-05 May-07 May-09 May-11 May-13 May-15
Services Manufacturing Construction
Source: Markit Economics
ExpansionC
ontraction

UK posts strong rates of growth between Q1-13 & Q3-14. Growth eased in Q1 contrary to what the PMI signalled
UK GDP versus UK Composite PMIUK Composite includes Construction
25
30
35
40
45
50
55
60
65
2007 Q4 2009 Q2 2010 Q4 2012 Q2 2013 Q4 2015 Q2*
PMI Index
-2.5
-2
-1.5
-1
-0.5
0
0.5
1
1.5GDP Q/Q
GDP Q/Q PMI PMI No Change
Source: ONS & Markit Economics, * PMI refers to average of April & May

RoI output growth accelerates across all sectors in May
RoI Business Activity - PMIsMonthly
20
25
30
35
40
45
50
55
60
65
70
May-07 May-08 May-09 May-10 May-11 May-12 May-13 May-14 May-15
Manufacturing Services Construction No Change
Source: Markit Economics

All sectors experienced weaker growth in H2-14 relative to H1-14 with H1-15 set to be even weaker
NI Private Sector Business Activity (PMI)
30
35
40
45
50
55
60
65
2006
H220
07H1
2007
H220
08H1
2008
H220
09H1
2009
H220
10H1
2010
H220
11H1
2011
H220
12H1
2012
H220
13H1
2013
H220
14H1
2014
H220
15H1*
PMI Index
Manufacturing Services Construction Retail ExpansionC
ontraction
Source: Markit Economics & Ulster Bank NI PMI, * refers to 5 months to May

NI’s manufacturing & services firms report a marked pick-up in output growth in May
Northern Ireland Private Sector Output 3 month moving average
30
35
40
45
50
55
60
65
70
May-03 May-05 May-07 May-09 May-11 May-13 May-15
Manufacturing Services Construction
Source: Markit Economics & Ulster Bank NI PMI
Expansion
Contraction

Services, manufacturing & construction firms all reported employment growth during the last 3 months
NI PMI - Employment Index 3 month moving average
25
30
35
40
45
50
55
60
65
May-03 May-05 May-07 May-09 May-11 May-13 May-15
Manufacturing Services Construction
Source: Markit Economics & Ulster Bank NI PMI
Job Gains
Job Losses

Manufacturing firms report a sharp slowdown in Q4-14 with a strong rebound in activity in the 3 months to May
NI Manufacturing Activity3 month moving average
25
30
35
40
45
50
55
60
65
70
Nov-03 Oct-05 Sep-07 Aug-09 Jul-11 Jun-13 May-15
Business activity New Orders Employment
Source: Markit Economics & Ulster Bank NI
Grow
th acceleratingC
ontraction accelerating

RoI firms continue to post strong rates of output growth with NI firms reporting a pick-up in growth in April & May
Manufacturing Output3 month moving average
30
35
40
45
50
55
60
65
May-03 May-05 May-07 May-09 May-11 May-13 May-15
UK NI RoI No Change
Source: Markit Economics & Ulster Bank NI PMI
Contraction
Expansion

NI firms report a significant rebound in new orders growth in April & May with RoI firms still outperforming UK & NI
Manufacturing New Orders3 month moving average
25
30
35
40
45
50
55
60
65
May-03 May-05 May-07 May-09 May-11 May-13 May-15
UK NI RoI No Change
Source: Markit Economics & Ulster Bank NI PMI
Contraction
Expansion

Until recently, NI had been outperforming most of its European competitors. But is now mid-table
Manufacturing Output - PMI
NI
20
30
40
50
60
70
May-07 May-08 May-09 May-10 May-11 May-12 May-13 May-14 May-15
RoI Italy Spain Greece NI France
Source: Markit Economics PMIs
C
ontractionExpansion

Input cost inflation picking up but remains subdued with output prices still falling
NI Manufacturing Input & Output Inflation3 month moving average
30
40
50
60
70
80
May-03 May-05 May-07 May-09 May-11 May-13 May-15
No Change Input Costs Output Prices
InflationD
eflation
Source: Markit Economics & Ulster Bank NI PMI
Profits squeeze

PMI signals moderation in manufacturing jobs growth in H2- 14 & Q1-15 following record high in Q2 but rebound in Q2-15
NI Manufacturing Employment: PMI v QES**
30
35
40
45
50
55
60
65
2005 Q2 2007 Q2 2009 Q2 2011 Q2 2013 Q2 2015 Q2*
PMI Index
-5%
-4%
-3%
-2%
-1%
0%
1%
2%
3%
4%
Q/Q
PMI Employment Index No Change QES Q/Q
Discontinuity in QES Series
Job Losses
Job gains**QES is DFP's official Quarterly Employment Survey of the number of jobs in NI firms
Source: DFP, Ulster Bank & Markit Economics, PMI Index 50.0 denotes threshold between expansion / contraction. * refers to April & May average.

Service sector experiences a pick-up in output and orders growth but firms are hiring staff at a slower rate
NI Service Sector (excludes Retail)3 month moving average
30
35
40
45
50
55
60
65
70
May-03 May-05 May-07 May-09 May-11 May-13 May-15
Business activity New Orders Employment
Source: Markit Economics & Ulster Bank
Grow
th acceleratingC
ontraction accelerating

RoI firms maintain strong rates of output growth but NI firms have experienced a marked slowdown in H1 2015
Services Output (excluding Retail)3 month moving average
30
35
40
45
50
55
60
65
70
May-03 May-05 May-07 May-09 May-11 May-13 May-15
UK NI RoI No Change
Source: Markit Economics & Ulster Bank NI PMI
Contraction
Expansion

NI firms fail to match the robust rates of growth in the UK & RoI with orders growth rising modestly over last 3 months
Services New Orders (excluding Retail ) 3 month moving average
30
40
50
60
70
May-03 May-05 May-07 May-09 May-11 May-13 May-15
UK NI RoI No Change
Source: Markit Economics & Ulster Bank NI PMI
Contraction
Expansion

NI’s services firms report a pick-up in input cost inflation in May with pricing power returning
NI Services Input & Output Inflation3 month moving average
30
40
50
60
70
80
May-03 May-05 May-07 May-09 May-11 May-13 May-15
No Change Input Costs Output Prices
InflationD
eflation
Source: Markit Economics & Ulster Bank NI

NI services firms increased their staffing levels over the last 3 months but below the rates of growth in the UK & RoI
Services Employment3 month moving average
30
35
40
45
50
55
60
65
May-03 May-05 May-07 May-09 May-11 May-13 May-15
UK RoI NI No Change
Source: Markit Economics & Ulster Bank NI PMI
Contraction
Expansion

Pace of job creation within the services sector eased in H2-14 but has picked up in H1-15
NI Services Employment: PMI v QES**
40
45
50
55
60
65
2005 Q2 2007 Q2 2009 Q2 2011 Q2 2013 Q2 2015 Q2*
PMI Index
-1.0%
-0.5%
0.0%
0.5%
1.0%
1.5%
Q/Q
PMI Employment Index No Change QES Q/Q
Discontinuity in QES Series
Job losses
Job gains**QES is DFP's official Quarterly Employment Survey of the number of
jobs in NI and includes the public sector
Source: DFP, Ulster Bank & Markit Economics, PMI Index 50.0 denotes threshold between expansion / contraction. * average of April & May

NI retailers continue to report significant contractions in sales although the pace of decline in orders is slowing
Northern Ireland Retail PMI3 monthly average
25
35
45
55
65
75
May-03 May-05 May-07 May-09 May-11 May-13 May-15
Business Activity New Orders Backlogs No Change
Source: Markit Economics & Ulster Bank NI PMI
Expansion
Contraction
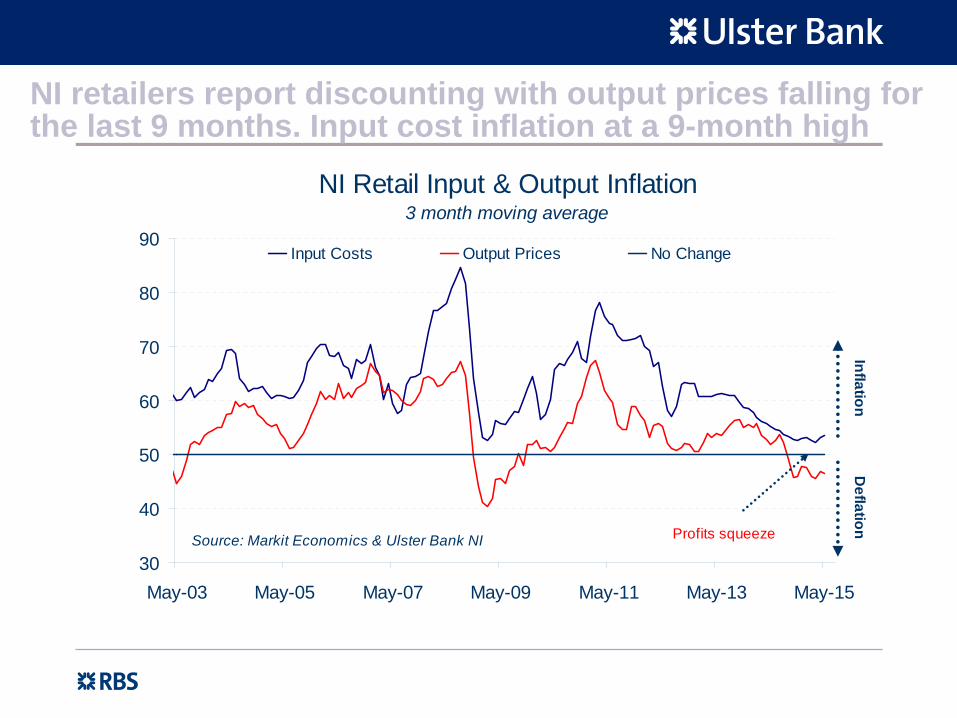
NI retailers report discounting with output prices falling for the last 9 months. Input cost inflation at a 9-month high
NI Retail Input & Output Inflation3 month moving average
30
40
50
60
70
80
90
May-03 May-05 May-07 May-09 May-11 May-13 May-15
Input Costs Output Prices No Change
InflationD
eflation
Source: Markit Economics & Ulster Bank NI Profits squeeze

NI’s construction firms report a decline in activity and new orders but continue to increase staffing levels
NI Construction PMI3 month moving average
20
30
40
50
60
70
May-09 May-10 May-11 May-12 May-13 May-14 May-15
Output New Orders Employment
Source: Markit Economics, Ulster Bank PMI
ExpansionC
ontraction
50 = No change

Input cost inflation easing rapidly with output price inflation beginning to rise
NI Construction Sector Profits Squeeze3 month moving average
20
30
40
50
60
70
May-09 May-10 May-11 May-12 May-13 May-14 May-15
PMI Index
Input Prices Output Prices No Change
Source: Markit Economics & Ulster Bank
InflationD
eflation

NI’s construction PMI posts jobs growth since Q3 2013 but this is largely due to NI firms working outside of NI
NI Construction Employment: PMI v QES**
25
30
35
40
45
50
55
60
65
70
2005 Q2 2007 Q4 2010 Q2 2012 Q4 2015 Q2*
PMI Index
-10.0%
-7.5%
-5.0%
-2.5%
0.0%
2.5%
5.0%
7.5%
Q/Q
PMI Employment Index No Change QES Q/Q
Job losses
Job gains
**QES is NI's official Quarterly Employment Survey of the no. of jobs in NI firms
Source: DFP, Ulster Bank & Markit Economics, PMI Index 50.0 denotes threshold between expansion / contraction. * average of April & May for PMI only

Strong rates of output growth amongst RoI firms with slowdown amongst UK firms & contraction with NI firms
Construction Sector Output - PMI3 month moving average
20
30
40
50
60
70
May-09 May-10 May-11 May-12 May-13 May-14 May-15
PMI Index
NI UK RoI
Source: Markit Economics
ExpansionC
ontraction
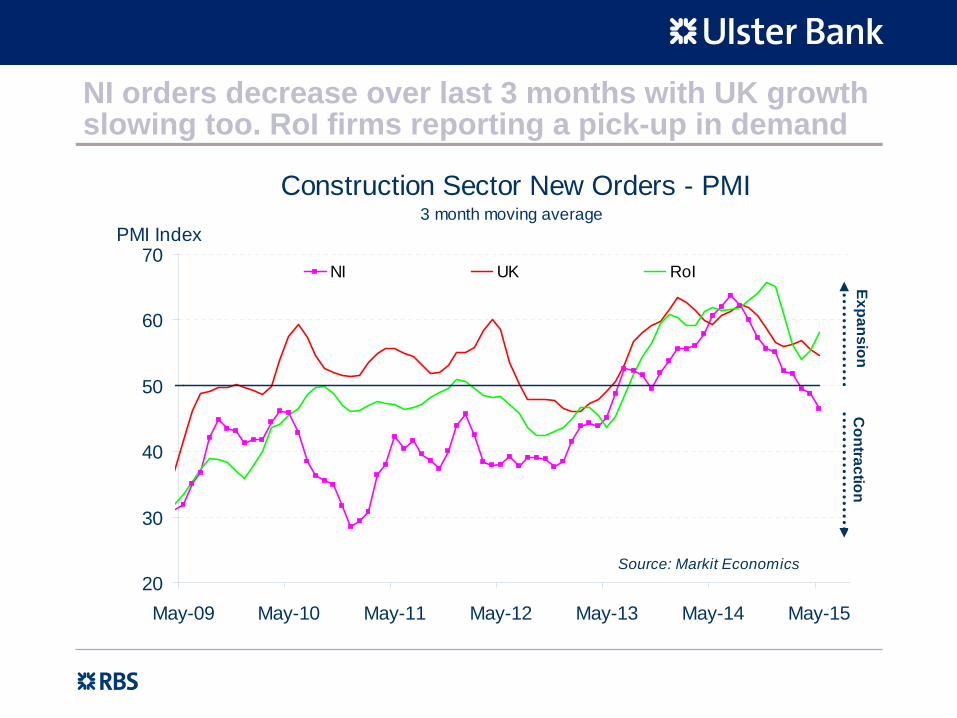
NI orders decrease over last 3 months with UK growth slowing too. RoI firms reporting a pick-up in demand
Construction Sector New Orders - PMI3 month moving average
20
30
40
50
60
70
May-09 May-10 May-11 May-12 May-13 May-14 May-15
PMI Index
NI UK RoI
Source: Markit Economics
ExpansionC
ontraction

UK firms report a pick-up in housing & civil engineering activity in May with commercial activity easing
UK Construction Activity - PMIsMonthly
20
30
40
50
60
70
May-05 May-07 May-09 May-11 May-13 May-15
Housing Activity Commercial Activity Civil Engineering Activity
Source: Markit Economics
ExpansionC
ontraction

UK sub-contractor rates recently rising at their fastest rate since the survey began as worker availability an issue
UK Construction PMI
20
30
40
50
60
70
80
May-05 May-07 May-09 May-11 May-13 May-15
Rates Charged By Sub-Contractors Availability of Sub-Contractors No Change
Source: Markit Economics
IncraesingD
ecreasing

UK construction firms remain more optimistic about the year ahead than at any time since February 2006
Future Business Activity Index - PMIs
20
30
40
50
60
70
80
90
100
May-97 May-00 May-03 May-06 May-09 May-12 May-15
Future Activity Long-Term Average
Source: Markit Economics
In 12mths time do you expect overall activity to be higher than now, lower, or the ?
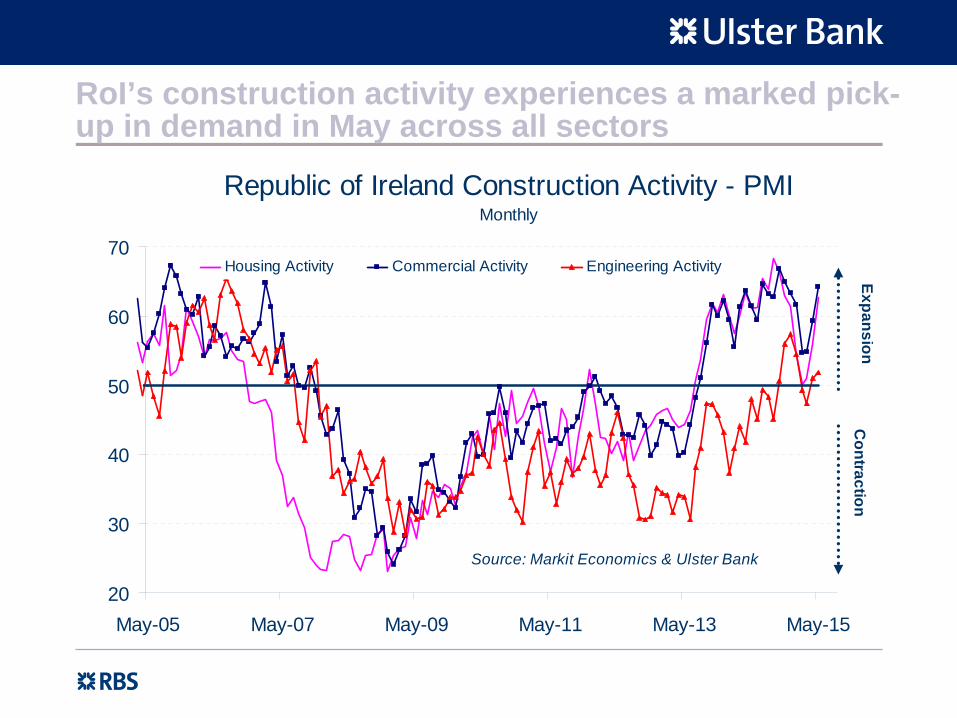
RoI’s construction activity experiences a marked pick- up in demand in May across all sectors
Republic of Ireland Construction Activity - PMIMonthly
20
30
40
50
60
70
May-05 May-07 May-09 May-11 May-13 May-15
Housing Activity Commercial Activity Engineering Activity
Source: Markit Economics & Ulster Bank
ExpansionC
ontraction
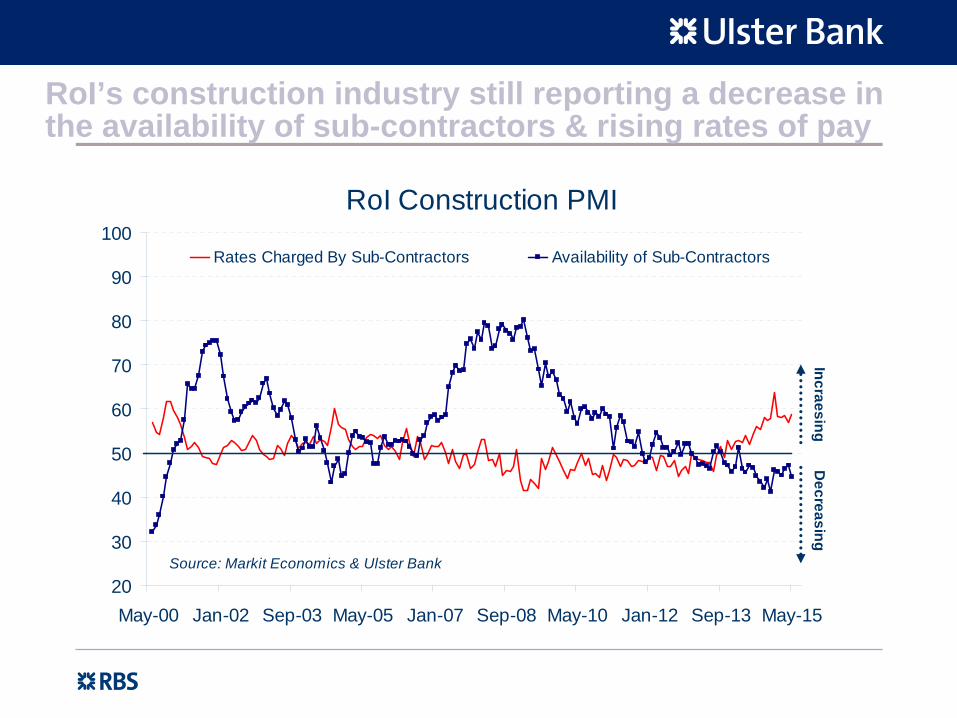
RoI’s construction industry still reporting a decrease in the availability of sub-contractors & rising rates of pay
RoI Construction PMI
20
30
40
50
60
70
80
90
100
May-00 Jan-02 Sep-03 May-05 Jan-07 Sep-08 May-10 Jan-12 Sep-13 May-15
Rates Charged By Sub-Contractors Availability of Sub-Contractors
Source: Markit Economics & Ulster Bank
IncraesingD
ecreasing

RoI construction firms remain very optimistic about the year ahead
Future Business Activity Index - PMIs
20
30
40
50
60
70
80
90
100
May-00 May-03 May-06 May-09 May-12 May-15
RoI Future Activity RoI Long-Term Average
Source: Markit Economics
Optim
ismPessim
ism
In 12mths time do you expect overall activity to be higher than now, lower, or the ?

Slide 63
Disclaimer
This document is intended for clients of Ulster Bank Limited and Ulster Bank Ireland Limited (together and separately, "Ulster Bank")
and is not intended for any other person.
It does not constitute an offer or invitation to purchase or sell any instrument or to provide any service in any jurisdiction where the required authorisation is not held.
Ulster Bank and/or its associates and/or its employees may have a position or engage in transactions in any of the instruments mentioned.
The information including any opinions expressed and the pricing given,
is indicative,
and constitute our judgement at time of publication and are subject to change without notice.
The information contained herein should not be construed as advice,
and is not intended to be construed as such.
This publication provides only a brief review of the complex issues discussed and recipients should not rely on information contained here without seeking specific advice on matters that concern them.
Ulster Bank make no representations or warranties with respect to the information and disclaim all liability for use the recipient or their advisors make of the information.
Over-the-counter (OTC) derivatives can involve a number of significant and complex risks which are dependent on the terms of the particular transaction and your circumstances. In the event the market has moved against the transaction you have undertaken, you may incur substantial costs if you wish to close out your position.
Calls may be recorded.