Embed Size (px)
Citation preview
A R e l a t i v e R a n k i n g o f 1 5 C o u n t r y L o c a t i o n sOUTSOURCING TO AFRICA
OU
TS
OU
RC
ING
TO
AF
RIC
A A
Re
lative R
ankin
g of 1
5 C
ou
ntry L
ocatio
ns
OUTSOURCING TO AFRICA
A Relative Ranking of 15 Country Locations
02_Africa_Report09_FR.indd Sec3:i02_Africa_Report09_FR.indd Sec3:i 2/26/09 12:14:04 PM2/26/09 12:14:04 PM

OU
TS
OU
RC
IN
G
TO
A
FR
IC
A
Disclaimer
This comparative ranking report and the following fi fteen country reports provide a general overview of current activities and issues related to ICT Outsourcing in the country. The data presented here should be regarded as illustrative rather than exhaustive. ICT Outsourcing is at a particularly dynamic stage in Africa; new developments and announcements are happening almost on a daily basis somewhere on the continent. Therefore, these reports should be seen as ‘snapshots’ that were current at the time they were taken; it is expected that certain facts and fi gures presented may become outdated very quickly.
The fi ndings, interpretations and conclusions expressed herein are a faithful representation of the respond-ents of the interviews and secondary data collected. Strict analytical analysis has been carried out with the minimal infl uence of the authors/team members. References to data sources have been made as far as possible. In the case of the detailed data parameters used for scores and ranking, the same data source and timeline has been used for all the fi fteen countries compared. In the descriptive section of the country reports, all data received from the individual country has been used in order to give a complete assess-ment. Thus, countries that have provided more information have a better coverage than those that have not been able to provide data to the research team.
Board of Executive Directors of the CBC or CyberMedia cannot guarantee the accuracy of the data included in this work. The boundaries, colours, denominations, and other information shown on any map in this work do not imply on the part of the CBC and CyberMedia any judgment of the legal status of any territory or the endorsement or acceptance of such boundaries.
Neither the fi rm nor its directors, employees, agents or representatives shall be liable for any damages, whether direct or indirect, special or consequential including lost revenue or profi ts that may arise from or in connection with the use of this information. The information is in review and will be subject to change and amendments as appropriate.
“The content of this report is of a general nature and is not intended to address the circumstances of any particular individual or entity. Although we endeavour to provide accurate information, there can be no guarantee that such information is accurate as of the date it is received or that it will continue to be accurate in the future. No one should act on such information without appropriate examination of the particular situation.”
Any clarifi cations/queries on the information should be addressed to CyberMedia.
02_Africa_Report09_FR.indd Sec3:ii02_Africa_Report09_FR.indd Sec3:ii 2/26/09 12:14:05 PM2/26/09 12:14:05 PM

02_Africa_Report09_FR.indd Sec3:iv02_Africa_Report09_FR.indd Sec3:iv 2/26/09 12:14:05 PM2/26/09 12:14:05 PM
OU
TS
OU
RC
IN
G
TO
A
FR
IC
A
DEDICATION
Development and education have come to many African nations but have the aspirations of all the African people been met? How many have employment opportunities matching their capabilities? How many people of African origin have reached the top positions in the rest of the world?
This study is dedicated to the youth in developing African nations, where unemployment is high and employment opportunities are low.
Although the central theme of outsourcing of services is cost-cutting, outsourced ICT tasks to youth at IT-enabled service centers in developing nations, is an opportunity to give dignifi ed employment to the educated youth. Such experience in work done remotely in Africa to serve the developed world enable the youth to obtain skills, experience and fi erce competi-tive capabilities to face the challenging global world.
This study focuses on what all the African nations covered in this study could do to improve and leverage the benefi ts that outsourcing can offer.
Arindam BoseResearch Advisor Global ServicesCyberMedia India
02_Africa_Report09_FR.indd Sec3:iii02_Africa_Report09_FR.indd Sec3:iii 2/26/09 12:14:05 PM2/26/09 12:14:05 PM

02_Africa_Report09_FR.indd Sec3:vi02_Africa_Report09_FR.indd Sec3:vi 2/26/09 12:14:05 PM2/26/09 12:14:05 PM

v
OU
TS
OU
RC
IN
G
TO
A
FR
IC
A
Foreword by Director General CBC vii
Preface by Chairman CyberMedia ix
In This Study 1
Methodology 1
Scope and Defi nitions 2
Project Team 2
1. Africa Situation Overview 3
1.1. Introduction 3
1.2. Overview of the Fifteen African Countries as Outsourcing Destinations 6
1.3. Outsourcing Attractiveness' Overall Scores and Ranking 7
1.4. Infrastructure, People & Skills and Business Environment Scores and Ranks 9
2. Methodology 23
2.1. Geographical Coverage 23
2.2. Research Framework and Design 24
2.3. Normalization and Calculation 25
2.4. Defi nitions of Lower Level Abstraction, Constructs, and Major Data Points 28
2.5. Defi nitions of Data Parameters, Units of Measurements, and Source 34
Glossary 37
Appendix I: Infrastructure Data Table 40
Appendix II: People and Skills Data Table 42
Appendix III: Business Environment Data Table 44
Appendix IV: Fifteen Africa Country Profi les 47
TABLE OF CONTENTS
02_Africa_Report09_FR.indd Sec3:v02_Africa_Report09_FR.indd Sec3:v 2/26/09 12:14:05 PM2/26/09 12:14:05 PM

02_Africa_Report09_FR.indd Sec3:viii02_Africa_Report09_FR.indd Sec3:viii 2/26/09 12:14:05 PM2/26/09 12:14:05 PM
vii
OU
TS
OU
RC
IN
G
TO
A
FR
IC
A
I am delighted to present this report on the outsourcing potential of Africa, which is the fi rst of its kind to outline the key issues that face the continent. Whilst there are dominant nations in the outsourcing arena such as India, Philippines, Mexico, and China, there is a strong case emerging for African nations. With vastly improved connectivity; proximity to key markets; multi-lingual skills; lower wage costs and suitable time-zones, many African nations are now vying for a share of the global outsourcing business.
Having been given the mandate from the Commonwealth Heads of Government in 1997 to involve the private sector in the promotion of trade and investment within the Common-wealth, the Commonwealth Business Council set out its vision for “sharing global prosperity by making globalisation work for all”. Since then, CBC has pursued its mission through the promotion of global trade and investment with an enhanced role for the private sector.
The Commonwealth Business Council is committed to pursuing the agenda on outsourcing in Africa. This report, as well as providing a clear picture of the current state of play with regard to infrastructure, society and economics, should act as a springboard for identifying new areas for projects to fl ourish. I sincerely hope that governments and the private sector fi nd this report useful.
We look forward to working together to achieve our common goals for economic growth and sustainable development in Africa.
FOREWORD
by Dr Mohan Kaul, Director General, CBC
02_Africa_Report09_FR.indd Sec3:vii02_Africa_Report09_FR.indd Sec3:vii 2/26/09 12:14:05 PM2/26/09 12:14:05 PM

02_Africa_Report09_FR.indd Sec3:x02_Africa_Report09_FR.indd Sec3:x 2/26/09 12:14:06 PM2/26/09 12:14:06 PM

ix
OU
TS
OU
RC
IN
G
TO
A
FR
IC
A
PREFACE
by Mr. Pradeep Gupta, Chairman, CyberMedia
The world of outsourcing is going through major changes with a number of countries emerg-ing as challengers to grab a share of the rapidly expanding pie. CyberMedia has witnessed, chronicled and catalyzed the growth of the Indian outsourcing industry. CyberMedia was part of the World Bank funded study in 1992, which looked into India’s competitiveness in IT services. At that time, India’s total exports were under $150mn. In seventeen years, this fi gure has risen to a stupendous $17bn. As part of the Steering Committee of that study, I saw how seeds of an idea can be converted into strategy and executed to make a complete transformation of an industry and indeed a nation.
Africa is ready to chart this journey. Of course, the path followed by India, will not work today. A new strategy has to evolve relevant for a mature market with formidable players. It is with this background that CyberMedia became the knowledge partner with Common-wealth Business Council in putting together this report that compares 15 African nations and provides pointers and data for their growth into the outsourcing area.
This is merely the fi rst step. I am sure the Africans nations covered in the study will evolve their future strategies on the strength of this report.
02_Africa_Report09_FR.indd Sec3:ix02_Africa_Report09_FR.indd Sec3:ix 2/26/09 12:14:06 PM2/26/09 12:14:06 PM

1
OU
TS
OU
RC
IN
G
TO
A
FR
IC
A
Methodology
The attractiveness of a nation as an outsourcing destination depends on the ICT and other supporting infrastructure available, the skill levels of the people and their availability, and the business environment.
In this study, a framework comprising of qualitative and quantitative assessment was followed. Parameters pertaining to outsourcing were carefully selected from reputed international stud-ies. The data collected was converted to merit scores for Infrastructure, People and Skills and Business Environment and sub elements of these aspects. This unique ‘CyberMedia Research Methodology’ used to calculate the scores are described in chapter two of this report.
Multi-faceted observations, which cannot be directly measured, were observed. The following qualitative aspects important in attracting a potential investor coming to the country to set up an outsourcing operation have been analysed by survey of literature—Internet search and limited country visits and telephonic interviews:
Country, Political and Economic Profi le.
Principal Government Offi cials.
Foreign Relations.
Living, Security, and Safety Perceptions.
ICT Policy, ICT Infrastructure and Service.
ICT and BPO Industry Environment.
Human Resource Effi ciency and Cost.
Legal and Enforcement Issues.
Labour and Expatriate Worker’s Permits.
Revenue, Tax, and Repatriation Issues.
Investment Policy and Incentives.
Government Agencies Giving Support to Outsourcing.
In case of the detailed data parameters used for scores and ranking, the same data source and timeline has been used in order to give as complete an assessment as possible, for ranks and scores. The ‘Infrastructure’ scores are calculated on the various infrastructure-related parameters, and thereafter scores are divided into three bands i.e. ‘Ready’, ‘ Upcoming’, and ‘Yet to be ready’, for becoming an attractive outsourcing destination. In ‘Outsourcing
•
•
•
•
•
•
•
•
•
•
•
•
IN THIS STUDY
02_Africa_Report09_FR.indd Sec1:102_Africa_Report09_FR.indd Sec1:1 2/26/09 12:14:06 PM2/26/09 12:14:06 PM

2
OU
TS
OU
RC
IN
G
TO
A
FR
IC
AAttractiveness Index’, there are two abstraction levels—‘People and Skills’ and ‘Business Environment’, having equal weightage in overall rankings of index.
The fi nal outsourcing attractiveness index is produced keeping infrastructure rankings as the base; only the countries which are able to qualify in infrastructure bands are placed higher in the outsourcing attractiveness index.
Scope and Defi nitions
Whilst there are dominant nations in the outsourcing arena such as India, Philippines, Mexico, and China, etc., there is a strong case emerging for African nations.
With improving connectivity, proximity to key markets, multi-lingual skills, lower wage costs and physical infrastructure costs, and suitable time-zones many African nations are now vying for a share of the global outsourcing business.
To make the best of this emerging opportunity, the Commonwealth Business Council (CBC) with Global Services (GS), a CyberMedia (India) group company, is presenting the fi rst ever ‘African Outsourcing Summit’ in 2009. This summit will bring representatives from over fi fteen African nations together with key decision makers and other stakeholders from European and global outsourcing industry.
This research effort by CyberMedia-Global Services (India) benchmarks fi fteen African coun-tries on many different parameters that will help decision makers in matching the right outsourcing destinations with outsourcing needs. This report is the background paper for the summit.
Project Team
Mr. Kamal Vohra, Assistant Manager, CyberMedia India
Mr. Kapil Dev Singh, Senior Vice-President, CyberMedia India
Mr. Arindam Bose, Research Advisor, CyberMedia India
Mr. Hoshie Ghaswalla, President, CyberMedia India
Ms. Keerthi Nair, Sr. Manager (Editorial), CyberMedia India (Editorial Support)
Mr. Bhupendra Bhanu, GM, CyberMedia India (Production Co-ordinator)
Mr. Satish Khankriyal, Manager (R&D), CyberMedia India (Design & Layout)
Mr. Ashimendu Dey, Associate Art and Ms. Poonam Ujjainwal, Sr. Illustrator, CyberMedia India (Illustrations)
Mr. Raj Kishore, Graphic Designer, CyberMedia India (Cover Design)
1.
2.
3.
4.
5.
6.
7.
8.
9.
In This Study
02_Africa_Report09_FR.indd Sec1:202_Africa_Report09_FR.indd Sec1:2 2/26/09 12:14:06 PM2/26/09 12:14:06 PM
3
OU
TS
OU
RC
IN
G
TO
A
FR
IC
A
1.1. Introduction
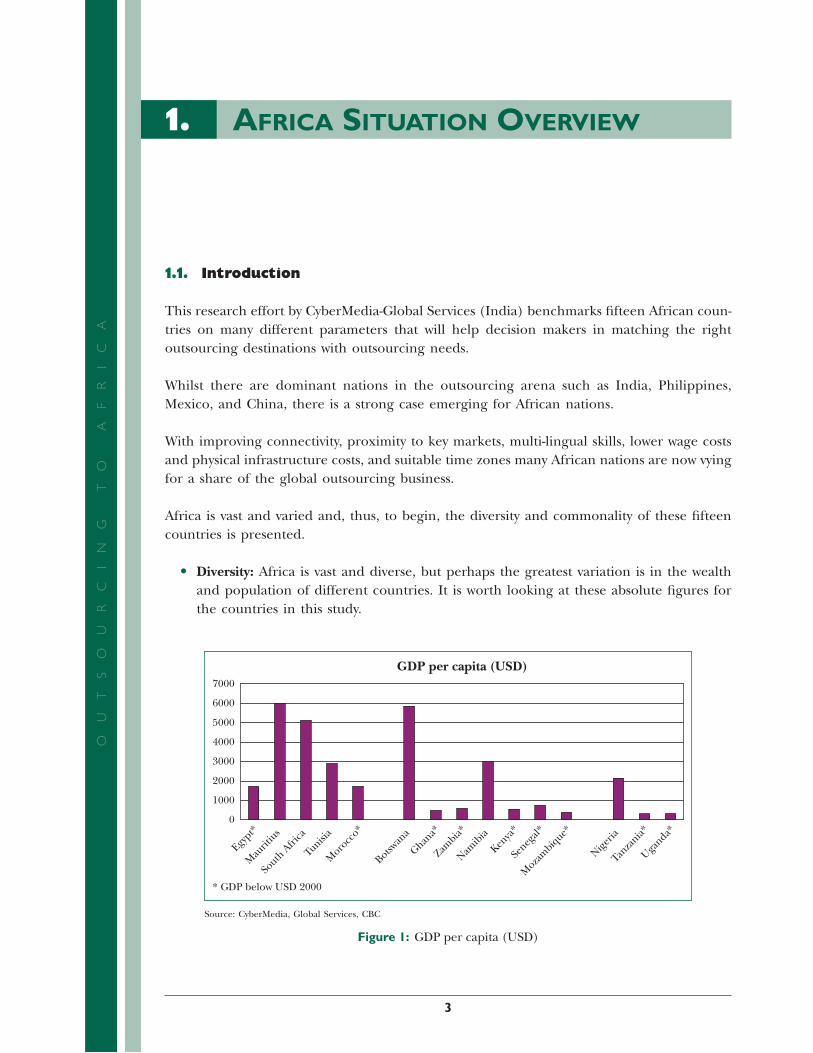
This research effort by CyberMedia-Global Services (India) benchmarks fi fteen African coun-tries on many different parameters that will help decision makers in matching the right outsourcing destinations with outsourcing needs.
Whilst there are dominant nations in the outsourcing arena such as India, Philippines, Mexico, and China, there is a strong case emerging for African nations.
With improving connectivity, proximity to key markets, multi-lingual skills, lower wage costs and physical infrastructure costs, and suitable time zones many African nations are now vying for a share of the global outsourcing business.
Africa is vast and varied and, thus, to begin, the diversity and commonality of these fi fteen countries is presented.
Diversity: Africa is vast and diverse, but perhaps the greatest variation is in the wealth and population of different countries. It is worth looking at these absolute fi gures for the countries in this study.
GDP per capita (USD)7000
6000
5000
4000
3000
2000
1000
0
* GDP below USD 2000
Egypt*
Mau
ritiu
s
South
Afri
ca
Tunisia
Moro
cco*
Botswan
a
Ghana*
Zambia*
Namib
ia
Kenya
*
Seneg
al*
Moza
mbiq
ue*
Nigeria
Tanza
nia*
Uganda*
Source: CyberMedia, Global Services, CBC
Figure 1: GDP per capita (USD)
•
1. AFRICA SITUATION OVERVIEW
02_Africa_Report09_FR.indd Sec1:302_Africa_Report09_FR.indd Sec1:3 2/26/09 12:14:06 PM2/26/09 12:14:06 PM

4
1. Africa Situation Overview
OU
TS
OU
RC
IN
G
TO
A
FR
IC
A
Egypt**
Mau
ritiu
s**
South
Afri
ca
Tunisia*
*
Moro
cco**
Botswan
a
Ghana*
*
Zambia*
*
Namib
ia
Kenya
Seneg
al
Moza
mbiq
ue
Nigeria
**
Tanza
nia**
Uganda*
*
60.00Population unemployed (% of labour...)
50.00
40.00
30.00
20.00
10.00
0
** Unemployment below 20%
Source: CyberMedia, Global Services, CBC
Figure 2: Population unemployed
The gross national per capita income, population, population density, un-employment, poverty, and other major characteristics are very diverse and at times seemingly contra-dictory. All possible combinations are there across these fi fteen nations, namely:
Low GDP* and Low Unemployment**: Egypt, Morocco, Tanzania, Uganda, Ghana, and Zambia.
High GDP and Low Unemployment: Mauritius, Nigeria, and Tunisia.
Low GDP and High Unemployment: Kenya, Mozambique, and Senegal.
High GDP and High Unemployment: Botswana, South Africa, and Namibia.
Commonality: There is one aspect common to Africa and specially sub-Saharan Africa—severe limitations in broadband connectivity. This diagram shows the severe limitations of this continent with reference to all other continents.
Fiber in use as of year-end 2004
>500 500 50 10
Gbps
Source: TeleGeography Research @ 2006 PriMetrica.lnc.
Figure 3: Existing broadband connectivity to Africa
•
02_Africa_Report09_FR.indd Sec1:402_Africa_Report09_FR.indd Sec1:4 2/26/09 12:14:06 PM2/26/09 12:14:06 PM

1. Africa Situation Overview
5
OU
TS
OU
RC
IN
G
TO
A
FR
IC
AAttempts to improve this situation are in progress and will take till 2011 to materialize with the following systems coming up to connect African countries:
Seacom
East Coast.
13 700 km undersea cable.
To connect Southern and East Africa.
To India and Europe via Madagascar, Mozambique, Tanzania, Kenya.
Complete by June 2009.
To provide low-cost broadband.
EASSy
East Coast.
10 000 km.
To connect South Africa, Mozambique, Madagascar, Somalia, Djibouti, Sudan.
To be complete by end of 2010.
Financed by World Bank and DBSA.
Infraco
West Coast to UK.
To be complete by fi rst half of 2010.
Originally built by State Companies Eskom and Transnet—both shareholders at Neotel.
This is the expected scenario by 2011.
Source: CyberMedia, Global Services, CBC
Figure 4: Anticipated broadband scenario by 2011
•
•
•
•
•
•
•
•
•
•
•
•
•
•
•
•
•
02_Africa_Report09_FR.indd Sec1:502_Africa_Report09_FR.indd Sec1:5 2/26/09 12:14:06 PM2/26/09 12:14:06 PM

6
1. Africa Situation Overview
OU
TS
OU
RC
IN
G
TO
A
FR
IC
AConsequently the cost of connectivity is extremely high—negative to outsourcing efforts; the fi gure below shows the comparison of connectivity costs of African coun-tries with others.
South Asia
US$
per
100
kbp
s (2
006)
Middle East &North Africa
Europe &Central Asia
Latin America& Caribbean
East Asia &Pacific
Sub-SaharanAfrica
0
20
40
60
80
100
120
Comparison of Regional Average Broadband Retail Prices
Source: ITU 2007a. World Bank staff analysis
Figure 5: Broadband connectivity costs by region
With the developments expected this situation should improve. This graph clearly shows an advantage that North Africa has over sub-Saharan, central, and southern Africa on outsourc-ing infrastructure. Still, Africa is far disadvantaged as compared to East Asia, Pacifi c, and even Latin America and the Caribbean.
1.2. Overview of the Fifteen African Countries as Outsourcing Destinations
Outsourcing has arrived in Africa. This report quantitatively shows what is possible. In spite of the negative perceptions that Africa has only places like Somalia with pirates, Congo full of rebels, Nigeria the citadel of cyber crime, and South Africa the hotbed of carjacking and Wild West type of shootouts, Africa has the most peaceful, clean, and serene locations. Today most ‘Bollywood’1 and even some ‘Hollywood’ movies are shot in Africa. Thus outsourcing has come for good, and it is for the African nations to come together and spread the right message to propagate the right image of Africa as an outsourcing destination.
The fi ndings reveal that Africa has arrived in outsourcing with North Africa leading and South Africa close behind. The broadband connectivity projects in hand due to be com-pleted in the next few years will make parts of Africa, more tranquil, sparsely populated, and environmentally clear and clean—the next preferred outsourcing destination.
1Citadel of the Indian Cinema Industry—Hollywood of India
02_Africa_Report09_FR.indd Sec1:602_Africa_Report09_FR.indd Sec1:6 2/26/09 12:14:07 PM2/26/09 12:14:07 PM

1. Africa Situation Overview
7
OU
TS
OU
RC
IN
G
TO
A
FR
IC
A
Morocco *
Morocco
Tunisia *
Geographical Coverage and Rank
Tunisia
Egypt *
Egypt
Senegal *
Senegal
GhanaGhana
Nigeria
Nigeria
Uganda
Uganda
Kenya
KenyaTanzania
Tanzania
Zambia
Zambia
Mozambique MozambiqueBotswana
Botswana
Namibia
Namibia
SouthAfrica
South Africa
MauritiusAfrica
*Non-Commonwealth Countries
Mauritius
Source: CyberMedia, Global Services, CBC
Figure 6: Map of Africa showing the countries in the three bands—Ready, Upcoming, and Yet to be ready Infrastructure Status
1.3. Outsourcing Attractiveness’ Overall Scores and Ranking
The overall outsourcing attractiveness depends primarily on the infrastructure readiness fol-lowed by a combination of people and skills and business environment. The countries are fi rst categorized in bands depending on infrastructure readiness followed by ranking within the bands based on the sum of the people and skills and business environment scores. People and skills and business environment have equal importance, hence equal weightage.
Outsourcing Attractiveness Index
Countries are ranked within their bands based on theirBE + People & Skill Scores
Countries are ranked within their bands based on their:
People & Skills Scores
plus
Business Environment Scores
Source: CyberMedia, Global Services, CBC
Figure 7: Deriving outsourcing attractiveness ranking
02_Africa_Report09_FR.indd Sec1:702_Africa_Report09_FR.indd Sec1:7 2/26/09 12:14:07 PM2/26/09 12:14:07 PM
8
1. Africa Situation Overview
OU
TS
OU
RC
IN
G
TO
A
FR
IC
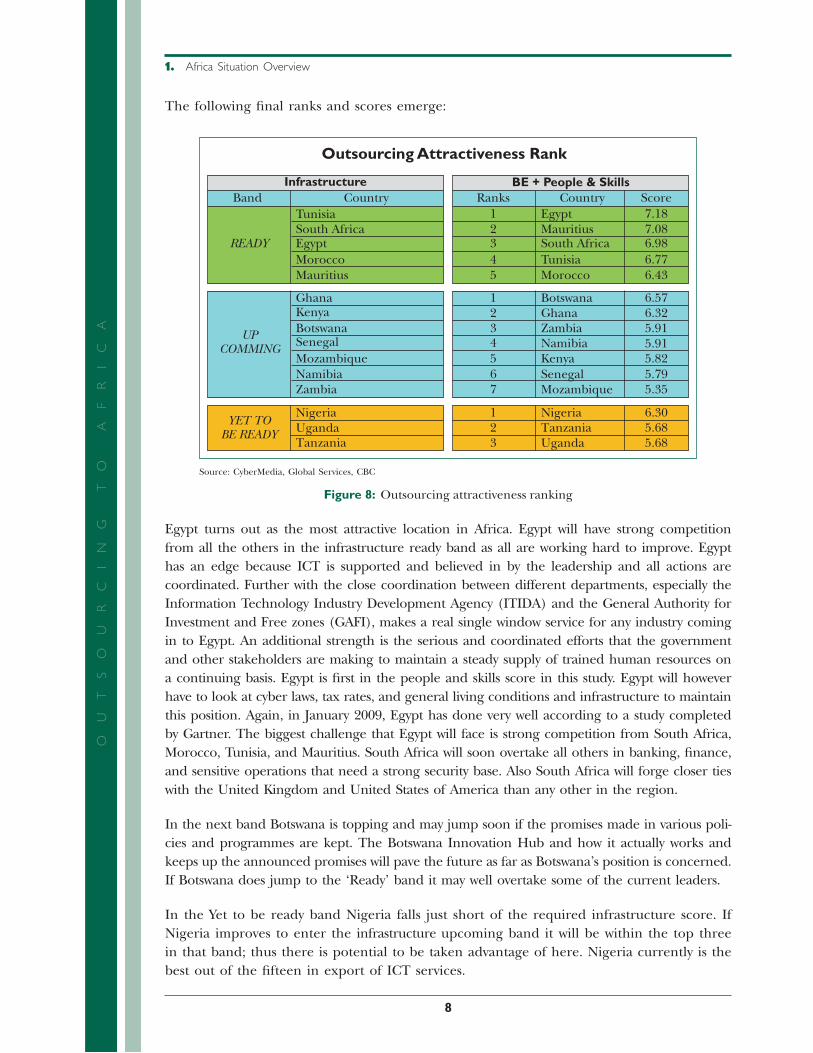
AThe following fi nal ranks and scores emerge:
Outsourcing Attractiveness Rank
GhanaKenyaBotswanaSenegalMozambiqueNamibiaZambia
UPCOMMING
BotswanaGhanaZambiaNamibiaKenyaSenegalMozambique
6.576.325.915.915.825.795.35
1234567
NigeriaTanzaniaUganda
123
6.305.685.68
InfrastructureBand Country
TunisiaSouth AfricaEgyptMoroccoMauritius
READY
BE + People & SkillsRanks Country Score
EgyptMauritiusSouth AfricaTunisiaMorocco
12345
7.187.086.986.776.43
Nigeria
TanzaniaUganda
YET TOBE READY
Source: CyberMedia, Global Services, CBC
Figure 8: Outsourcing attractiveness ranking
Egypt turns out as the most attractive location in Africa. Egypt will have strong competition from all the others in the infrastructure ready band as all are working hard to improve. Egypt has an edge because ICT is supported and believed in by the leadership and all actions are coordinated. Further with the close coordination between different departments, especially the Information Technology Industry Development Agency (ITIDA) and the General Authority for Investment and Free zones (GAFI), makes a real single window service for any industry coming in to Egypt. An additional strength is the serious and coordinated efforts that the government and other stakeholders are making to maintain a steady supply of trained human resources on a continuing basis. Egypt is fi rst in the people and skills score in this study. Egypt will however have to look at cyber laws, tax rates, and general living conditions and infrastructure to maintain this position. Again, in January 2009, Egypt has done very well according to a study completed by Gartner. The biggest challenge that Egypt will face is strong competition from South Africa, Morocco, Tunisia, and Mauritius. South Africa will soon overtake all others in banking, fi nance, and sensitive operations that need a strong security base. Also South Africa will forge closer ties with the United Kingdom and United States of America than any other in the region.
In the next band Botswana is topping and may jump soon if the promises made in various poli-cies and programmes are kept. The Botswana Innovation Hub and how it actually works and keeps up the announced promises will pave the future as far as Botswana’s position is concerned. If Botswana does jump to the ‘Ready’ band it may well overtake some of the current leaders.
In the Yet to be ready band Nigeria falls just short of the required infrastructure score. If Nigeria improves to enter the infrastructure upcoming band it will be within the top three in that band; thus there is potential to be taken advantage of here. Nigeria currently is the best out of the fi fteen in export of ICT services.
02_Africa_Report09_FR.indd Sec1:802_Africa_Report09_FR.indd Sec1:8 2/26/09 12:14:08 PM2/26/09 12:14:08 PM
1. Africa Situation Overview
9
OU
TS
OU
RC
IN
G
TO
A
FR
IC
A1.4. Infrastructure, People & Skills and Business
Environment Scores and Ranks
A. Infrastructure Readiness
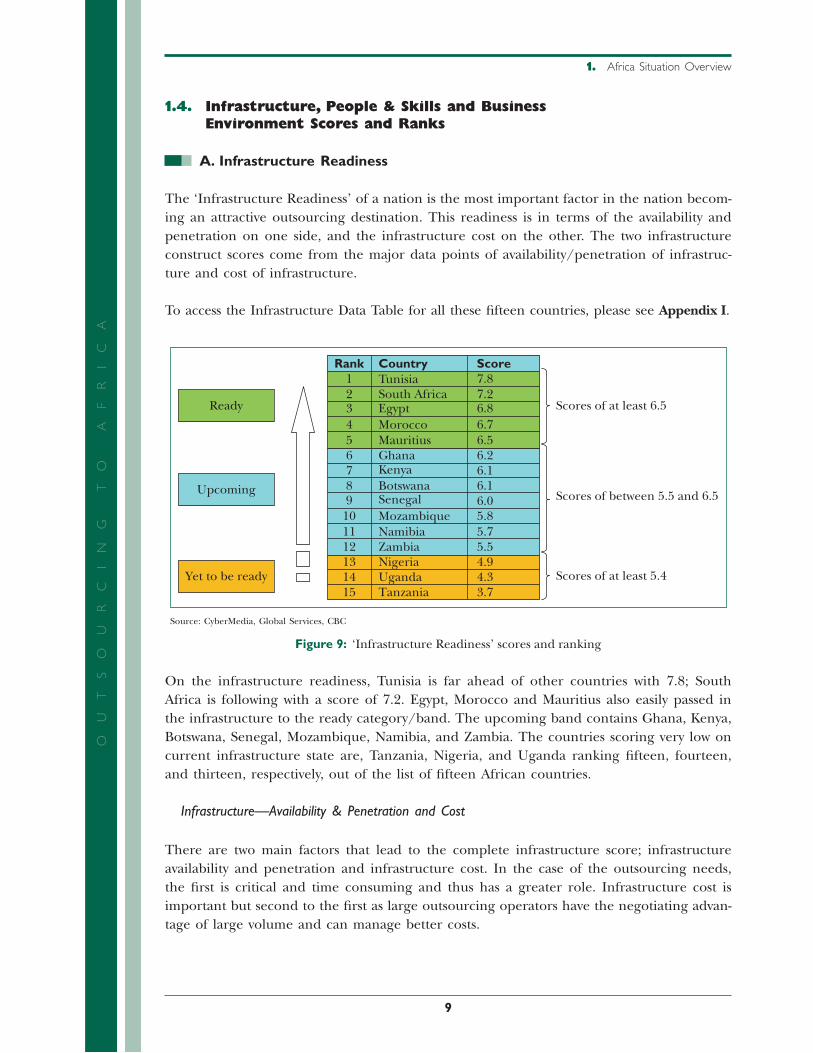
The ‘Infrastructure Readiness’ of a nation is the most important factor in the nation becom-ing an attractive outsourcing destination. This readiness is in terms of the availability and penetration on one side, and the infrastructure cost on the other. The two infrastructure construct scores come from the major data points of availability/penetration of infrastruc-ture and cost of infrastructure.
To access the Infrastructure Data Table for all these fi fteen countries, please see Appendix I.
6.26.16.16.05.85.75.5
6789
101112131415
4.94.33.7
Rank Country Score12345
7.87.26.86.76.5
GhanaKenyaBotswanaSenegalMozambiqueNamibiaZambia
TunisiaSouth AfricaEgyptMoroccoMauritius
NigeriaUgandaTanzania
Ready Scores of at least 6.5
Scores of between 5.5 and 6.5
Scores of at least 5.4
Upcoming
Yet to be ready
Source: CyberMedia, Global Services, CBC
Figure 9: ‘Infrastructure Readiness’ scores and ranking
On the infrastructure readiness, Tunisia is far ahead of other countries with 7.8; South Africa is following with a score of 7.2. Egypt, Morocco and Mauritius also easily passed in the infrastructure to the ready category/band. The upcoming band contains Ghana, Kenya, Botswana, Senegal, Mozambique, Namibia, and Zambia. The countries scoring very low on current infrastructure state are, Tanzania, Nigeria, and Uganda ranking fi fteen, fourteen, and thirteen, respectively, out of the list of fi fteen African countries.
Infrastructure—Availability & Penetration and Cost
There are two main factors that lead to the complete infrastructure score; infrastructure availability and penetration and infrastructure cost. In the case of the outsourcing needs, the fi rst is critical and time consuming and thus has a greater role. Infrastructure cost is important but second to the fi rst as large outsourcing operators have the negotiating advan-tage of large volume and can manage better costs.
02_Africa_Report09_FR.indd Sec1:902_Africa_Report09_FR.indd Sec1:9 2/26/09 12:14:08 PM2/26/09 12:14:08 PM

10
1. Africa Situation Overview
OU
TS
OU
RC
IN
G
TO
A
FR
IC
AInfrastructure availability and penetration
This construct score is made up of the major data point (MDP) scores Network Readi-ness, Internet Bandwidth, Electricity Availability, and the Road and Rail Network.
Infrastructure Availability & Penetration5.5
54.5
43.5
32.5
21.5
10.5
0
Egypt
Mau
ritiu
s
South
Afri
ca
Tunisia
Moro
cco
Botswan
a
Ghana
Zambia
Namib
ia
Kenya
Seneg
al
Moza
mbiq
ue
Nigeria
Tanza
nia
Uganda
Ready
Upcoming
Yet to be ready
Source: CyberMedia, Global Services, CBC
Figure 10: Infrastructure Availability and Penetration Scores and Ranking
Infrastructure—cost
This construct score is made up of the major data point (MDP) scores coming from cost of space and facilities (Africa Research Report, Knight Frank); Cost of Stay and Trans-port (UNDP rates and prevailing air fares) and data transfer costs (World Bank).
3.5
Infrastructure Cost
Ready
Upcoming
Yet to be ready3
2.5
2
1.5
1
0.5
0
Tunisia
South
Afri
ca
Moza
mbiq
ue
Ghana
Kenya
Mau
ritiu
s
Egypt
Botswan
a
Seneg
al
Moro
cco
Zambia
Nigeria
Namib
ia
Tanza
nia
Uganda
Source: CyberMedia, Global Services, CBC
Figure 11: Infrastructure costs scores and ranking
It is now pertinent to look at each one of the individual ‘Major Data Points’ (MDPs) that go towards these two constructs, namely availability and cost.
•
•
02_Africa_Report09_FR.indd Sec1:1002_Africa_Report09_FR.indd Sec1:10 2/26/09 12:14:08 PM2/26/09 12:14:08 PM

1. Africa Situation Overview
11
OU
TS
OU
RC
IN
G
TO
A
FR
IC
AInfrastructure—availability/penetration-network readiness
Egypt
Mau
ritiu
s
South
Afri
ca
Tunisia
Moro
cco
Botswan
a
Ghana
Zambia
Namib
ia
Kenya
Seneg
al
Moza
mbiq
ue
Nigeria
Tanza
nia
Uganda
Ready
Upcoming
Yet to be ready
Network Readiness9.008.007.006.005.004.003.002.001.000.00
Source: CyberMedia, Global Services, CBC
Figure 12: Network readiness ‘MDP’ scores
In this MDP score all the fi fteen countries are scoring between 5.79 (for Mozambique) and 7.78 (for Tunisia, which is the best).
Infrastructure—availability/penetration-international Internet bandwidth
Ready
Upcoming
Yet to be ready
Moro
cco
Zambia
Tunisia
Kenya
South
Afri
ca
Moza
mbiq
ue
Mau
ritiu
s
Ghana
Nigeria
Egypt
Seneg
al
Botswan
a
Namib
ia
Uganda
Tanza
nia
International Internet Bandwidth12.0010.00
8.006.004.002.000.00
Source: CyberMedia, Global Services, CBC
Figure 13: International Internet bandwidth
It is important to recognise that all these will improve as soon as broadband connection from all the new projects are complete in 2009 to 2011.
•
•
02_Africa_Report09_FR.indd Sec1:1102_Africa_Report09_FR.indd Sec1:11 2/26/09 12:14:08 PM2/26/09 12:14:08 PM
12
1. Africa Situation Overview
OU
TS
OU
RC
IN
G
TO
A
FR
IC
AInfrastructure—availability/penetration-electricity availability
Ready
Upcoming
Yet to be ready
South
Afri
ca
Tunisia
Moza
mbiq
ue
Ghana
Kenya
Mau
ritiu
s
Egypt
Botswan
a
Seneg
al
Moro
cco
Zambia
Nigeria
Namib
ia
Tanza
nia
Uganda
12.00
Electricity Availability
10.008.006.004.002.000.00
Source: CyberMedia, Global Services, CBC
Figure 14: Electricity availability
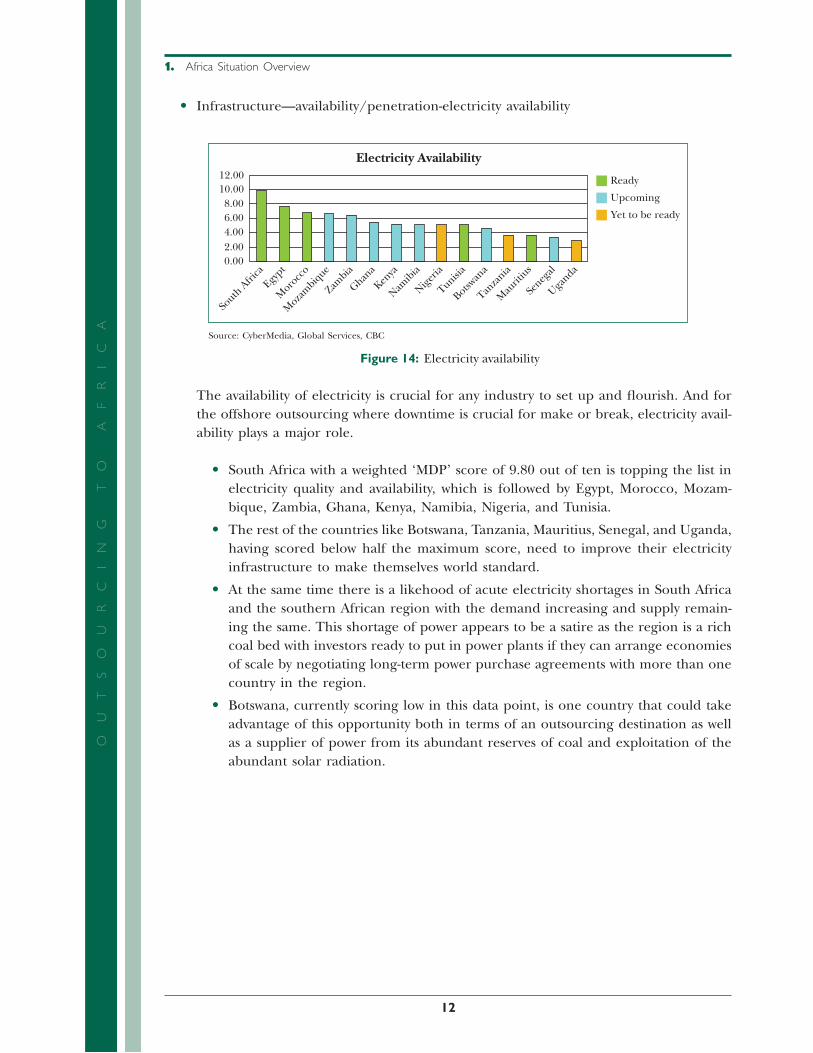
The availability of electricity is crucial for any industry to set up and fl ourish. And for the offshore outsourcing where downtime is crucial for make or break, electricity avail-ability plays a major role.
South Africa with a weighted ‘MDP’ score of 9.80 out of ten is topping the list in electricity quality and availability, which is followed by Egypt, Morocco, Mozam-bique, Zambia, Ghana, Kenya, Namibia, Nigeria, and Tunisia.
The rest of the countries like Botswana, Tanzania, Mauritius, Senegal, and Uganda, having scored below half the maximum score, need to improve their electricity infrastructure to make themselves world standard.
At the same time there is a likehood of acute electricity shortages in South Africa and the southern African region with the demand increasing and supply remain-ing the same. This shortage of power appears to be a satire as the region is a rich coal bed with investors ready to put in power plants if they can arrange economies of scale by negotiating long-term power purchase agreements with more than one country in the region.
Botswana, currently scoring low in this data point, is one country that could take advantage of this opportunity both in terms of an outsourcing destination as well as a supplier of power from its abundant reserves of coal and exploitation of the abundant solar radiation.
•
•
•
•
•
02_Africa_Report09_FR.indd Sec1:1202_Africa_Report09_FR.indd Sec1:12 2/26/09 12:14:09 PM2/26/09 12:14:09 PM

1. Africa Situation Overview
13
OU
TS
OU
RC
IN
G
TO
A
FR
IC
AInfrastructure—availability/penetration
Egypt
Mau
ritiu
s
South
Afri
ca
Tunisia
Moro
cco
Botswan
a
Ghana
Zambia
Namib
iaKen
ya
Seneg
al
Moza
mbiq
ue
Nigeria
Tanza
nia
Uganda
Ready
Upcoming
Yet to be ready
Road/Rail Network and Air Travel9.008.007.006.005.004.003.002.001.000.00
Source: CyberMedia, Global Services, CBC
Figure 15: Road and rail network
More than half the countries score high in this major data point (MDP) with Tunisia, Namibia, and Botswana leading, though Botswana and Namibia are in the Upcoming band.
Infrastructure cost—rental and cost of commercial premises
The rental and cost of commercial premises is a Major Data Parameter (MDP) that helps in calculating overall cost of rental (per sq ft) and cost of ownership of premises for commercial activity. It is worth remembering that a higher score means a more cost-effective space and facilities. Thus space and facilities in Botswana are more cost effective than those in South Africa or Egypt.
Egypt
Mau
ritiu
s
South
Afri
ca
Tunisia
Moro
cco
Botswan
a
Ghana
Zambia
Namib
ia
Kenya
Seneg
al
Moza
mbiq
ue
Nigeria
Tanza
nia
Uganda
ReadyUpcoming
Yet to be ready
Rental and Cost of Commercial Premises12.0010.008.006.004.002.000.00
Source: CyberMedia, Global Services, CBC
Figure 16: Costs of inputs in terms of space and facilities
•
•
02_Africa_Report09_FR.indd Sec1:1302_Africa_Report09_FR.indd Sec1:13 2/26/09 12:14:09 PM2/26/09 12:14:09 PM

14
1. Africa Situation Overview
OU
TS
OU
RC
IN
G
TO
A
FR
IC
AInfrastructure cost—stay and travel ‘MDP’ scores
Travel and stay costs of the people travelling to support the outsourcing industries from countries that buy these services need to be considered. This ‘MDP’ is based on the UNDP travelling allowance rates and prevailing cost of tickets from London to the destination country as the detailed data points.
Ready
Upcoming
Yet to be ready
Tunisia
Seneg
al
Moro
cco
Botswan
aEgy
pt
Zambia
Ghana
Mau
ritiu
s
Nigeria
Namib
ia
Moza
mbiq
ue
South
Afri
ca
Tanza
nia
Kenya
Uganda
8.00
Cost of Stay & Travel
6.007.00
5.004.003.002.00
0.001.00
Source: CyberMedia, Global Services, CBC
Figure 17: Costs of inputs in travel and stay
Infrastructure cost—telecom/data transfer ‘MDP’ cost
The Telecom/Data Transfer Cost major data parameters is based on the detailed data parameter for call charges (mobile/landline) to major world cities and the Internet/data transfer tariff per month. South Africa has the lowest telecom and data transfer cost and is topping the list of fi fteen African countries; it is followed closely by Egypt and Tunisia. Namibia, Tanzania, Uganda, Botswana, and Kenya have to improve the effi ciency of their telecom infrastructure in this sector to lower the cost.
Ready
Upcoming
Yet to be ready
South
Afri
ca
Moro
cco
Nigeria
Mau
ritiu
s
Ghana
Tanza
niaEgy
pt
Kenya
Uganda
Tunisia
Seneg
al
Zambia
Moza
mbiq
ue
Botswan
a
Namib
ia
8.009.00
Telecom/Data Transfer Cost
6.007.00
5.004.003.002.00
0.001.00
Source: CyberMedia, Global Services, CBC
Figure 18: Costs of inputs in terms of telecom/data transfer
•
•
02_Africa_Report09_FR.indd Sec1:1402_Africa_Report09_FR.indd Sec1:14 2/26/09 12:14:09 PM2/26/09 12:14:09 PM
1. Africa Situation Overview
15
OU
TS
OU
RC
IN
G
TO
A
FR
IC
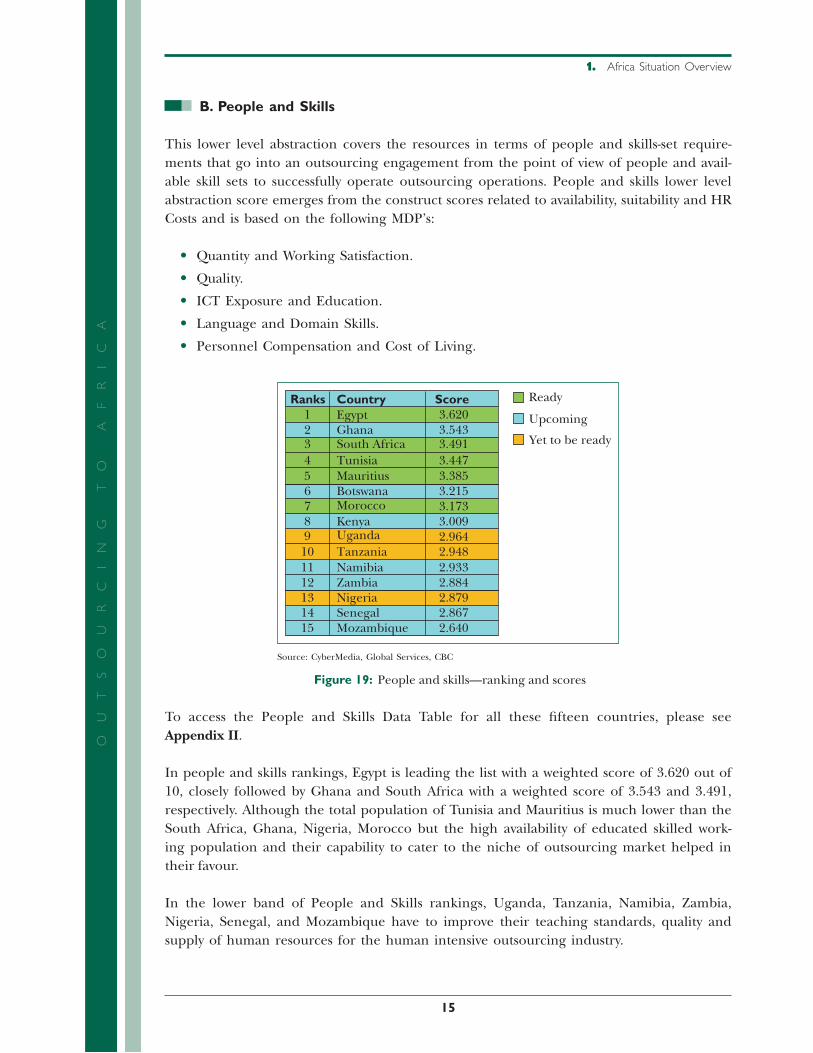
AB. People and Skills
This lower level abstraction covers the resources in terms of people and skills-set require-ments that go into an outsourcing engagement from the point of view of people and avail-able skill sets to successfully operate outsourcing operations. People and skills lower level abstraction score emerges from the construct scores related to availability, suitability and HR Costs and is based on the following MDP’s:
Quantity and Working Satisfaction.
Quality.
ICT Exposure and Education.
Language and Domain Skills.
Personnel Compensation and Cost of Living.
3.2153.1733.0092.9642.9482.9332.884
6789
101112131415
2.8792.8672.640
Ranks Country Score12345
3.6203.5433.4913.4473.385
BotswanaMoroccoKenyaUgandaTanzaniaNamibiaZambia
EgyptGhanaSouth AfricaTunisiaMauritius
NigeriaSenegalMozambique
Ready
Upcoming
Yet to be ready
Source: CyberMedia, Global Services, CBC
Figure 19: People and skills—ranking and scores
To access the People and Skills Data Table for all these fi fteen countries, please see Appendix II.
In people and skills rankings, Egypt is leading the list with a weighted score of 3.620 out of 10, closely followed by Ghana and South Africa with a weighted score of 3.543 and 3.491, respectively. Although the total population of Tunisia and Mauritius is much lower than the South Africa, Ghana, Nigeria, Morocco but the high availability of educated skilled work-ing population and their capability to cater to the niche of outsourcing market helped in their favour.
In the lower band of People and Skills rankings, Uganda, Tanzania, Namibia, Zambia, Nigeria, Senegal, and Mozambique have to improve their teaching standards, quality and supply of human resources for the human intensive outsourcing industry.
•
•
•
•
•
02_Africa_Report09_FR.indd Sec1:1502_Africa_Report09_FR.indd Sec1:15 2/26/09 12:14:10 PM2/26/09 12:14:10 PM

16
1. Africa Situation Overview
OU
TS
OU
RC
IN
G
TO
A
FR
IC
ABotswana, Morocco, Kenya, Uganda and Tanzania are in the mid ranks and can improve by improving the ICT exposure and by adopting better teaching standards suitable for out-sourcing industry.
To conclude, the variation in this lower level abstraction covering people and skills is not so great among all the fi fteen countries.
The contributing factors to these fi ndings are illustrated in the next section in graphs that show the scores achieved by each country in a given contributing parameter.
People and skills—availability
This construct gives a score that indicates the availability of human resources required for an outsourcing destination. The major data points are the quantity and working satisfaction in the country. Quantity is based on a number of detailed data parameters related to population, literacy, education levels, and unemployment rates.
The fi ndings for the fi fteen countries are shown as under.
People & Skills — Availability
Tuni
sia
Sout
h Af
rica
Moz
ambi
que
Gha
na
Keny
a
Mau
ritiu
s
Egyp
t
Botsw
ana
Sene
gal
Mor
occo
Zam
bia
Nig
eria
Nam
ibia
Tanz
ania
Uga
nda
Ready
1.4
1.2
1
0.8
0.6
0.4
0.2
0
Working Satisfaction Quantity
Upcoming Yet to be ready
Source: CyberMedia, Global Services, CBC
Figure 20: People and skills availability
It is interesting to observe that with diverse population fi gures from as low as 1.1 mil-lion to fi gures as high as 141 million all countries do contribute. The study has come up with tangible scores for all countries. The variation of the scores among the diverse countries is not so great. This shows that all fi fteen countries have potential, and our methodology caters for such a fair assessment in such diversity.
•
02_Africa_Report09_FR.indd Sec1:1602_Africa_Report09_FR.indd Sec1:16 2/26/09 12:14:10 PM2/26/09 12:14:10 PM

1. Africa Situation Overview
17
OU
TS
OU
RC
IN
G
TO
A
FR
IC
APeople and skills—suitability
The detailed data points relevant data from international sources as indicated in the methodology. The fi ndings for the fi fteen countries are shown as under.
Egypt
Mau
ritiu
s
South
Afri
ca
Tunisia
Moro
cco
Botswan
a
Ghana
Zambia
Namib
ia
Kenya
Seneg
al
Moza
mbiq
ue
Nigeria
Tanza
nia
Uganda
People & Skills—Suitability
ICT Exposure QualityEducation, Languages, and Domain skills
0.8
0.7
0.6
0.5
0.4
0.3
0.2
0.1
0
Ready Upcoming Yet to be ready
Source: CyberMedia, Global Services, CBC
Figure 21: People and skills suitability
This construct assesses the suitability of the human resources available in the country for outsourcing operations. The major data parameters include ICT exposure, educa-tion, language and domain skills, and quality.
The graph shows that there is a relatively large variation in ICT exposure among the different countries with the countries in the infrastructure ready and upcoming bands leading. In the case of education and quality all countries are comparable.
People and skills—human resource costs
This construct assesses the human resource cost factor in outsource operations and is based on scores for personnel compensation and the cost of living. The detailed data parameters used are from the UNDO local salary rates and cost of living index from World Bank World Development indicators. The fi ndings from the fi fteen countries are presented in the graph below. It is important to remember that a low score for the cost of living indicates an expensive country and similarly a high personal compensation score represents a lower salary rate. Thus Botswana, Ghana, and Tanzania are more competitive than South Africa or Tunisia.
•
•
02_Africa_Report09_FR.indd Sec1:1702_Africa_Report09_FR.indd Sec1:17 2/26/09 12:14:10 PM2/26/09 12:14:10 PM

18
1. Africa Situation Overview
OU
TS
OU
RC
IN
G
TO
A
FR
IC
APeople & Skills— HR Cost
HR Cost — Personal compensation1
0.8
0.6
0.4
0.2
0
Cost of living
Tuni
sia
Sout
h Af
rica
Mau
ritiu
s
Egyp
t
Mor
occo
Moz
ambi
que
Gha
na
Keny
a
Botsw
ana
Sene
gal
Zam
bia
Nam
ibia
Nig
eria
Tanz
ania
Uga
nda
Ready Upcoming Yet to be ready
Source: CyberMedia, Global Services, CBC
Figure 22: People and skills—HR costs
C. Business Environment
This lower-level abstraction covers a large number of factors that go into making a business operation successful in the country especially with reference to outsourcing. Factors like the economic outlook, corruption perception, rule of law, government policies related to outsourcing, tax policies, risk factors, and fi nancial aspects are considered in this data set.
3.3263.2613.0262.9762.9272.8132.781
6789
101112131415
2.7352.7132.711
Ranks Country Score12345
3.6953.5583.4863.4193.357
TunisiaMoroccoZambiaNamibiaSenegalKenyaGhana
MauritiusEgyptSouth AfricaNigeriaBotswana
TanzaniaUgandaMozambique
Ready
Upcoming
Yet to be ready
Source: CyberMedia, Global Services, CBC
Figure 23: Business environment—scores and ranking
The Business Environment lower-level abstraction score emerges from fi ve construct scores indicated:
02_Africa_Report09_FR.indd Sec1:1802_Africa_Report09_FR.indd Sec1:18 2/26/09 12:14:11 PM2/26/09 12:14:11 PM
1. Africa Situation Overview
19
OU
TS
OU
RC
IN
G
TO
A
FR
IC
ABusiness Environment Index.
ICT Industry Activeness.
Economic Outlook.
Risk Parameter.
Tax and Financial Incentives.
The detailed framework links the lower level abstraction with the constructs and major data points covered in Chapter 2 (Methodology).
To access the Business Environment Data Table for all the fi fteen countries, please see Appendix III.
In the business environment rankings, Mauritius is leading the list with weighted score of 3.695 for its business-positive environment. Egypt is at second position with a weighted score of 3.558; closely following is South Africa with weighted score of 3.486. Startlingly, the rank-ings of Tunisia and Morocco are trailing the list at sixth and seventh positions with weighted scores of 3.326 and 3.261, respectively.
The contributing factors to these fi ndings are illustrated in the next section in graphs that show the scores achieved by each country in a given contributing parameter.
Contributing Constructs and Major Data Points
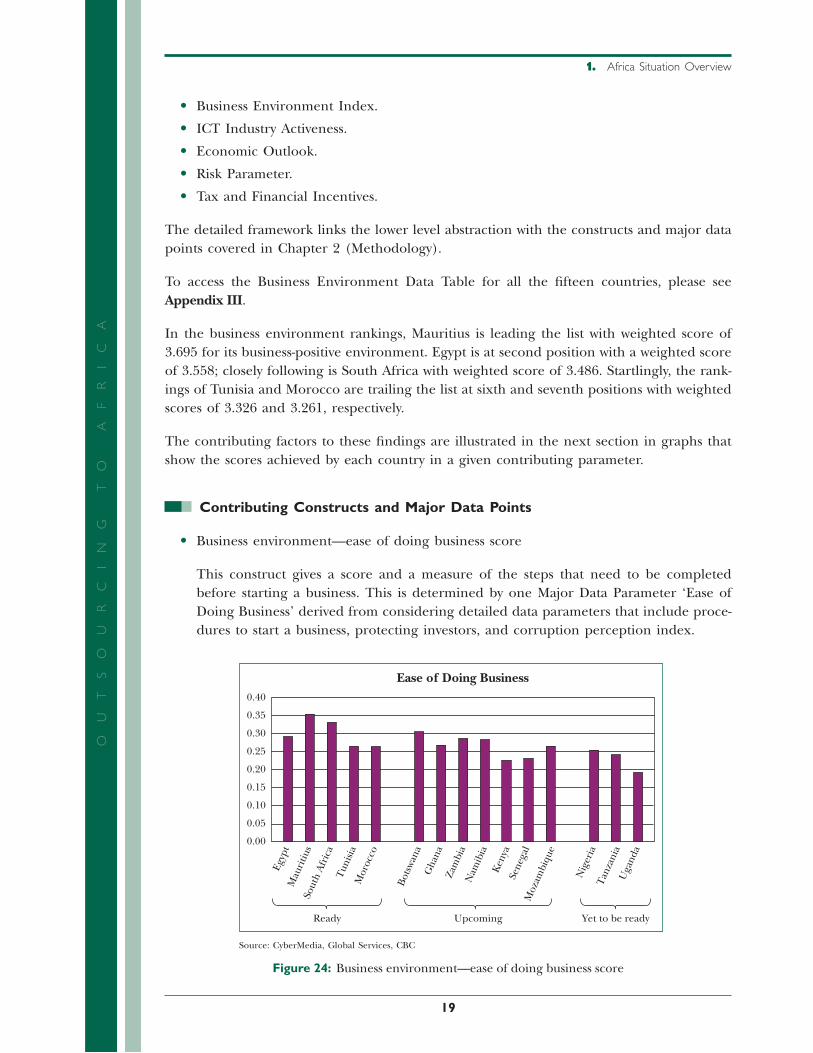
Business environment—ease of doing business score
This construct gives a score and a measure of the steps that need to be completed before starting a business. This is determined by one Major Data Parameter ‘Ease of Doing Business’ derived from considering detailed data parameters that include proce-dures to start a business, protecting investors, and corruption perception index.
Tun
isia
Sout
h A
fric
a
Moz
ambi
que
Gha
na
Ken
ya
Mau
ritiu
s
Egyp
t
Bots
wana
Sene
gal
Mor
occo
Zam
bia
Nig
eria
Nam
ibia
Tan
zani
aU
gand
a
Ready Upcoming Yet to be ready
0.40
0.35
0.30
0.25
0.20
0.15
0.10
0.05
0.00
Ease of Doing Business
Source: CyberMedia, Global Services, CBC
Figure 24: Business environment—ease of doing business score
•
•
•
•
•
•
02_Africa_Report09_FR.indd Sec1:1902_Africa_Report09_FR.indd Sec1:19 2/26/09 12:14:11 PM2/26/09 12:14:11 PM

20
1. Africa Situation Overview
OU
TS
OU
RC
IN
G
TO
A
FR
IC
AMauritius, South Africa, and Botswana are leading and are closely, followed by Egypt, though in practice Egypt is perhaps doing much better after the establishment of the General Authority for Investment and Free Zones (GAFI) as a true single window; in the case of outsourcing industry in Egypt, the Information Technology Industry Development Agency (ITIDA) supports the GAFI. The time and effort were found to have really improved as a result of this initiative. South Africa and Mauritius have simi-lar agencies in place working for the last few years, and once the Botswana Innovation Hub (BIH) is operational Botswana would improve further.
Business environment—ICT industry attractiveness score
The ICT industry attractiveness has been determined by the ICT Legislation and enforcement procedures in place and the magnitude of ICT in exports.
ICT Industry Attractiveness
0.450.4
0.350.3
0.250.2
0.150.1
0.050
Tuni
sia
Sout
h Af
rica
Mau
ritiu
s
Egyp
t
Moz
ambi
que
Gha
na
Keny
a
Botsw
ana
Sene
gal
Zam
bia
Nam
ibia
Nig
eria
Tanz
ania
Uga
nda
ICT Security; Cyber Laws and IPR Scores Expot & Share of ICT
Ready Upcoming Yet to be ready
Mor
occo
Source: CyberMedia, Global Services, CBC
Figure 25: Business environment—ICT industry attractiveness score
In ICT laws and its enforcement South Africa and Kenya lead (most banks do their back-offi ce processing there). Even Egypt, Botswana, Morocco, and Tunisia need to improve. Nigeria has a moderate score here, but this is a bit of a surprise as cyber crime literature reports that most cyber crime and related negative actions originate in Nigeria. Further, Nigeria has the highest score of ICT exports; however, it is in the Yet to be ready band. Perhaps this is due to the population of 141 million and several Nige-rians working abroad. It is a case of ‘Buddy Shopping’ like in the old days in India.
•
02_Africa_Report09_FR.indd Sec1:2002_Africa_Report09_FR.indd Sec1:20 2/26/09 12:14:11 PM2/26/09 12:14:11 PM

1. Africa Situation Overview
21
OU
TS
OU
RC
IN
G
TO
A
FR
IC
ABusiness environment—economic outlook score
This is based on economic and trade parameters.
Tuni
sia
Sout
h Af
rica
Moz
ambi
que
Gha
na
Keny
a
Mau
ritiu
s
Egyp
t
Botsw
ana
Sene
gal
Mor
occo
Zam
bia
Nig
eria
Nam
ibia
Tanz
ania
Uga
nda
Ready Upcoming Yet to be ready
0.400.350.300.250.200.150.100.050.00
Economic OutlookShare of Services in GDP, Economy Size and Growth, InflationShare of Exports, Share of Services in ExportsCountry Forex Reserves
Source: CyberMedia, Global Services, CBC
Figure 26: Business Environment—economic outlook score
As per the report, South Africa, Mauritius, and Botswana lead with Egypt and Tunisia following close behind.
Business environment—risk parameter score
This factor is determined from the perceived risk in the country from geopolitical, currency fl uctuation, and legislative risk.
Business Environment—Risk Parameter
0.600.500.400.300.200.100.00
Tuni
sia
Sout
h Af
rica
Mau
ritiu
s
Egyp
t
Mor
occo
Moz
ambi
que
Gha
na
Keny
a
Botsw
ana
Sene
gal
Zam
bia
Nam
ibia
Nig
eria
Tanz
ania
Uga
nda
Geo-Political Risk Currecy Risk Legislative Risk
Ready Upcoming Yet to be ready
Source: CyberMedia, Global Services, CBC
Figure 27: Business environment—risk parameter score
•
•
02_Africa_Report09_FR.indd Sec1:2102_Africa_Report09_FR.indd Sec1:21 2/26/09 12:14:11 PM2/26/09 12:14:11 PM
22
1. Africa Situation Overview
OU
TS
OU
RC
IN
G
TO
A
FR
IC
AEgypt, Tunisia, and Morocco lead with the least risk in all three factors followed by South Africa and Botswana in all aspects except the currency risk where South Africa, Botswana, and Namibia (all ties to the rand basket) are the worst in Africa.
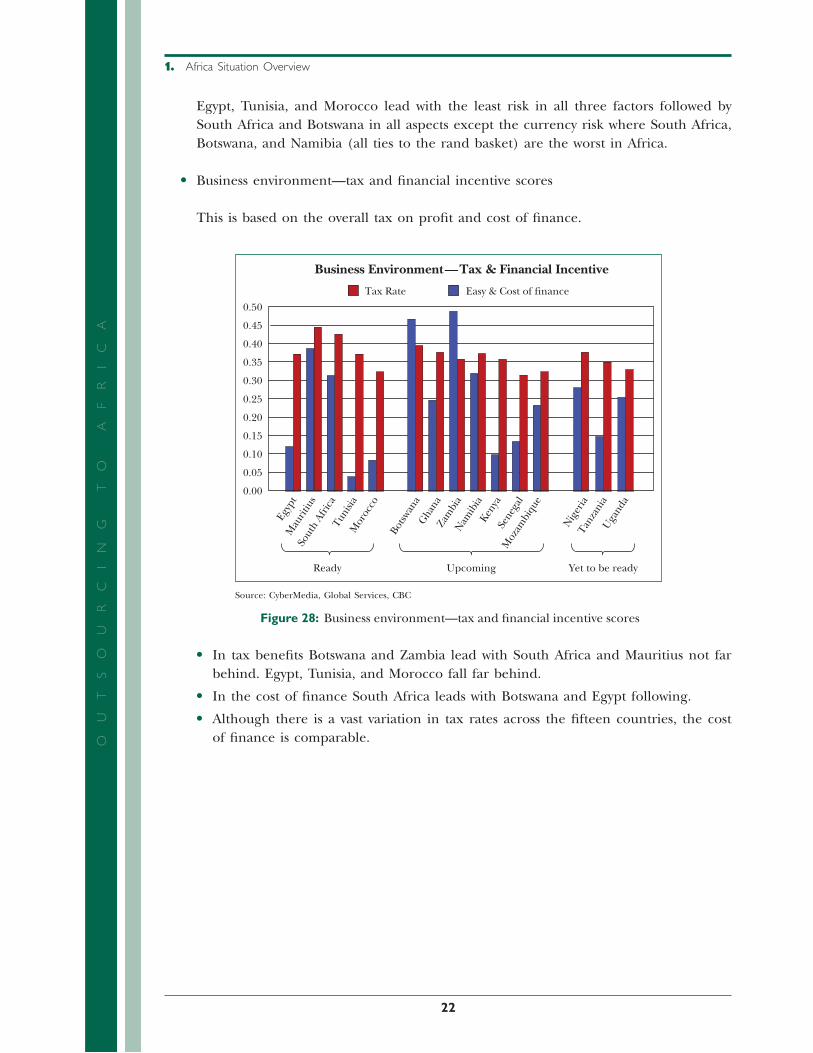
Business environment—tax and fi nancial incentive scores
This is based on the overall tax on profi t and cost of fi nance.
Business Environment—Tax & Financial Incentive
0.35
0.50
0.45
0.40
0.30
0.25
0.20
0.15
0.10
0.00
0.05
Tuni
sia
Sout
h Af
rica
Mau
ritiu
s
Egyp
t
Mor
occo
Moz
ambi
que
Gha
na
Keny
a
Botsw
ana
Sene
gal
Zam
bia
Nam
ibia
Nig
eria
Tanz
ania
Uga
nda
Tax Rate Easy & Cost of finance
Ready Upcoming Yet to be ready
Source: CyberMedia, Global Services, CBC
Figure 28: Business environment—tax and fi nancial incentive scores
In tax benefi ts Botswana and Zambia lead with South Africa and Mauritius not far behind. Egypt, Tunisia, and Morocco fall far behind.
In the cost of fi nance South Africa leads with Botswana and Egypt following.
Although there is a vast variation in tax rates across the fi fteen countries, the cost of fi nance is comparable.
•
•
•
•
02_Africa_Report09_FR.indd Sec1:2202_Africa_Report09_FR.indd Sec1:22 2/26/09 12:14:12 PM2/26/09 12:14:12 PM
23
OU
TS
OU
RC
IN
G
TO
A
FR
IC
A
2. METHODOLOGY
This part of the report describes the research methodology followed
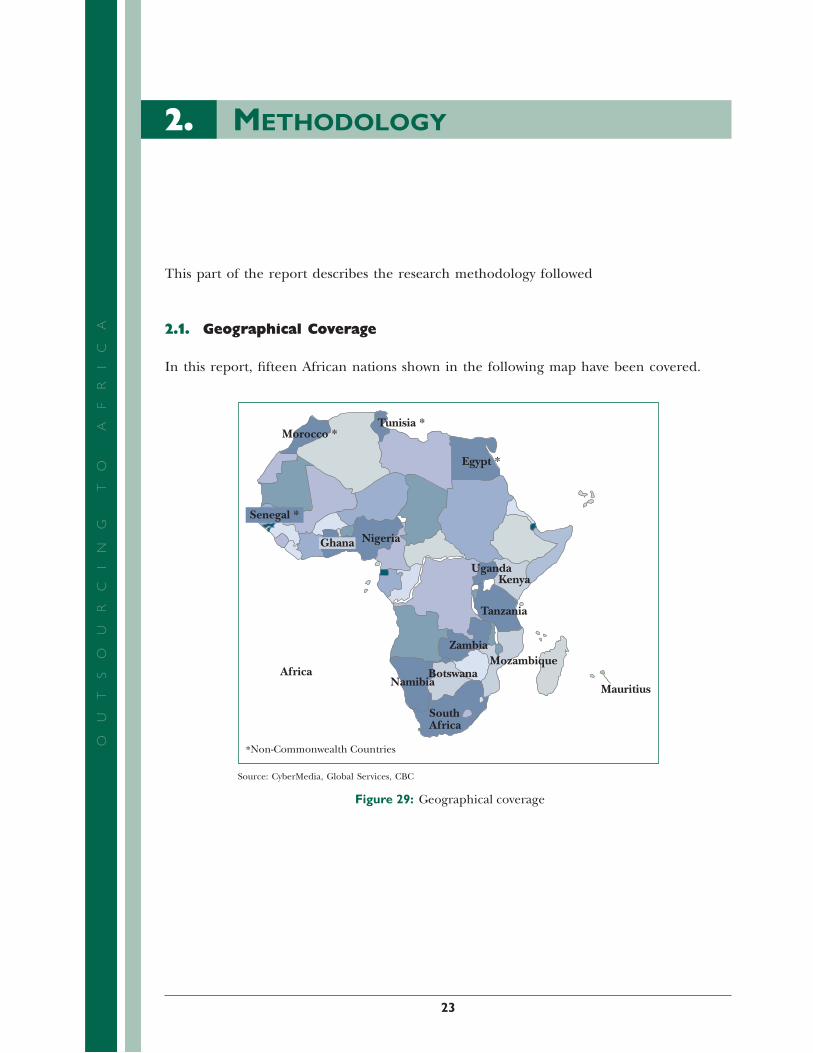
2.1. Geographical Coverage
In this report, fi fteen African nations shown in the following map have been covered.
Morocco *Tunisia *
Egypt *
Senegal *
Ghana Nigeria
UgandaKenya
Tanzania
ZambiaMozambique
BotswanaNamibia
SouthAfrica
MauritiusAfrica
*Non-Commonwealth Countries
Source: CyberMedia, Global Services, CBC
Figure 29: Geographical coverage
02_Africa_Report09_FR.indd Sec1:2302_Africa_Report09_FR.indd Sec1:23 2/26/09 12:14:12 PM2/26/09 12:14:12 PM
24
OU
TS
OU
RC
IN
G
TO
A
FR
IC
A2.2. Research Framework and Design
CyberMedia Research Framework
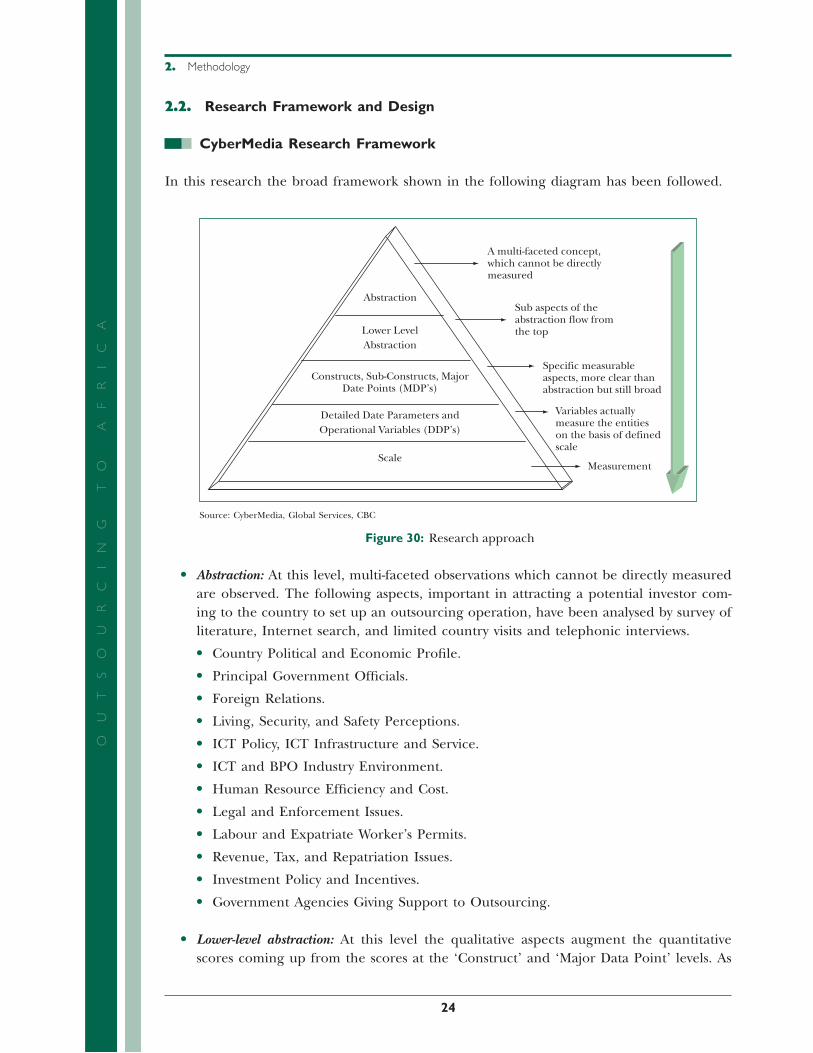
In this research the broad framework shown in the following diagram has been followed.
A multi-faceted concept,which cannot be directlymeasured
Sub aspects of theabstraction flow fromthe top
Specific measurableaspects, more clear thanabstraction but still broad
Variables actuallymeasure the entitieson the basis of definedscale
MeasurementScale
Lower LevelAbstraction
Detailed Date Parameters andOperational Variables (DDP’s)
Constructs, Sub-Constructs, MajorDate Points (MDP’s)
Abstraction
Source: CyberMedia, Global Services, CBC
Figure 30: Research approach
Abstraction: At this level, multi-faceted observations which cannot be directly measured are observed. The following aspects, important in attracting a potential investor com-ing to the country to set up an outsourcing operation, have been analysed by survey of literature, Internet search, and limited country visits and telephonic interviews.
Country Political and Economic Profi le.
Principal Government Offi cials.
Foreign Relations.
Living, Security, and Safety Perceptions.
ICT Policy, ICT Infrastructure and Service.
ICT and BPO Industry Environment.
Human Resource Effi ciency and Cost.
Legal and Enforcement Issues.
Labour and Expatriate Worker’s Permits.
Revenue, Tax, and Repatriation Issues.
Investment Policy and Incentives.
Government Agencies Giving Support to Outsourcing.
Lower-level abstraction: At this level the qualitative aspects augment the quantitative scores coming up from the scores at the ‘Construct’ and ‘Major Data Point’ levels. As
•
•
•
•
•
•
•
•
•
•
•
•
•
•
2. Methodology
02_Africa_Report09_FR.indd Sec1:2402_Africa_Report09_FR.indd Sec1:24 2/26/09 12:14:12 PM2/26/09 12:14:12 PM

25
OU
TS
OU
RC
IN
G
TO
A
FR
IC
Athe scores have to be added in a weighted sum depending on the relative importance of each data point, a careful normalisation and calculation method has been evolved. The weightage is defi ned in detailed research framework charts. These are explained in the next sections.
Constructs: These are specifi c and more measurable aspects, broad but clearer, than the lower level abstraction. The construct scores are derived by a weighted sum of ‘Major Data Points’. The principles are the same as indicated for lower level abstracts.
Major data points: These are more specifi c and more measurable aspects. The ‘Major Data Points’ scores are derived by the average of all the ‘Detailed Data Points’ allotted to that ‘Major Data Point’. The principles are the same as indicated for lower level abstracts.
Detailed data points: These are variables actually measured on the basis of unit and skill. In this research, such data has been collected from reliable internationally recognised and published reports. The data that has been used is in two forms:
Rating Scores representing the result of any extensive survey and study conducted by a recognised board like World Economic Forum’s Global Information Technology Report or Global Competitiveness Report, the United Nations Human Developments Reports. Such scores are in a skill of one to ten, one to seven, or zero to one.
Absolute values of data like number of procedures to start a business, total tax as a percentage of profi t (World Bank doing Business Report or International Internet Bandwidth [Bits per person]).
2.3. Normalization and Calculation
Normalization
All the scores need to be added, averaged, or proportionately averaged; thus normalisation is necessary. Thus scores for the ‘Detailed Data Points’ are determined as follows:
All rating scores in the range of zero to one, one to seven, or one to ten are normalised proportionately to a range of one to ten across all the data. All scores used further are thus in the range of one to ten before the weightage specifi ed in the detailed frame-work are applied.
All data in the form of absolute values are normalised to a score by using the follow-ing formulae
Score = Score = 1+ ((LOG10 (Actual Value)-LOG10 (Min Value))/(LOG10 (Max Value)-LOG10 (Min Value)))*9
Calculation
The calculations are done as follows:
‘Lower Level Abstract’ Score = Weighted Average of contributing ‘Constructs’ Scores.
‘Construct’ Scores = Weighted Average of contributing ‘Major Data Point’ Scores.
•
•
•
•
•
•
•
•
•
2. Methodology
02_Africa_Report09_FR.indd Sec1:2502_Africa_Report09_FR.indd Sec1:25 2/26/09 12:14:13 PM2/26/09 12:14:13 PM

26
OU
TS
OU
RC
IN
G
TO
A
FR
IC
A‘Major Data Point’ Scores = Average of contributing ‘Detailed Data Point’ Scores.
‘Detailed Data Point’ Score = the normalised value of the score as per the rule and formulae given above.
The overall ‘Outsourcing Attractiveness Index’ is determined by the following method:
People and Skills(50%)
BusinessEnvironment (50%)
OutsourcingAttractivenessRank
Lower Level Abstraction
Detailed Framework
Source: CyberMedia, Global Services, CBC
Figure 31: Detailed framework—outsourcing attractiveness
Outsourcing Attractiveness Index
Countries are ranked within their bands based on theirBE + People & Skill Scores
Countries are ranked within their bands based on their:
People & Skills Scores
plus
Business Environment Scores
Source: CyberMedia, Global Services, CBC
Figure 32: Components leading to outsourcing attractiveness
A. Infrastructure Bands
The ‘Infrastructure’ lower level abstraction score is calculated as per the detailed frame-work and the normalisation and calculation method indicated above.
The countries with an infrastructure score greater than 6.5 are placed in the ‘Ready’ band.
•
•
•
•
2. Methodology
02_Africa_Report09_FR.indd Sec1:2602_Africa_Report09_FR.indd Sec1:26 2/26/09 12:14:13 PM2/26/09 12:14:13 PM

27
OU
TS
OU
RC
IN
G
TO
A
FR
IC
AThe countries with an infrastructure score between 5.5 and 6.5 are placed in the ‘Upcoming’ band.
The countries with an infrastructure score less than 5.5 are placed in the ‘Yet to be ready’ band.
B. People & Skills and Business Environment Scores
The ‘People and Skills’ lower level abstraction score is calculated as per the detailed framework and the normalisation and calculation method indicated above.
The ‘Business Environment’ lower level abstraction score is calculated as per the detailed framework and the normalisation and calculation method indicated above.
C. Overall Outsourcing Attractiveness Scores and Ranks
The ‘Outsourcing Attractiveness’ score of the country is determined for countries in each band. This is the sum of the ‘People and Skills’ score and ‘Business Environment’ score.
The rankings are made in each band using this total score.
The following diagram shows this approach graphically.
The Approach
Political Economic Social Technology People
✓Attractiveness in terms of Outsourcing✓Characteristics of a country
Skill-sets
Business Environment People & Skills
Ready/UpcomingYet to be Ready
Infrastructure
Source: CyberMedia, Global Services, CBC
Figure 33: Detailed framework—outsourcing attractiveness
•
•
•
•
•
•
2. Methodology
02_Africa_Report09_FR.indd Sec1:2702_Africa_Report09_FR.indd Sec1:27 2/26/09 12:14:13 PM2/26/09 12:14:13 PM
28
OU
TS
OU
RC
IN
G
TO
A
FR
IC
A2.4. Defi nitions of Lower Level Abstraction, Constructs,
and Major Data Points
Lower-Level Abstraction
Infrastructure: This ‘Infrastructure Ready/Upcoming/Yet to be ready Decision’ scores are calculated on a separate scale and cover all the important parameters needed to set-up the facility for outsourcing work. This scale would judge the nation’s infrastructure on a scale denoted by Ready/Upcoming/Yet to be ready. These parameters include two major ‘Constructs’: Availability/Penetration and Cost.
People and skills: This ‘Lower level abstraction’ covers the extent to which the human resource needs of the outsourcing engagement are met by the country in terms of number of personnel available, their suitability for outsourcing, and the cost of person-nel meeting these needs. There are three constructs: availability, suitability, and cost.
Business environment: This has fi ve constructs that cover various aspects of the business environment that make a country favourable or otherwise to attract an outsourcing operation.
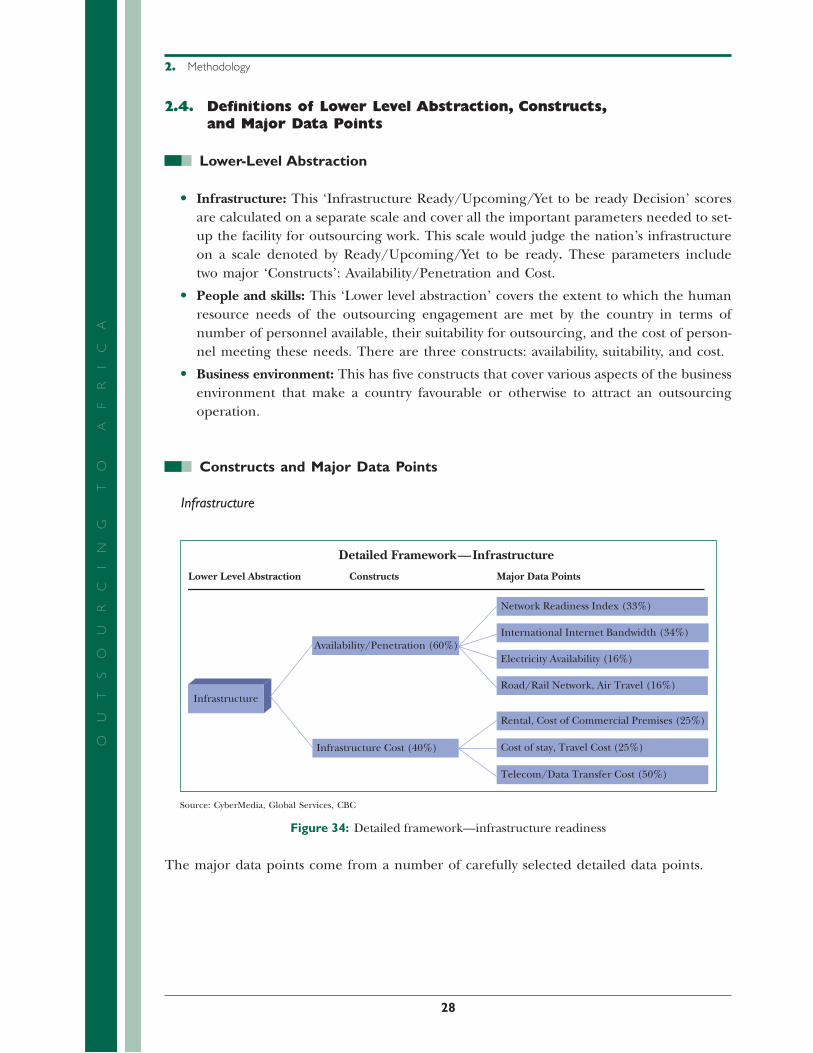
Constructs and Major Data Points
Infrastructure
Infrastructure
Infrastructure Cost (40%)
Availability/Penetration (60%)
Lower Level Abstraction Constructs
Detailed Framework—Infrastructure
Major Data Points
Network Readiness Index (33%)
International Internet Bandwidth (34%)
Electricity Availability (16%)
Road/Rail Network, Air Travel (16%)
Rental, Cost of Commercial Premises (25%)
Cost of stay, Travel Cost (25%)
Telecom/Data Transfer Cost (50%)
Source: CyberMedia, Global Services, CBC
Figure 34: Detailed framework—infrastructure readiness
The major data points come from a number of carefully selected detailed data points.
•
•
•
2. Methodology
02_Africa_Report09_FR.indd Sec1:2802_Africa_Report09_FR.indd Sec1:28 2/26/09 12:14:13 PM2/26/09 12:14:13 PM
29
OU
TS
OU
RC
IN
G
TO
A
FR
IC
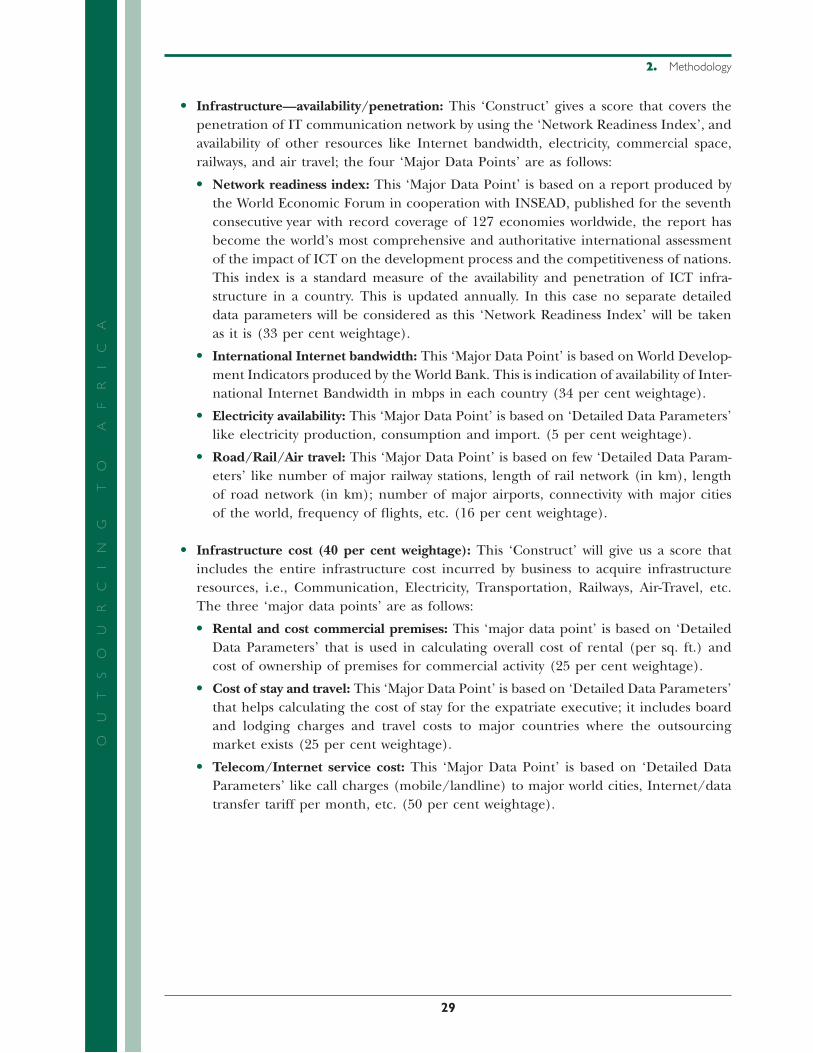
AInfrastructure—availability/penetration: This ‘Construct’ gives a score that covers the penetration of IT communication network by using the ‘Network Readiness Index’, and availability of other resources like Internet bandwidth, electricity, commercial space, railways, and air travel; the four ‘Major Data Points’ are as follows:
Network readiness index: This ‘Major Data Point’ is based on a report produced by the World Economic Forum in cooperation with INSEAD, published for the seventh consecutive year with record coverage of 127 economies worldwide, the report has become the world’s most comprehensive and authoritative international assessment of the impact of ICT on the development process and the competitiveness of nations. This index is a standard measure of the availability and penetration of ICT infra-structure in a country. This is updated annually. In this case no separate detailed data parameters will be considered as this ‘Network Readiness Index’ will be taken as it is (33 per cent weightage).
International Internet bandwidth: This ‘Major Data Point’ is based on World Develop-ment Indicators produced by the World Bank. This is indication of availability of Inter-national Internet Bandwidth in mbps in each country (34 per cent weightage).
Electricity availability: This ‘Major Data Point’ is based on ‘Detailed Data Parameters’ like electricity production, consumption and import. (5 per cent weightage).
Road/Rail/Air travel: This ‘Major Data Point’ is based on few ‘Detailed Data Param-eters’ like number of major railway stations, length of rail network (in km), length of road network (in km); number of major airports, connectivity with major cities of the world, frequency of fl ights, etc. (16 per cent weightage).
Infrastructure cost (40 per cent weightage): This ‘Construct’ will give us a score that includes the entire infrastructure cost incurred by business to acquire infrastructure resources, i.e., Communication, Electricity, Transportation, Railways, Air-Travel, etc. The three ‘major data points’ are as follows:
Rental and cost commercial premises: This ‘major data point’ is based on ‘Detailed Data Parameters’ that is used in calculating overall cost of rental (per sq. ft.) and cost of ownership of premises for commercial activity (25 per cent weightage).
Cost of stay and travel: This ‘Major Data Point’ is based on ‘Detailed Data Parameters’ that helps calculating the cost of stay for the expatriate executive; it includes board and lodging charges and travel costs to major countries where the outsourcing market exists (25 per cent weightage).
Telecom/Internet service cost: This ‘Major Data Point’ is based on ‘Detailed Data Parameters’ like call charges (mobile/landline) to major world cities, Internet/data transfer tariff per month, etc. (50 per cent weightage).
•
•
•
•
•
•
•
•
•
2. Methodology
02_Africa_Report09_FR.indd Sec1:2902_Africa_Report09_FR.indd Sec1:29 2/26/09 12:14:14 PM2/26/09 12:14:14 PM

30
OU
TS
OU
RC
IN
G
TO
A
FR
IC
APeople and Skills
H R Cost (30%)
People and Skills
Availability (40%)
Suitability (30%)
Quantity (75%)
Working Satisfaction (25%)
ICT Exposure (53%)
Education, Languages, and Domain Skills (33%)
Quality (14%)
Personnel Compensation at Various Levels (66%)
Cost of Living (34%)
Detailed Framework—People and Skills
Lower Level Abstraction Constructs Major Data Points
Source: CyberMedia, Global Services, CBC
Figure 35: Detailed framework—merit of people and skills
People and skills—availability: This ‘Construct’ gives a score that gives us an idea of the quantity of personnel available along with the attrition rates of available person-nel leaving; this will give a score to assess the availability of personnel in the country. (40 per cent weightage). The two ‘Major Data Points’ thus are as follows:
Quantity: This ‘Major Data Point’ is based on a number of ‘detailed data parameters’ like population, education, qualifi ed personnel available, ease of meeting shortfalls by expatriate employment, unemployment rate, and so on (75 per cent weightage).
Working satisfaction: This major data point is derived from the UNDP human develp-ment report 2008. This HDI Index, a number from 0 to 1, indicates the overall satisfaction in working in that country. (See Table B of section 2.5, S. No. 9 to understand it better.)
People and skills suitability: This ‘Construct’ gives a score that gives us an idea of the compatibility of personnel to the outsourcing work, based on quality of personnel, their language skills, and exposure to the cultures of other countries that are the outsourced service markets, (30 per cent weightage). The four ‘Major Data Points’ are as follows:
ICT exposure: This ‘Major Data Point’ will give an idea of the familiarity that the people or the available work force has to ICT. Detailed data parameters like density of PCs, mobile phones, Internet, etc., among the people will be used to assess this factor (53 per cent weightage).
Education, languages, and domain skills: This ‘Major Data Point’ is based on a few ‘detailed data parameters’ like knowledge of European languages, management, and ICT/domain skills relevant to outsourcing operations. The level of accreditation
•
•
•
•
•
•
2. Methodology
02_Africa_Report09_FR.indd Sec1:3002_Africa_Report09_FR.indd Sec1:30 2/26/09 12:14:14 PM2/26/09 12:14:14 PM

31
OU
TS
OU
RC
IN
G
TO
A
FR
IC
Aof these skills and qualifi cations to international standards will also be considered (33 per cent weightage).
Quality: This ‘Major Data Point’ is based on a few ‘detailed data parameters’ like the attitude of people towards work, health conditions affecting effi cient operations, and related issues (14 per cent weightage).
People and skills—HR cost: This ‘Construct’ gives a score that gives us an idea of the cost of personnel doing the outsourcing work (30 per cent weightage). The two ‘Major Data Points’ are as follows:
Compensation at various levels: This ‘Major Data Point’ is based on a few ‘detailed data parameters’ like the cost of a fresh graduate, cost of a professional with fi ve years’ experience, average cost of all other personnel, and related parameters (66 per cent weightage).
Consumer price index: This ‘Major Data Point’ is based on a few ‘detailed data parameters’ like the cost of living index, cost of medical insurance, cost of children’s education, and similar factors (34 per cent weightage).
Business Environment
BusinessEnvironment
Business Environment Index (10%)
ICT Industry Attractiveness (20%)
Economic Outlook (20%)
Risk Parameter (30%)
Tax & Financial Incentives (20%)
Lower Level Abstraction Constructs
Detailed Framework–Business Environment
Source: CyberMedia, Global Services, CBC
Figure 36: Detailed framework—merit of business environment
•
•
•
•
2. Methodology
02_Africa_Report09_FR.indd Sec1:3102_Africa_Report09_FR.indd Sec1:31 2/26/09 12:14:14 PM2/26/09 12:14:14 PM

32
OU
TS
OU
RC
IN
G
TO
A
FR
IC
A
ICT IndustryAttractiveness (20%)
Economic Outlook(20%)
Business EnvironmentIndex (10%)
Ease of Doing Business (100%)
ICT Security, Cyber Laws ans IPR (66%)
Exports and Share of ICT (34%)
Share of Services in GDP, Size and Growth, Inflation (40%)
Share of Exports, Share of Services in Exports (40%)
Foreign Exchange/Gold Reserves (20%)
Constructs Major Data Points
Detailed Framework—Business Environment
Source: CyberMedia, Global Services, CBC
Figure 37: Detailed framework—components of business environment
Risk Parameter (30%)
Tax & Financial Incentive (20%)
Geopolitical Risk (33%)
Currency Risk (33%)
Legislative Risk (34%)
Tax Rate (50%)
Ease & Cost of Finance (50%)
Constructs Major Data Points
Detailed Framework—Business Environment
Source: CyberMedia, Global Services, CBC
Figure 38: Detailed framework—components of business environment
Business Environment—business environment index: This ‘Construct’ will give us a score that covers all the important parameters needed for positive business environ-ment of a nation. This data will be taken from the World Bank ‘Ease of Doing Business’ research that examines a number of factors like starting a business, licences, employing workers, property, taxes, credit, protecting investors, enforcing contracts, trading across borders, and closing a business (10 per cent weightage).
Business Environment—ICT industry attractiveness: This ‘Construct’ will give us a score that covers all the important parameters needed for ICT Industry Attractiveness of a nation (20per cent weightage). It includes the following ‘Major Data Points’:
•
•
2. Methodology
02_Africa_Report09_FR.indd Sec1:3202_Africa_Report09_FR.indd Sec1:32 2/26/09 12:14:14 PM2/26/09 12:14:14 PM

33
OU
TS
OU
RC
IN
G
TO
A
FR
IC
ASecurity/IPR law: This ‘major data point’ will be based on ‘Detailed Data Param-eters’ like IPR laws, Cyber laws, etc. (66 per cent weightage).
Export and share of ICT industry: This ‘major data point’ will be based on ‘Detailed Data Parameters’ that helps us estimate the ICT industry size of a nation. It will also cover factors like total export/import of services, telecommunication revenue, etc. (34 per cent weightage).
Business Environment—economic outlook: This ‘Construct’ will give us a score that covers all the important parameters needed to defi ne Economic Outlook of a nation (20 per cent weightage). It includes the following ‘Major Data Points’:
Percentage of services of GDP, size and growth and infl ation: This ‘Major Data Point’ will be based on ‘Detailed Data Parameters’ like Total GDP, percentage of share of Services, increase of GDP, and Economic Growth, Infl ation of a nation (40 per cent weightage).
Percentage share of exports and share of services: This ‘major data point’ is based on ‘Detailed Data Parameters’ like percentage of Exports in overall economy of a nation (40 per cent weightage).
Foreign exchange/gold reserves: This ‘major data point’ is based on ‘Detailed Data Parameters’ like foreign exchange/gold reserves of a nation, etc. (20 per cent weightage).
Business Environment—risk parameters: This ‘Construct’ gives us a score that cov-ers all the important risk parameters needed to defi ne the risk to operate a business (30 per cent weightage). It includes the following ‘Major Data Points’:
Geo-political risk: Political risk, also known as ‘geopolitical risk’—the risk that an investment’s returns could suffer as a result of political changes or instability in a country. This ‘major data point’ is based on instability affecting investment returns could stem from a ‘Detailed Data Parameters’ like change in government, other foreign policy makers, or military control, factors in enforcement of contracts, etc. (33 per cent weightage).
Currency risk: The risk that a business’ operations or an investment’s value is affected by changes in exchange rates. This ‘major data point’ is based on ‘Detailed Data Parameters’ like rate of currency fl uctuation, changes in the value of the currency relative to the American dollar, total loss or gain on the investment when the money is converted back, etc. (33 per cent weightage).
Legislative risk: The risk that a new law or a change in an existing law, cost, and efforts in the enforcement of a contract could have a signifi cant impact on an invest-ment. This ‘Major Data Point’ is based on ‘Detailed Data Parameters’ like stability in legislative reform, judicial independence, etc. (34 per cent weightage).
Business Environment Tax and Financial Incentive (20 per cent weightage): This ‘Con-struct’ gives us a score that covers the entire imperative parameters needed to compute the fi nancial depth of a nation. It includes the following ‘Major Data Points’:
Tax rate (per cent of profi t): This ‘Major Data Point’ is based on ‘Detailed Data Parameters’ like corporate tax rates, VAT, property tax, stamp duty on advertisements,
•
•
•
•
•
•
•
•
•
•
•
•
2. Methodology
02_Africa_Report09_FR.indd Sec1:3302_Africa_Report09_FR.indd Sec1:33 2/26/09 12:14:15 PM2/26/09 12:14:15 PM

34
OU
TS
OU
RC
IN
G
TO
A
FR
IC
Atax on insurance premiums, social security contributions, tax concessions for IT- enabled services exports, etc. (50 per cent weightage).
Ease and cost of fi nance: This ‘Major Data Point’ will be based on ‘Detailed Data Parameters’ like bank interest on fi nances necessary for setting up outsourced service industry, Financial market sophistication, extent, and effect of taxation, etc. (50 per cent weightage).
2.5. Defi nitions of Data Parameters, Units of Measurements, and Source
Table A. Infrastructure Data Points
S. No. Detailed Data Parameter and Units Source
Ava
ilabi
lity/
Pene
trat
ion
Network readiness
1 Network Readiness Index (Score from one to seven)
WEF Global IT
International Internet bandwidth
2 International Internet Bandwidth (Bits/Person)
WDI
Electricity availability
3 Electricity Consumption (Bn KWH) CIA Fact Sheet
4 Electricity Production (Bn KWH) CIA Fact Sheet
5 Electricity Import (Bn KWH) CIA Fact Sheet
6 Quality of electricity supply WEF
Road/Rail network, air travel
7 Quality of railroad infrastructure (Score from one to seven)
Global Competitiveness Report 2008, WEF
8 Quality of roads (Score from one to seven) Global Competitiveness Report 2008, WEF
9 Quality of air transport infrastructure (Score from one to seven)
Global Competitiveness Report 2008, WEF
Infr
astr
uctu
re C
ost
Rental, cost of commercial premises
10 Average rent per month (USD/sq. meter) Africa Property Research Report 2007: Knight Frank
11 Average cost of Commercial space (USD/sq. meter) Africa Property Research Report 2007: Knight Frank
Cost of stay & travel
12 Hotel tariff (USD) UN Travel Allowance
13 Other Charges (USD) UN Travel Allowance
14 Cost of Air Travel (USD) (London—Nearest Int. Airport)
Prevailing Ticket Rate
Telecom/Data transfer cost
15 Call rate for US (USD/3 min) World Bank
16 Internet Service Cost/Month (USD) World Bank
•
2. Methodology
02_Africa_Report09_FR.indd Sec1:3402_Africa_Report09_FR.indd Sec1:34 2/26/09 12:14:15 PM2/26/09 12:14:15 PM
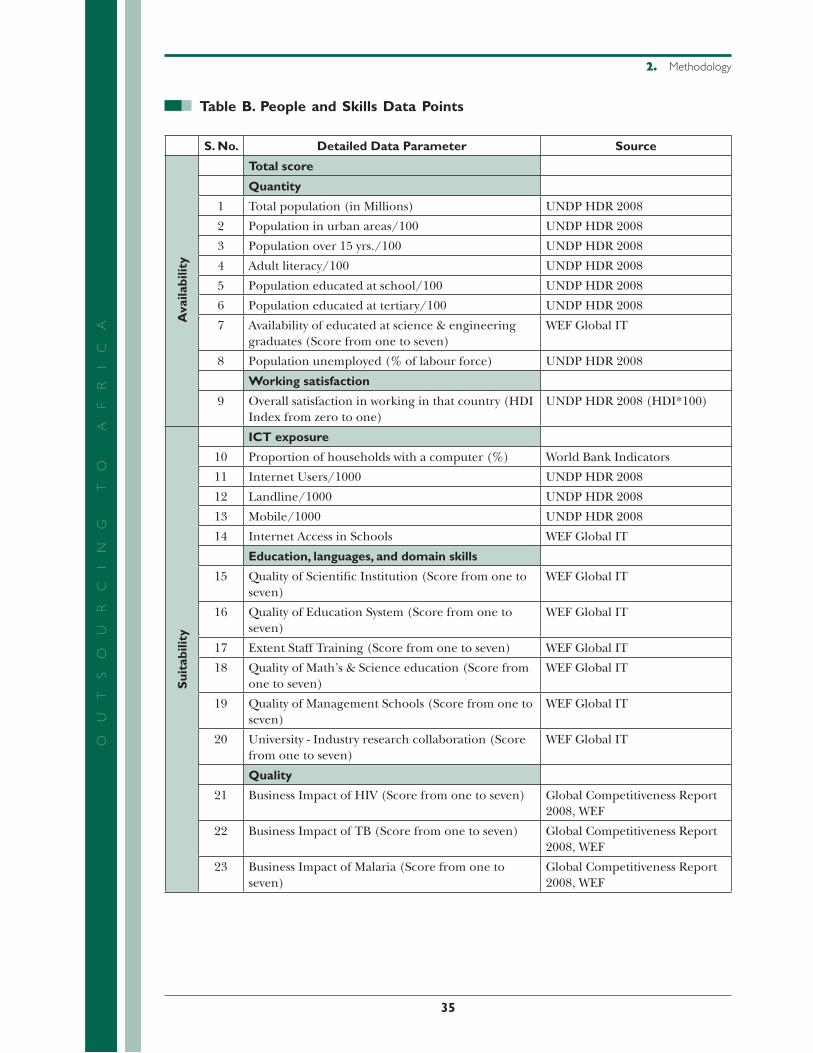
35
OU
TS
OU
RC
IN
G
TO
A
FR
IC
ATable B. People and Skills Data Points
S. No. Detailed Data Parameter Source
Ava
ilabi
lity
Total score
Quantity
1 Total population (in Millions) UNDP HDR 2008
2 Population in urban areas/100 UNDP HDR 2008
3 Population over 15 yrs./100 UNDP HDR 2008
4 Adult literacy/100 UNDP HDR 2008
5 Population educated at school/100 UNDP HDR 2008
6 Population educated at tertiary/100 UNDP HDR 2008
7 Availability of educated at science & engineering graduates (Score from one to seven)
WEF Global IT
8 Population unemployed (% of labour force) UNDP HDR 2008
Working satisfaction
9 Overall satisfaction in working in that country (HDI Index from zero to one)
UNDP HDR 2008 (HDI*100)
Sui
tabi
lity
ICT exposure
10 Proportion of households with a computer (%) World Bank Indicators
11 Internet Users/1000 UNDP HDR 2008
12 Landline/1000 UNDP HDR 2008
13 Mobile/1000 UNDP HDR 2008
14 Internet Access in Schools WEF Global IT
Education, languages, and domain skills
15 Quality of Scientifi c Institution (Score from one to seven)
WEF Global IT
16 Quality of Education System (Score from one to seven)
WEF Global IT
17 Extent Staff Training (Score from one to seven) WEF Global IT
18 Quality of Math’s & Science education (Score from one to seven)
WEF Global IT
19 Quality of Management Schools (Score from one to seven)
WEF Global IT
20 University - Industry research collaboration (Score from one to seven)
WEF Global IT
Quality
21 Business Impact of HIV (Score from one to seven) Global Competitiveness Report 2008, WEF
22 Business Impact of TB (Score from one to seven) Global Competitiveness Report 2008, WEF
23 Business Impact of Malaria (Score from one to seven)
Global Competitiveness Report 2008, WEF
2. Methodology
02_Africa_Report09_FR.indd Sec1:3502_Africa_Report09_FR.indd Sec1:35 2/26/09 12:14:15 PM2/26/09 12:14:15 PM

36
OU
TS
OU
RC
IN
G
TO
A
FR
IC
AS. No. Detailed Data Parameter Source
H R
Co
st
Personnel compensation at various levels
24 Cost of fresh graduate Agent (USD per yr) Local UN Salary Rates
25 Cost of experienced Agent Local UN Salary Rates
26 Cost of Executives Local UN Salary Rates
27 Cost of Manager Local UN Salary Rates
Cost of living
28 Consumer price index (2000=100) WDI
Table C. Business Environment Data Points
S. No. Detailed Data Parameter Source
BE
Ind
ex
Ease of doing business
1 No. of procedures to start a business Global Competitiveness Report WEF 2008
2 Protecting Investors (Score from one to ten) Doing Business
3 Corruption Perception Index (zero least desirable to ten most desirable)
Africa Development Indicators, World Bank
ICT
Ind
ustr
y A
ttra
ctiv
enes
s
ICT security, Cyber laws and protection of intellectual property rights
4 Laws Related to ICT (Score from one to seven) WEF Global IT
5 Intellectual Property Protection (Score from one to seven)
WEF Global IT
6 Accessibility of digital content (Score from one to seven)
WEF Global IT
Exports and share of ICT
7 Computer, Communication, and other services (% of commercial service imports)
WDI
8 Computer, Communication, and other services (% of commercial service exports)
WDI
9 Telecommunication Revenue (% of GDP) WDI
Eco
nom
ic O
utlo
ok
Share of services in GDP, economy size and growth, infl ation
10 Total GDP (USD Bn) UNDP HDR 2008
11 Share of Services in GDP CIA Fact Book
12 GDP per capita (USD) UNDP HDR 2008
13 GDP growth rate UNDP HDR 2008
14 Infl ation Rate CIA Fact Book
Share of exports, share of services in exports
15 Exports (USD Bn) CIA Fact Book
16 Share of export in GDP (% of GDP) UNDP HDR 2008
17 Total export of services (% of Export) CIA Fact Book
Foreign exchange/gold reserves
18 Foreign exchange/gold reserves (USD Bn) CIA Fact Book
2. Methodology
02_Africa_Report09_FR.indd Sec1:3602_Africa_Report09_FR.indd Sec1:36 2/26/09 12:14:15 PM2/26/09 12:14:15 PM
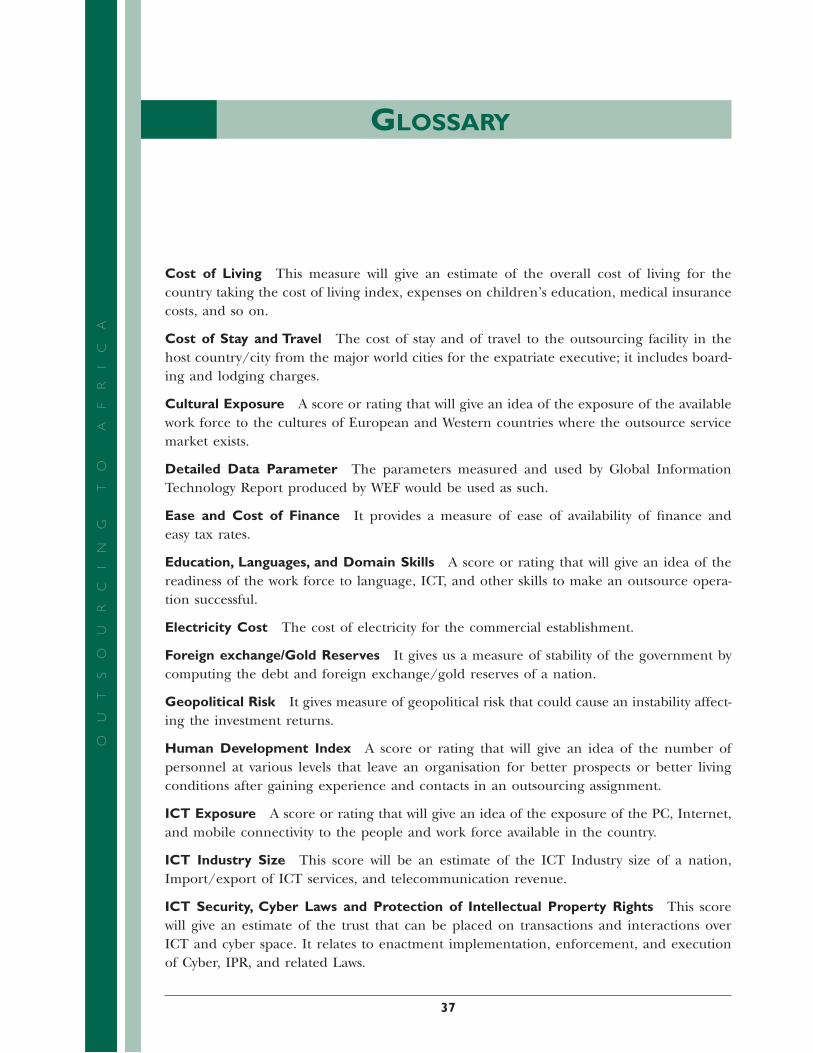
37
OU
TS
OU
RC
IN
G
TO
A
FR
IC
A
GLOSSARY
Cost of Living This measure will give an estimate of the overall cost of living for the country taking the cost of living index, expenses on children’s education, medical insurance costs, and so on.
Cost of Stay and Travel The cost of stay and of travel to the outsourcing facility in the host country/city from the major world cities for the expatriate executive; it includes board-ing and lodging charges.
Cultural Exposure A score or rating that will give an idea of the exposure of the available work force to the cultures of European and Western countries where the outsource service market exists.
Detailed Data Parameter The parameters measured and used by Global Information Technology Report produced by WEF would be used as such.
Ease and Cost of Finance It provides a measure of ease of availability of fi nance and easy tax rates.
Education, Languages, and Domain Skills A score or rating that will give an idea of the readiness of the work force to language, ICT, and other skills to make an outsource opera-tion successful.
Electricity Cost The cost of electricity for the commercial establishment.
Foreign exchange/Gold Reserves It gives us a measure of stability of the government by computing the debt and foreign exchange/gold reserves of a nation.
Geopolitical Risk It gives measure of geopolitical risk that could cause an instability affect-ing the investment returns.
Human Development Index A score or rating that will give an idea of the number of personnel at various levels that leave an organisation for better prospects or better living conditions after gaining experience and contacts in an outsourcing assignment.
ICT Exposure A score or rating that will give an idea of the exposure of the PC, Internet, and mobile connectivity to the people and work force available in the country.
ICT Industry Size This score will be an estimate of the ICT Industry size of a nation, Import/export of ICT services, and telecommunication revenue.
ICT Security, Cyber Laws and Protection of Intellectual Property Rights This score will give an estimate of the trust that can be placed on transactions and interactions over ICT and cyber space. It relates to enactment implementation, enforcement, and execution of Cyber, IPR, and related Laws.
02_Africa_Report09_FR.indd Sec1:3702_Africa_Report09_FR.indd Sec1:37 2/26/09 12:14:15 PM2/26/09 12:14:15 PM

38
OU
TS
OU
RC
IN
G
TO
A
FR
IC
AInternational Internet Bandwidth A standard measure of availability International Inter-net Bandwidth (in mbps) throughout the country prepared annually by the World Develop-ment Indicators by World Bank.
Legislative Risk It provides a measure of how frequently law changes to the extent that business and investors are affected by it.
Network Readiness Index A standard measure of availability and penetration of ICT Infrastructure throughout the country prepared annually by the World Economic Forum (WEF) Report (The Global Information Technology Report 2006–07).
Personnel Compensation at Various Levels Direct cost to the outsourcing business for the personnel recruited for this purpose.
Quality Attitude of people towards work, health conditions affecting effi cient operations and related issues.
Quantity A score or rating that will give an idea of the number of personnel at various levels who will be available for an organisation wishing to start outsource operations in the country .
Rental, Cost of Commercial Premises A month’s cost to take a commercial space (in sq. feet) on rent for business activity.
Share of Exports in GDP, Share of Services in Exports It is measure of share of exports in total GDP and percentage share of services in the total export by a nation.
Share of Services in GDP, Economy Size and Growth, Infl ation It denotes the percent-age share of services in total GDP, the total size of economy, GDP of the country.
Telecom/Internet Service Cost The cost of data transfer and call rate from the African nation to the Europe, Americas, and Australia.
Glossary
02_Africa_Report09_FR.indd Sec1:3802_Africa_Report09_FR.indd Sec1:38 2/26/09 12:14:15 PM2/26/09 12:14:15 PM

OU
TS
OU
RC
IN
G
TO
A
FR
IC
A
APPENDICES
Appendix I: Infrastructure Data Table
Appendix II: People and Skills Data Table
Appendix III: Business Environment Data Table
Appendix IV: Fifteen Africa Country Profi les
02_Africa_Report09_FR.indd Sec1:3902_Africa_Report09_FR.indd Sec1:39 2/26/09 12:14:15 PM2/26/09 12:14:15 PM

Availability/Peneration
Net
wo
rk R
eadi
ness
1N
etw
ork
Rea
din
ess
Inde
x (S
core
fr
om 1
to 7
)W
EF
Glo
bal I
T3.
594.
053.
743.
493.
343.
963.
672.
823.
333.
323.
463.
174.
333.
063.
02
Inte
rnat
iona
l Int
erne
t B
andw
idth
2In
tern
atio
nal
In
tern
et B
andw
idth
(B
its/
Pers
on)
WD
I16
1912
69
2115
337
71
181
103
0.01
126
411
Ele
ctri
city
Ava
ilabi
lity
3E
lect
rici
ty C
onsu
mpt
ion
(B
n
KW
H)
CIA
Fac
t Sh
eet
2.6
241
926.
94.
42
20.6
79.
12.
816
.88
1.8
1.19
11.1
71.
6786
4E
lect
rici
ty P
rodu
ctio
n (
Bn
KW
H)
CIA
Fac
t Sh
eet
0.91
264
117
75.
52.
3521
.37
13.1
71.
6822
.52.
151.
8812
.85
1.98
8.85
5E
lect
rici
ty I
mpo
rt (
Bn
KW
H)
CIA
Fac
t Sh
eet
1.75
11.3
20.
168
0.46
10.
280.
010.
802
9.5
1.56
0.01
0.01
0.13
60.
010.
010.
465
6Q
ualit
y of
ele
ctri
city
sup
ply
WE
F3.
85.
95.
14.
14.
75.
44.
83.
55.
14.
24.
83.
55.
83.
33.
7
Ro
ad/R
ail N
etw
ork
, Air
Tra
vel
7Q
ualit
y of
rai
lroa
d in
fras
truc
ture
(S
core
from
1 to
7)
Glo
bal
Com
peti
tive
nes
s R
epor
t 200
8, W
EF
3.6
3.5
31.
32.
31.
63.
21.
84.
31.
41.
71.
84.
41.
51.
7
8Q
ualit
y of
roa
ds (
Scor
e fr
om
1 to
7)
Glo
bal
Com
peti
tive
nes
s R
epor
t 200
8, W
EF
4.5
4.8
3.4
3.4
2.8
4.5
3.6
25.
42.
33.
22.
54.
92.
52.
5
9Q
ualit
y of
air
tran
spor
t in
fras
truc
ture
(Sc
ore
from
1 to
7)
Glo
bal
Com
peti
tive
nes
s R
epor
t 200
8, W
EF
4.5
3.4
5.2
3.2
3.7
5.4
5.2
3.7
51.
62.
52.
35.
81.
92.
9
S. No.
Detailed Data Parameter and Units
Source
Botswana
South Africa
Ghana
Egypt
Mauritius
Kenya
Morocco
Mozambique
Namibia
Nigeria
Senegal
Tanzania
Tunisia
Uganda
Zambia
AP
PEN
DIX
I
I NF
RA
ST
RU
CT
UR
E D
AT
A T
AB
LE
02_Africa_Report09_FR.indd Sec1:4002_Africa_Report09_FR.indd Sec1:40 2/26/09 12:14:15 PM2/26/09 12:14:15 PM
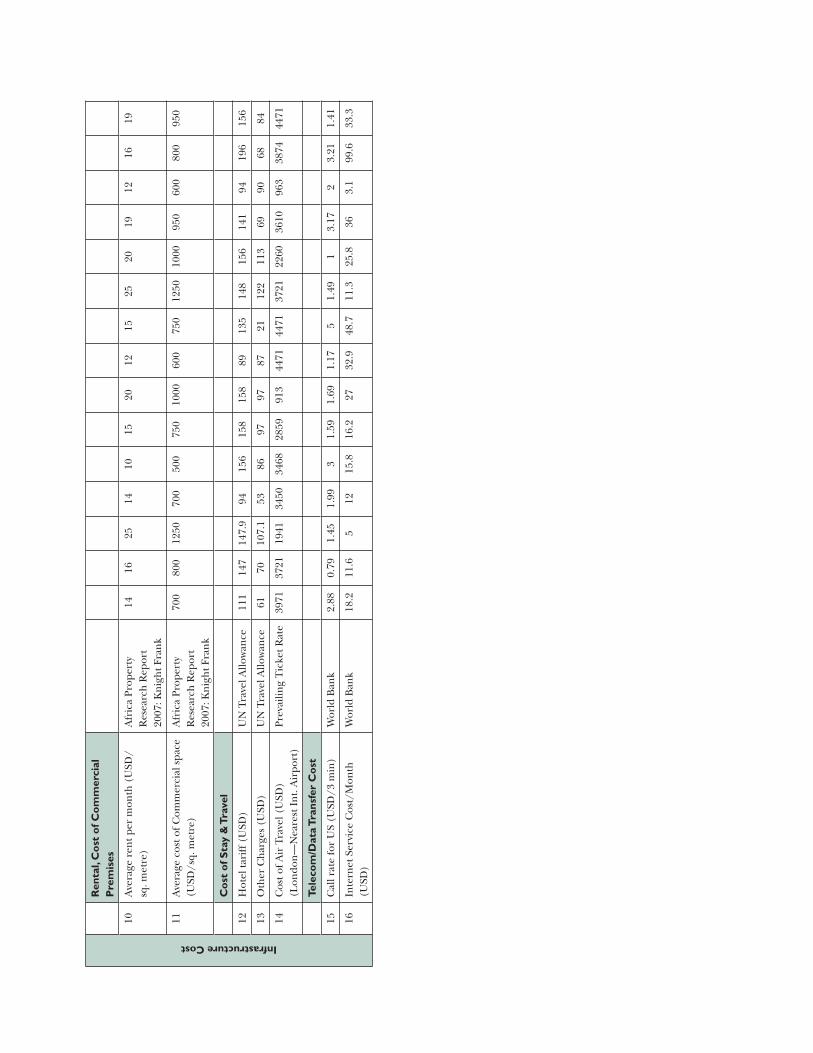
Infrastructure CostR
enta
l, C
ost
of C
om
mer
cial
P
rem
ises
10A
vera
ge r
ent p
er m
onth
(U
SD/
sq. m
etre
)A
fric
a Pr
oper
ty
Res
earc
h R
epor
t 20
07: K
nig
ht F
ran
k
1416
2514
1015
2012
1525
2019
1216
19
11A
vera
ge c
ost o
f Com
mer
cial
spa
ce
(USD
/sq.
met
re)
Afr
ica
Prop
erty
R
esea
rch
Rep
ort
2007
: Kn
igh
t Fra
nk
700
800
1250
700
500
750
1000
600
750
1250
1000
950
600
800
950
Co
st o
f Sta
y &
Tra
vel
12H
otel
tari
ff (
USD
)U
N T
rave
l Allo
wan
ce11
114
714
7.9
9415
615
815
889
135
148
156
141
9419
615
6
13O
ther
Ch
arge
s (U
SD)
UN
Tra
vel A
llow
ance
6170
107.
153
8697
9787
2112
211
369
9068
84
14C
ost o
f Air
Tra
vel (
USD
) (L
ondo
n—
Nea
rest
In
t. A
irpo
rt)
Prev
ailin
g T
icke
t Rat
e39
7137
2119
4134
5034
6828
5991
344
7144
7137
2122
6036
1096
338
7444
71
Tele
com
/Dat
a T
rans
fer
Co
st
15C
all r
ate
for
US
(USD
/3 m
in)
Wor
ld B
ank
2.88
0.79
1.45
1.99
31.
591.
691.
175
1.49
13.
172
3.21
1.41
16In
tern
et S
ervi
ce C
ost/
Mon
th
(USD
)W
orld
Ban
k 18
.211
.65
1215
.816
.227
32.9
48.7
11.3
25.8
363.
199
.633
.3
02_Africa_Report09_FR.indd Sec1:4102_Africa_Report09_FR.indd Sec1:41 2/26/09 12:14:16 PM2/26/09 12:14:16 PM
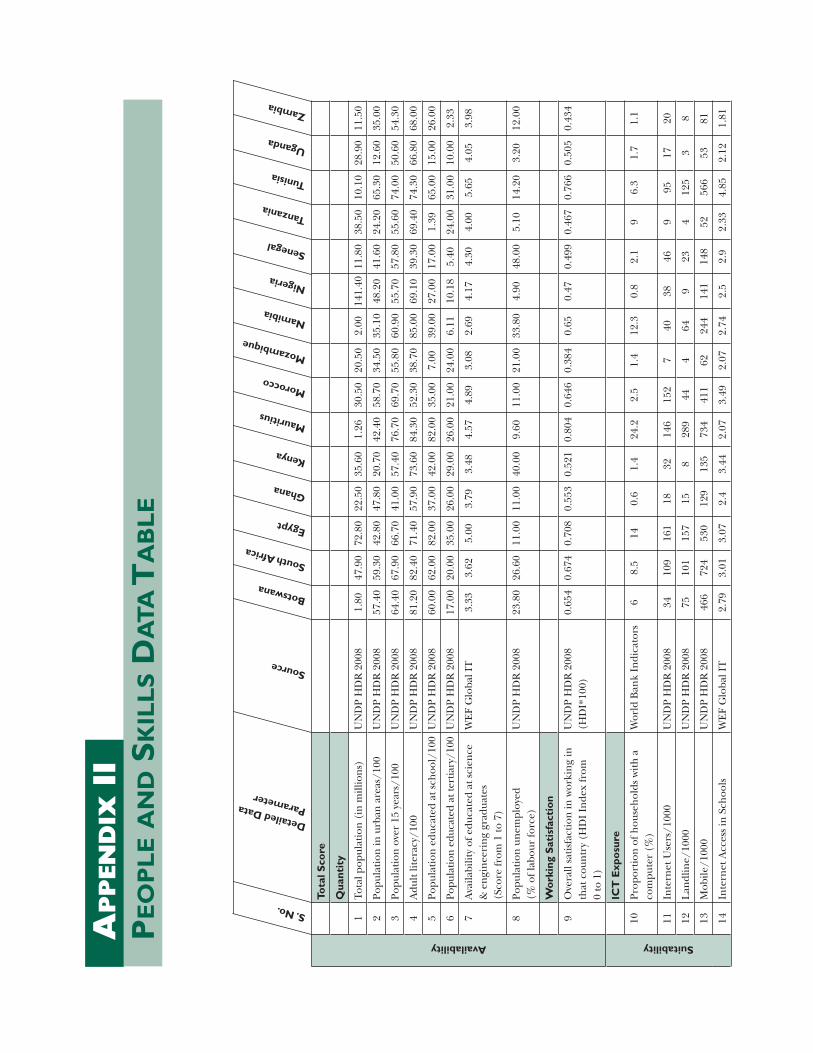
Availability
Tota
l Sco
re
Qua
ntit
y
1To
tal p
opul
atio
n (
in m
illio
ns)
UN
DP
HD
R 2
008
1.80
47.9
072
.80
22.5
035
.60
1.26
30.5
020
.50
2.00
141.
4011
.80
38.5
010
.10
28.9
011
.50
2Po
pula
tion
in u
rban
are
as/1
00U
ND
P H
DR
200
857
.40
59.3
042
.80
47.8
020
.70
42.4
058
.70
34.5
035
.10
48.2
041
.60
24.2
065
.30
12.6
035
.00
3Po
pula
tion
ove
r 15
yea
rs/1
00U
ND
P H
DR
200
864
.40
67.9
066
.70
41.0
057
.40
76.7
069
.70
55.8
060
.90
55.7
057
.80
55.6
074
.00
50.6
054
.30
4A
dult
lite
racy
/100
UN
DP
HD
R 2
008
81.2
082
.40
71.4
057
.90
73.6
084
.30
52.3
038
.70
85.0
069
.10
39.3
069
.40
74.3
066
.80
68.0
0
5Po
pula
tion
edu
cate
d at
sch
ool/
100
UN
DP
HD
R 2
008
60.0
062
.00
82.0
037
.00
42.0
082
.00
35.0
07.
0039
.00
27.0
017
.00
1.39
65.0
015
.00
26.0
0
6Po
pula
tion
edu
cate
d at
tert
iary
/100
UN
DP
HD
R 2
008
17.0
020
.00
35.0
026
.00
29.0
026
.00
21.0
024
.00
6.11
10.1
85.
4024
.00
31.0
010
.00
2.33
7A
vaila
bilit
y of
edu
cate
d at
sci
ence
&
en
gin
eeri
ng
grad
uate
s (S
core
from
1 to
7)
WE
F G
loba
l IT
3.33
3.62
5.00
3.79
3.48
4.57
4.89
3.08
2.69
4.17
4.30
4.00
5.65
4.05
3.98
8Po
pula
tion
un
empl
oyed
(%
of l
abou
r fo
rce)
UN
DP
HD
R 2
008
23.8
026
.60
11.0
011
.00
40.0
09.
6011
.00
21.0
033
.80
4.90
48.0
05.
1014
.20
3.20
12.0
0
Wo
rkin
g S
atis
fact
ion
9O
vera
ll sa
tisf
acti
on in
wor
kin
g in
th
at c
oun
try
(HD
I In
dex
from
0
to 1
)
UN
DP
HD
R 2
008
(HD
I*10
0)0.
654
0.67
40.
708
0.55
30.
521
0.80
40.
646
0.38
40.
650.
470.
499
0.46
70.
766
0.50
50.
434
Suitability
ICT
Exp
osu
re
10Pr
opor
tion
of h
ouse
hol
ds w
ith
a
com
pute
r (%
)W
orld
Ban
k In
dica
tors
68.
514
0.6
1.4
24.2
2.5
1.4
12.3
0.8
2.1
96.
31.
71.
1
11In
tern
et U
sers
/100
0U
ND
P H
DR
200
834
109
161
1832
146
152
740
3846
995
1720
12L
andl
ine/
1000
UN
DP
HD
R 2
008
7510
115
715
828
944
464
923
412
53
8
13M
obile
/100
0U
ND
P H
DR
200
846
672
453
012
913
573
441
162
244
141
148
5256
653
81
14In
tern
et A
cces
s in
Sch
ools
WE
F G
loba
l IT
2.79
3.01
3.07
2.4
3.44
2.07
3.49
2.07
2.74
2.5
2.9
2.33
4.85
2.12
1.81
S. No.
Detailed Data Parameter
Source
Botswana
South Africa
Ghana
Egypt
Mauritius
Kenya
Morocco
Mozambique
Namibia
Nigeria
Senegal
Tanzania
Tunisia
Uganda
Zambia
AP
PEN
DIX
II
PE
OP
LE A
ND
SK
ILL
S D
AT
A T
AB
LE
02_Africa_Report09_FR.indd Sec1:4202_Africa_Report09_FR.indd Sec1:42 2/26/09 12:14:16 PM2/26/09 12:14:16 PM
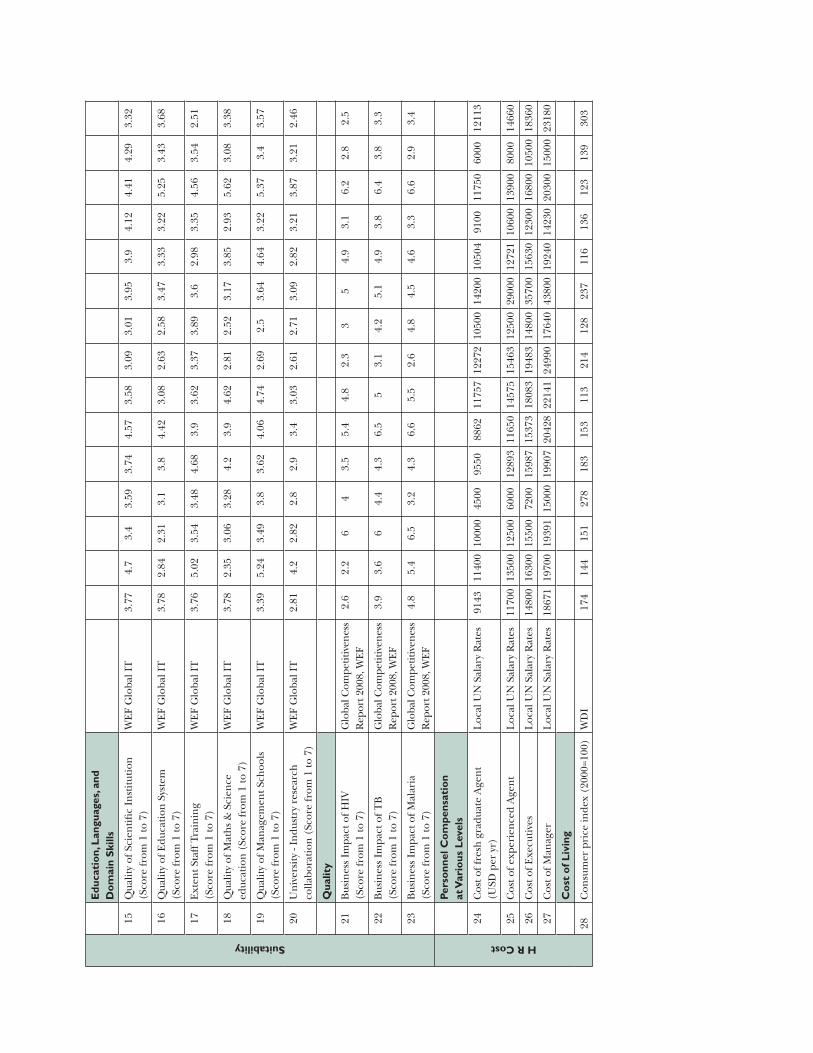
SuitabilityE
duca
tio
n, L
angu
ages
, and
D
om
ain
Ski
lls
15Q
ualit
y of
Sci
enti
fi c
Inst
itut
ion
(S
core
from
1 to
7)
WE
F G
loba
l IT
3.77
4.7
3.4
3.59
3.74
4.57
3.58
3.09
3.01
3.95
3.9
4.12
4.41
4.29
3.32
16Q
ualit
y of
Edu
cati
on S
yste
m
(Sco
re fr
om 1
to 7
)W
EF
Glo
bal I
T3.
782.
842.
313.
13.
84.
423.
082.
632.
583.
473.
333.
225.
253.
433.
68
17E
xten
t Sta
ff T
rain
ing
(Sco
re fr
om 1
to 7
)W
EF
Glo
bal I
T3.
765.
023.
543.
484.
683.
93.
623.
373.
893.
62.
983.
354.
563.
542.
51
18Q
ualit
y of
Mat
hs
& S
cien
ce
educ
atio
n (
Scor
e fr
om 1
to 7
)W
EF
Glo
bal I
T3.
782.
353.
063.
284.
23.
94.
622.
812.
523.
173.
852.
935.
623.
083.
38
19Q
ualit
y of
Man
agem
ent S
choo
ls
(Sco
re fr
om 1
to 7
)W
EF
Glo
bal I
T3.
395.
243.
493.
83.
624.
064.
742.
692.
53.
644.
643.
225.
373.
43.
57
20U
niv
ersi
ty -
Indu
stry
res
earc
h
colla
bora
tion
(Sc
ore
from
1 to
7)
WE
F G
loba
l IT
2.81
4.2
2.82
2.8
2.9
3.4
3.03
2.61
2.71
3.09
2.82
3.21
3.87
3.21
2.46
Qua
lity
21B
usin
ess
Impa
ct o
f HIV
(S
core
from
1 to
7)
Glo
bal C
ompe
titiv
enes
s R
epor
t 200
8, W
EF
2.6
2.2
64
3.5
5.4
4.8
2.3
35
4.9
3.1
6.2
2.8
2.5
22B
usin
ess
Impa
ct o
f TB
(S
core
from
1 to
7)
Glo
bal C
ompe
titiv
enes
s R
epor
t 200
8, W
EF
3.9
3.6
64.
44.
36.
55
3.1
4.2
5.1
4.9
3.8
6.4
3.8
3.3
23B
usin
ess
Impa
ct o
f Mal
aria
(S
core
from
1 to
7)
Glo
bal C
ompe
titiv
enes
s R
epor
t 200
8, W
EF
4.8
5.4
6.5
3.2
4.3
6.6
5.5
2.6
4.8
4.5
4.6
3.3
6.6
2.9
3.4
H R Cost
Pers
onn
el C
om
pens
atio
n at
Var
ious
Lev
els
24C
ost o
f fre
sh g
radu
ate
Age
nt
(USD
per
yr)
Loc
al U
N S
alar
y R
ates
9143
1140
010
000
4500
9550
8862
1175
712
272
1050
014
200
1050
491
0011
750
6000
1211
3
25C
ost o
f exp
erie
nce
d A
gen
tL
ocal
UN
Sal
ary
Rat
es11
700
1350
012
500
6000
1289
311
650
1457
515
463
1250
029
000
1272
110
600
1390
080
0014
660
26C
ost o
f Exe
cuti
ves
Loc
al U
N S
alar
y R
ates
1480
016
300
1550
072
0015
987
1537
318
083
1948
314
800
3570
015
630
1230
016
800
1050
018
360
27C
ost o
f Man
ager
Loc
al U
N S
alar
y R
ates
1867
119
700
1939
115
000
1990
720
428
2214
124
990
1764
043
800
1924
014
230
2030
015
000
2318
0
Co
st o
f Liv
ing
28C
onsu
mer
pri
ce in
dex
(200
0=10
0)W
DI
174
144
151
278
183
153
113
214
128
237
116
136
123
139
303
02_Africa_Report09_FR.indd Sec1:4302_Africa_Report09_FR.indd Sec1:43 2/26/09 12:14:16 PM2/26/09 12:14:16 PM

AP
PEN
DIX
III
B
US
INE
SS E
NV
IRO
NM
EN
T D
AT
A T
AB
LE
BE Index
Eas
e o
f Do
ing
Bus
ines
s
1N
o. o
f pro
cedu
res
to s
tart
a
busi
nes
sG
loba
l Com
petit
iven
ess
Rep
ort W
EF
2008
118
711
126
610
109
1012
1019
6
2Pr
otec
tin
g In
vest
ors
(Sco
re fr
om 1
to 1
0)D
oin
g B
usin
ess
68
5.3
65
7.7
36
5.3
5.7
35
3.7
45.
3
3C
orru
ptio
n P
erce
ptio
n I
nde
x (0
leas
t des
irab
le -1
0 m
ost d
esir
able
)A
fric
a D
evel
opm
ent
Indi
cato
rs, W
orld
Ban
k5.
64.
63.
33.
32.
25.
13.
22.
84.
12.
23.
32.
94.
62.
72.
6
ICT Industry Attractiveness
ICT
Sec
urit
y, C
yber
Law
s an
d P
rote
ctio
n o
f Int
elle
ctua
l P
rope
rty
Rig
hts
4L
aws
Rel
ated
to I
CT
(S
core
from
1 to
7)
WE
F G
loba
l IT
2.99
4.75
3.29
3.39
4.23
3.34
3.19
2.56
3.09
3.4
3.17
3.12
4.6
2.97
2.86
5In
telle
ctua
l Pro
pert
y Pr
otec
tion
(S
core
from
1 to
7)
WE
F G
loba
l IT
3.11
5.2
3.51
3.49
4.13
3.01
3.85
2.6
4.1
2.94
3.19
3.21
4.63
2.69
2.72
6A
cces
sibi
lity
of d
igit
al c
onte
nt
(Sco
re fr
om 1
to 7
)W
EF
Glo
bal I
T3.
514.
784.
634
4.64
3.52
4.6
3.67
3.36
3.71
4.88
3.7
4.87
3.63
3.6
Exp
ort
s an
d S
hare
of I
CT
7C
ompu
ter,
Com
mun
icat
ion
, an
d ot
her
ser
vice
s (%
of c
omm
erci
al
serv
ice
impo
rts)
WD
I25
2429
2020
2929
3631
6426
1721
3039
8C
ompu
ter,
Com
mun
icat
ion
, an
d ot
her
ser
vice
s (%
of c
omm
erci
al
serv
ice
expo
rts)
WD
I17
2316
1715
1619
304
8247
1113
2316
9Te
leco
mm
unic
atio
n R
even
ue
( %
of G
DP)
WD
I3
84
24
45
15
39
24
33
S. No.
Detailed Data Parameter
Source
Botswana
South Africa
Ghana
Egypt
Mauritius
Kenya
Morocco
Mozambique
Namibia
Nigeria
Senegal
Tanzania
Tunisia
Uganda
Zambia
02_Africa_Report09_FR.indd Sec1:4402_Africa_Report09_FR.indd Sec1:44 2/26/09 12:14:16 PM2/26/09 12:14:16 PM

Economic Outlook
Shar
e of
Ser
vice
s in
GD
P, E
cono
my
Size
and
Gro
wth
, Infl
ati
on
10To
tal G
DP
(USD
Bn
)U
ND
P H
DR
200
826
239.
589
.410
.718
.714
.27
51.6
6.6
6.6
206
8.2
12.1
28.7
8.7
7.3
11Sh
are
of S
ervi
ces
in G
DP
CIA
Fac
t Boo
k46
7048
3760
7056
46.9
5829
.861
3762
.813
56.5
12G
DP
per
capi
ta (
USD
)U
ND
P H
DR
200
858
4651
0917
3948
554
759
5717
1133
530
1621
0070
731
628
6030
362
3
13G
DP
grow
th r
ate
UN
DP
HD
R 2
008
4.8
4.9
72
0.1
5.4
1.5
4.3
2.9
0.8
1.2
1.7
6.3
3.2
0.3
14In
fl at
ion
Rat
eC
IA F
act B
ook
7.1
3.9
9.5
129.
78.
82
12.5
6.7
5.4
5.9
73.
16.
110
.6
Sha
re o
f Exp
ort
s, S
hare
of
Ser
vice
s in
Exp
ort
s
15E
xpor
ts (
USD
Bn
)C
IA F
act B
ook
5.5
79.1
940
.38
4.2
4.1
4.4
12.7
50.
238
2.92
61.7
91.
652.
2215
.15
1.68
4.59
16Sh
are
of e
xpor
t in
GD
P (%
of G
DP)
UN
DP
HD
R 2
008
5127
3013
.527
5736
4146
5327
1748
1316
17To
tal e
xpor
t of s
ervi
ces
(% o
f Exp
ort)
CIA
Fac
t Boo
k14
.815
.857
2638
.842
.241
12.2
15.6
8.8
27.8
43.8
4.4
31.2
7.2
Fore
ign
exch
ange
/Go
ld R
eser
ves
18Fo
reig
n e
xch
ange
/gol
d re
serv
es
(USD
Bn
)C
IA F
act B
ook
9.79
32.9
831
.37
2.2
3.35
3.1
24.7
21.
40.
8951
.33
1.66
2.91
7.85
2.56
1.09
Risk Parameter
Geo
- Po
litic
al R
isk
19Tr
ansp
aren
cy o
f Gov
ern
men
t po
licy
mak
ers
(Sco
re fr
om 1
to 7
)G
loba
l Com
petit
iven
ess
Rep
ort W
EF
2008
4.6
4.9
4.1
3.9
4.1
4.9
4.4
3.8
4.3
4.2
3.2
45.
23.
94.
7
20R
elia
bilit
y of
pol
ice
serv
ices
(S
core
from
1 to
7)
Glo
bal C
ompe
titiv
enes
s R
epor
t WE
F 20
084.
73.
14.
73.
83.
84.
34.
82.
84
2.8
5.1
4.3
5.8
3.7
4.1
Cur
renc
y R
isk
21C
urre
ncy
fl uc
tuat
ion
rat
eC
yber
Med
ia R
esea
rch
15.2
216
.18
1.52
10.8
45.
223.
783.
255.
8415
.81
5.28
4.01
5.65
2.23
6.60
10.4
6
Leg
isla
tive
Ris
k
22Ju
dici
al in
depe
nde
nce
(S
core
from
1 to
7)
Glo
bal C
ompe
titiv
enes
s R
epor
t WE
F 20
085.
35.
25
3.8
35
3.9
3.1
5.5
4.3
2.6
3.9
53.
33.
5
23E
ffi c
ien
cy o
f leg
al fr
amew
ork
(Sco
re fr
om 1
to 7
)G
loba
l Com
petit
iven
ess
Rep
ort W
EF
2008
4.8
5.43
4.17
4.3
3.08
4.67
4.03
2.8
4.44
3.29
2.78
3.66
5.15
3.27
3.75
24B
urde
n o
f gov
t. re
gula
tion
(S
core
from
1 to
7)
Glo
bal C
ompe
titiv
enes
s R
epor
t WE
F 20
083.
082.
683.
173.
22.
993.
083.
462.
872.
983.
332.
643.
594.
443.
553.
98
Tax & Financial Incentive
Tax
Rat
e
25To
tal T
ax R
ate
(% o
f Pro
fi t)
WD
I W
orld
Ban
k17
.227
.147
.932
.950
.921
.753
.134
.326
.529
.946
44.3
6132
.316
.1
Eas
e &
Co
st o
f Fin
ance
26Fi
nan
cial
mar
ket S
oph
isti
cati
on
(Sco
re fr
om 1
to 7
)G
loba
l Com
petit
iven
ess
Rep
ort W
EF
2008
4.01
63.
443.
744.
134.
433.
742.
464.
323.
673.
042.
954.
482.
73.
01
27R
estr
icti
on o
n c
apit
al fl
ow
(Sco
re fr
om 1
to 7
)G
loba
l Com
petit
iven
ess
Rep
ort W
EF
2008
5.7
3.7
4.4
4.2
4.4
6.2
3.6
2.8
3.9
4.1
4.1
4.3
4.4
5.1
5.6
28E
xten
t an
d ef
fect
of t
axat
ion
(S
core
from
1 to
7)
Glo
bal C
ompe
titiv
enes
s R
epor
t WE
F 20
084.
94.
54.
13.
72.
85.
43.
53.
13.
74
3.2
3.4
4.7
2.8
2.8
29St
ren
gth
of i
nve
stor
pro
tect
ion
(H
ard
Dat
a 0-
10(b
est)
sca
le)
Glo
bal C
ompe
titiv
enes
s R
epor
t WE
F 20
084.
38
56
57.
73
65.
35.
73
53.
34
5.3
Exc
han
ge r
ate
(1 U
SD)
CIA
Fac
t Boo
k7.
949.
785.
581.
1768
328.
3524
.25
9.78
117.
751
613
001.
2720
0047
05
02_Africa_Report09_FR.indd Sec1:4502_Africa_Report09_FR.indd Sec1:45 2/26/09 12:14:17 PM2/26/09 12:14:17 PM

02_Africa_Report09_FR.indd Sec1:4602_Africa_Report09_FR.indd Sec1:46 2/26/09 12:14:17 PM2/26/09 12:14:17 PM

47
Here’s the fl ow for each one of the fi fteen countries:
1. Country Overview
2. Country Outsourcing Attractiveness Profi le
3. Country Political and Economic Profi le
4. Principal Government Offi cials
5. Foreign Relations
6. Living, Security, and Safety Perceptions
7. ICT Policy, ICT Infrastructure, and Service
8. ICT and BPO Industry Environment
9. Human Resource Effi ciency and Cost
10. Legal and Enforcement Issues
11. Labour and Expatriate Worker’s Permits
12. Revenue, Tax, and Repatriation Issues
13. Investment Policy and Incentives
14. Government Agencies Giving Support to Outsourcing
15. Recommendations
16. Contact Details
OU
TS
OU
RC
IN
G
TO
A
FR
IC
A
APPENDIX IV FIFTEEN AFRICA COUNTRY PROFILES
02_Africa_Report09_FR.indd Sec1:4702_Africa_Report09_FR.indd Sec1:47 2/26/09 12:14:17 PM2/26/09 12:14:17 PM

02_Africa_Report09_FR.indd Sec1:4802_Africa_Report09_FR.indd Sec1:48 2/26/09 12:14:17 PM2/26/09 12:14:17 PM

49
OU
TS
OU
RC
IN
G
TO
A
FR
IC
A
Country Report for Egypt
Disclaimer
This short country report, a result of a larger survey of ICT outsourcing in Africa, provides a general over-view of the current activities and issues related to ICT outsourcing in the country. The data presented here should be regarded as illustrative rather than exhaustive. ICT outsourcing is at a particularly dynamic stage in Africa with new developments and announcements happening on a daily basis somewhere or the other on the continent. Therefore, these reports should be seen as ‘snapshots’ that were current at the time they were taken; it is expected that certain facts and fi gures presented may become outdated very quickly.
The fi ndings, interpretations, and conclusions expressed herein are a faithful representation of the respondents of the interviews and secondary data collected from the countries and published literature. Strict analysis has been carried out with the minimal infl uence of the authors/team members. References to data sources have been made as far as possible. In the case of the detailed data parameters used for scores and ranking the same data source and timeline has been used for all the fi fteen countries compared. In the descriptive section of the country reports, all data received from the individual country have been used in order to give as complete an assessment as possible. Thus those countries that have provided more information have a better coverage than those who have not been able to provide data to the research team.
Board of Executive Directors of CBC or Cyber Media cannot guarantee the accuracy of the data included in this work. The boundaries, colours, denominations, and other information shown on any map in this work do not imply on the part of the CBC and Cyber Media any judgement of the legal status of any territory or the endorsement or acceptance of such boundaries.
It is expected that individual country reports from the survey of ICT outsourcing in Africa will be updated in an iterative process over time on the basis of additional research and feedback received through CBC and Cyber Media website.
LIBYA
Mediterranean SeaWest Bank
Gaza StripDead Sea
Banï Suwayf
Al Minyã
Asyut
Al Kharijah
LakeNasser
CAIRO
AlGhardaqah
BurSafãjah
Sharmash
Shaykh
RedSea
SAUDIARABIA
SuezCanal
SuezSinai
Nile
Luxor
Aswan
Hala'ibTriangle
MarsáMatruh
S wah
AlexandriaDamietta Port Said
ISRAELJORDAN
S U D A N
Tanta
Al J zah
0 100 200 km
0 100 200 mi
‚ ‚ ‚ ‚
¯
¯
1
1̄
¯
¯ ¯
¯´
03_Africa_Report09_Egypt.indd 4903_Africa_Report09_Egypt.indd 49 2/25/09 4:18:17 PM2/25/09 4:18:17 PM

50
Country Report for Egypt
OU
TS
OU
RC
IN
G
TO
A
FR
IC
A1. Overview
Egypt is located in Northern Africa, bordering the Mediterranean Sea, between Libya and the Gaza Strip, and the Red Sea north of Sudan, and includes the Asian Sinai Peninsula. Egypt is the most populous country in the Arab world and the second-most populous on the African Continent. Nearly all of the country’s 79 million people live in Cairo and Alexandria; elsewhere on the banks of the Nile; in the Nile delta, which fans out north of Cairo; and along the Suez Canal. These regions are among the world’s most densely populated, con-taining an average of over 3,820 persons per square mile (1,540 per sq km), as compared to 181 persons per sq mi for the country as a whole.
Egypt borders the Mediterranean Sea to the north, the Gaza Strip and Israel to the north-east, the Red Sea to the east, Sudan to the south, and Libya to the west.
The great majority of its estimated 82 million live near the banks of the Nile River, in an area of about 40,000 sq km (15,000 sq m), where the only arable agricultural land is found. The large areas of the Sahara Desert are sparsely inhabited. About half of Egypt’s residents live in urban areas, with the majority spread across the densely populated centres of greater Cairo, Alexandria, and other major cities in the Nile Delta.
Egypt is famous for its ancient civilisation and some of the world’s most famous monuments, including the Giza pyramid complex and its Great Sphinx. The southern city of Luxor con-tains numerous ancient artefacts, such as the Karnak Temple and the Valley of the Kings. Egypt is widely regarded as an important political and cultural nation of the Middle East.
Egypt, sometimes referred to as the ‘Motherland of the World’ and the ‘Land of Civilisa-tions,’ is famous throughout the world for its ancient civilisation and 7,000-year history along the Nile River. It is an important political and cultural centre of the Middle East.
2. Egypt’s Position in Africa’s Fifteen Countries
Egypt is the fi rst in the ready band of countries from the outsourcing attractiveness point of view. The map and table below show where Egypt is positioned among the fi fteen studied countries.
03_Africa_Report09_Egypt.indd 5003_Africa_Report09_Egypt.indd 50 2/25/09 4:18:17 PM2/25/09 4:18:17 PM

Country Report for Egypt
51
OU
TS
OU
RC
IN
G
TO
A
FR
IC
A
Morocco *
Morocco
Tunisia *
Geographical Coverage and Rank
Tunisia
Egypt *
Egypt
Senegal *
Senegal
GhanaGhana
Nigeria
Nigeria
Uganda
Uganda
Kenya
KenyaTanzania
Tanzania
Zambia
Zambia
Mozambique MozambiqueBotswana
Botswana
Namibia
Namibia
SouthAfrica
South Africa
MauritiusAfrica
*Non-Commonwealth Countries
Mauritius
Contributing scores and ranks are as under.
Overall
Band Score (PS & BE) Rank
Ready 7.18 First
Infrastructure
Score Rank Band
6.8 3 Ready
While achieving the third position in score for ‘Infrastructure’, Egypt is second in electric-ity availability and telecommunications and data-transfer costs, fourth in network readiness, seventh in infrastructure cost, third in availability and penetration, and sixth in the roads and rail network.
People and Skills (PS)
Score Rank
3.620 1
Egypt is the best in the case of ‘People and Skills,’ being fi rst in quantity, second in quality, and third in working satisfaction and ICT exposure; it has scored seven in human resource costs. At the other end it has fallen to thirteenth position in education, language, and domain skills.
03_Africa_Report09_Egypt.indd 5103_Africa_Report09_Egypt.indd 51 2/25/09 4:18:18 PM2/25/09 4:18:18 PM
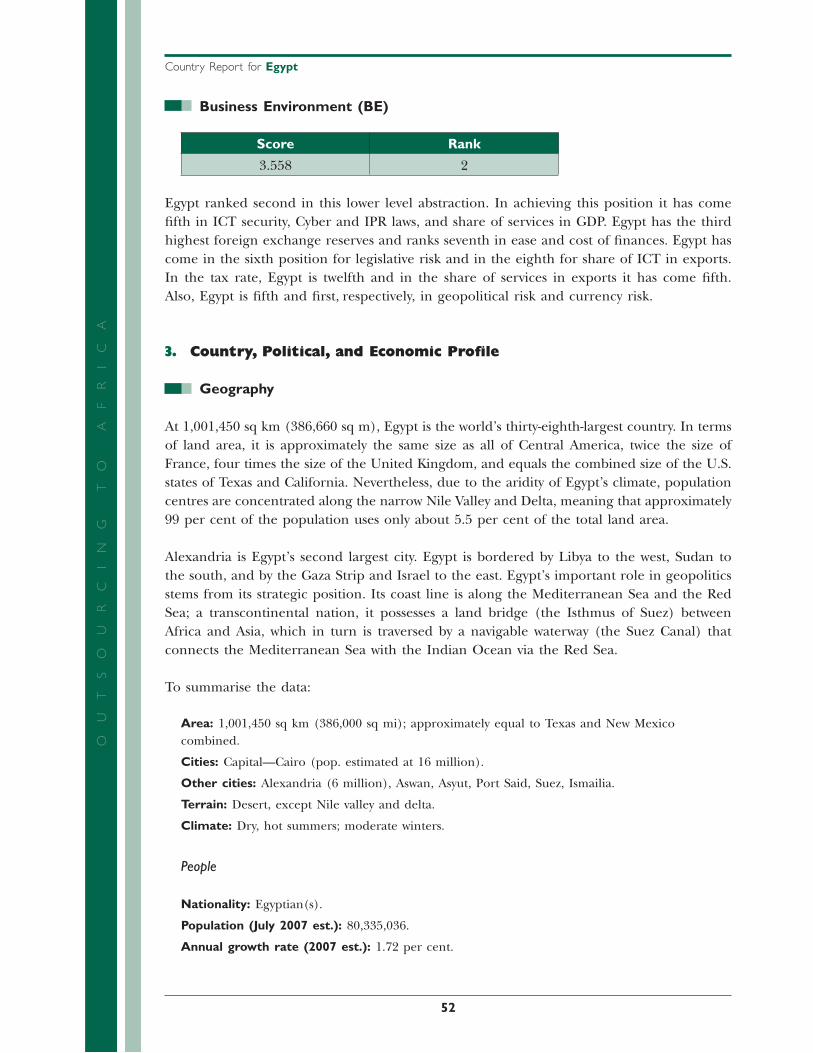
52
Country Report for Egypt
OU
TS
OU
RC
IN
G
TO
A
FR
IC
ABusiness Environment (BE)
Score Rank
3.558 2
Egypt ranked second in this lower level abstraction. In achieving this position it has come fi fth in ICT security, Cyber and IPR laws, and share of services in GDP. Egypt has the third highest foreign exchange reserves and ranks seventh in ease and cost of fi nances. Egypt has come in the sixth position for legislative risk and in the eighth for share of ICT in exports. In the tax rate, Egypt is twelfth and in the share of services in exports it has come fi fth. Also, Egypt is fi fth and fi rst, respectively, in geopolitical risk and currency risk.
3. Country, Political, and Economic Profi le
Geography
At 1,001,450 sq km (386,660 sq m), Egypt is the world’s thirty-eighth-largest country. In terms of land area, it is approximately the same size as all of Central America, twice the size of France, four times the size of the United Kingdom, and equals the combined size of the U.S. states of Texas and California. Nevertheless, due to the aridity of Egypt’s climate, population centres are concentrated along the narrow Nile Valley and Delta, meaning that approximately 99 per cent of the population uses only about 5.5 per cent of the total land area.
Alexandria is Egypt’s second largest city. Egypt is bordered by Libya to the west, Sudan to the south, and by the Gaza Strip and Israel to the east. Egypt’s important role in geopolitics stems from its strategic position. Its coast line is along the Mediterranean Sea and the Red Sea; a transcontinental nation, it possesses a land bridge (the Isthmus of Suez) between Africa and Asia, which in turn is traversed by a navigable waterway (the Suez Canal) that connects the Mediterranean Sea with the Indian Ocean via the Red Sea.
To summarise the data:
Area: 1,001,450 sq km (386,000 sq mi); approximately equal to Texas and New Mexico combined.
Cities: Capital—Cairo (pop. estimated at 16 million).
Other cities: Alexandria (6 million), Aswan, Asyut, Port Said, Suez, Ismailia.
Terrain: Desert, except Nile valley and delta.
Climate: Dry, hot summers; moderate winters.
People
Nationality: Egyptian(s).
Population (July 2007 est.): 80,335,036.
Annual growth rate (2007 est.): 1.72 per cent.
03_Africa_Report09_Egypt.indd 5203_Africa_Report09_Egypt.indd 52 2/25/09 4:18:18 PM2/25/09 4:18:18 PM

Country Report for Egypt
53
OU
TS
OU
RC
IN
G
TO
A
FR
IC
AEthnic groups: Egyptian, Bedouin Arab, Nubian.
Religions: Muslim 90 per cent, Coptic Christian 9 per cent, other Christian 1 per cent.
Languages: Arabic (offi cial), English, French.
Education: Years compulsory—ages six to fi fteen; Literacy—total adult 58 per cent.
Health Infant mortality rate (2006 est.): 31.33 deaths/1,000 live births.
Life expectancy (2006 estimate): Seventy-one years.
Government
Type: Republic.
Independence: 1922.
Constitution: 1971.
Branches: Executive—President, Prime Minister, Cabinet; Legislative—People’s Assembly (444 elected and ten presidentially appointed members) and Shura (consultative) Council (176 elected members, eighty-eight presidentially appointed).
Administrative subdivisions: Twenty-six governorates.
Principal political parties: National Democratic Party (ruling); Principal opposition parties—New Wafd Party, Liberal Party, National Progressive Unionist Grouping (Tagammau), and Nasserite Party.
Suffrage: Universal at eighteen.
Economy
GDP (2007 est.): $118-120 billion.
Annual growth rate (2007 est.): 7.2 per cent.
Per capita GDP (2007 est.): $5,400.
Natural resources: Petroleum and natural gas, iron ore, phosphates, manganese, limestone, gypsum, talc, asbestos, lead, zinc.
Agriculture: Products—cotton, rice, onions, beans, citrus fruits, wheat, corn, barley, sugar.
Industry
Types: Food processing, textiles, chemicals, petrochemicals, construction, light manufacturing, iron and steel products, aluminium, cement, military equipment.
Trade (FY 2005): Exports—$27.4 billion: petroleum, clothing and textiles, cotton, fruits and vegetables, manufactured goods.
Major markets: EU, United States, Middle East, Japan.
Imports: $40.48 billion—machinery and transport equipment, petroleum products, livestock, food and beverages, paper and wood products, chemicals. Major suppliers: EU, United States, China.
Political and National Conditions
Egypt has been a republic since 18 June 1953. President Mohamed Hosni Mubarak has been the president of the republic since 14 October 1981, following the assassination of former President
03_Africa_Report09_Egypt.indd 5303_Africa_Report09_Egypt.indd 53 2/25/09 4:18:18 PM2/25/09 4:18:18 PM

54
Country Report for Egypt
OU
TS
OU
RC
IN
G
TO
A
FR
IC
AMohammed Anwar El-Sadat. Mubarak is currently serving his fi fth term in offi ce. He is the leader of the ruling National Democratic Party. Prime Minister Dr. Ahmed Nazif was sworn in as prime minister on 9 July 2004, following the resignation of Dr. Atef Ebeid from his offi ce.
Although power is ostensibly organised under a multi-party semi-presidential system, whereby the executive power is theoretically divided between the president and the prime minister, in practice it rests almost solely with the president who traditionally has been elected in single-candidate elections for more than fi fty years. Egypt also holds regular multi-party par-liamentary elections. The last presidential election, in which Mubarak won a fi fth consecutive term, was held in September 2005.
In late February 2005, President Mubarak announced in a surprise television broadcast that he had ordered the reform of the country’s presidential election law, paving the way for multi-candidate polls in the upcoming presidential election. For the fi rst time since the 1952 movement, the Egyptian people had an apparent chance to elect a leader from a list of vari-ous candidates. The president said his initiative came out of “my full conviction of the need to consolidate efforts for more freedom and democracy”. However, the new law placed dra-conian restrictions on the fi ling for presidential candidacies, designed to prevent well-known candidates such as Ayman Nour from standing against Mubarak, and paved the road for his easy re-election victory. Concerns were once again expressed after the 2005 presidential elec-tions about government interference in the election process through fraud and vote rigging, in addition to police brutality and violence by pro-Mubarak supporters against opposition demonstrators. After the election, Egypt imprisoned Nour, and the US government stated the ‘conviction of Mr. Nour, the runner-up in Egypt’s 2005 presidential elections, calls into question Egypt’s commitment to democracy, freedom, and the rule of law.’
As a result, most Egyptians are sceptical about the process of democratisation and the role of the elections. Less than 25 per cent of the country’s 32 million registered voters (out of a population of more than 72 million) turned out for the 2005 elections. A proposed change to the constitution would limit the president to two seven-year terms in offi ce.
Thirty-four constitutional changes voted on by parliament on 19 March 2007 prohibit par-ties from using religion as a basis for political activity; allow the drafting of a new antiter-rorism law to replace the emergency legislation in place since 1981, giving police wide powers of arrest and surveillance; give the president power to dissolve parliament; and end judicial monitoring of election. As opposition members of parliament withdrew from voting on the proposed changes, it was expected that the referendum would be boycotted by a great number of Egyptians in protest of what has been considered a breach of democratic practices. Eventually it was reported that only 27 per cent of the registered voters went to the polling stations under heavy police presence and tight political control of the ruling National Democratic Party. It was offi cially announced on 27 March 2007 that 75.9 per cent of those who participated in the referendum approved of the constitutional amendments introduced by President Mubarak, and this was endorsed by opposition free parliament, thus allowing the introduction of laws that curb the activity of certain opposition elements, particularly Islamists.
Thus Egypt is a safe and secure destination.
03_Africa_Report09_Egypt.indd 5403_Africa_Report09_Egypt.indd 54 2/25/09 4:18:19 PM2/25/09 4:18:19 PM
Country Report for Egypt
55
OU
TS
OU
RC
IN
G
TO
A
FR
IC
A4. Principal Government Offi cials
President: Mohamed Hosni Mubarak.
Prime Minister: Dr. Ahmed Nazif (former Minister MCIT).
Minister of Foreign Affairs: Ahmed Aboul Gheit Minister MCIT1: Dr. Tarek Kamel.
First Deputy MCIT: Dr. Hoda Baraka.
5. Foreign Relations
Geography, population, history, military strength, and diplomatic expertise give Egypt exten-sive political infl uence in the Middle East and within the Non-Aligned Movement. The Arab League headquarters is in Cairo, and the Secretary General of the League is traditionally an Egyptian. Former Egyptian Foreign Minister Amr Moussa is the present secretary general of the Arab League. President Mubarak has often chaired the African Union (formerly the Organization of African Unity). Former Egyptian Deputy Prime Minister Boutros Boutros-Ghali served as secretary general of the United Nations from 1991 to 1996.
Egypt has maintained friendly diplomatic and trade Relations with USA, EU, UK, France, India and Japan. Egypt has maintained strong partnership agreements with India, UK, and USA in the areas of ICT, science and technology. Similarly there are strong industry-govern-ment partnerships with multinationals. Several Joint ICT Related Projects with International and United Nations Agencies
6. Living, Security, and Safety Perceptions
The crime rate in Egypt is low. While incidents of violence are rare, purse snatching, pick pocketing and petty theft does occur. Travellers are strongly cautioned not to leave valu-ables such as cash, jewellery, and electronic items unsecured in hotel rooms or unattended in public places. There have been instances of terrorism in the bordering areas, but there is no reason to be alarmed. There is a need to be cautious while travelling by road and public transport. Proper medical insurance is necessary. Living conditions are moderate.
7. ICT Policy, Infrastructure, and Service
There has been an ICT Policy in place since 1999 resulting in the setting up of the Ministry of Communication and Information Technology (MCIT). A positive strategy has been in place to implement the policy, and the strategy and master plans are reviewed and updated regularly; the current strategy is from 2007 to 2010. All departments and ministries work harmoniously in matters relating to ICT. The strategy is providing all that is needed for a positive growth of Egypt’s ICT Sector. The ICT infrastructure and services are of a very high-quality coverage and service levels have been fi xed at a reasonable cost.
1 Ministry of Communications and Information Technology
03_Africa_Report09_Egypt.indd 5503_Africa_Report09_Egypt.indd 55 2/25/09 4:18:19 PM2/25/09 4:18:19 PM

56
Country Report for Egypt
OU
TS
OU
RC
IN
G
TO
A
FR
IC
AAn important goal of Egypt’s ICT Policy & Strategy is to create state of art ICT Infrastructure that gives an enabling environment for Government and business to link globally in an effi -cient and cost effective way.
A vibrant and export-oriented ICT Industry promotes Public Private Partnerships, enables society to absorb the benefi ts from expanding sources of information, creates a learning community that exploits its own potential fully, support the developments of skills needed by the ICT Industry, and gives support for research and innovation in the fi eld of ICT.
In Egypt the ICT Sector has grown at 25% as compared to 7% overall growth in all sectors of the Egyptian economy as a whole. Self-sustaining human resource base of 250,000 plus, ratifi cation of necessary Telecommunication, e-signature, and related Cyber Laws make ICT and cyberspace safer; high Foreign Direct Investent(FDI) in the ICT sector, subscription-free internet access at the cost of local calls for all Egyptians, and low-cost PCs for all hosting global policy dialogues on related issues like Internet governance.
Physical Infrastructure
Offi ce market: The Cairo offi ce market operates in a number of key locations across the city refl ecting its enormous geographical and demographic scale including the fi ve areas known as Downtown, Ma’adi, Heliopolis, Mohandiseen, and Nasr City. The new ring road has made areas around the city accessible. An out-of-town market developing in the three areas is known as sixth October, Smart Village, and Emaar’s New Cairo.
Retail market: There are a number of shopping malls in Cairo, including Arkadia, First Mall, Talaat Harb Center, and City Stars, which is the largest shopping mall in North Africa. Western retailers were historically slow to open in Cairo due to trade issues; however, there are now international retailers in the city including Toys ‘R’ Us, Versace, Timberland, and Habitat. The market is destined to grow on the back of developments proposed by Emaar and Damac.
Industrial market: There has been a growing trend for industrial users to move out of the city to areas where there is less congestion and communications are better—sixth October City. However, due to the success of this area, traffi c congestion issues are increasingly affecting the new occupiers.
Residential market: Traditionally the best residential areas have been on the island of Zamalek and in Ma’adi. Due to issues with pollution and quality of life, however, the trend is for housing to be concentrated in out-of-town areas like Pyramids and Katameya Heights. A recent phenomenon in the market is the entry of some of the major UAE developers including Emaar and Damac who are proposing to construct on a scale previously unseen in the Cairo market.
Prime rents Prime yields
Offi ces US$ 11 per sq m per month 11%
Retail US$ 35 per sq m per month 9%
Industrial US$ 7 per sq m per month 12%
Residential US$ 6,000 per month* 8%
*Four bed room executive house—prime location
•
•
•
•
03_Africa_Report09_Egypt.indd 5603_Africa_Report09_Egypt.indd 56 2/25/09 4:18:19 PM2/25/09 4:18:19 PM
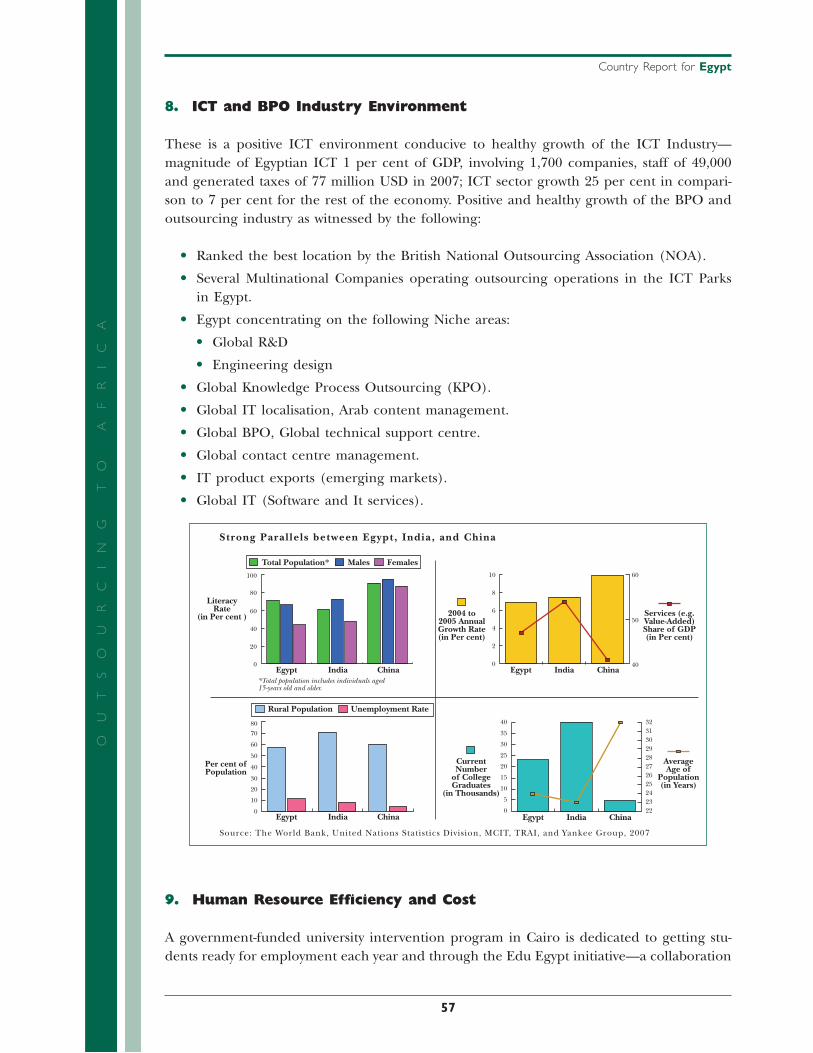
Country Report for Egypt
57
OU
TS
OU
RC
IN
G
TO
A
FR
IC
A8. ICT and BPO Industry Environment
These is a positive ICT environment conducive to healthy growth of the ICT Industry— magnitude of Egyptian ICT 1 per cent of GDP, involving 1,700 companies, staff of 49,000 and generated taxes of 77 million USD in 2007; ICT sector growth 25 per cent in compari-son to 7 per cent for the rest of the economy. Positive and healthy growth of the BPO and outsourcing industry as witnessed by the following:
Ranked the best location by the British National Outsourcing Association (NOA).
Several Multinational Companies operating outsourcing operations in the ICT Parks in Egypt.
Egypt concentrating on the following Niche areas:
Global R&D
Engineering design
Global Knowledge Process Outsourcing (KPO).
Global IT localisation, Arab content management.
Global BPO, Global technical support centre.
Global contact centre management.
IT product exports (emerging markets).
Global IT (Software and It services).
Strong Paral lels between Egypt, India, and China
LiteracyRate
(in Per cent )
Per cent ofPopulation
2004 to2005 AnnualGrowth Rate(in Per cent)
CurrentNumber
of CollegeGraduates
(in Thousands)
AverageAge of
Population(in Years)
Services (e.g.Value-Added)Share of GDP(in Per cent)
Total Population* Males
Rural Population Unemployment Rate
Egypt India China
Egypt India China
Egypt India China
Egypt India China
Females100
80
8070
60
50
40
30
20
10
0
60
40
20
10 60
50
40
8
6
4
2
0
40
35
30
25
20
15
10
5
0
3231302928272625242322
0
Source: The World Bank, United Nations Statistics Division, MCIT, TRAI, and Yankee Group, 2007
*Total population includes individuals aged15-years old and older.
9. Human Resource Effi ciency and Cost
A government-funded university intervention program in Cairo is dedicated to getting stu-dents ready for employment each year and through the Edu Egypt initiative—a collaboration
•
•
•
•
•
•
•
•
•
•
•
03_Africa_Report09_Egypt.indd 5703_Africa_Report09_Egypt.indd 57 2/25/09 4:18:19 PM2/25/09 4:18:19 PM
58
Country Report for Egypt
OU
TS
OU
RC
IN
G
TO
A
FR
IC
Abetween the Ministry of Communications and Technology and the Ministry of Higher Educa-tion and Scientifi c Research—Egypt is able to equip undergraduates with soft skills, language abilities, and technical competences that will secure Egypt’s future workforce. Also, with an annual graduate talent pool of around 330,000 students, Egypt is now globally associated with learning, dialogue, and tolerance (UNESCO, 2007).
Egypt’s dense population produces an attractive labour supply, where English is fl uently spoken by university graduates and where profi ciency in many other European languages is high. Secondary school enrolment is historically high, and the corresponding output will feed university systems in the future, ensuring a constant fl ow of capable and ambitious employees. Among the graduating labour pool, 100,000 students will have chosen commerce, science, or engineering degrees, which are highly desirable disciplines, producing excellent candidates for jobs in the ICT and engineering sectors in Egypt and worldwide. Additionally, Egypt ranks in the top ten for its IT skills in emerging markets (A.T. Kearney).
As a result of its professional pool of graduates, Egypt has become one the world’s most attractive and fast growing locations for global outsourcing. The country has twenty techni-cal institutes with 17,000 engineering graduates entering the marketplace each year; added to which are leading institutes such as Al-Azhar University, Cairo University, and Ain Shams University. The Egyptian Education Initiative was set up to improve ‘employability’ in Egypt, and is supported by leading multinational companies such as CISCO, HP, IBM, and Intel. The majority of training costs are covered as part of a wider government program, supported by the Ministry of Communications and Technology (link to MCIT website), to develop its skilled workforce—creating one of the best IT industry, enabling environments in the world.
Egypt has abundant human resource base of qualifi ed graduates with multi-lingual capabilities. Egypt has a reasonable salary and wage structure. Government provides subsidy in training pro-grammes to support the outsourcing industry. Egypt almost provides universal Internet access due to the subscription-free internet accounts available to all Egyptians. Egypt perhaps has the strongest localisation policy with one expatriate permitted for every nine Egyptians employed. Egypt is the best among the fi fteen countries covered in terms of human resources.
Egypt has an abundant and sustainable pool of talented, technologically skilled, and multi-lingual university graduates.
As a result of its professional pool of graduates, Egypt has become one the world’s most attractive and fast growing locations for global outsourcing. The country has twenty techni-cal institutes with 17,000 engineering graduates entering the marketplace each year; added to which are leading institutes such as Al-Azhar University, Cairo University, and Ain Shams University.
One of the main benefi ts is its low average wage costs (2,076 USD per annum) when compared with Eastern European countries; only India (1,416 USD) and the Philippines (1,776 USD) have lower average wages (source: EIU 2007). For IT programmers, very cost-competitive salaries are rewarded, for example, Egyptians received an average of 9,126 USD in 2006, while 20,966 USD was the service norm in Morocco (A. T. Kearney 2007 Global Service Location Attractiveness).
03_Africa_Report09_Egypt.indd 5803_Africa_Report09_Egypt.indd 58 2/25/09 4:18:20 PM2/25/09 4:18:20 PM

Country Report for Egypt
59
OU
TS
OU
RC
IN
G
TO
A
FR
IC
AThe research team visited and witnessed concrete educational programmes and institutions designed and run to support a strong outsourcing industry on a sustained basis.
10. Legal and Enforcement Issues
Copyright and Cyber Laws are being strengthened at high priority in Egypt. World Bank Doing Business report cited that enforcing contracts is a lengthy procedure in Egypt.
Time taken: 1010 days.
Number of procedures: Forty-two.
Cost: 26.2 per cent.
In comparison, in Singapore it would take only 150 days. This is not as directly applicable to an outsourcing scenario as enforcement problems would not be a fully local issue.
The research team was exposed to the initiatives being taken to strengthen the ICT Security and Cyber law enforcement mechanisms in Egypt.
11. Labour and Expatriate Worker’s Permits
Egypt has a very strong Localisation Policy. One expatriate is permitted for every nine Egyptians employed. Given this stated and announced guideline, getting permits is not a problem and Egyptian General Authority for Investment and Free Zones (GAFI) is a single window department that takes care of all permits. The cost of removing is an employee equivalent to132 weeks’ salary (in comparison to zero in New Zealand or four in Jordan).
12. Revenue, Tax, and Repatriation Issues
There are no foreign exchange controls in Egypt. The corporate tax is now a fl at 20 per cent, but with other taxes the total tax on profi t comes out to be 46 per cent.
13. Investment Policy and Incentives
Special Tax Concessions are given to important infrastructure projects. Minimum invest-ment have reduced to L.E. 1000 from L.E. 50,000 (Egyptian Pounds). Government pays for training of Local Personnel to come upto International Standards. Egypt has a single window authority (GAFI) for all approvals. Egypt has introduced antitrust and unifi ed tax laws to reduce software piracy, and tariffs on imports, and address legislative trade and non-trade barriers to ICT industry. Egypt is the second best in terms of overall business environment.
03_Africa_Report09_Egypt.indd 5903_Africa_Report09_Egypt.indd 59 2/25/09 4:18:20 PM2/25/09 4:18:20 PM

60
Country Report for Egypt
OU
TS
OU
RC
IN
G
TO
A
FR
IC
A14. Government Agencies Giving Support to Outsourcing
Information Technology Industry Development Agency ITIDA
http://www.itida.gov.eg
http://www.egypt-on.com.
The Egyptian General Authority on Investment and Free Zones (GAFI)
http://www.gafi net.org
The charter and responsibility of these two organisations is to support a potential Investor in the area of ICT or outsourcing at each and every step from conception to commission-ing their operations.
15. Overall Assessment and Recommendations
Egypt should maintain this momentum, enhance human resource development and work attitudes, improve living conditions, improve infrastructure in terms of roads and living areas, spread ICT and outsourcing operations out of Cairo into cities like Alexandria.
16. Contact Details
Investment Promotion Single Window Agencies
Information Technology Industry Development Agency
Smart Village, Building (BS)
Cairo–Alexandria Desert Road
Giza, Egypt
Tel: (+202) 3534-5132; Fax: (+202) 3534-5157
Website: http://www.egypt-on.com; http://www.itida.eg
General Authority for Investment and Free Zones
Salah Salem Road, Fairgrounds
Nasir City, Cairo, 11562
Egypt
Tel: (+202) 240-55452; Fax: (+202) 240-55425
Website: http://www.gafi net.org
Embassy of Egypt in China, France, Germany, India, UK, and United States
Chicago (Consulate General)
Head of Mission Consul General/Mona Nafi sa Soaad Soody Mission
500 N. Michigan Ave. Suite 1900
Chicago, IL 60611
•
•
•
03_Africa_Report09_Egypt.indd 6003_Africa_Report09_Egypt.indd 60 2/25/09 4:18:20 PM2/25/09 4:18:20 PM
Country Report for Egypt
61
OU
TS
OU
RC
IN
G
TO
A
FR
IC
ATel: (+312) 8289164-8289163-8289162; Fax: (+312) 8289167
Telex: N/A
Mail Box: N/A
Website: http://www.mfa.gov.eg/Missions/USA/chicago/Consulate/en-GB
Houston (Consulate General)
Head of Mission Consul General El-Husseini Muhammad Abdul Wahab
Consulate General of Egypt in Houston 5718 Westheimer Suite 1350
Houston Texas, 77057
Tel: (+1713) 9614915-9614916-9614407; Fax: (+1713) 9613868
Telex: N/A
Mail Box: N/A
Website: http://www.mfa.gov.eg/Missions/usa/houston/consulate/ar-eg
New York (Consulate General)
Head of Mission Consul General/Housin Abd E1 Karim Mobark
1110 Second Avenue New Yorl # 201
New York 10022
Tel: (+1212) 7597120–7597121–7597122; Fax: (+1212) 3087643
Telex: N/A
Mail Box: N/A
E-mail: [email protected]
Website: http://www.mfa.gov.eg/Missions/usa/newyork/consulate/en-GB/
San Francisco (Consulate General)
Head of Mission Consul General Hisham E1 Nakeb
3001 Pacifi c Ave. San Francisco
California 94115–1013
Tel: (+1415) 3469700–3469702-3467352; Fax: (+1415) 3469480;
Telex: N/A
Mail Box: N/A
Website: http://www.mfa.gov.eg/Missions/usa/sanfrancisco/consulate/en-GB/
Washington (Embassy)
Head of Mission Ambassador /Sameh Hasan Shokry Salim
3521 International CT. N.W
Washington D.C. 20008
Tel: (+202) 8955400; Fax: 23964196 Egypt
Telex: 23964196 Egypt
Mail Box:
Website: http://www.mfa.gov.eg.Missions/USA/Washington/embassy/en-GB
03_Africa_Report09_Egypt.indd 6103_Africa_Report09_Egypt.indd 61 2/25/09 4:18:21 PM2/25/09 4:18:21 PM

62
Country Report for Egypt
OU
TS
OU
RC
IN
G
TO
A
FR
IC
ALondon (Embassy)
Head of Mission Ambassador Gehad Refaat Mohamed Maddy Mission
26 South Street, Mayfair
London W1Y 6DD.
Tel: (+44207) 4992401; Fax: (+44207) 4911542
Telex: N/A
Mail Box: N/A
E-mail: [email protected]
Website: http://www.mfa.gov.eg/missions/uk/london/embassy/ar-eg
London (Consulate General)
Head of Mission Consul General/Amr Wafi k E1 Henawy
2 Lowndes Street
London SW1 X9ET
Tel: (+4420) 72359777; Fax: (+4420) 72355684
Telex: N/A
Mail Box: N/A
E-mail: [email protected]
Website: http://www.mfa.gov.eg/Missions/uk/london/Consulate/en-GB
Beijing (Embassy) serves as a non-resident mission to Mongolia
Head of Mission Ambassador Mahmoud Allam Mohamed Allam
No. 2, Ri Tan Dong Lu, Beijing
Tel: (+8610) 65321825–65322541; Fax: (+8610) 65325365
Telex: N/A
Mail Box: N/A
E-mail: [email protected]
Website: http://www.embassy.org.cn.eg
Hong Kong (Consulate General)
Head of Mission Consul General Magda Hosni Nasr
Suite 2201, Sino Plaza, 255-257 Gloucester Road, Causeway Bay
Hong Kong
Tel: (+852) 28270668–28270952; Fax: (+852) 28272100
Telex: 73030 Zafar HX
Mail Box: N/A
E-mail: [email protected]
Shanghai (Consulate General)
Head of Mission Consul General Khaled Mohamed Abd EL Salam
1375 Huai Zhong Road, Qihua Building–19th Floor A&B
Tel: (+8621) 64331020–64330622–64330502; Fax: (+8621) 64330049
03_Africa_Report09_Egypt.indd 6203_Africa_Report09_Egypt.indd 62 2/25/09 4:18:21 PM2/25/09 4:18:21 PM

Country Report for Egypt
63
OU
TS
OU
RC
IN
G
TO
A
FR
IC
ATelex: N/A
Mail Box: N/A
E-mail: [email protected]
Mumbai (General Consulate)
Head of Mission Consul/Nabila Ibrahim Salama Farhana
Flat No. 101 Benhur Apartments, 32 Narayan Dabholkar Road
Mumbai-400006
Tel: (+9122) 23676422–2367607; Fax: (+9122) 23634558
Telex: N/A
Mail Box: N/A
E-mail: N/A
New Delhi (Embassy)
Head of Mission Ambassador Muhammad Abdul Hameed Hijazi
1-50 M, Niti Marg, Chanakyapuri
New Delhi-110021
Tel: (+9111) 26114096–26114097; Fax: (+9111) 26885355
Telex: 31 72245 egnd in
Mail Box: N/A
E-mail: [email protected]
Website: http://www.mfa.gov.eg/Missions/india/delhi/embassy/en-gb
Head of Mission Ambassador/E1 Sayed Ramzi Ez E1 Din Ramzi
Stauffenberg Str.6-7, 10785 Berlin
Tel: (+4930) 4775470; Fax: (+4930) 4771049
Telex: N/A
Mail Box: N/A
E-mail: [email protected]
Website: http://www.egyptian-embassy.de
Frankfurt (Consulate General)
Head of Mission Consul General Mahmoud Gameel Ahmed Eldeeb
Eysseneck str.34
Frankfurt Main D-60322
Tel: (+49-69) 95513410/15/17/30/24; Fax: (+4969) 5972131
Telex: N/A
Mail Box: 60322
E-mail: N/A
Website: http://www.mfa.gov.eg/missions/germany/frankfurt/consulate/ar-eg
Hamburg (Consulate General)
Head of Mission Consul General Hala Aboul Fatah E1 Ghanam
03_Africa_Report09_Egypt.indd 6303_Africa_Report09_Egypt.indd 63 2/25/09 4:18:21 PM2/25/09 4:18:21 PM

64
Country Report for Egypt
OU
TS
OU
RC
IN
G
TO
A
FR
IC
AMittelweg 183, D-20148
Hamburg
Tel: (+4940)411332610 Switch–41332626 Secretary; Fax: (+4940) 41332619
Telex: N/A
Mail Box: 20149 Hamburg
E-mail: [email protected]
Website: http://www.mfa.gov.eg/missions/germany/hamburg/consulat/ar-eg
Marseille (Consulate General)
Head of Mission Consul General Hoda Mamdouh Othman Naguib
166 Avenue De Hambourg, 13008
Tel: (+33) 491250404–Dir. 491250070–Mob. 630079752; Fax: (+33) 491737931
Telex: N/A
Mail Box: 13008
E-mail: [email protected]
Website: http://www.mfa.gov.eg/Missions/France/marseille/consulate/fr-FR
Paris (Embassy)
Head of Mission Ambassador Nasser Ahmed Kamel
56, Avenue D Iena, 75116 Paris
Tel: (+3301) 53678830; Fax: (+3301) 47230643
Telex: 645297
Mail Box: N/A
E-mail: [email protected]
Website: http://www.mfa.gov.eg/Missions/France emb/Paris/embassy/fr-FR
Paris (Consulate) (Consulate General)
Head of Consul/Ahmed Muhammad Ezat Abdul Hakam
112/114 rue de la Boetie
75008 Paris
Tel: (+33) 145009989–145007427–145007710; Fax: (+33) 145003528
Telex: N/A
Mail Box: N/A
E-mail: Paris_Con@mfa,gov.eg
Website: http://www.mfa.gov.eg/Missions/france/paris/consulate/fr-FR
Useful Links
Why Egypt?
ITIDA.
http://www.itida.gov.eg
03_Africa_Report09_Egypt.indd 6403_Africa_Report09_Egypt.indd 64 2/25/09 4:18:21 PM2/25/09 4:18:21 PM

Country Report for Egypt
65
OU
TS
OU
RC
IN
G
TO
A
FR
IC
ASmart Village, Cairo
http://www.smart-villages.com/docs/front.aspx
Maadi Contact Center Park
http://www.mcit.gov.eg/ContactCentersPark_Maadi.aspx
Programs and Initiatives
Egyptian Education Initiative.
http://www.eei.gov.eg
Edu Egypt.
http://www.iti.gov.eg/eduegypt/edu_egypt
Map-IT
Enterprise Capacity Building Program
Egypt PC 2010.
http://www.egyptpc2010.gov.eg/
Software Engineering Competence Center (SECC).
http://www.secc.org.eg
Mediterranean Information Society Technologies.
http://www.med-ist.eu/WelcomeMEDIST.asp?Forumname=MED-IST&language=Arabic&reason=&user=Education
Education
Nile University.
http://www.nileu.edu.eg/
Al-Azhar University
Cairo University.
http://www.cu.edu.eg/english/
Ain Shams University.
http://net.shams.edu.eg/
Egyptian Universities Network.
http://www.eun.eg
American University in Cairo.
http://www.aucegypt.edu/Pages/default.aspx
03_Africa_Report09_Egypt.indd 6503_Africa_Report09_Egypt.indd 65 2/25/09 4:18:21 PM2/25/09 4:18:21 PM
66
Country Report for Egypt
OU
TS
OU
RC
IN
G
TO
A
FR
IC
AOther Related Ministry Sites
Ministry for Communications and Information Technology (MCIT).
http://www.mcit.gov.eg
The Egyptian General Authority for Investment and Free Zones (GAFI).
http://www.gafi net.org/
Ministry of Education.
http://www.emoe.org (Arabic)
Ministry of Higher Education and Scientifi c Research.
http://www.egy-mhe.gov.eg (Arabic)
Egypt & Middle East Information Technology (Emeit)
http://www.emeint.net
Outsourcing Related Sites
European Outsourcing Association.
http://www.e-oa.net/
UK–National Outsourcing Association.
http://www.noa.co.uk/
EOA France.
http://www.eoafrance.com
International Association of Outsourcing Professionals.
http://www.outsourcingprofessional.org/
Affi liate Organisations
National Telecommunication Regulatory Authority (NTRA).
http://www.tra.gov.eg/english/main.asp
National Postal Authority (NPA).
http://www.egyptpost.org/ar/index.asp
Information Technology Institute.
http://www.iti.gov.eg
National Telecommunication Institute.
http://www.nti.sci.eg
CultNat.
http://beta.cultnat.org
03_Africa_Report09_Egypt.indd 6603_Africa_Report09_Egypt.indd 66 2/25/09 4:18:22 PM2/25/09 4:18:22 PM
Country Report for Egypt
67
OU
TS
OU
RC
IN
G
TO
A
FR
IC
AThe World Fact book 2007.
https://www.cia.gov/cia/publications/factbook/geos/eg.html
Ibid.
Education around the World; Egypt. US Department of Education.
http://www.ed.gov/offi ces/OUS/PES/int_egypt.html;
http://encarta.msn.com/fact_631504758/Egypt_Facts_and_Figures.htm
Arab Republic of Egypt, Ministry of Education. Education for All Report 2003. Cairo.
http://www.unesco.org/education/wef/countryreports/egypt/rapport_2.htm
Egypt Internet Usage and Marketing Report. Internet World Stats.
http://www.internetworldstats.com/af/eg.htm
Egypt Internet usage and Marketing Report. Internet World Stats.
http://www.internetworldstats.com/af/eg.htm
“Arab Higher Education and Development: An Overview.” Almishkat Center for Research. Cairo.
Mashali, S.A. Education Program Director, Ministry of Communications and Information Technology.
http://www.mcit.gov.eg/
03_Africa_Report09_Egypt.indd 6703_Africa_Report09_Egypt.indd 67 2/25/09 4:18:22 PM2/25/09 4:18:22 PM

03_Africa_Report09_Egypt.indd 6803_Africa_Report09_Egypt.indd 68 2/25/09 4:18:22 PM2/25/09 4:18:22 PM

69
OU
TS
OU
RC
IN
G
TO
A
FR
IC
A
Country Report for Mauritius
Disclaimer
This short Country Report, a result of a larger survey of ICT Outsourcing in Africa, provides a general over-view of the current activities and issues related to ICT Outsourcing in the country. The data presented here should be regarded as illustrative rather than exhaustive. ICT Outsourcing is at a particularly dynamic stage in Africa with new developments and announcements happening on a daily basis somewhere or the other on the continent. Therefore, these reports should be seen as ‘snapshots’, that were current at the time they were taken; it is expected that certain facts and fi gures presented may become outdated very quickly.
The fi ndings, interpretations, and conclusions expressed herein are a faithful representation of the respond-ents of the interviews and secondary data collected. Strict analysis has been carried out with the minimal infl uence of the authors/team members. References to data sources have been made as far as possible. In the case of the detailed data parameters used for scores and ranking, the same data source and timeline has been used for all the fi fteen countries compared. In the descriptive section of the country reports all data received from the individual country has been used in order to give as complete an assessment as possible. Thus those countries that have provided more information have a better coverage than those who have not been able to provide data to the research team.
Board of Executive Directors of the CBC or Cyber Media cannot guarantee the accuracy of the data included in this work. The boundaries, colours, denominations, and other information shown on any map in this work do not imply on the part of the CBC and Cyber Media any judgement of the legal status of any territory or the endorsement or acceptance of such boundaries.
It is expected that individual Country Report from the Survey of ICT Outsourcing in Africa will be updated in an iterative process over time, based on additional research and feedback received through the CBC and Cyber Media website.
PORT LOUIS
IndianOcean
Indian Ocean
Triolet
Goodlands
reefAgalega Islands, CargadosCarajos Shoals, andRodrigues are not shown.
reef
reef
Quatre Bomes
CurepipeTamarin
CheminGrenier
Souillac
Mahébourg
Centrede Flacq
0 2.5 5 km
0 2.5 5 mi
04_Africa_Report09_Mauritius.ind69 6904_Africa_Report09_Mauritius.ind69 69 2/25/09 4:19:00 PM2/25/09 4:19:00 PM

70
Country Report for Mauritius
OU
TS
OU
RC
IN
G
TO
A
FR
IC
A1. Country Overview
Mauritius is an island nation with a population of about 1.2 million. Since independence in 1968, the country has grown from a low-income agriculture-based economy to a middle-income diversifi ed economy with growing industrial, fi nancial, and tourist sectors. Since independence, annual growth has been around 5 per cent to 6 per cent, life expectancy has risen, infant mortality has been lowered, and the infrastructure has improved.
Following the model of the Singaporean experience, the Mauritian government has been visionary in its promotion of its country as a ‘cyber island’, a hub for the southern African region with a diversifi ed economy. Mauritius has attempted to promote ICTs in schools since the late 1990s which is refl ected in its national ICT policy, a segment of which is dedicated to education. Mauritius is an investment heaven and has considered outsourcing as one of its major economic diversifi cation efforts.
2. Mauritius’s Position in Africa’s Fifteen Countries
Mauritius is the second in the ready (highest) band of countries from the outsourcing attrac-tiveness point of view. The map and table below show where Mauritius is positioned.
Morocco *
Morocco
Tunisia *
Geographical Coverage and Rank
Tunisia
Egypt *
Egypt
Senegal *
Senegal
GhanaGhana
Nigeria
Nigeria
Uganda
Uganda
Kenya
KenyaTanzania
Tanzania
Zambia
Zambia
Mozambique MozambiqueBotswana
Botswana
Namibia
Namibia
SouthAfrica
South Africa
MauritiusAfrica
*Non-Commonwealth Countries
Mauritius
04_Africa_Report09_Mauritius.ind70 7004_Africa_Report09_Mauritius.ind70 70 2/25/09 4:19:01 PM2/25/09 4:19:01 PM

Country Report for Mauritius
71
OU
TS
OU
RC
IN
G
TO
A
FR
IC
AContributing scores and ranks are as under.
Overall
Band Score (PS & BE) Rank in Band
Ready 7.08 Second
Infrastructure
Score Rank Band
6.5 5 Ready
While achieving this score for ‘Infrastructure’, Mauritius has been second in the Interna-tional Internet Bandwidth, third in network readiness, and fi fth in the overall infrastructure availability and penetration. At the other end, Mauritius has scored eleventh and thirteenth out of fi fteen in the costs of stay, travel, and electricity availability.
People and Skills (PS)
Score Rank
3.385 5
In the case of ‘People and Skills’ Mauritius has done very well by being fi rst in ICT exposure and working satisfaction; second in quality and education, language, and domain skills; it has scored fi fth in human resource costs. At the other end Mauritius has positioned itself as a platform for the free movement of labour.
The issuance of an occupation permit (a combined work and residence permit valid for three years) in three years is a concrete example of the scalability of labour quantity in Mauritius.
Business Environment (BE)
Score Rank
3.695 First
Topping this lower level abstraction, Mauritius is fi rst in ease and cost of fi nances, second in contribution of services in GDP and exports, third in tax rates, fourth in geopolitical and currency risk, and fi fth in legislative risk. Mauritius has an unmatched regulatory framework detailed below:
An appropriate legal framework has been put into place to enable international ICT play-ers to successfully conduct business from Mauritius. In this perspective, the Information
•
04_Africa_Report09_Mauritius.ind71 7104_Africa_Report09_Mauritius.ind71 71 2/25/09 4:19:01 PM2/25/09 4:19:01 PM
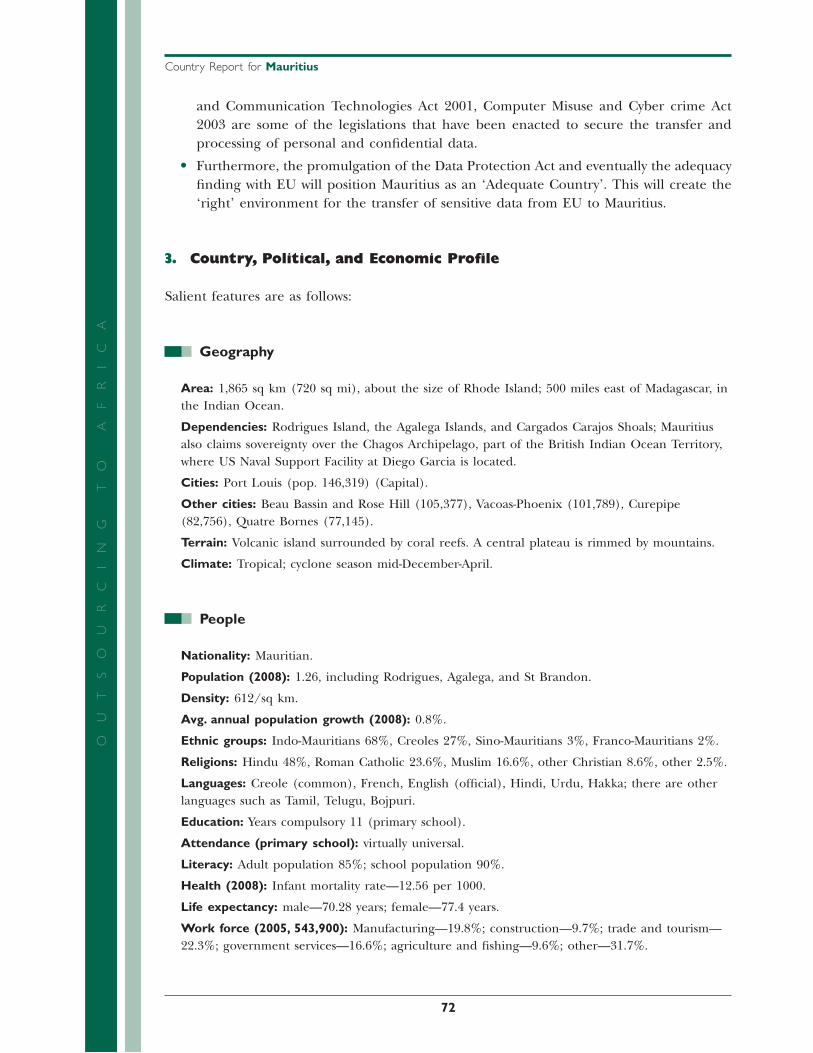
72
Country Report for Mauritius
OU
TS
OU
RC
IN
G
TO
A
FR
IC
Aand Communication Technologies Act 2001, Computer Misuse and Cyber crime Act 2003 are some of the legislations that have been enacted to secure the transfer and processing of personal and confi dential data.
Furthermore, the promulgation of the Data Protection Act and eventually the adequacy fi nding with EU will position Mauritius as an ‘Adequate Country’. This will create the ‘right’ environment for the transfer of sensitive data from EU to Mauritius.
3. Country, Political, and Economic Profi le
Salient features are as follows:
Geography
Area: 1,865 sq km (720 sq mi), about the size of Rhode Island; 500 miles east of Madagascar, in the Indian Ocean.
Dependencies: Rodrigues Island, the Agalega Islands, and Cargados Carajos Shoals; Mauritius also claims sovereignty over the Chagos Archipelago, part of the British Indian Ocean Territory, where US Naval Support Facility at Diego Garcia is located.
Cities: Port Louis (pop. 146,319) (Capital).
Other cities: Beau Bassin and Rose Hill (105,377), Vacoas-Phoenix (101,789), Curepipe (82,756), Quatre Bornes (77,145).
Terrain: Volcanic island surrounded by coral reefs. A central plateau is rimmed by mountains.
Climate: Tropical; cyclone season mid-December-April.
People
Nationality: Mauritian.
Population (2008): 1.26, including Rodrigues, Agalega, and St Brandon.
Density: 612/sq km.
Avg. annual population growth (2008): 0.8%.
Ethnic groups: Indo-Mauritians 68%, Creoles 27%, Sino-Mauritians 3%, Franco-Mauritians 2%.
Religions: Hindu 48%, Roman Catholic 23.6%, Muslim 16.6%, other Christian 8.6%, other 2.5%.
Languages: Creole (common), French, English (offi cial), Hindi, Urdu, Hakka; there are other languages such as Tamil, Telugu, Bojpuri.
Education: Years compulsory 11 (primary school).
Attendance (primary school): virtually universal.
Literacy: Adult population 85%; school population 90%.
Health (2008): Infant mortality rate—12.56 per 1000.
Life expectancy: male—70.28 years; female—77.4 years.
Work force (2005, 543,900): Manufacturing—19.8%; construction—9.7%; trade and tourism—22.3%; government services—16.6%; agriculture and fi shing—9.6%; other—31.7%.
•
04_Africa_Report09_Mauritius.ind72 7204_Africa_Report09_Mauritius.ind72 72 2/25/09 4:19:02 PM2/25/09 4:19:02 PM
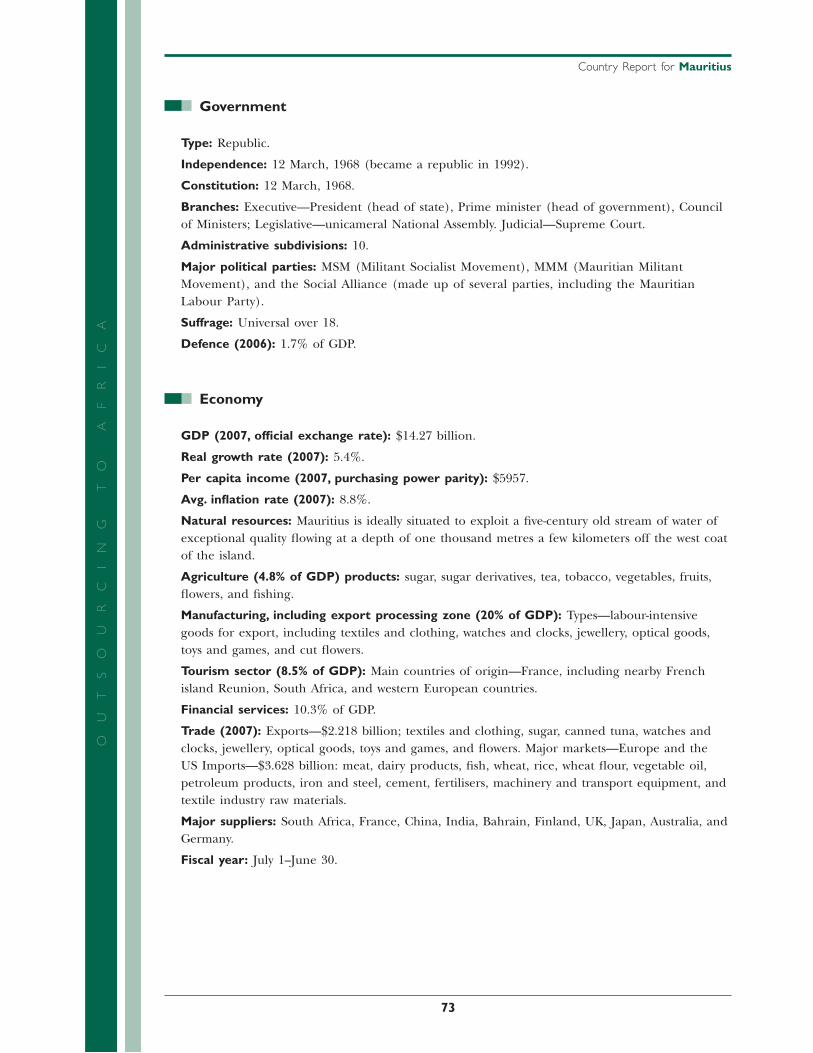
Country Report for Mauritius
73
OU
TS
OU
RC
IN
G
TO
A
FR
IC
AGovernment
Type: Republic.
Independence: 12 March, 1968 (became a republic in 1992).
Constitution: 12 March, 1968.
Branches: Executive—President (head of state), Prime minister (head of government), Council of Ministers; Legislative—unicameral National Assembly. Judicial—Supreme Court.
Administrative subdivisions: 10.
Major political parties: MSM (Militant Socialist Movement), MMM (Mauritian Militant Movement), and the Social Alliance (made up of several parties, including the Mauritian Labour Party).
Suffrage: Universal over 18.
Defence (2006): 1.7% of GDP.
Economy
GDP (2007, offi cial exchange rate): $14.27 billion.
Real growth rate (2007): 5.4%.
Per capita income (2007, purchasing power parity): $5957.
Avg. infl ation rate (2007): 8.8%.
Natural resources: Mauritius is ideally situated to exploit a fi ve-century old stream of water of exceptional quality fl owing at a depth of one thousand metres a few kilometers off the west coat of the island.
Agriculture (4.8% of GDP) products: sugar, sugar derivatives, tea, tobacco, vegetables, fruits, fl owers, and fi shing.
Manufacturing, including export processing zone (20% of GDP): Types—labour-intensive goods for export, including textiles and clothing, watches and clocks, jewellery, optical goods, toys and games, and cut fl owers.
Tourism sector (8.5% of GDP): Main countries of origin—France, including nearby French island Reunion, South Africa, and western European countries.
Financial services: 10.3% of GDP.
Trade (2007): Exports—$2.218 billion; textiles and clothing, sugar, canned tuna, watches and clocks, jewellery, optical goods, toys and games, and fl owers. Major markets—Europe and the US Imports—$3.628 billion: meat, dairy products, fi sh, wheat, rice, wheat fl our, vegetable oil, petroleum products, iron and steel, cement, fertilisers, machinery and transport equipment, and textile industry raw materials.
Major suppliers: South Africa, France, China, India, Bahrain, Finland, UK, Japan, Australia, and Germany.
Fiscal year: July 1–June 30.
04_Africa_Report09_Mauritius.ind73 7304_Africa_Report09_Mauritius.ind73 73 2/25/09 4:19:02 PM2/25/09 4:19:02 PM

74
Country Report for Mauritius
OU
TS
OU
RC
IN
G
TO
A
FR
IC
A4. Principal Government Offi cials
The current leadership till the next elections in 2010
President: Sir Anerood Jugnauth.
Vice-President: Angidi Chettiar.
Prime Minister: Navinchandra Ramgoolam.
Minister Information and Communication Technology: Mohammed Asraf Ally Dulull.
5. Foreign Relations
Mauritius has strong and friendly relations with the West as well as with India and the coun-tries of southern and eastern Africa. It is a member of the African Union (AU), World Trade Organization (WTO), the Commonwealth, La Francophone, the Southern Africa Devel-opment Community (SADC), the Indian Ocean Commission, Community of Eastern, and South African States (COMESA), and the recently formed Indian Ocean Rim Association. In 2004, then-Prime Minister Berenger became chairman of SADC for a one-year term.
Trade, commitment to democracy, colonial and cultural ties, and the country’s small size are the driving forces behind Mauritian foreign policy. The country’s political heritage and dependence on Western markets have led to close ties with the European Union and its member states, particularly the United Kingdom and France, which exercises sovereignty over neighbouring reunion.
Considered part of Africa geographically, Mauritius has friendly relations with other African states in the region, particularly South Africa, by far its largest continental trading part-ner. Mauritian investors are gradually entering African markets, notably Madagascar and Mozambique. Mauritius coordinates much of its foreign policy with the Southern Africa Development Community and the African Union.
Relations with India are strong for both historical and commercial reasons. Foreign embas-sies in Mauritius include Australia, the United Kingdom, China, Egypt, France, India, Madagascar, Pakistan, Russia, South Africa, and the United States.
6. Living, Security, and Safety Perceptions
In general it is an extremely safe place by African or Asian Standards. There is a respect for law, and the police are honest and strict. There is complete communal harmony where people of different origins, and religions live in harmony, mix socially, and inter community marriage is readily accepted by society.
Although violent crimes are uncommon, petty crime is present. There is potential for pick pocketing and purse snatching, especially in crowded areas. Residential break-ins are reported frequently on the island. Most break-ins are surreptitious and do not involve violence; how-ever, some burglars have brandished weapons, such as knives or machetes. Although very
04_Africa_Report09_Mauritius.ind74 7404_Africa_Report09_Mauritius.ind74 74 2/25/09 4:19:02 PM2/25/09 4:19:02 PM

Country Report for Mauritius
75
OU
TS
OU
RC
IN
G
TO
A
FR
IC
Auncommon, there have been reports of armed robbery and assault. All individuals should exercise caution on beaches and poorly lit or deserted areas at night.
Medical facilities are available and are of a moderate quality. The general cleanliness and hygiene of the public places is of a high order; for example, it is compulsory for all food vendors, even those on the streets, to wear a cap and gloves while selling food. While public hospitals and clinics provide free care, many visitors may choose to be treated by private doctors and hospitals. Service Aide Medicale Urgence (SAMU) is a government organisation that provides ambulance and emergency assistance in response to calls to 114. Mega Care is a private organisation that provides assistance to subscribers only; Tel: 116; 464-6116). It is advisable to have a medical insurance cover as medical treatment is expensive. Outbreaks of the mosquito-borne Chikungunya virus have occurred in recent years; however, very few cases have been reported since 2006.
In conclusion Mauritius is a safe and healthy place to stay, work, or live.
7. ICT Policy, Infrastructure, and Service
Early Government Initiatives in ICT Infrastructure
The Government of Mauritius has actively promoted ICT since 1989. Since then it also proposed a national ICT policy modelled on the Singaporean experience. The Mauritius strategy involved creating instruments to support the liberalisation of its telecommunications sector, creating an ICT literate workforce, improving the capacity of public institutions to harness ICTs, and positioning Mauritius to be a key player in ICTs by creating enabling environment and robust infrastructure. In 1989 the government set up four institutions: the National Computer Board, the Central Informatics Bureau, the State Informatics Limited, and the State Informatics Training Centre Limited.
The Ministry of Information Technology and Telecommunications has the responsibility of formulation and implementation of government policies in the ICT sector. The National Information and Communication Technology Strategic Plan (NICTSP) was fi rst adopted in 1998 and was accompanied by the launch of a number of projects in policy formulation, ICT awareness, human resources development, government computerisation, and standard setting. The Mauritius Parliament also passed an Electronic Transaction Act in July 2000 to provide an appropriate legal environment for electronic transactions covering electronic contracts, and ensuring establishment of a number of certifi cation authorities and standards to combat forgery and fraud in electronic business. The policy’s vision is to make Mauritius a ‘cyber island’ in which ICT would become the fi fth pillar of the economy after sugar, textile, tourism, and fi nancial services as well as a regional ICT hub.
Current Status of ICT Infrastructure
The current state of the ICT Infrastructure is very high and well recognised by the World Economic Forum, ITU, and World Bank surveys.
04_Africa_Report09_Mauritius.ind75 7504_Africa_Report09_Mauritius.ind75 75 2/25/09 4:19:02 PM2/25/09 4:19:02 PM

76
Country Report for Mauritius
OU
TS
OU
RC
IN
G
TO
A
FR
IC
AAccording to the World Economic Forum Global Information Technology Report, Mauritius ranks forty-fi fth out of 115 economies in terms of its network readiness index, an indicator of the degree of preparation of a nation to participate in and benefi t from ICT developments.
The following tables provide a snapshot of the state of national ICT infrastructure in Mauritius.
ICT Infrastructure 2000 2001 2002 2003 2004 2005 2006
1. Fixed-line telephone service providers (number)
1 1 1 1 1 1 2
2. Mobile cellular service provider (number)
2 2 2 2 2 2 3
3. Internet service providers (number)
1 2 2 2 3 6 7
4. Percentage of population covered by mobile telephony (%)
92.0 93.0 94.0 95.0 96.0 97.0 98.0
5. Internet hosts (number) 3,275 3,126 3,462 3,985 4,819 4,974 9,654
6. Internet hosts per 10,000 inhabitants (number)
27.4 25.9 28.5 32.5 38.9 39.8 76.8
7. International Internet bandwidth capacity (Megabits per second)
Incoming 10.0 12.0 36.0 63.0 71.0 153.0 192.0
Outgoing 10.0 12.0 36.0 63.0 71.0 116.0 153.0
8. International Internet bandwidth (bits per second per inhabitant)
Incoming 8.4 10.0 29.6 51.3 57.4 122.5 152.8
Outgoing 8.4 10.0 29.6 51.3 57.4 92.9 121.8
Source: Information and Communication Technologies Authority (ICTA) and National Computer Board (NCB)
Type of Internet subscribers 2003 2004 2005 2006
TOTAL SUBSCRIBERS 61,252 78,023 128,555 137,479
Narrowband Internet subscribers (dial-up) 60,052 75,237 77,160 56,410
Broadband1 Internet subscribers 1,200 2,786 51,395 81,069
Fixed (including wireless) 1,200 2,786 8,339 19,948
DSL (Digital Subscriber Line) 1,200 2,786 8,114 10,582
Wireless na na ... 9,125
Other na na 229 241
Mobile na ... 43,056 61,121
GPRS na ... 40,804 44,471
3G na ... 2,252 16,6501Broadband Internet refers to connection to the Internet at a speed equal to or greater than 128 kbps, as the sum of capacity in both directionsna: Not applicable ... Nil or negligibleSource: Information and Communication Technologies Authority (ICTA)
04_Africa_Report09_Mauritius.ind76 7604_Africa_Report09_Mauritius.ind76 76 2/25/09 4:19:03 PM2/25/09 4:19:03 PM
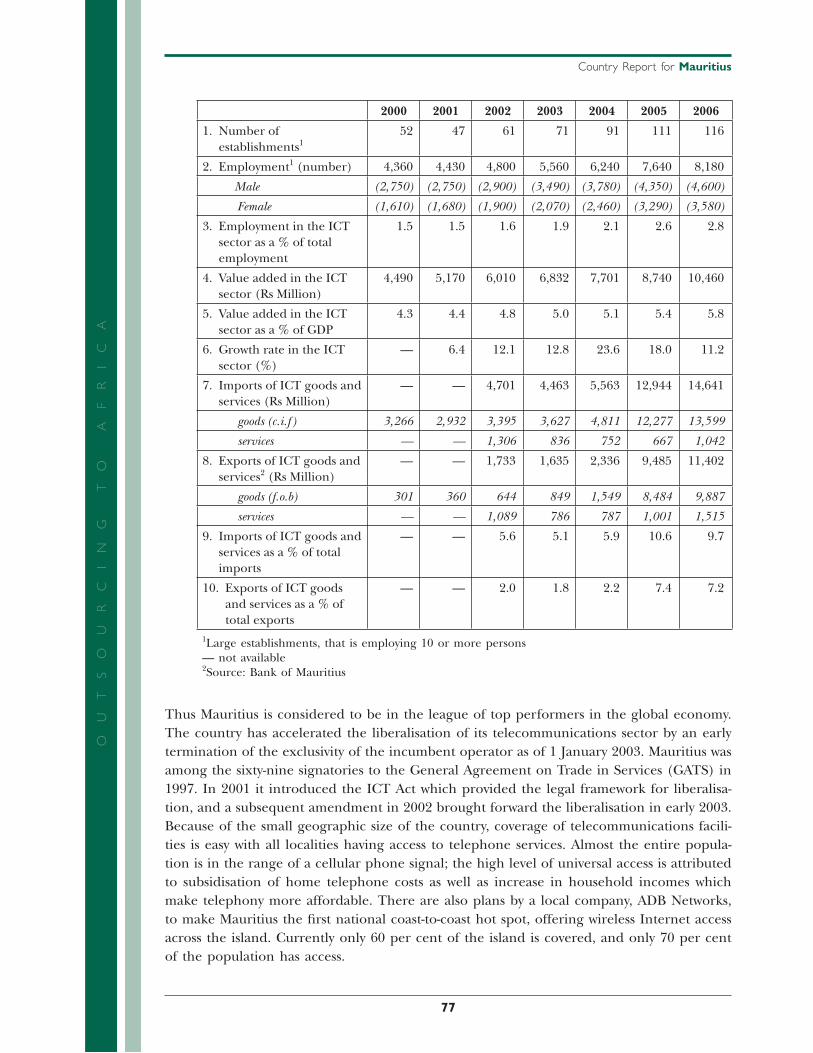
Country Report for Mauritius
77
OU
TS
OU
RC
IN
G
TO
A
FR
IC
A2000 2001 2002 2003 2004 2005 2006
1. Number of establishments1
52 47 61 71 91 111 116
2. Employment1 (number) 4,360 4,430 4,800 5,560 6,240 7,640 8,180
Male (2,750) (2,750) (2,900) (3,490) (3,780) (4,350) (4,600)
Female (1,610) (1,680) (1,900) (2,070) (2,460) (3,290) (3,580)
3. Employment in the ICT sector as a % of total employment
1.5 1.5 1.6 1.9 2.1 2.6 2.8
4. Value added in the ICT sector (Rs Million)
4,490 5,170 6,010 6,832 7,701 8,740 10,460
5. Value added in the ICT sector as a % of GDP
4.3 4.4 4.8 5.0 5.1 5.4 5.8
6. Growth rate in the ICT sector (%)
— 6.4 12.1 12.8 23.6 18.0 11.2
7. Imports of ICT goods and services (Rs Million)
— — 4,701 4,463 5,563 12,944 14,641
goods (c.i.f ) 3,266 2,932 3,395 3,627 4,811 12,277 13,599
services — — 1,306 836 752 667 1,042
8. Exports of ICT goods and services2 (Rs Million)
— — 1,733 1,635 2,336 9,485 11,402
goods (f.o.b) 301 360 644 849 1,549 8,484 9,887
services — — 1,089 786 787 1,001 1,515
9. Imports of ICT goods and services as a % of total imports
— — 5.6 5.1 5.9 10.6 9.7
10. Exports of ICT goods and services as a % of total exports
— — 2.0 1.8 2.2 7.4 7.2
1Large establishments, that is employing 10 or more persons — not available2Source: Bank of Mauritius
Thus Mauritius is considered to be in the league of top performers in the global economy. The country has accelerated the liberalisation of its telecommunications sector by an early termination of the exclusivity of the incumbent operator as of 1 January 2003. Mauritius was among the sixty-nine signatories to the General Agreement on Trade in Services (GATS) in 1997. In 2001 it introduced the ICT Act which provided the legal framework for liberalisa-tion, and a subsequent amendment in 2002 brought forward the liberalisation in early 2003. Because of the small geographic size of the country, coverage of telecommunications facili-ties is easy with all localities having access to telephone services. Almost the entire popula-tion is in the range of a cellular phone signal; the high level of universal access is attributed to subsidisation of home telephone costs as well as increase in household incomes which make telephony more affordable. There are also plans by a local company, ADB Networks, to make Mauritius the fi rst national coast-to-coast hot spot, offering wireless Internet access across the island. Currently only 60 per cent of the island is covered, and only 70 per cent of the population has access.
04_Africa_Report09_Mauritius.ind77 7704_Africa_Report09_Mauritius.ind77 77 2/25/09 4:19:03 PM2/25/09 4:19:03 PM

78
Country Report for Mauritius
OU
TS
OU
RC
IN
G
TO
A
FR
IC
AAs of 2009, Emtel Ltd is offering wireless Internet through its WiMAX network and mobile ADSL solution. Another Internet service provider, Data Communications Ltd (DCL), is con-templating provision of wireless Internet access through a WiMAX network by mid 2009.
Revised National ICT Strategic Plan 2007–2011
A revised strategy was approved by the government in February 2006 following a review of the fi rst fi ve years of the NICTSP. This revised strategy revolves around focusing on niche markets in the ICT industry, developing strategic partnerships with ICT leaders, investing in a world-class physical and telecommunications infrastructure, emphasising ICT culture development, providing for an adequate supply of human resources, and establishing a favourable business environment.
It has three key focus areas:
The establishment of an ICT industry comprising the cyber city and business parks supported by telecommunications infrastructure for wealth and job creation.
Attracting and maintaining a high calibre of ICT experts in Mauritius to increase local availability of trained manpower in ICT.
Creating a favourable business environment with a sound legal framework and attrac-tive fi nancial incentives for foreign investors.
ICT as the Fifth Pillar of the Economy
The revised National ICT Strategic Plan sets out a strategy to realise Mauritius’s vision for ICT to be the fi fth pillar of the economy. Consequently in order for ICT to take the dimen-sions of a ‘pillar’ of the economy it would require interventions in the twin tracks of Infor-mation Economy and Information Society.
The former calls for measures which, signifi cantly, enable the ICT sector to contribute into the GDP of Mauritius, lead to the ICT sector employing more Mauritians, make for a sustained availability of skilled manpower to power the sector, facilitate contribu-tion from the ICT sector into the Mauritian export basket.
The latter takes initiative to create an information society that revolves around the instilling of a ‘technology temper’ in Mauritians to bring about increased adoption and usage of ICT, and ICT-enabled knowledge networking among citizens, generally accepting ICT as a stream of professional persuasion at par with others.
Mauritius as a Regional Hub
Mauritius must follow a two-fold strategy to transform itself into a Regional ICT Hub.
It must emerge as a leader in some identifi ed select areas of ICT where expertise does not substantially exist in the region and, more generally, it must increasingly be seen as a preferred centre of ICT skills, expertise, and employment in the region.
•
•
•
•
•
•
04_Africa_Report09_Mauritius.ind78 7804_Africa_Report09_Mauritius.ind78 78 2/25/09 4:19:04 PM2/25/09 4:19:04 PM
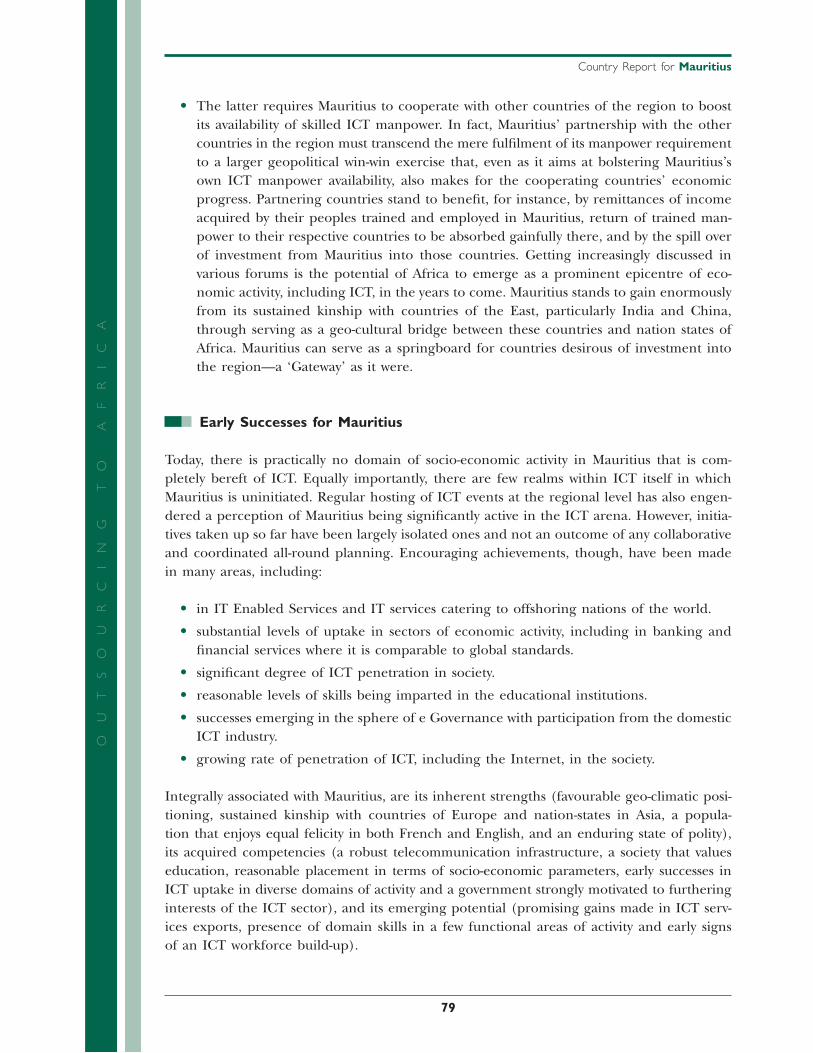
Country Report for Mauritius
79
OU
TS
OU
RC
IN
G
TO
A
FR
IC
AThe latter requires Mauritius to cooperate with other countries of the region to boost its availability of skilled ICT manpower. In fact, Mauritius’ partnership with the other countries in the region must transcend the mere fulfi lment of its manpower requirement to a larger geopolitical win-win exercise that, even as it aims at bolstering Mauritius’s own ICT manpower availability, also makes for the cooperating countries’ economic progress. Partnering countries stand to benefi t, for instance, by remittances of income acquired by their peoples trained and employed in Mauritius, return of trained man-power to their respective countries to be absorbed gainfully there, and by the spill over of investment from Mauritius into those countries. Getting increasingly discussed in various forums is the potential of Africa to emerge as a prominent epicentre of eco-nomic activity, including ICT, in the years to come. Mauritius stands to gain enormously from its sustained kinship with countries of the East, particularly India and China, through serving as a geo-cultural bridge between these countries and nation states of Africa. Mauritius can serve as a springboard for countries desirous of investment into the region—a ‘Gateway’ as it were.
Early Successes for Mauritius
Today, there is practically no domain of socio-economic activity in Mauritius that is com-pletely bereft of ICT. Equally importantly, there are few realms within ICT itself in which Mauritius is uninitiated. Regular hosting of ICT events at the regional level has also engen-dered a perception of Mauritius being signifi cantly active in the ICT arena. However, initia-tives taken up so far have been largely isolated ones and not an outcome of any collaborative and coordinated all-round planning. Encouraging achievements, though, have been made in many areas, including:
in IT Enabled Services and IT services catering to offshoring nations of the world.
substantial levels of uptake in sectors of economic activity, including in banking and fi nancial services where it is comparable to global standards.
signifi cant degree of ICT penetration in society.
reasonable levels of skills being imparted in the educational institutions.
successes emerging in the sphere of e Governance with participation from the domestic ICT industry.
growing rate of penetration of ICT, including the Internet, in the society.
Integrally associated with Mauritius, are its inherent strengths (favourable geo-climatic posi-tioning, sustained kinship with countries of Europe and nation-states in Asia, a popula-tion that enjoys equal felicity in both French and English, and an enduring state of polity), its acquired competencies (a robust telecommunication infrastructure, a society that values education, reasonable placement in terms of socio-economic parameters, early successes in ICT uptake in diverse domains of activity and a government strongly motivated to furthering interests of the ICT sector), and its emerging potential (promising gains made in ICT serv-ices exports, presence of domain skills in a few functional areas of activity and early signs of an ICT workforce build-up).
•
•
•
•
•
•
•
04_Africa_Report09_Mauritius.ind79 7904_Africa_Report09_Mauritius.ind79 79 2/25/09 4:19:04 PM2/25/09 4:19:04 PM
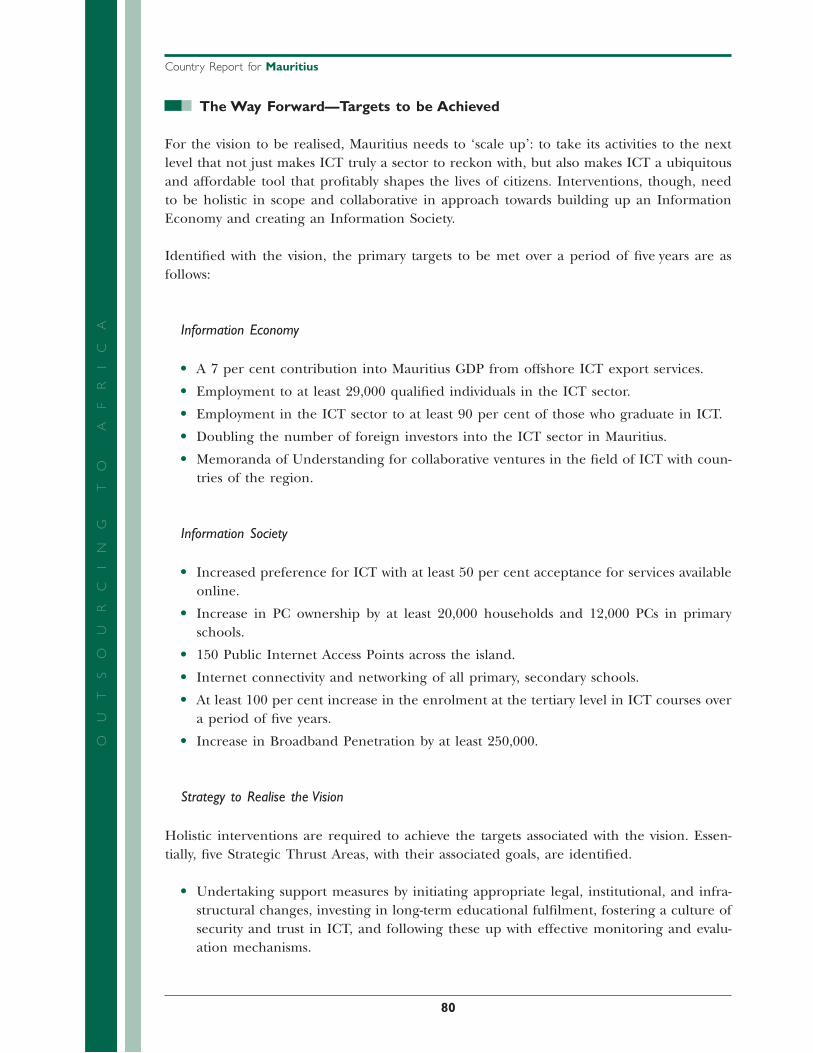
80
Country Report for Mauritius
OU
TS
OU
RC
IN
G
TO
A
FR
IC
AThe Way Forward—Targets to be Achieved
For the vision to be realised, Mauritius needs to ‘scale up’: to take its activities to the next level that not just makes ICT truly a sector to reckon with, but also makes ICT a ubiquitous and affordable tool that profi tably shapes the lives of citizens. Interventions, though, need to be holistic in scope and collaborative in approach towards building up an Information Economy and creating an Information Society.
Identifi ed with the vision, the primary targets to be met over a period of fi ve years are as follows:
Information Economy
A 7 per cent contribution into Mauritius GDP from offshore ICT export services.
Employment to at least 29,000 qualifi ed individuals in the ICT sector.
Employment in the ICT sector to at least 90 per cent of those who graduate in ICT.
Doubling the number of foreign investors into the ICT sector in Mauritius.
Memoranda of Understanding for collaborative ventures in the fi eld of ICT with coun-tries of the region.
Information Society
Increased preference for ICT with at least 50 per cent acceptance for services available online.
Increase in PC ownership by at least 20,000 households and 12,000 PCs in primary schools.
150 Public Internet Access Points across the island.
Internet connectivity and networking of all primary, secondary schools.
At least 100 per cent increase in the enrolment at the tertiary level in ICT courses over a period of fi ve years.
Increase in Broadband Penetration by at least 250,000.
Strategy to Realise the Vision
Holistic interventions are required to achieve the targets associated with the vision. Essen-tially, fi ve Strategic Thrust Areas, with their associated goals, are identifi ed.
Undertaking support measures by initiating appropriate legal, institutional, and infra-structural changes, investing in long-term educational fulfi lment, fostering a culture of security and trust in ICT, and following these up with effective monitoring and evalu-ation mechanisms.
•
•
•
•
•
•
•
•
•
•
•
•
04_Africa_Report09_Mauritius.ind80 8004_Africa_Report09_Mauritius.ind80 80 2/25/09 4:19:04 PM2/25/09 4:19:04 PM

Country Report for Mauritius
81
OU
TS
OU
RC
IN
G
TO
A
FR
IC
ACatalysing economic activity in critical sectors of the economy by promoting e Business adoption within and across different sectors of socio-economic activity.
Accelerating ICT adoption in society by embracing electronic means of governance and by taking measures towards democratising ICT in society.
Taking up leadership roles in the region through transforming itself into an ICT skills and expertise hub in this part of the world, while at the same time identifying a few areas in which to become a regional leader.
Emerging as a global point of reference for offshored services both in the ITS and in the ITeS domains using, among other things, advantages of bilingualism and becoming an investment nucleus for ICT and a gateway to markets of Africa.
To conclude, Mauritius has a strong ICT base and has been and will be serious about improving its ICT structure. Limited human resources and high population density are and will be the challenges. Mauritius is serious as the following table shows the ICT adoption infl uencing factors.
Factors Enabling features Constraining features
Policy framework and implementation
Mauritius has been a front runner in an overall comprehensive national ICT policy and liberalised telecommunications framework. The national ICT policy also includes a component on education.
There is no comprehensive policy on ICT in education.
Advocacy leadership The government has been at the forefront of driving ICT access and use at all levels of society and has implemented projects with ambitious targets.
Gender equity The government has introduced a dedicated project promoting the use of ICT by women.
There is no explicit reference to gender equality and women’s empowerment in the national ICT policy.
Infrastructure and access
Mauritius has a relatively good ICT infrastructure and high levels of ICT access including Internet connectivity.
Collaborating mechanisms
The government has instituted some collaborating mechanisms to co-ordinate, monitor, and manage ICT initiatives in the country.
Fiscal resources Dedicated budgets have been allocated for various ICT projects that promote the vision of the government.
Attitudes The leadership of the government has been confi dent ambitious attitude in the promotion of ICTs as a cornerstone of the economy. The focus appears to be on technical training.
•
•
•
•
•
04_Africa_Report09_Mauritius.ind81 8104_Africa_Report09_Mauritius.ind81 81 2/25/09 4:19:04 PM2/25/09 4:19:04 PM

82
Country Report for Mauritius
OU
TS
OU
RC
IN
G
TO
A
FR
IC
APhysical Infrastructure
Offi ce market: The Cyber Tower, located about ten km south of the capital Port Louis, is home to a number of leading IT companies, with space rented for around US$ 15 per sq m per month. In the Port Louis region, mid-range offi ces including Jade Court, Moorgate House and Victoria House attract rents of US$ 8–10 per sq m per month. Elsewhere, offi ce premises such as Medine Mews and Harbour Front command average rents of about US$ 14 per sq m per month.
Retail market: In landmark locations such as Caudan, small shop premises of between 30–50 sq m are being rented for as much as US$ 40 per sq m per month. At the Phoenix les Halles, a shopping centre of 28,000 sq m which is currently under construc-tion and due to open in August 2008, the projected rent is around US$ 16 per sq m per month for premises of above 400 sq m.
Residential market: The residential market is very heterogeneous, with large differences between the markets for beach front houses, Integrated Resort Scheme (IRS) proper-ties, and the mass Mauritian market. A three to four bedroom house close to the sea in areas such as Grand Bay and Tamarin will command rents of about US$ 1,400–2,400. A similar house on the beach front will rent for US$ 1,600–3,200 per month. The IRS program, which was recently introduced by the Mauritian government, is designed to encourage foreign investors to buy luxury residential property. The fi rst IRS project, located in Tamarin, is about to be completed.
Hotel market: In 2006 there were 10,666 hotel rooms in Mauritius, with overall room occupancy averaging 66 per cent. Data from the Bank of Mauritius indicates that gross tourism receipts for the year amounted to over 31 billion rupees (c. US$ 1 billion). According to the Survey of Employment and Earnings, over 25,000 people are directly employed in the travel and tourism industry. Average room rates for 3 to 5-star hotels range between US$ 100–400.
Prime rents Prime yields
Offi ces US$ 15 per sq m per month NA
Retail US$ 40 per sq m per month NA
Industrial Na NA
Residential US$ 3,200 per month* NA
* Four bed-room executive house–prime location
Space in Mauritius is a bit expensive—a natural phenomenon as the population density is 616 persons per square kilometre. With reference to the fi fteen countries it ranks six out of fi fteen in cost effectiveness of space and facilities. Botswana and Kenya are better, but even Egypt and Morocco are more expensive.
•
•
•
•
04_Africa_Report09_Mauritius.ind82 8204_Africa_Report09_Mauritius.ind82 82 2/25/09 4:19:05 PM2/25/09 4:19:05 PM

Country Report for Mauritius
83
OU
TS
OU
RC
IN
G
TO
A
FR
IC
A8. ICT and BPO Industry Environment
A strong ICT and BPO industry has already been established in Mauritius. Many multina-tionals have relocated to the Cyber Tower Complex which provides world-class infrastructure and environment for ICT companies to operate in Mauritius. ICT companies are engaged mainly in the development of computer software or in any one or more of the following ICT related services: 3-D animation and multimedia content development, Business process outsourcing/back offi ce operations, call centres or contact centres, data digitalisation, data disaster recovery services and centres, electronic data processing, warehousing and manage-ment, engineering design services, online education and high-end ICT training, technical documentation, website development. Thus there is a strong ICT and BPO industry present ad is growing. The diagram below shows Mauritius’s position in the global ICT scenario.
2
31
MAURITIUS
ANGLOPHONE FRANCOPHONE
ENVISAGED SCENARIO-MAURITIUS IN THE ICT WORLD
Markets
Collaborators
Competitors
Markets
Collaborators
Competitors
NICTSP2007-2011
Exchange of human capital andinvestments for the ICT sector betweenMauritius and Francophone Africa
Exchange of human capital andinvestment for the ICT sector betweenMauritius and Anglophone Africa
Mauritius as a gateway for investmentsand business in ICT into Africa
1
2
3
UK, US, Ireland, Norway, Sweden, Denmark,Finland, Canada, African nations with ICT spending
Namibia, Zimbabwe, Zambia, Tanzania, Kenya,Nigeria, Sierra Leone
South Africa, India, China, Egypt, Botswana,Philippines, Malaysia, Thailand, East Europe
France, Belgium, Netherland, Luxemburg, Canada,Francophone African countries with high ICT spending
Madagascar, Mauritania, Ivory Coast, Mali, Chad, Algeria, Congo, Niger, Reunion, India,China
Morocco, Tunisia, Senegal, Romania, Vietnam
REGIONAL TALENT CAPITALREGIONAL INVESTMENT NUCLEUSREGIONAL EXPERTISE HUBGATEWAY TO AFRICA
Thus ICT and BPO industry is here to stay and grow in Mauritius.
Major international ICT players are Oracle, Microsoft, IBM, HP, CISCO, Accenture, Infosys, Hinduja Group, France Telecom, Teleforma, TNT Group.
Average annual growth of 25 per cent in the Mauritian ICT industry during the past fi ve years.
Investment growth increased from 21 per cent in September 2006 to 114 per cent in March 2007.
•
•
•
04_Africa_Report09_Mauritius.ind83 8304_Africa_Report09_Mauritius.ind83 83 2/25/09 4:19:05 PM2/25/09 4:19:05 PM
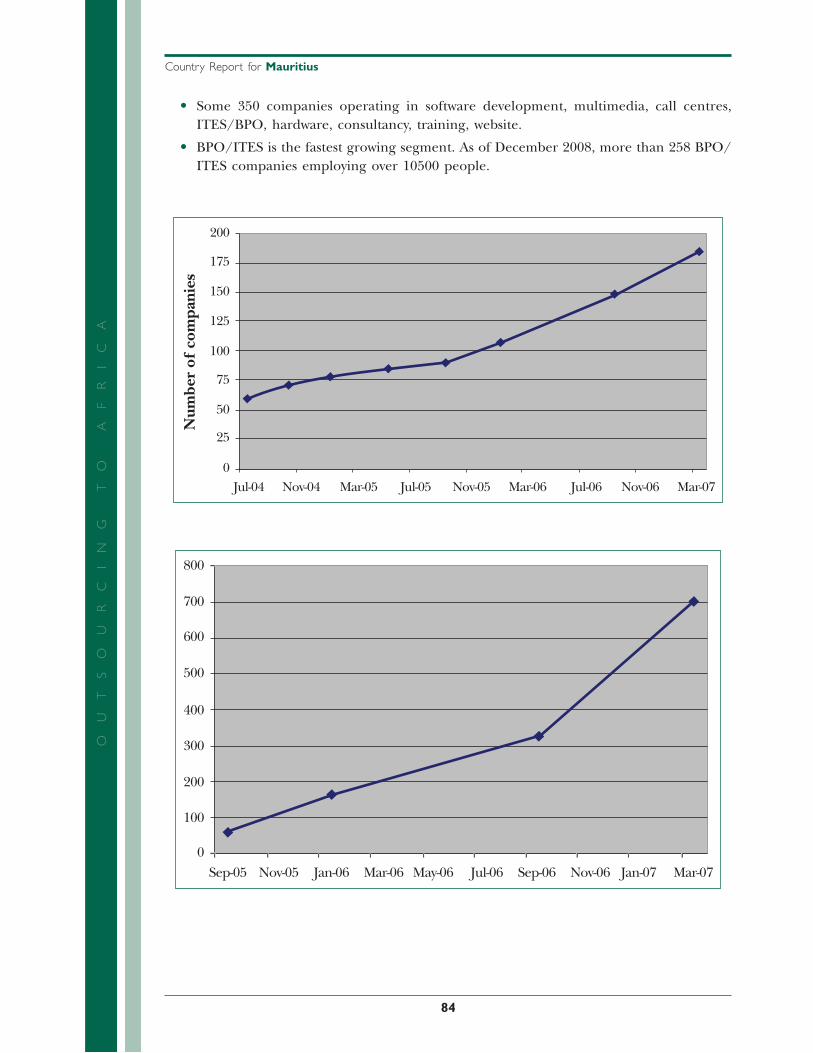
84
Country Report for Mauritius
OU
TS
OU
RC
IN
G
TO
A
FR
IC
ASome 350 companies operating in software development, multimedia, call centres, ITES/BPO, hardware, consultancy, training, website.
BPO/ITES is the fastest growing segment. As of December 2008, more than 258 BPO/ITES companies employing over 10500 people.
Num
ber
of c
ompa
nies
175
200
150
125
100
75
50
25
0Jul-04 Nov-04 Mar-05 Jul-05 Nov-05 Mar-06 Jul-06 Nov-06 Mar-07
800
700
600
500
400
300
200
100
0Sep-05 Nov-05 Jan-06 Mar-06 May-06 Jul-06 Sep-06 Nov-06 Jan-07 Mar-07
•
•
04_Africa_Report09_Mauritius.ind84 8404_Africa_Report09_Mauritius.ind84 84 2/25/09 4:19:06 PM2/25/09 4:19:06 PM

Country Report for Mauritius
85
OU
TS
OU
RC
IN
G
TO
A
FR
IC
A Num
ber
of e
mpl
oyee
s
8000
7000
6000
5000
4000
3000
2000
1000
0Jul-04 Nov-04 Mar-05 Jul-05 Nov-05 Mar-06 Jul-06 Nov-06 Mar-07
Favourable time zone (GMT+4 ).
Skilled and bilingual manpower (English/French).
State-of-the-art telecommunications (SAFE, liberalisation of telecoms, competitive tar-iffs, EASSy) and the upcoming SEACOM cable.
Quality infrastructure—ICT Parks (Cyber City, Informatics Park, ICT Incubator Centre).
Business friendly environment.
Appropriate legal framework (Electronic Transaction Act, Data Protection Act, Cyber-crime and Computer Misuse Act).
Strategic Hub for African-and French-speaking markets (Member of SADC, COMESA, IOR, IOC).
9. Human Resource Effi ciency and Cost
Mauritius is the fi fth in people and skills; its constraints have been more on quantity rather than quality. The human resources are of a high quality with excellent ICT exposure and work-satisfaction levels. All this is at a reasonable cost as the human resource rank is within the top fi ve. To support these fi ndings in the study it is relevant to present some ICT training and digital opportunity data received from the National Statistics Department of Mauritius.
•
•
•
•
•
•
•
04_Africa_Report09_Mauritius.ind85 8504_Africa_Report09_Mauritius.ind85 85 2/25/09 4:19:06 PM2/25/09 4:19:06 PM
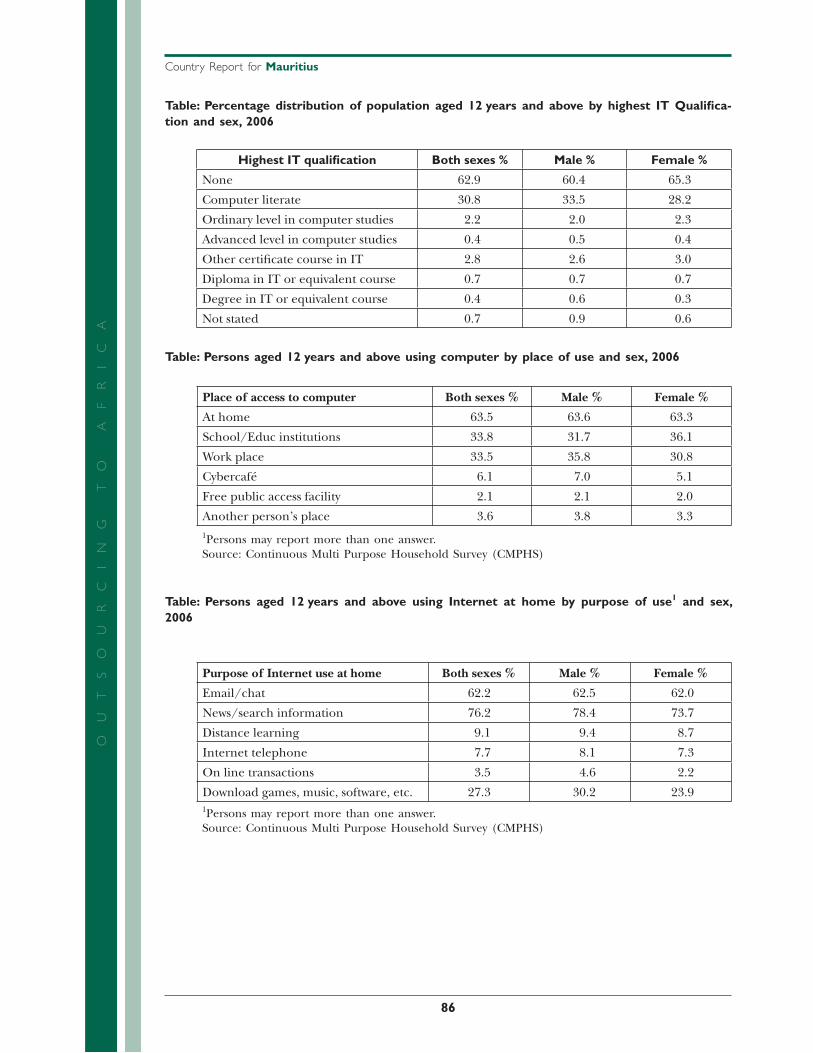
86
Country Report for Mauritius
OU
TS
OU
RC
IN
G
TO
A
FR
IC
ATable: Percentage distribution of population aged 12 years and above by highest IT Qualifi ca-tion and sex, 2006
Highest IT qualifi cation Both sexes % Male % Female %
None 62.9 60.4 65.3
Computer literate 30.8 33.5 28.2
Ordinary level in computer studies 2.2 2.0 2.3
Advanced level in computer studies 0.4 0.5 0.4
Other certifi cate course in IT 2.8 2.6 3.0
Diploma in IT or equivalent course 0.7 0.7 0.7
Degree in IT or equivalent course 0.4 0.6 0.3
Not stated 0.7 0.9 0.6
Table: Persons aged 12 years and above using computer by place of use and sex, 2006
Place of access to computer Both sexes % Male % Female %
At home 63.5 63.6 63.3
School/Educ institutions 33.8 31.7 36.1
Work place 33.5 35.8 30.8
Cybercafé 6.1 7.0 5.1
Free public access facility 2.1 2.1 2.0
Another person’s place 3.6 3.8 3.31Persons may report more than one answer.Source: Continuous Multi Purpose Household Survey (CMPHS)
Table: Persons aged 12 years and above using Internet at home by purpose of use1 and sex, 2006
Purpose of Internet use at home Both sexes % Male % Female %
Email/chat 62.2 62.5 62.0
News/search information 76.2 78.4 73.7
Distance learning 9.1 9.4 8.7
Internet telephone 7.7 8.1 7.3
On line transactions 3.5 4.6 2.2
Download games, music, software, etc. 27.3 30.2 23.91Persons may report more than one answer.Source: Continuous Multi Purpose Household Survey (CMPHS)
04_Africa_Report09_Mauritius.ind86 8604_Africa_Report09_Mauritius.ind86 86 2/25/09 4:19:07 PM2/25/09 4:19:07 PM

Country Report for Mauritius
87
OU
TS
OU
RC
IN
G
TO
A
FR
IC
ATable: ICT usage in education, 2005–2006
Educational level 2005 2006
1. Primary education
(i) Percentage of primary schools having Internet access for students
4.5 4.8
(ii) No. of students per computer in primary schools 185 163
2. Secondary education
(i) Percentage of secondary schools having Internet access for students for study purpose (%)
72.3 92.1
(ii) Students per computer in secondary schools (number) 24.8 23.9
(iii) Students examined in ICT at School Certifi cate level (number) 4,018 4,177
(iv) Percentage of students examined in ICT at School Certifi cate level (%)
26.0 25.0
(v) Number of students examined in ICT in Higher School Certifi cate level
658 822
(vi) Percentage of students examined in ICT at Higher School Certifi cate level (%)
9.0 10.2
3. Tertiary education1
(i) Number of students enrolled in ICT or an ICT-dominated fi eld at tertiary level
4,134 3,971
(ii) Percentage of students enrolled in ICT or an ICT-dominated fi eld at tertiary level (%)
14.3 12.0
1Includes also distance education and institutions abroad, and relates to school years 2005/2006 and 2006/2007Source: Annual Survey in Primary and Secondary Schools in March, Mauritius Examination Syndicate (MES) and Tertiary Education Commission (TEC)
Thus the people of Mauritius have adequate exposure and training in ICT and an overall assessment of all this is by the Digital opportunity index measured by the ITU.
Table: Digital Opportunity Index, 2003–2006
Category
Index
2003 2004 2005 2006
Opportunity 0.95 0.96 0.97 0.97
Infrastructure 0.33 0.34 0.38 0.38
Utilization 0.06 0.06 0.08 0.16
Digital Opportunity Index 0.45 0.46 0.48 0.50
04_Africa_Report09_Mauritius.ind87 8704_Africa_Report09_Mauritius.ind87 87 2/25/09 4:19:07 PM2/25/09 4:19:07 PM

88
Country Report for Mauritius
OU
TS
OU
RC
IN
G
TO
A
FR
IC
ATable: Comparison of Digital Opportunity Index (DOI) for Mauritius and selected countries, 2005
Index
rankOpportunity Infrastructure Utilization DOI
Korea Republic of 0.99 0.74 0.64 0.79 1
Sweden 0.99 0.74 0.35 0.69 6
United Kingdom 0.99 0.68 0.33 0.67 7
Australia 0.98 0.63 0.35 0.65 12
Singapore 1.00 0.68 0.27 0.64 16
Mauritius 0.97 0.38 0.08 0.48 50
Seychelles 0.97 0.32 0.10 0.46 54
South Africa 0.90 0.18 0.05 0.38 91
India 0.80 0.04 0.04 0.29 119
Source: International Telecommunication Union (ITU)
Thus Mauritius is in a very strong position as far as human resources are concerned; though the population density is about 600 per square kilometre, the highest in the countries stud-ied, they welcome large number of expatriate workers if such an action helps a project to succeed. This was a unique openness feature that was not found anywhere in Africa.
10. Legal and Enforcement Issues
The perception is that there is respect for the rule of law and the legislative risk is relatively low. However, though Mauritius did take early steps in Cyber Laws and electronic transac-tion acts, there appears to be greater effort needed here to take care of the more recent technology developments with their associated greater risks. Thus the low score for ICT security, Cyber Laws, etc.
11. Labour and Expatriate Worker’s Permits
Nationals of most OECD and a number of other countries do not need a visa and are given entry for six months on arrival; visas are issued to other nationals on application—they are free, but the process takes about one month. Mauritius does not recognise passports issued by the Taiwan government; holders of these passports must apply for an entry permit from the passport and immigration offi cer.
There is a special channel at the airport for business entrants who are involved in offshore activities.
Work permits are necessary for non-Mauritians to be employed; there is no maximum stay as such, but work permits are issued for a minimum period of six months and a maximum of three years. Permits are issued by the Prime Minister’s Offi ce in association with the Ministry of Human Resource Development and Reform Institutions.
04_Africa_Report09_Mauritius.ind88 8804_Africa_Report09_Mauritius.ind88 88 2/25/09 4:19:08 PM2/25/09 4:19:08 PM

Country Report for Mauritius
89
OU
TS
OU
RC
IN
G
TO
A
FR
IC
AForeigners who wish to acquire an immovable property in Mauritius must obtain approval prior to their purchase, which will otherwise be invalid. Such approval is obtained from the Prime Minister’s Offi ce.
Acquisition of property for business purposes in Mauritius by non-citizens is regulated by the Non-Citizens (Property Restriction) Act. Accordingly, a company with foreign shareholdings may be authorized to purchase an immovable property to be used exclusively for business purposes by the Board of Investment and therefore is exempt from the requirement to seek for a certifi cate from the Prime Minister’s Offi ce.
For more information on the acquisition of property for business purposes in Mauritius, please contact the Hospitality and Property Development team of the Board of Investment on [email protected]
It was announced in the government’s 2006 budget that investors whose businesses in Mauritius have an annual turnover of MR 15 million for three consecutive years will be able to apply for permanent residence.
An Occupation Permit, which is a combined work and residence permit with a validity of three years is obtained in three working days.
12. Revenue, Tax, and Repatriation Issues
The Mauritian currency is the rupee (MR). Exchange controls were dismantled in stages between 1984 and 1994. Currently (2008) USD 1 = about MR 33. From the tax and ease of fi nances point of view Mauritius is at third and fi rst position respectively, and there is also a low currency risk as the rupee is stable. All these conditions contribute to Mauritius being the best from the business environment point of view.
13. Investment Policy and Incentives
Till June 2006 the IT Enabled Industry ITES had a tax holiday. At present there are the following incentives:
15% corporate tax.
VAT at 15%, refundable.
Tax free dividends.
No capital gains tax.
100% foreign ownership.
Exemption from customs duty on equipment.
•
•
•
•
•
•
04_Africa_Report09_Mauritius.ind89 8904_Africa_Report09_Mauritius.ind89 89 2/25/09 4:19:08 PM2/25/09 4:19:08 PM

90
Country Report for Mauritius
OU
TS
OU
RC
IN
G
TO
A
FR
IC
AFree repatriation of profi ts, dividends, and capital.
No minimum foreign capital required.
Electricity tariffs for ICT sector operators is at industrial rates instead of commercial rates.
In comparison with other African countries studied, the incentives available in Mauritius are good. The NICTSP has recommended a set of strong measures to promote this industry; one has to watch the progress closely for some time before the fi nal picture emerges.
14. Agencies Giving Support to Outsourcing
The Board of Investment (contact details given in section 16) is the true single window agency that supports the Outsourcing and ITES industry. “The National Computer Board also supports the Mauritius ITES/BPO industry through its efforts to catalyse the absorption of technology by the population, businesses and the public sector.”
15. Recommendations
Mauritius is doing well and needs to keep up the momentum to maintain its position.
The steps recommended and the structures proposed in the National ICT Strategic plan need to be implemented as soon as possible to do better or even to maintain the present position.
16. Contact Details
Board of Investment
Mr Ken Poonoosamy, Director
Level 10, One Cathedral Square International Business Services Building
16, Jules Koenig Street
Port Louis
Tel: (+230) 203-3800
Website: http://www.investmauritius.com
National Computer Board
Information and Communications Technologies Authority
Dr Krishna Oolun, Executive Director
Level 12, The Celicourt, 6, Sir Celicourt Antelme Street
Port Louis
Tel: (+230) 211-5333
Website: (http://www.icta.mu)
•
•
•
•
•
04_Africa_Report09_Mauritius.ind90 9004_Africa_Report09_Mauritius.ind90 90 2/25/09 4:19:08 PM2/25/09 4:19:08 PM

Country Report for Mauritius
91
OU
TS
OU
RC
IN
G
TO
A
FR
IC
AMauritius Revenue Authority
Ehram Court, Cnr Mgr. Gonin & Sir Virgil Naz Streets Port Louis
Tel: 2; Fax: (+230) 211-8099; Hotline: +2
E-mail: HeadOffi [email protected];
Website: http://www.gov.mu/portal/sites/mra/contact.htm
Registrar of Companies
Companies Division, Les Bacha Building
Lisiet Geoffroy Street Port Louis, Mauritius
Tel: (+230) 208-4109/4134/2867
Offshore Section: (+230)211-2846/2881; Fax: (+230) 212-6493
E-mail: [email protected]
Ministry of Labour, Industrial Relations & Employment
Mrs V.L. Ramsamy, Permanent Secretary
6th Floor, Victoria House, Cnr Barracks & St Louis Street
Port Louis
Tel: (+230) 207-2600
Website: http://labour.gov.mu
Embassies, High Commissions in UK, USA, Germany, France, China, and India
High Commission of Mauritius in London
United Kingdom, London
32/33 Elvaston Place
London SW7 5NW
United Kingdom
Tel: (+020)(7)5810294/5; Fax: (+020)(7)8238437
E-mail: [email protected]
Embassy of Mauritius in Washington DC, United States
4301 Connecticut Avenue
NW, Suite 441
Washington DC 20008
City: Washington DC
Tel: (+202) 244-1491; Fax: (+202) 966-0983
E-mail: [email protected]
Permanent Mission of Mauritius to The United Nations in New YorkUnited States of America
211 East 43rd Street, 15th Floor
New York, NY 10017
Tel: (+212) 949-0190/0191; Fax: (+212) 697-3829, 953-1233
E-mail: [email protected]
04_Africa_Report09_Mauritius.ind91 9104_Africa_Report09_Mauritius.ind91 91 2/25/09 4:19:09 PM2/25/09 4:19:09 PM

92
Country Report for Mauritius
OU
TS
OU
RC
IN
G
TO
A
FR
IC
AEmbassy of Mauritius in Paris, France
127 Rue de Tocqueville 75017
Paris, France
Tel: (+01) 42-27-30-19; Fax: (+01) 40-53-02-91
E-mail: [email protected]
Embassy of Mauritius in Berlin, Germany
Burgraf Centre 84 Kurfurstenstrasse 10787 Berlin
Tel: 00-49 (30) 26-39-3610; Fax: 00-49 (30) 26-55-8323
E-mail: [email protected]
Embassy of Mauritius in New Delhi, India
5, Kautilya Marg Chanakyapuri
New Delhi 110021 India
Tel: (+91) 11-24102161 or (+91) 11-24102162
E-mail: [email protected]
Consulate of Mauritius in Mumbai, India
Mittal Tower C, Offi ce No. 115, 11th Floor
Nariman Point Mumbai 400021
Tel: (+91) 22-22845127, (+91) 22-22845466; Fax: (+91) 22-22845469, (+91) 22-22845468
E-mail: [email protected]
Embassy of Mauritius in Beijing, China
Dongzhi Men Wai Da Jie No 23
Beijing 100600, China
Tel: (+86) 10-6532 5695/96/98; Fax: (+86) 10-6532 5706/7102;
E-mail: [email protected]
Useful Link
The World Fact book 2007. https://www.cia.gov/cia/publications/factbook/geos/wa.html
Mauritius. Wikipedia.
http://en.wikipedia.org/wiki/Mauritius
The World Bank.
http://www.worldbank.org
Mauritius. UNICEF.
http://www.unicef.org/infobycountry/mauritius_statistics.html
04_Africa_Report09_Mauritius.ind92 9204_Africa_Report09_Mauritius.ind92 92 2/25/09 4:19:09 PM2/25/09 4:19:09 PM

Country Report for Mauritius
93
OU
TS
OU
RC
IN
G
TO
A
FR
IC
AGlobal Information Technology Report.
http://www2.weforum.org/site/homepublic.nsf/Content/Global+Competitiveness+Programme/Global+InforMation+Technology+Report.html
https://www.cia.gov/cia/publications/factbook/geos/wa.html
The Fifth Pillar: Republic of Mauritius ICT Case Study. 2004. ITU.
http://66.102.9.104/search?q=cache:ENZqiFZweqIJ:www.itu.int/ITUD/ict/cs/mauritius/material/CS_MUS.pdf+MAuritius+ict+schools&hl=en&ct=clnk&cd=14&gl=za
Mauritius. Wikipedia.
http://en.wikipedia.org/wiki/Mauritius
The National Information & Communication Technology Strategic Plan 2007–2011.
http://www.gov.mu/portal/sites/nictsp/main.jsp
National ICT Strategic Plan, Government of Mauritius and UNDP. 2006.
http://www.gov.mu/portal/sites/nictsp1/NICTSPReviewed3F.pdf
Ramharai, V. and K. Goodoory. ‘ICT in Primary Schools in MauritiusPolicy and Practice.’ ICOOL. 2003.
http://66.102.9.104/search?q=cache:rEBezf7DQkJ:icool.uom.ac.mu/2003/papers/fi le/Ramharai.pdf+mauritius+ict+schools&hl=en&ct=clnk&cd=2&gl=za
National ICT Strategic Plan, Government of Mauritius and UNDP. 2006.
http://www.gov.mu/portal/sites/nictsp1/N
04_Africa_Report09_Mauritius.ind93 9304_Africa_Report09_Mauritius.ind93 93 2/25/09 4:19:09 PM2/25/09 4:19:09 PM

04_Africa_Report09_Mauritius.ind94 9404_Africa_Report09_Mauritius.ind94 94 2/25/09 4:19:09 PM2/25/09 4:19:09 PM

95
OU
TS
OU
RC
IN
G
TO
A
FR
IC
A
Country Report for South Africa
Disclaimer
This short Country Report, a result of a larger Survey of ICT Outsourcing in Africa, provides a general over-view of the current activities and issues related to ICT Outsourcing in the country. The data presented here should be regarded as illustrative rather than exhaustive. ICT Outsourcing is at a particularly dynamic stage in Africa with new developments and announcements happening on a daily basis somewhere or the other on the continent. Therefore, these reports should be seen as ‘snapshots’ that were current at the time they were taken; it is expected that certain facts and fi gures presented may become outdated very quickly.
The fi ndings, interpretations, and conclusions expressed herein are a faithful representation of the respond-ents of the interviews and secondary data collected from the countries and published literature. Strict analysis has been carried out with the minimal infl uence of the authors/team members. References to data sources have been made as far as possible. In the case of the detailed data parameters used for scores and ranking, the same data source and timeline has been used for all the fi fteen countries compared. In the descriptive section of the country reports, all data received from the individual country has been used in order to give a complete assessment. Thus those countries that have provided more information have a better coverage than those who have not been able to provide data to the research team.
Board of Executive Directors of the CBC or Cyber Media cannot guarantee the accuracy of the data included in this work. The boundaries, colours, denominations, and other information shown on any map in this work do not imply on the part of the CBC and Cyber Media any judgementent of the legal status of any territory or the endorsement or acceptance of such boundaries.
It is expected that individual Country Report from the Survey of ICT Outsourcing in Africa will be updated in an iterative process over time based on additional research and feedback received through the CBC and Cyber Media website.
0 100 200 km
0 100 200 mi20 25
30
25
20 25 30
25
30
3535
PRETORIA
ZIMBABWE
NAMIBIA
BOTSWANA
Johannesburg
LadysmithRichards Bay
Upington Kimberly
Bloemfontein
De Aar
Prince Edward Islands not shown
NjesuthiDurban
INDIANOCEAN
SOUTHATLANTIC OCEAN
Cape ofGood Hope
SaldanhaCape Town
EastLondon Port
ElizabethMossel Bay
Messina
Swaz
LES.
MOZ.
Pietersburg
05_Africa_Report09_South Africa.95 9505_Africa_Report09_South Africa.95 95 2/25/09 4:20:54 PM2/25/09 4:20:54 PM
96
Country Report for South Africa
OU
TS
OU
RC
IN
G
TO
A
FR
IC
A1. Overview
The Republic of South Africa is located at the southern tip of the continent of Africa. The South African coast stretches 2,798 kilometres and borders both the Atlantic and Indian oceans. To the north of South Africa lie Namibia, Botswana, Zimbabwe, Mozambique, and Swaziland, while the Kingdom of Lesotho is an independent enclave surrounded by South African territory.
Modern human beings have inhabited South Africa for more than 100,000 years. A century and a half after the discovery of the Cape Sea Route, the Dutch East India Company founded a refreshment station at what would become Cape Town in 1652. Cape Town became a British colony in 1806. European settlement expanded during the 1820s as the Boers (origi-nal Dutch, Flemish, German, and French settlers) and the British 1820 settlers claimed land in the north and east of the country. Confl icts arose among the Xhosa, Zulu, and Afrikaner groups. However, the discovery of diamonds and later gold triggered the confl ict known as the Anglo-Boer War as the Boers and the British fought for the control of the South African mineral wealth. Although the Boers were defeated, limited independence was given to South Africa in 1910 as a British dominion. Anti-British policies focused on ultimate independ-ence which was achieved in 1961 when South Africa was declared a republic. The leading National Party legislated for a continuation of racial segregation begun under Dutch and British colonial rule, Boer republics, and subsequent South African governments (and which in 1948 became a legally institutionalized segregation known as apartheid), despite opposi-tion both in and outside of the country. In 1990, the then president FW de Klerk began to dismantle this legislation, and in 1994 the fi rst democratic election was held in South Africa. This election brought Nelson Mandela and the current ruling party, the African National Congress to power, and the country rejoined the Commonwealth of Nations.
05_Africa_Report09_South Africa.96 9605_Africa_Report09_South Africa.96 96 2/25/09 4:20:55 PM2/25/09 4:20:55 PM

Country Report for South Africa
97
OU
TS
OU
RC
IN
G
TO
A
FR
IC
A2. South Africa’s Position in Africa’s Fifteen Countries
South Africa is the third in the ready band of countries from the outsourcing attractiveness point of view. The map and table below show where South Africa is positioned.
Morocco *
Morocco
Tunisia *
Geographical Coverage and Rank
Tunisia
Egypt *
Egypt
Senegal *
Senegal
GhanaGhana
Nigeria
Nigeria
Uganda
Uganda
Kenya
KenyaTanzania
Tanzania
Zambia
Zambia
Mozambique MozambiqueBotswana
Botswana
Namibia
Namibia
SouthAfrica
South Africa
MauritiusAfrica
*Non-Commonwealth Countries
Mauritius
Contributing scores and ranks are as under.
Overall
Band Score (PS & BE) Rank in Band
Ready 6.98 Third
Infrastructure
Score Rank Band
7.2 Second Ready
While achieving the second position and this score for ‘Infrastructure’, South Africa is fi rst in electricity availability and telecommunications and data transfer costs, second in network readiness and infrastructure cost, fourth in availability and penetration, and fi fth in the roads and rail network. At the other end, it has better than the tenth position in all other scores.
05_Africa_Report09_South Africa.97 9705_Africa_Report09_South Africa.97 97 2/25/09 4:20:55 PM2/25/09 4:20:55 PM

98
Country Report for South Africa
OU
TS
OU
RC
IN
G
TO
A
FR
IC
APeople and Skills (PS)
Score Rank
3.491 Third
In the case of ‘People and Skills’, South Africa, coming third, has done well by being second in quantity, third in education, language, and domain skills, and fourth in working satisfac-tion and ICT exposure; it has scored fi fth in human resource costs. At the other end, it has fallen to eleventh position in quality.
Business Environment (BE)
Score Rank
3.486 Third
In this lower level abstraction, South Africa is third. In achieving this position it has come fi rst in ICT security, Cyber and IPR laws, and share of services in GDP. South Africa has the second highest foreign exchange reserves and second best position in ease and cost of fi nances. For share of ICT in exports and legislative risk, South Africa has come third. In the tax rate and share of services in exports, South Africa has come fi fth. At the other end, South Africa comes eleventh and fi fteenth respectively in geopolitical risk and currency risk.
3. Country, Political, and Economic Profi le
South Africa has a two-tiered economy—one rivalling other developed countries and the other with only the most basic infrastructure. It, therefore, is a productive and industrialized economy that exhibits many characteristics associated with developing countries, including a division of labour between formal and informal sectors, and uneven distribution of wealth and income. The formal sector, based on mining, manufacturing, services, and agriculture, is well developed.
South Africa’s government is committed to managing the country’s rich and varied natural resources in a responsible and sustainable manner. In addition, numerous South African non-governmental organisations have emerged as a potent force in the public policy debate on the environment.
Salient features are as follows:
Area: 1.2 million sq km (470,462 sq mi).
Cities: Capitals—administrative, Pretoria; legislative, Cape Town; judicial, Bloemfontein.
Other cities: Johannesburg, Durban, Port Elizabeth.
Terrain: Plateau, savannah, desert, mountains, coastal plains.
Climate: Moderate.
Nationality: South African(s).
05_Africa_Report09_South Africa.98 9805_Africa_Report09_South Africa.98 98 2/25/09 4:20:56 PM2/25/09 4:20:56 PM
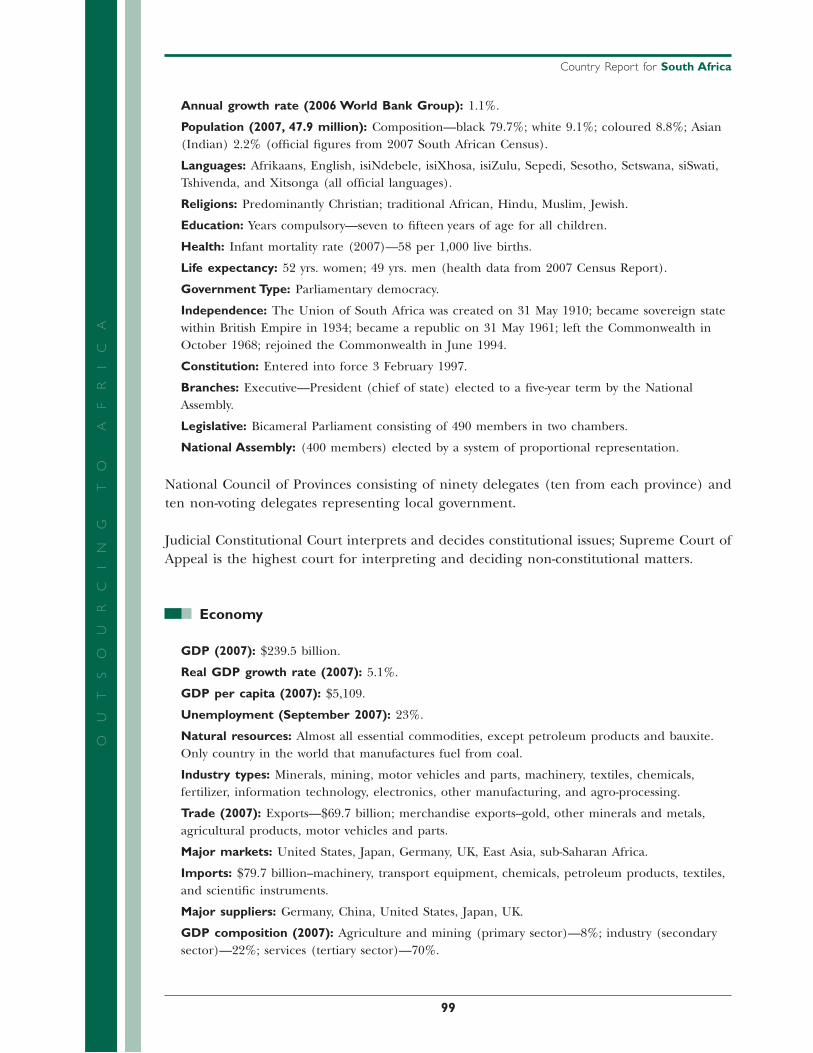
Country Report for South Africa
99
OU
TS
OU
RC
IN
G
TO
A
FR
IC
AAnnual growth rate (2006 World Bank Group): 1.1%.
Population (2007, 47.9 million): Composition—black 79.7%; white 9.1%; coloured 8.8%; Asian (Indian) 2.2% (offi cial fi gures from 2007 South African Census).
Languages: Afrikaans, English, isiNdebele, isiXhosa, isiZulu, Sepedi, Sesotho, Setswana, siSwati, Tshivenda, and Xitsonga (all offi cial languages).
Religions: Predominantly Christian; traditional African, Hindu, Muslim, Jewish.
Education: Years compulsory—seven to fi fteen years of age for all children.
Health: Infant mortality rate (2007)—58 per 1,000 live births.
Life expectancy: 52 yrs. women; 49 yrs. men (health data from 2007 Census Report).
Government Type: Parliamentary democracy.
Independence: The Union of South Africa was created on 31 May 1910; became sovereign state within British Empire in 1934; became a republic on 31 May 1961; left the Commonwealth in October 1968; rejoined the Commonwealth in June 1994.
Constitution: Entered into force 3 February 1997.
Branches: Executive—President (chief of state) elected to a fi ve-year term by the National Assembly.
Legislative: Bicameral Parliament consisting of 490 members in two chambers.
National Assembly: (400 members) elected by a system of proportional representation.
National Council of Provinces consisting of ninety delegates (ten from each province) and ten non-voting delegates representing local government.
Judicial Constitutional Court interprets and decides constitutional issues; Supreme Court of Appeal is the highest court for interpreting and deciding non-constitutional matters.
Economy
GDP (2007): $239.5 billion.
Real GDP growth rate (2007): 5.1%.
GDP per capita (2007): $5,109.
Unemployment (September 2007): 23%.
Natural resources: Almost all essential commodities, except petroleum products and bauxite. Only country in the world that manufactures fuel from coal.
Industry types: Minerals, mining, motor vehicles and parts, machinery, textiles, chemicals, fertilizer, information technology, electronics, other manufacturing, and agro-processing.
Trade (2007): Exports—$69.7 billion; merchandise exports--gold, other minerals and metals, agricultural products, motor vehicles and parts.
Major markets: United States, Japan, Germany, UK, East Asia, sub-Saharan Africa.
Imports: $79.7 billion--machinery, transport equipment, chemicals, petroleum products, textiles, and scientifi c instruments.
Major suppliers: Germany, China, United States, Japan, UK.
GDP composition (2007): Agriculture and mining (primary sector)—8%; industry (secondary sector)—22%; services (tertiary sector)—70%.
05_Africa_Report09_South Africa.99 9905_Africa_Report09_South Africa.99 99 2/25/09 4:20:56 PM2/25/09 4:20:56 PM

100
Country Report for South Africa
OU
TS
OU
RC
IN
G
TO
A
FR
IC
AWorld’s largest producer of platinum, gold, and chromium; also signifi cant coal production.
Government and Political Condition
South Africa is a multi-party parliamentary democracy in which constitutional power is shared between the president and the parliament.
The Parliament consists of two houses, the National Assembly and the National Council of Provinces, which are responsible for drafting the laws of the republic. The National Assembly also has specifi c control over bills relating to monetary matters. The Assembly is elected by a system of ‘list proportional representation’. Each of the parties appearing on the bal-lot submits a rank-ordered list of candidates. The National Council of Provinces (NCOP) consists of ninety members, ten from each of the nine provinces. The NCOP replaced the former Senate as the second chamber of parliament and was created to give a greater voice to provincial interests. It must approve legislation that involves shared national and provin-cial competencies as defi ned by an annex to the constitution. Each provincial delegation consists of six permanent and four rotating delegates.
The president is the head of state and is elected by the National Assembly from among its members. The president’s constitutional responsibilities include assigning cabinet portfolios, signing bills into law, and serving as commander-in-chief of the military. The president works closely with the deputy president and the cabinet. The third arm of the central government is an independent judiciary. The Constitutional Court is the highest court for interpreting and deciding constitutional issues, while the Supreme Court of Appeal is the highest court for non constitutional matters.
The government is transitional at present due to President Mbeki’s resignation and the major ruling party since independence the ANC having split. Stability is expected after the next elections in April 2009. It has been observed that major ICT-related decisions are on hold, and there is a slight pause in the enthusiasm with which the outsourcing and BPO industry was being promoted.
4. Principal Government Offi cials
In the interim period till the elections in April 2009, the principal government offi cials are as follows:
State President: Kgalema Petrus Motlanthe.
Executive Deputy President: Baleka Mbete.
05_Africa_Report09_South Africa.100 10005_Africa_Report09_South Africa.100 100 2/25/09 4:20:56 PM2/25/09 4:20:56 PM
Country Report for South Africa
101
OU
TS
OU
RC
IN
G
TO
A
FR
IC
AMinisters
Communications: Ivy Matsepe-Casaburri.
Trade and Industry: Mandisi Mpahlwa.
Finance: Trevor Manuel.
Foreign Affairs: Nkosazana Dlamini-Zuma.
Science and Technology: Mosibudi Mangena.
Sport and Recreation: Makhenkesi Stofi le.
The Presidency: Manto Tshabalala-Msimang.
5. Foreign Relations
South Africa was a founding member of the League of Nations and in 1927 established a Department of External Affairs with diplomatic missions in the main west European coun-tries and in the United States. After South Africa held its fi rst non-racial election in April 1994, most sanctions imposed by the international community in opposition to the system of apartheid were lifted. On 1 June 1994, South Africa rejoined the Commonwealth, and on 23 June 1994, the UN General Assembly accepted its credentials. South Africa served as the African Union’s (AU) fi rst president from July 2003 to July 2004.
Having emerged from the international isolation of the apartheid era, South Africa has become a leading international actor. Its principal foreign policy objective is to promote the economic, political, and cultural regeneration of Africa, through the New Partnership for African Development (NEPAD); to promote the peaceful resolution of confl ict in Africa; and to use multilateral bodies to insure that developing countries’ voices are heard on inter-national issues. South Africa has played a key role in seeking an end to various confl icts and political crises on the African continent, including those in Burundi, the Democratic Republic of the Congo, and Comoros. South Africa has pursued “quiet diplomacy” in its approach to the crisis in Zimbabwe.
On the scientifi c and technological scene, South Africa has collaborations with most coun-tries in Europe, USA, and Asia and is a science and technology leader in Africa.
6. Living, Security, and Safety Perceptions
Living conditions in South Africa are varied; there are safe and comfortable areas and areas not so safe. Wherever one stays extreme caution is necessary in order to be safe. There are suburbs that cause no concern and other areas that must be avoided. The following pointers give an indication of the situation and hints on how to remain safe.
Travellers are encouraged to be vigilant and avoid any large gathering, particularly protests and demonstrations.
South Africa has seen a number of attacks directed at foreigners—particularly refugees or immigrants from other African nations. Many of the attacks were centred in Johannesburg and the province of Gauteng in low income neighbourhoods and
•
•
05_Africa_Report09_South Africa.101 10105_Africa_Report09_South Africa.101 101 2/25/09 4:20:56 PM2/25/09 4:20:56 PM

102
Country Report for South Africa
OU
TS
OU
RC
IN
G
TO
A
FR
IC
Ainformal settlements, but incidents of mob violence have taken place throughout the country. Many individuals have been killed in these incidents, and many more, both targeted victims and bystanders, have been injured.
Visitors and residents are advised of ongoing criminal activity involving organized crime gangs targeting individuals at shopping centres and other public places.
Once a victim has been identifi ed, he/she is followed back to his/her residence and robbed, usually at gunpoint, although the use of force is generally reserved for those offering some form of resistance.
These gangs tend to target people appearing to be affl uent, including those driving expensive cars, wearing eye-catching jewellery, fl ashing large amounts of cash, and/or making high-value purchases.
Private medical facilities are good in urban areas and in the vicinity of game parks, but they may be limited elsewhere.
Medical facilities are of a high standard but are expensive, and it is advisable to have valid international medical insurance with facilities for evacuation from remote and diffi cult areas.
While most of South Africa is malaria-free, malaria risk exists throughout the year in rural low-altitude areas of Limpopo and Mpumalanga provinces, including Kruger National Park and neighbouring game reserves.
Since November 2008, cholera outbreaks have been reported across Zimbabwe and have affected South Africa’s Limpopo province near the Zimbabwe border. Cholera is a potentially fatal bacterial infection of the intestine which causes severe diarrhoea and dehydration. The disease is spread through untreated sewage and contaminated drinking water.
Approximately, one-quarter of the population of South Africa is infected with HIV, the virus that causes AIDS.
Public awareness in the country as to how to protect against infection is increasing. However, travellers are advised to exercise appropriate precautions if they become exposed to a blood source other than that supplied by a hospital for transfusion purposes. With a reasonable amount of caution, discrete, friendly and respectful behaviour with all communities, South Africa can be a wonderful place to live in, but in any case carefully planned precautions need to be taken to avoid pick pocketing, mugging, car hi jacking, armed robbery, house break-ins or shoot-outs.
7. ICT Policy, Infrastructure, and Service
Although South Africa does not have an integrated National ICT Policy, discrete policies and legislation have been in place and are effi ciently implemented to ICT Projects resulting in a fi rm, effi cient, and cost effective ICT infrastructure to be in place in most activity areas. According to the World Economic Forum (WEF) Global Information Technology Report, South Africa has one of the most modern and developed telephone systems in Africa and a vibrant ICT sector with an annual investment of USD$ 9.6 billion. In terms of the network readiness index, it is only next to Tunisia in the African continent. According to government
•
•
•
•
•
•
•
•
05_Africa_Report09_South Africa.102 10205_Africa_Report09_South Africa.102 102 2/25/09 4:20:57 PM2/25/09 4:20:57 PM
Country Report for South Africa
103
OU
TS
OU
RC
IN
G
TO
A
FR
IC
Afi gures this is an end-to-end domestic fi bre optic network with an up time of 99.99 per cent, but the does this network cover all the remote developing corners of South Africa? These are an international bandwidth of 120 GBPs available to the United States.
Various provincial governments and municipalities in South Africa have invested signifi cantly in infrastructure development and will continue to do so over the next few years in the build-up to 2010 when South Africa hosts the World Cup soccer event. For example, the Gauteng provincial government is currently involved in a R50 billion (USD$ 7 billion) plan for infra-structure development in Gauteng. The plans include road and rail development as well as local government service delivery improvement. They will target underdeveloped zones with second-economy characteristics for expansion and provision of ICT infrastructure.
Discrete ICT Policies including the current ICT in education policy framework has been evolving since 1996 and is embedded within a broader national government economic, social, and development strategy which includes the following:
Attention at the highest level in government to the role of ICTs in the promotion of economic growth, job creation, social development, and global competitiveness.
Linkages of South Africa’s strategy to a broader pan-African mandate as expressed in the commitment to the New Partnership for Africa’s Development (NEPAD) pro-gramme and its dedicated project promoting e-schooling.
Overhaul in the education and skills development system at all levels.
A dedicated policy on the transformation of learning and teaching through the use of ICTs, particularly in the formal schools and FET college sectors.
National Government Strategy.
The role of ICTs in the South African government strategy for national economic growth, social development, and job creation has received increasing prominence over time. In 1996, Mr. Thabo Mbeki, then the deputy president of the country, played a prominent role in the historic Information Society and Development (ISAD) conference which gave rise to the African Information Society Initiative (AISI) spearheaded later by the United Nations Economic Commission for Africa (UNECA). Since then, a host of programs and strategies have been introduced that demonstrate central government commitment to the promotion of South Africa as an ‘information society’. These include the following:
Established the Presidential National Commission on Information Society and Devel-opment (PNC on ISAD) which consists of representatives from the public and private sectors. This commission advises government on the optimal use of ICTs to address South Africa’s development challenges and enhance the country’s global economic competitiveness in 2001, by President Mbeki (http://www.pnc.gov.za).
A Presidential International Advisory Council on Information Society and Development (PIAC on ISAD) was established to advise government on addressing the digital divide with education as a key focus area. This council consists of CEOs of major international corporations and experts active in the ICT sector.
•
•
•
•
•
•
•
05_Africa_Report09_South Africa.103 10305_Africa_Report09_South Africa.103 103 2/25/09 4:20:57 PM2/25/09 4:20:57 PM
104
Country Report for South Africa
OU
TS
OU
RC
IN
G
TO
A
FR
IC
AThe South African government has been prominent in its support as host country to the Secretariat of the New Partnership for Africa’s Development (NEPAD) programme of the African Union, particularly its e-Schools programme and as home to its fi rst pan-African Parliament. (http://www.nepad.org)
In 2005, the government launched its Accelerated and Shared Growth Initiative for South Africa (ASGISA), which represents a concerted national effort to accelerate skills development and economic growth. Two priority components of ASGISA are electronic communications as a cornerstone to commercial and social infrastructure development and education and skills development. The former includes, among other elements:
Implementation of a strategy to rapidly grow South Africa’s broadband network.
Implementation of a plan to reduce telephony costs more rapidly Completion of a submarine cable project that will provide competitive and reliable international access, especially to Africa and Asia (http://www.info.gov.za/asgisa).
In 1999, the South African government established the State Information Technology Agency (SITA), which serves as a public sector ICT company focused on the effective and effi cient provision of ICT services with government at national, provincial, and local levels. Its range of services includes the setting of technology standards for the use of refurbished PCs in public education institutions. (http://www.sita.co.za).
In February 2007, a National Information Society and Development (ISAD) Plan work as a framework for building an inclusive Information Society in South Africa was adopted by the Cabinet. Within this Plan, the vision for the country is expressed as follows:
‘To establish South Africa as an advanced information society in which ICT tools and information are key drivers.’
The Cabinet also approved the establishment of a Ministerial ISAD Committee and its corresponding Forum of South African Directors-General (FOSAD) ISAD Cluster. The ISAD, IGRF, and the Ministerial ISAD Committee were approved as the National Institutional Mechanisms for building an inclusive Information Society in South Africa16.
For strategies to achieve universal access, the Department of Communications (DOC) leads all ICT initiatives in South Africa through its Electronic Communications and Transactions Act (ECA) of 2002, which is an extension of its Telecommunications Act of 1996 and 2001 and which promotes the establishment of a Universal Service Agency (now referred to as the Universal Service and Access Agency of Southern Africa (USAASA)), a Universal Service Fund, an Education Network (Edu-Net), and an ‘e-rate’, all of which serve at least conceptually to support access to and use of ICTs in education institutions. The Education Network is to be an entity that would network all public schools and education and training institutions. The e-rate allows discounted access to Internet services to education institutions in South Africa. Section 73 of the ECA states that Internet services provided to all public schools and all public further education and training institutions must be provided at a minimum discounted rate of 50 per cent of the total charge levied by the licensee. The discount includes, but is not limited to, any connectivity charges for access to the Internet, charges for any equipment used for or in association with connectivity to the Internet, and charges for all calls made to an ISP.
•
•
•
•
•
•
•
•
•
05_Africa_Report09_South Africa.104 10405_Africa_Report09_South Africa.104 104 2/25/09 4:20:57 PM2/25/09 4:20:57 PM

Country Report for South Africa
105
OU
TS
OU
RC
IN
G
TO
A
FR
IC
AConstruction of the Eastern Africa Submarine Cable System (EASSy), a 9900 km-long optical submarine cable between Durban and Port Sudan, is expected to reduce prices for international connectivity.
Wider access to broadband, ADSL, and 3G accesses have boosted Internet connectivity; however, bandwidth remains relatively limited and expensive in South Africa, hamper-ing the rate of economic growth. The Dti, the single point facilitator for the outsourc-ing industry is attempting to get special rates for BPO Industry; however, the challenges they are facing are the guidelines of the competition commission. In this case Botswana has gone ahead by having special provisions for The Botswana Innovation Hub and the International fi nancial Services centre.
There are concrete government initiatives that are supporting ICT and related infrastructure:
Overall government plans for infrastructure spending totals some R416bn or (US$ 59,4 bn) over the next three years.
Further allocations are envisaged going forward.
Such investment levels have not been seen since 1994.
50% To be spent by the three spheres of Government.
5% To be spent through public private partnerships.
3% To be spent by development fi nance institutions.
40% To be spent by State-owned Enterprises.
Thus, South Africa has a strong ICT Infrastructure necessary to support an attractive outsourc-ing destination. Effi cient services levels and reasonable cost of these services have resulted in South Africa scoring so well in infrastructure, penetration, and cost. The caution is that the electricity situation is deteriorating and may pull South Africa down.
Physical Infrastructure
Offi ce market: The offi ce market in Johannesburg has continued to improve, being fi red by the growth of the insurance and fi nance sectors. Vacancy levels have continued to fall and the central Johannesburg offi ce market has improved, being supported by a growing number of new projects. Rental levels are substantially higher in the decentralised area of Sandton than in Johannesburg’s CBD. Institutional investment in the sector is increasing particularly as a result of Johannesburg’s Urban Development Zone (UDZ) status.
Retail market: The strength of the retail markets in Johannesburg, Cape Town, and Durban has seen vacancy rates continuing to fall and investment yields starting to harden. Retail developers have continued to seek additional opportunities in areas, for example, along the Garden Route, where demand is projected to grow. Prospects for the retail market look healthy, with consumer confi dence reaching a record high in the fi rst quarter of 2007, aided by a climate of low infl ation and stable interest rates.
•
•
•
•
•
•
05_Africa_Report09_South Africa.105 10505_Africa_Report09_South Africa.105 105 2/25/09 4:20:57 PM2/25/09 4:20:57 PM

106
Country Report for South Africa
OU
TS
OU
RC
IN
G
TO
A
FR
IC
AIndustrial market: Industrial vacancies have continued to fall and, as a consequence, rents have been rising and opportunities for developers have arisen. The strength of the retail sector has driven demand for warehouse and distribution space, with occupi-ers requiring ever-larger facilities.
Residential market: The Johannesburg and Cape Town markets have seen increasing demand from both owner-occupiers and investors, and as a result prices have been rising. This trend is expected to continue particularly in areas where zoned land is in short supply. Non-resident purchasers have presented a marketing opportunity for a growing number of developers who are seeking to tap into the global demand for second and third homes.
Johannesburg
Prime rents Prime yields
Offi ces US$ 16 per sq m per month 7.5%
Retail US$ 40 per sq m per month 8.5%
Industrial US$ 5 per sq m per month 9.5%
Residential US$ 4,500 per month* 5%
*Four bed room executive house--prime location
Cape Town
Prime rents Prime yields
Offi ces US$ 16 per sq m per month 8%
Retail US$ 50 per sq m per month 8.5%
Industrial US$ 6 per sq m per month 9.5%
Residential US$ 4,200 per month* 5.25%
On an overall basis these costs are reasonable—eighth in the fi fteen countries studied.
•
•
•
•
05_Africa_Report09_South Africa.106 10605_Africa_Report09_South Africa.106 106 2/25/09 4:20:58 PM2/25/09 4:20:58 PM

Country Report for South Africa
107
OU
TS
OU
RC
IN
G
TO
A
FR
IC
A8. ICT and BPO Industry Environment
A snapshot is shown here.
ZIMBABWE
BOTSWANA
NAMIBIA
SOUTH AFRICA-PROVINCES
LIMPOPO
MPUMALANGA
KWAZULU NATAL
FREE STATE
Interesting Facts
South Africa is 6 hours closer to the USA thanis the Philippenes.
South Africa has roughly 80,000 call centreseats.
English is the language of business andeducation. There are ~9 million citizens thatspeak English as their first language.
NORTH WEST
NORTHERN CAPE
ATLANTIC OCEAN
WESTERN CAPE
EASTERN CAPEINDIAN OCEAN
LESOTHO
UpingtonKimberley
Bloemfontein
Umtata
East London
Port ElizabethMossel Bay
Cape Town
Durban
Pietermaritzburg
Klerksdorp
Matikeng JohannesburgUpington
Pretonia
Polokwane
Nelspruit
There is an impressive array of success stories.
A solidfoundation
The ‘Triple Play’customer servicefunctionality makesMerchants one of themost advancedcontact centreoperations in South
South Africa Has an Impressively Developing BPOSector
Brightview wasrated five stars incustomer serviceby “Which”Magazine in 2006
Customersatisfactionresults are in linewith the UKcentres: Virgin
Sources: BPeSA and regions, Network Times, May 2007 issue, Which Magazine, Virgin Mobile Case study, http://www.callcenters.net
05_Africa_Report09_South Africa.107 10705_Africa_Report09_South Africa.107 107 2/25/09 4:20:58 PM2/25/09 4:20:58 PM

108
Country Report for South Africa
OU
TS
OU
RC
IN
G
TO
A
FR
IC
A
Leadership andCustomer Satisfaction Management
StructuralDistinctiveness
IT ManagementPerformance
South Africa Has a Comprehensive BPO-specificQuality Assurance Framework
South Africa’s Contact Centre industry, under theauspices of the industry body (BPeSA), spentalmost a year designing new and comprehensivequality standards, holistically covering allmanagement areas in a business.
The Standards are going through the offcialprocess to become national Standards, with theSouth African Bureau of Standard (SABS). TheStandards are currently referred to as ARP 099(Recommended Practices) and cover:
Generally accepted ISO standards such as ISO 9001:2 are already widelyadopted in South Africa, together with well-known methodologies andapproaches such as the Capability Maturity Model (Carnegie Mellon) andSix Sigma
Source: Standards South Africa (SABS) and SSP Quality Assurance Team
Inbound contact centresOutbound contact centresBack-office operations
•••
HR Management
OperationManagement
100 %90 82
Customersatisfaction
First call resolution Average speed toanswer (20 seconds)
82 81 8174 76
80
70
60
50
40
30
20
10
0
Global Benchmark South Africa
StructuralDistinctiveness
South Africa competes at global quality service benchmark levels
“We are attracted by thequality of the workforce,the infrastructure andprofessionalism of theservice providers that wework with on a day to daybasis.”Johann Kunz,Managing Director:Fusion OutsourcingSouth Africa.
Source: Merchants Global Benchmark Report 2007
South Africa Is Commited to Quality in the BPOSector
05_Africa_Report09_South Africa.108 10805_Africa_Report09_South Africa.108 108 2/25/09 4:20:58 PM2/25/09 4:20:58 PM

Country Report for South Africa
109
OU
TS
OU
RC
IN
G
TO
A
FR
IC
A
Johannesburg(Gauteng)
Port Elizabeth (Eastern Cape)Cape Town(Western Cape)
Total = 1312
Limpopo, 2
EasternCape, 37
KwaZuluNatal, 90
FreeState, 7
Durban (Kwa-Zulu Natal)
Gauteng,882
A solidfoundation
Source: Contact Industry Hub 2007
....With over 1200 Contact Centres in Four KeyBPO Locations
Specifi c areas of strength of the South African BOP sector is shown here.
South Africa Has Distinct Strengths in Several Industry and Service Lines
Sophisticated bankingenvironmentWell-regulatedfinancial servicesenvironment e.g., FSA(UK) & FSB (SA) linksCompliance toInternationalregulations eg., BaselII, Data Privacy Act
•
•
•
Large scalabletelecom infrastructureMany experiencedplayersFlexible operations(call-centre virtualmodel)Good technical know-how and capability
•
•
•
•
Many large,experienced playerswith scalableinfrastructureProduct sophistication;similar life product to the UKMature industry; firstworld insurance operations
•
•
•
Banking Insurance Telecoms
Strong customer serviceculture in SASouth Africans arePerceived abroad ashelpful and personallywarmAccent neutral, leadingto high conversionrates
•
•
•
Customer contactUnderstanding of creditdue to strong creditcultureSuccessful track recordSuitable infrastructurewith appropriatetechnological platforms
•
••
Payment servicesCapable of delivery to SLAs within a shortperiod of timeScalable infrastructure
•
•
High-end offshoring
Source: Team analysis
The combination of SA’s strengths make itand ideal location to conduct a high-endfinancial services BPO operation
•
•
•
•
•
Mature industries ininsurance, banking, andtelecomsWidespread use of English,with similar accents andusage to UK and USCultural similarities to theUS and UKStrong product similaritiesin banking and insuranceCompliance withinternational regulations
Industries
Service lines
05_Africa_Report09_South Africa.109 10905_Africa_Report09_South Africa.109 109 2/25/09 4:20:59 PM2/25/09 4:20:59 PM

110
Country Report for South Africa
OU
TS
OU
RC
IN
G
TO
A
FR
IC
AIn Summary... Offshoring to South Africa Will Boost a Buyer’sCustomer Service and Improve Its Operations
SA’s potential advantages for buyers
Higher quality of call centre talentProduct and cultural affinity to UKAccent neutral speaking styles
•••
Time zone compatibility with UK/Western EuropeMuch easier to fly than to India/Philippines
•
•
Fairly balanced demand supply atagent levelDay shift operations at most callcentresLimited other avenues for jobs
•
•
•
Higher quality of call centre talentNatural ability to interact in EnglishPleasant demeanourProduct and cultural affinity to US
••••
Source: Team analysis
Fasteracquisition ofcustomers
Better retentionof customers
Lower attrition oftalent
Clearer line ofsight
South Africaoffers buyers amuch more highquality, long-term sustainablecall centreoffshoringopportunity forcomplex contactcentre services
IT outsourcing is a growing business in South Africa, making up more than a third of the R30-billion IT services market, according to a study in 2008 by research and advisory fi rm IDC, taking up the largest share of all IT service categories.
Gartner, the international research group, rates South Africa as one of its top thirty software development outsourcing destinations, with 2007 research putting it on par with Israel in the Europe, Middle East, and Africa region, and next to Australia and India globally.
9. Human Resource Effi ciency and Cost
South Africa can provide effective and effi cient human resources required for an outsourc-ing destination. The next fi ve diagrams show what is in place, including a collaborative training scheme. In spite of this in-house capability, specialist expatriate workers are not unwelcome. The government facilitates their induction once their need is established and sets up a favourable environment. Perhaps this stand has been taken as there is a signifi cant migration of skilled human resources out of South Africa.
•
•
05_Africa_Report09_South Africa.110 11005_Africa_Report09_South Africa.110 110 2/25/09 4:21:01 PM2/25/09 4:21:01 PM
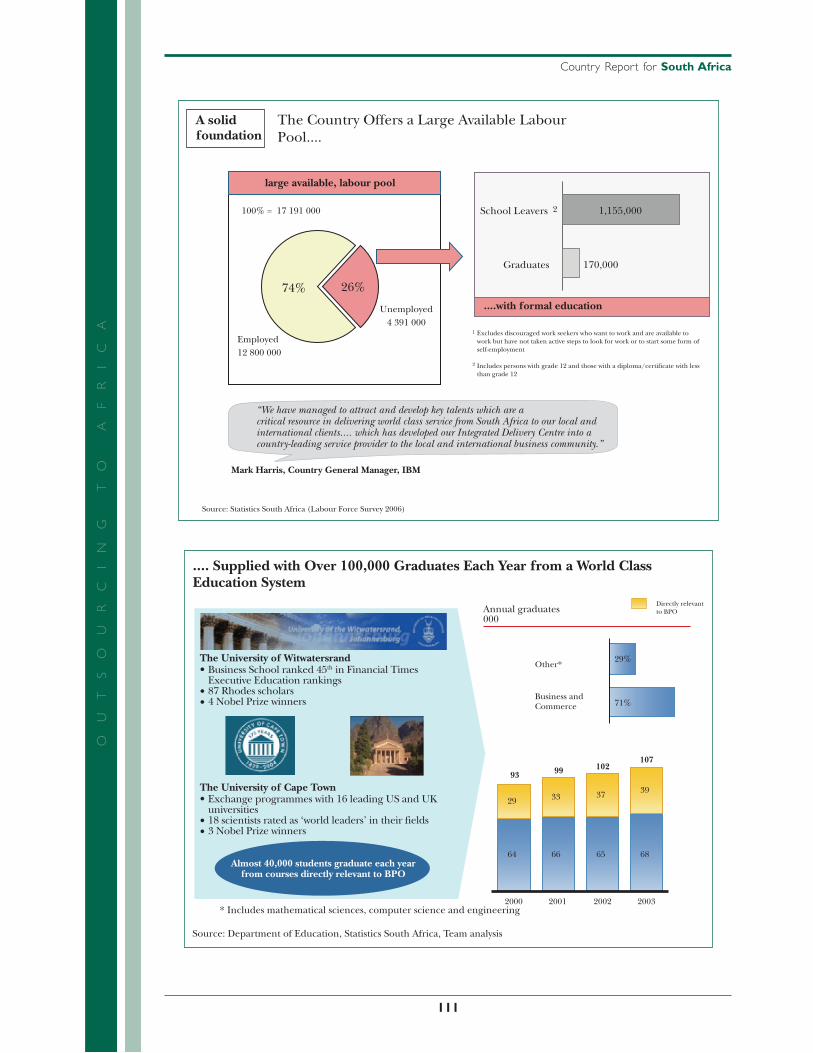
Country Report for South Africa
111
OU
TS
OU
RC
IN
G
TO
A
FR
IC
A
100% = 17 191 000
Excludes discouraged work seekers who want to work and are available towork but have not taken active steps to look for work or to start some form ofself-employment
Includes persons with grade 12 and those with a diploma/certificate with lessthan grade 12
“We have managed to attract and develop key talents which are acritical resource in delivering world class service from South Africa to our local andinternational clients.... which has developed our Integrated Delivery Centre into acountry-leading service provider to the local and international business community.”
1
2
Employed12 800 000
Unemployed4 391 000
74% 26%
2School Leavers
The Country Offers a Large Available LabourPool....
A solidfoundation
Graduates
....with formal education
large available, labour pool
170,000
1,155,000
Source: Statistics South Africa (Labour Force Survey 2006)
Mark Harris, Country General Manager, IBM
Other*
Directly relevantto BPOAnnual graduates
000
The University of Witwatersrand
The University of Cape Town
.... Supplied with Over 100,000 Graduates Each Year from a World ClassEducation System
29%
332937 39
6664 65 68
20012000 2002 2003
71%
93 99 102107
Business andCommerce
Business School ranked 45th in Financial TimesExecutive Education rankings87 Rhodes scholars4 Nobel Prize winners
•
••
Exchange programmes with 16 leading US and UKuniversities18 scientists rated as ‘world leaders’ in their fields3 Nobel Prize winners
•
••
Almost 40,000 students graduate each yearfrom courses directly relevant to BPO
* Includes mathematical sciences, computer science and engineering
Source: Department of Education, Statistics South Africa, Team analysis
05_Africa_Report09_South Africa.111 11105_Africa_Report09_South Africa.111 111 2/25/09 4:21:02 PM2/25/09 4:21:02 PM

112
Country Report for South Africa
OU
TS
OU
RC
IN
G
TO
A
FR
IC
A
Employer
Recruiter Trainer
Learner
Training Programs Are Being Put in Place to Ensure School LeaversAre Suitably Qualified...
Government and industry’s talent developmentprogramme, aimed at training 30 000 learners, is beingdeveloped
Talent development programme
Objective
Targets
Increase the pool of entry-level employablepeople by using a targeted customisedskills training programme aimed at 30 000young, unemployed South African’sAccelerate the development of homegrownsupervisors and managersEnsure the ongoing capacity building of aglobally competitive talent pool with therequired skills at all levels of employment
•
•
•
Train 1,000 entry level learners in 2007Train an additional 29,000 learners for theperiod 2007–2010.
An innovative government funded,employer led, learner focused,recruiter and trainer supportedtraining programme hasbeen developed
••
Source: Team analysis
MONYETLA (Work Readiness Programme) Success Rate
In the fi rst rollout (before the extra VAT money and miscellaneous re-allocations):
963 learners started in the fi rst rollout.
85 are still completing the process.
878 have completed.
753 of 878 have been successful and have completed the programme competently (85.8%).
679 of the 753 successful learners have been employed (90.2%).
679 of the total of the 878 learners who began, were successful and are employed (77.3%).
202 supervisors have been trained (against a required 146, so the target is exceeded by 38%).
•
•
•
•
•
•
•
05_Africa_Report09_South Africa.112 11205_Africa_Report09_South Africa.112 112 2/25/09 4:21:02 PM2/25/09 4:21:02 PM
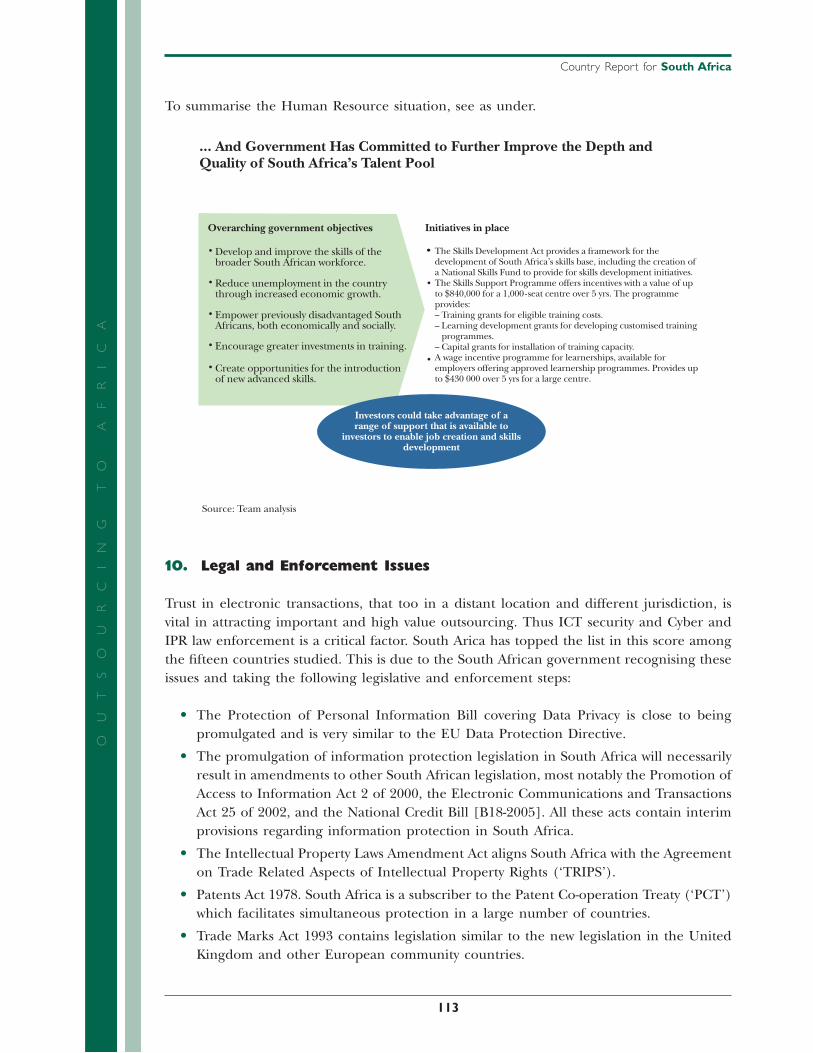
Country Report for South Africa
113
OU
TS
OU
RC
IN
G
TO
A
FR
IC
ATo summarise the Human Resource situation, see as under.
... And Government Has Committed to Further Improve the Depth andQuality of South Africa’s Talent Pool
Initiatives in place
• The Skills Development Act provides a framework for thedevelopment of South Africa’s skills base, including the creation ofa National Skills Fund to provide for skills development initiatives.The Skills Support Programme offers incentives with a value of upto $840,000 for a 1,000-seat centre over 5 yrs. The programmeprovides:– Training grants for eligible training costs.– Learning development grants for developing customised training programmes.– Capital grants for installation of training capacity.A wage incentive programme for learnerships, available foremployers offering approved learnership programmes. Provides upto $430 000 over 5 yrs for a large centre.
•
•
•
Source: Team analysis
Overarching government objectives
Develop and improve the skills of the broader South African workforce.
•
Reduce unemployment in the countrythrough increased economic growth.
•
Empower previously disadvantaged SouthAfricans, both economically and socially.
•
Encourage greater investments in training.•
Create opportunities for the introduction of new advanced skills.
•
Investors could take advantage of arange of support that is available to
investors to enable job creation and skillsdevelopment
10. Legal and Enforcement Issues
Trust in electronic transactions, that too in a distant location and different jurisdiction, is vital in attracting important and high value outsourcing. Thus ICT security and Cyber and IPR law enforcement is a critical factor. South Arica has topped the list in this score among the fi fteen countries studied. This is due to the South African government recognising these issues and taking the following legislative and enforcement steps:
The Protection of Personal Information Bill covering Data Privacy is close to being promulgated and is very similar to the EU Data Protection Directive.
The promulgation of information protection legislation in South Africa will necessarily result in amendments to other South African legislation, most notably the Promotion of Access to Information Act 2 of 2000, the Electronic Communications and Transactions Act 25 of 2002, and the National Credit Bill [B18-2005]. All these acts contain interim provisions regarding information protection in South Africa.
The Intellectual Property Laws Amendment Act aligns South Africa with the Agreement on Trade Related Aspects of Intellectual Property Rights (‘TRIPS’).
Patents Act 1978. South Africa is a subscriber to the Patent Co-operation Treaty (‘PCT’) which facilitates simultaneous protection in a large number of countries.
Trade Marks Act 1993 contains legislation similar to the new legislation in the United Kingdom and other European community countries.
•
•
•
•
•
05_Africa_Report09_South Africa.113 11305_Africa_Report09_South Africa.113 113 2/25/09 4:21:03 PM2/25/09 4:21:03 PM
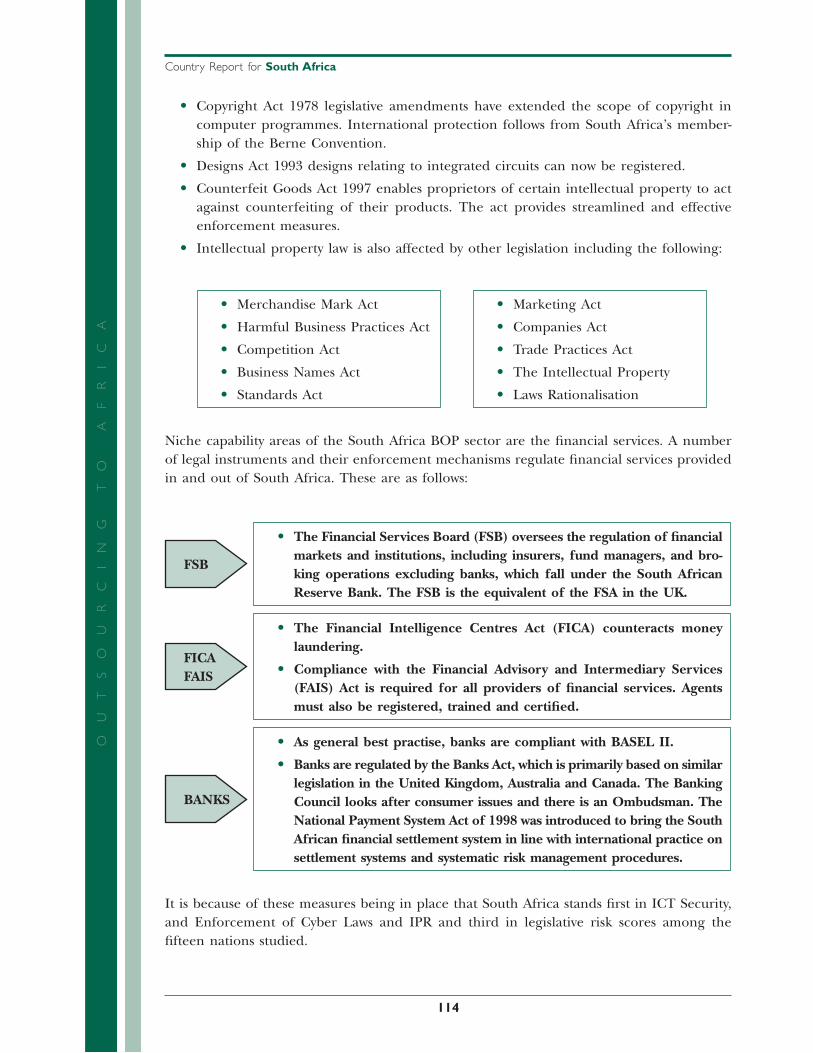
114
Country Report for South Africa
OU
TS
OU
RC
IN
G
TO
A
FR
IC
ACopyright Act 1978 legislative amendments have extended the scope of copyright in computer programmes. International protection follows from South Africa’s member-ship of the Berne Convention.
Designs Act 1993 designs relating to integrated circuits can now be registered.
Counterfeit Goods Act 1997 enables proprietors of certain intellectual property to act against counterfeiting of their products. The act provides streamlined and effective enforcement measures.
Intellectual property law is also affected by other legislation including the following:
Marketing Act
Companies Act
Trade Practices Act
The Intellectual Property
Laws Rationalisation
•
•
•
•
•
Merchandise Mark Act
Harmful Business Practices Act
Competition Act
Business Names Act
Standards Act
•
•
•
•
•
Niche capability areas of the South Africa BOP sector are the fi nancial services. A number of legal instruments and their enforcement mechanisms regulate fi nancial services provided in and out of South Africa. These are as follows:
As general best practise, banks are compliant with BASEL II.
Banks are regulated by the Banks Act, which is primarily based on similar legislation in the United Kingdom, Australia and Canada. The Banking Council looks after consumer issues and there is an Ombudsman. The National Payment System Act of 1998 was introduced to bring the South African fi nancial settlement system in line with international practice on settlement systems and systematic risk management procedures.
•
•
BANKS
The Financial Services Board (FSB) oversees the regulation of fi nancial markets and institutions, including insurers, fund managers, and bro-king operations excluding banks, which fall under the South African Reserve Bank. The FSB is the equivalent of the FSA in the UK.
•
FSB
The Financial Intelligence Centres Act (FICA) counteracts money laundering.
Compliance with the Financial Advisory and Intermediary Services (FAIS) Act is required for all providers of fi nancial services. Agents must also be registered, trained and certifi ed.
•
•FICAFAIS
It is because of these measures being in place that South Africa stands fi rst in ICT Security, and Enforcement of Cyber Laws and IPR and third in legislative risk scores among the fi fteen nations studied.
•
•
•
•
05_Africa_Report09_South Africa.114 11405_Africa_Report09_South Africa.114 114 2/25/09 4:21:03 PM2/25/09 4:21:03 PM
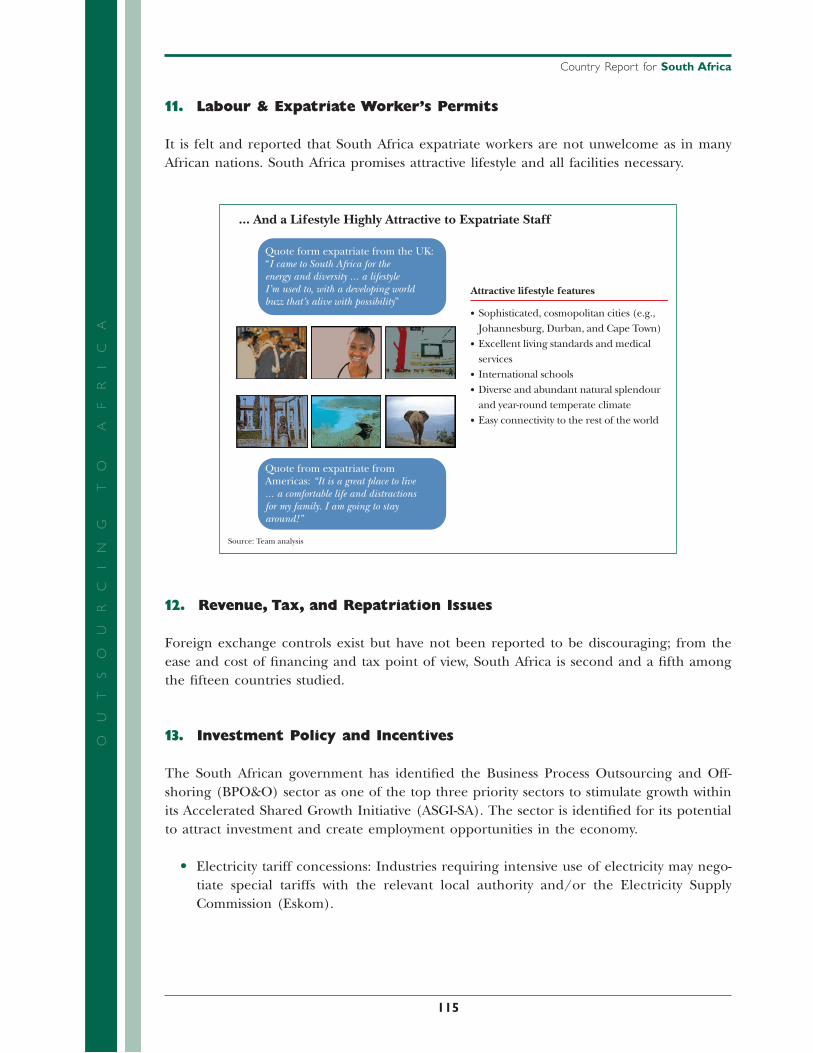
Country Report for South Africa
115
OU
TS
OU
RC
IN
G
TO
A
FR
IC
A11. Labour & Expatriate Worker’s Permits
It is felt and reported that South Africa expatriate workers are not unwelcome as in many African nations. South Africa promises attractive lifestyle and all facilities necessary.
Attractive lifestyle features
... And a Lifestyle Highly Attractive to Expatriate Staff
Sophisticated, cosmopolitan cities (e.g.,Johannesburg, Durban, and Cape Town)Excellent living standards and medicalservicesInternational schoolsDiverse and abundant natural splendourand year-round temperate climateEasy connectivity to the rest of the world
•
•
•
•
•
Source: Team analysis
Quote from expatriate fromAmericas: “It is a great place to live... a comfortable life and distractionsfor my family. I am going to stayaround!”
Quote form expatriate from the UK:“I came to South Africa for theenergy and diversity ... a lifestyleI’m used to, with a developing worldbuzz that’s alive with possibility”
12. Revenue, Tax, and Repatriation Issues
Foreign exchange controls exist but have not been reported to be discouraging; from the ease and cost of fi nancing and tax point of view, South Africa is second and a fi fth among the fi fteen countries studied.
13. Investment Policy and Incentives
The South African government has identifi ed the Business Process Outsourcing and Off-shoring (BPO&O) sector as one of the top three priority sectors to stimulate growth within its Accelerated Shared Growth Initiative (ASGI-SA). The sector is identifi ed for its potential to attract investment and create employment opportunities in the economy.
Electricity tariff concessions: Industries requiring intensive use of electricity may nego-tiate special tariffs with the relevant local authority and/or the Electricity Supply Commission (Eskom).
•
05_Africa_Report09_South Africa.115 11505_Africa_Report09_South Africa.115 115 2/25/09 4:21:03 PM2/25/09 4:21:03 PM
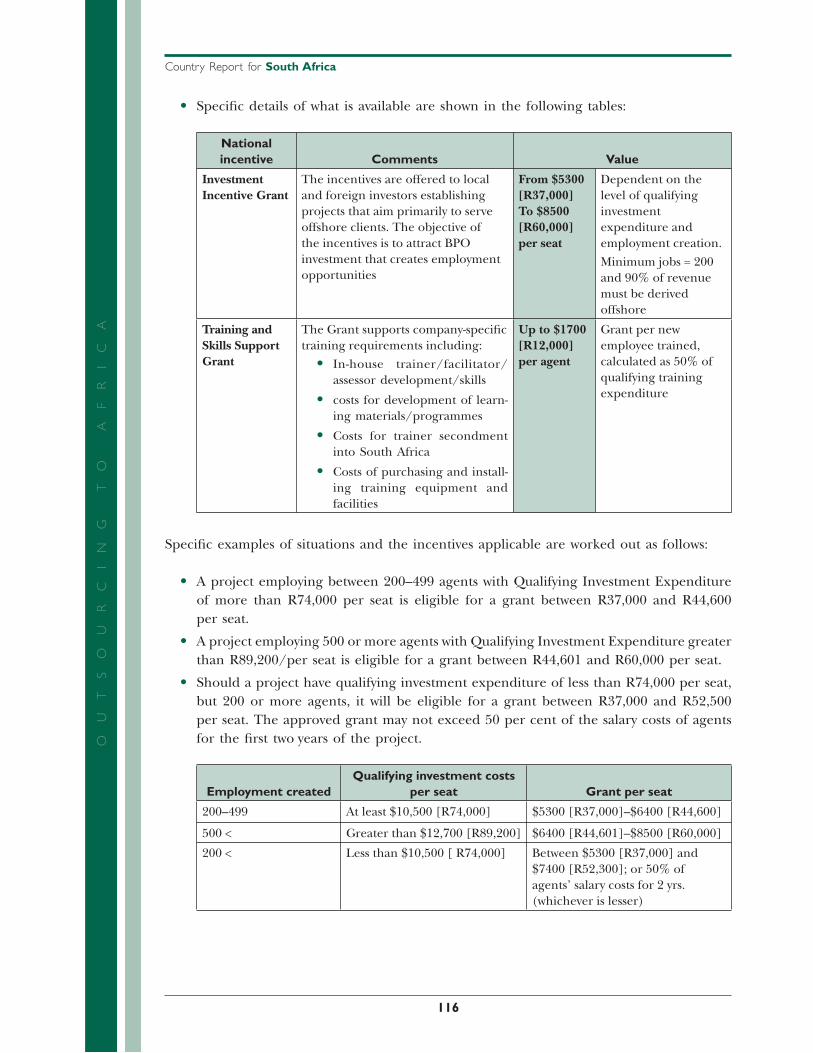
116
Country Report for South Africa
OU
TS
OU
RC
IN
G
TO
A
FR
IC
ASpecifi c details of what is available are shown in the following tables:
National incentive Comments Value
Investment Incentive Grant
The incentives are offered to local and foreign investors establishing projects that aim primarily to serve offshore clients. The objective of the incentives is to attract BPO investment that creates employment opportunities
From $5300 [R37,000] To $8500 [R60,000] per seat
Dependent on the level of qualifying investment expenditure and employment creation.
Minimum jobs = 200 and 90% of revenue must be derived offshore
Training and Skills Support Grant
The Grant supports company-specifi c training requirements including:
In-house trainer/facilitator/assessor development/skills
costs for development of learn-ing materials/programmes
Costs for trainer secondment into South Africa
Costs of purchasing and install-ing training equipment and facilities
•
•
•
•
Up to $1700 [R12,000] per agent
Grant per new employee trained, calculated as 50% of qualifying training expenditure
Specifi c examples of situations and the incentives applicable are worked out as follows:
A project employing between 200–499 agents with Qualifying Investment Expenditure of more than R74,000 per seat is eligible for a grant between R37,000 and R44,600 per seat.
A project employing 500 or more agents with Qualifying Investment Expenditure greater than R89,200/per seat is eligible for a grant between R44,601 and R60,000 per seat.
Should a project have qualifying investment expenditure of less than R74,000 per seat, but 200 or more agents, it will be eligible for a grant between R37,000 and R52,500 per seat. The approved grant may not exceed 50 per cent of the salary costs of agents for the fi rst two years of the project.
Employment createdQualifying investment costs
per seat Grant per seat
200–499 At least $10,500 [R74,000] $5300 [R37,000]–$6400 [R44,600]
500 < Greater than $12,700 [R89,200] $6400 [R44,601]–$8500 [R60,000]
200 < Less than $10,500 [ R74,000] Between $5300 [R37,000] and $7400 [R52,300]; or 50% of agents’ salary costs for 2 yrs. (whichever is lesser)
•
•
•
•
05_Africa_Report09_South Africa.116 11605_Africa_Report09_South Africa.116 116 2/25/09 4:21:04 PM2/25/09 4:21:04 PM
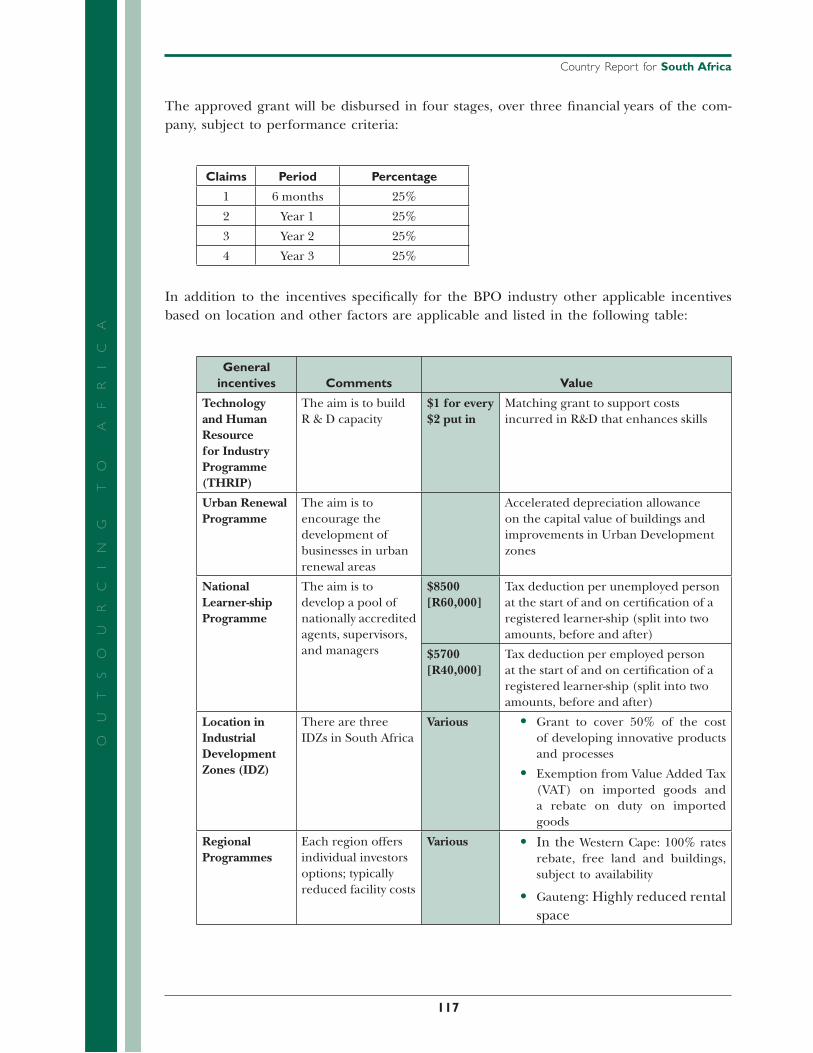
Country Report for South Africa
117
OU
TS
OU
RC
IN
G
TO
A
FR
IC
AThe approved grant will be disbursed in four stages, over three fi nancial years of the com-pany, subject to performance criteria:
Claims Period Percentage
1 6 months 25%
2 Year 1 25%
3 Year 2 25%
4 Year 3 25%
In addition to the incentives specifi cally for the BPO industry other applicable incentives based on location and other factors are applicable and listed in the following table:
General incentives Comments Value
Technology and Human Resource for Industry Programme (THRIP)
The aim is to build R & D capacity
$1 for every $2 put in
Matching grant to support costs incurred in R&D that enhances skills
Urban Renewal Programme
The aim is to encourage the development of businesses in urban renewal areas
Accelerated depreciation allowance on the capital value of buildings and improvements in Urban Development zones
National Learner-ship Programme
The aim is to develop a pool of nationally accredited agents, supervisors, and managers
$8500 [R60,000]
Tax deduction per unemployed person at the start of and on certifi cation of a registered learner-ship (split into two amounts, before and after)
$5700 [R40,000]
Tax deduction per employed person at the start of and on certifi cation of a registered learner-ship (split into two amounts, before and after)
Location in Industrial Development Zones (IDZ)
There are three IDZs in South Africa
Various Grant to cover 50% of the cost of developing innovative products and processes
Exemption from Value Added Tax (VAT) on imported goods and a rebate on duty on imported goods
•
•
Regional Programmes
Each region offers individual investors options; typically reduced facility costs
Various In the Western Cape: 100% rates rebate, free land and buildings, subject to availability
Gauteng: Highly reduced rental space
•
•
05_Africa_Report09_South Africa.117 11705_Africa_Report09_South Africa.117 117 2/25/09 4:21:04 PM2/25/09 4:21:04 PM

118
Country Report for South Africa
OU
TS
OU
RC
IN
G
TO
A
FR
IC
AHere’s a summary to the incentive situation:
Working Hard to Make South Africa a More Attractive Offshoring Destination
ConduciveEnvironment
AttractiveIncentives
South Africa has become an attractive value-based off-shoringdestination for captive and third party BPO operators alike
InvestorProtection
Strong political support from thePresidencyMacroeconomic and politicalstabilityAggressive infrastructuredevelopmentLiberalisation of telecomssectorAn official BPO programmewhich partners private andpublic sectors
•
•
•
•
•
Strong and functional legalframework (Rule of Law)Data Privacy ActRespect for property rightsProtection of intellectual propertyrightsWell regulated financial servicessectorCompliance with Basel II, MoneyLaundering Act, CorporateGovernance, etc.
•
•••
•
•
Investment incentives up to +-R65,000 per seatTraining and skills incentives upto +-R12 000 per learnerVarious other non-fiscalincentives available at nationaland regional levelsOver R200m disbursed in the last4 months and numerousapplications being processed now
•
•
•
•
14. Government Agencies Giving Support to Outsourcing
The department of trade and industry is the true single point contact and is willing to facilitate...
Fulfi lment of regulatory requirements
Information on all regulatory requirements.
Progress tracking on different applications.
Access to incentives programmes
Information on which incentives are available.
Assistance in applications for incentive programmes.
Progress tracking and feedback on incentive applications.
Acquisition of work permits
Information on work permit requirements.
Assistance in applications for work permits.
Progress tracking and feedback work permit on applications.
•
•
•
•
•
•
•
•
•
•
•
05_Africa_Report09_South Africa.118 11805_Africa_Report09_South Africa.118 118 2/25/09 4:21:05 PM2/25/09 4:21:05 PM

Country Report for South Africa
119
OU
TS
OU
RC
IN
G
TO
A
FR
IC
ARequired information relating to
National data, e.g., telecoms, connectivity, transport.
SA BPO landscape.
More detailed regional information, e.g., average salaries, rental costs, amenities, etc.
Assistance for investors in setting up site visits with
Vendors.
HR agencies.
BPO centres.
Assistance in identifying a location for a BPO centre
Identify available space.
Consider required amenities.
Support in planning further investments/ramp up of existing investment
15. Overall Assessment and Recommendations
The heavy incentives given to the outsourcing industry does raise a concern: Why? Is the industry not strong enough to stand on its own feet or are the conditions so adverse? The inherent strengths measured for South Africa certainly do not show weaknesses. Perhaps this summit could elaborate on this.
Will the new government that has come in after the April 2009 elections support outsourc-ing and ICT as the past governments have done?
There are, however, some inhibitors that South Africa needs to watch carefully:
Global competition specially from North Arica and close sub-Saharan neighbours and also from Asian and East Europe.
Perceived and actual public security; is enough been done to get to the root of the problem? Does every-one really have to carry a gun like in the American Wild West of the late 1800s?
Currency fl uctuations–South Africa has scored the last in currency risk and pulled down countries like Botswana whose currencies are in the same basket.
South African industry and government need to ponder over these issues to remain in the present lead position.
•
•
•
•
•
•
•
•
•
•
•
•
•
•
•
05_Africa_Report09_South Africa.119 11905_Africa_Report09_South Africa.119 119 2/25/09 4:21:07 PM2/25/09 4:21:07 PM

120
Country Report for South Africa
OU
TS
OU
RC
IN
G
TO
A
FR
IC
A16. Contact Details
Investment Promotion Agency (s)
Pumela Salela, Director: BPO, Strategic Competitiveness Unit, the Dti
Tel: (+27) 12-394-1033; Mobile: (+27) 82-939-7293
E-mail: [email protected]
Mr Mfanu Mfayela, Chief Executive, BPeSA
Tel: (+27) 861-722-2266; Mobile: (+27) 84-722-2266
E-mail: [email protected]
Note: These are true single window offi ces, and there is no need to contact individual departments.
Useful Links
http://www.cia.gov/cia/publications/factbook/geos/sf.html
South wood, R. et a. Assessing Consumer Activity in The Telecoms and Internet Sectors in Africa. 2006.
IDRC. http://www.afridigital.net/downloads/IDRCconsumerdftV2.doc
“Power, Poverty and the Global Water Crisis.” Human Development Report. 2006. UNDP.
Education in South Africa http://www.southafrica.info/ess_info/sa_glance/education/education.htm
Roos, G. Understanding the South Africa Program Context. 2003.
http://www2.weforum.org/site/homepublic.nsf/Content/Global+competitiveness+Programme/Global+Infor
http://www.infodev.org
Africa’s Top Ten Implementer Countries 2005 in CickAfrique.com
http://www.clickafrique.com/Magazine/ST014/CP0000000642.aspx
http://www.afridigital.net/downloads/IDRCconsumerdftV2.doc
CIA. World Fact Book. http://www.cia.gov/cia/publications/factbook/geos/sf.html
“ICT in South Africa.” 2005. Canadian High Commission. http://www.canadasachamber.com/news;
http://www.canadasachamber.com/news/Index.cfm?fuseaction=NewsDetail&NewsID=76
05_Africa_Report09_South Africa.120 12005_Africa_Report09_South Africa.120 120 2/25/09 4:21:07 PM2/25/09 4:21:07 PM

Country Report for South Africa
121
OU
TS
OU
RC
IN
G
TO
A
FR
IC
AAddress by Dr Ivy Matsepe-Casaburri, Minister of Communications to the second Information Society and Development (ISAD) Inter-Governmental Relations Forum (IGRF), Free State
http://www.info.gov.za/speeches/2007/07051410451001.htm
http://www.usa.org.za
Department of Communications: Policy Directions Issued by the Minister of Communications. http://www.polity.org.za/html/govdocs/policy/telecomms.html
Harris, L. 2006: “Let them Eat Dial-Up.” Brainstorm. November 2006. IT Web, Johannesburg, South Africa.
http://www.bridges.org/commentaries/116
South Africa Draft ICT in Education Implementation Plan, 2006. National Department of Education.
Harris, L. 2006: “Let them Eat Dial-Up.” Brainstorm. November 2006. IT Web, Johannesburg, South Africa.
ICTs in Education: Transaction Advisor Terms of Reference, 2007. National Department of Education.
http://www.schoolit.co.za/microsoft_school_agreement.php
http://it-online.co.za/content/view/37982/142/
http://hana.ru.ac.za/article.cfm?articleID=1373
http://www.intel.com/cd/corporate/education/emea/eng/za/elem_sec/index.htm
Communication Technologies and South African Higher Education: Mapping the Landscape, Council on Higher Education. 2006. http://www.che.ac.za/documents/d000127/1_ICTs_Landscape_Jul2006b.pdf
http://www.projectliteracy.org.za
05_Africa_Report09_South Africa.121 12105_Africa_Report09_South Africa.121 121 2/25/09 4:21:10 PM2/25/09 4:21:10 PM

05_Africa_Report09_South Africa.122 12205_Africa_Report09_South Africa.122 122 2/25/09 4:21:10 PM2/25/09 4:21:10 PM
123
OU
TS
OU
RC
IN
G
TO
A
FR
IC
A
Country Report for Tunisia
Disclaimer
This short Country Report, a result of a larger Survey of ICT Outsourcing in Africa, provides a general over-view of the current activities and issues related to ICT Outsourcing in the country. The data presented here should be regarded as illustrative rather than exhaustive. ICT Outsourcing is at a particularly dynamic stage in Africa, with new developments and announcements happening on a daily basis somewhere or the other on the continent. Therefore, these reports should be seen as ‘snapshots’ that were current at the time they were taken; it is expected that certain facts and fi gures presented may become outdated very quickly.
The fi ndings, interpretations, and conclusions expressed herein are a faithful representation of the respond-ents of the interviews and secondary data collected from the countries and published literature. Strict analysis has been carried out with the minimal infl uence of the authors/team members. References to data sources have been made as far as possible. In the case of the detailed data parameters used for scores and ranking, the same data source and timeline has been used for all the fi fteen countries compared. In the descriptive section of the country reports all data received from the individual country has been used in order to give as complete an assessment as possible. Thus those countries that have provided more information have a better coverage than those who have not been able to provide data to the research team.
Board of Executive Directors of the CBC or Cyber Media cannot guarantee the accuracy of the data included in this work. The boundaries, colours, denominations, and other information shown on any map in this work do not imply on the part of the CBC and Cyber Media any judgement of the legal status of any territory or the endorsement or acceptance of such boundaries.
It is expected that individual Country Reports from the Survey of ICT Outsourcing in Africa will be updated in an iterative process over time, based on additional research and feedback received through the CBC and Cyber Media website.
Mediterranean SeaLaGalit
Bizerte
L’Ariana
TUNISLa Goulette
El KefNabeul
Sousse
Sfax
Kasserine
Gafsa
Tozeur
Medenine
Tataouine
Zarzis
ALGERIA LIBYA
Golfede GabesGabes
0 50 100km 0 50 100mi
06_Africa_Report09_Tunisia.indd 12306_Africa_Report09_Tunisia.indd 123 2/25/09 4:21:50 PM2/25/09 4:21:50 PM

124
Country Report for Tunisia
OU
TS
OU
RC
IN
G
TO
A
FR
IC
A1. Overview
Tunisia, at the northernmost bulge of Africa, thrusts out toward Sicily to mark the division between the eastern and western Mediterranean Sea. Twice the size of South Carolina, it is bordered on the west by Algeria and by Libya on the south. Coastal plains on the east rise to a north-south escarpment that slopes gently to the west. The Sahara Desert lies in the southernmost part. Tunisia is more mountainous in the north, where the Atlas range continues from Algeria. According to Tunisian government statistics, more than 60 per cent of the population is middle class. Only 4 per cent falls below the poverty threshold. The national savings rate is 23 per cent, and 81 per cent of Tunisians own their own homes. Over 90 per cent of Tunisian homes are connected to the electrical grid and to potable water.
Since independence, Tunisia has traditionally taken a balanced approach to development that has emphasized family planning, education, and promotion of the status of women. Between 1987 and 1994, with International Monetary Fund (IMF) and World Bank support, Tunisia engaged in a series of important structural reforms. Unlike in most of the states of the region, the Tunisian economy is highly diversifi ed, with the increasingly unreliable hydrocarbon sector now accounting for no more than 12 per cent of local GDP.
Tunisia enjoys preferred status for its exports to EU countries and has significantly lowered local tariff barriers to EU imports.
2. Tunisia’s Position in Africa’s Fifteen Countries
Morocco *
Morocco
Tunisia *
Geographical Coverage and Rank
TunisiaEgypt *
Egypt
Senegal *
Senegal
GhanaGhana
Nigeria
Nigeria
Uganda
Uganda
Kenya
KenyaTanzania
Tanzania
Zambia
Zambia
Mozambique MozambiqueBotswana
Botswana
Namibia
Namibia
SouthAfrica
South Africa
MauritiusAfrica
*Non-Commonwealth Countries
Mauritius
06_Africa_Report09_Tunisia.indd 12406_Africa_Report09_Tunisia.indd 124 2/25/09 4:21:50 PM2/25/09 4:21:50 PM

Country Report for Tunisia
125
OU
TS
OU
RC
IN
G
TO
A
FR
IC
AContributing scores and ranks are as under.
Overall
Band Score (PS & BE) Rank in Band
Ready 6.77 Fourth
Infrastructure
Score Rank Band
7.8 1 Ready
Tunisia is fi rst in network readiness, overall cost of infrastructure, cost of travel and stay, telecommunication and data transfer costs, and road and rail. Tunisia comes second, third, and fourth in availability and penetration, cost of space and facilities, and international Internet bandwidth. At the other end, Tunisia comes tenth in electricity availability.
People and Skills (PS)
Score Rank
3.447 4
In the case of ‘People and Skills’, Tunisia is fi rst in Quality and education, language and domain skills, second in work satisfaction, and third in ICT exposure. At the other end Tunisia is eleventh in the cost of human resources and thirteenth in cost of living.
Business Environment (BE)
Score Rank
3.326 6
In this lower level abstraction, Tunisia coming sixth is the best in geopolitical risk and legislative risk; it enjoys the second position in ICT Security and enforcement of Cyber and IPR laws and currency risk. It has achieved third position in share of services in GDP. At the other end Tunisia is in the thirteenth position in the Share of ICT in exports and in the last position in tax.
3. Country, Political, and Economic Profi le
Tunisia, at the northernmost bulge of Africa, thrusts out towards Sicily to mark the division between the eastern and western Mediterranean Sea. Twice the size of South Carolina, it is bordered on the west by Algeria and by Libya on the south. Coastal plains on the east
06_Africa_Report09_Tunisia.indd 12506_Africa_Report09_Tunisia.indd 125 2/25/09 4:21:51 PM2/25/09 4:21:51 PM

126
Country Report for Tunisia
OU
TS
OU
RC
IN
G
TO
A
FR
IC
Arise to a north-south escarpment that slopes gently to the west. The Sahara Desert lies in the southernmost part. Tunisia is more mountainous in the north, where the Atlas range continues from Algeria.
The salient features are as follows:
Area: 163,610 sq km (63,378 sq mi).
Cities: Tunis (capital); Greater Tunis Area, Sfax, Nabeul, Sousse.
Terrain: Arable land in north and along central coast; south is mostly semiarid or desert.
Climate: Hot, dry summers and mild, rainy winters.
Population (2007): 10.10 million.
Education (years compulsory): 9.
Literacy (defi nition age 15 and over can read and write, 2006 estimates): 74.3 per cent.
GDP (2006, 2000$ mil): $28.7 billion.
Per capita GDP (2007, IMF): $2860.
GDP Growth Rate: 6.3%.
Government type: Parliamentary democracy.
Independence: March 20, 1956.
Branches: Executive (chief of state President Zine El Abidine BEN ALI [(since November 7, 1987)] head of government.
Prime Minister Mohamed Ghannouchi (since November 17, 1999) cabinet.
Council of Ministers appointed by the president; president elected by popular vote for a fi ve-year term; election last held 24 October 2004 (next to be held in October 2009).
Prime minister appointed by the president. Election results:
President Zine El Abidine Ben Ali re-elected for a fourth term.
Candidates from opposition: Mohamed Bouchiha (PUP), Mohamed Ali Halouani (Et-Tajdid), and Mounir Beji (PSL).
Percentage of vote: Zine El Abidine Ben Ali 94.49% (offi cially).
Legislative: Bicameral. Chamber of Deputies or Majlis al-Nuwaab (189 seats; fi ve-year terms; 152 seats are elected by popular vote for party lists on a winner-take-all basis). An additional 37 seats (20 per cent of the total) are distributed to opposition parties on a proportional basis as provided for in 1999 constitutional amendments. Elections last held 24 October 2004 (next to be held in October 2009).
Election results: Percentage of vote by party—RCD 92%; seats by party—RCD 152, MDS 14, PUP 11, UDU 7, Et-Tajdid 3, PSL 2.
Note: The opposition increased number of seats from 34 to 37. A referendum in 2002 created a second chamber, the Chamber of Advisors. Elections for the Chamber of Advisors were held in July 2005.
Shura (consultative) Council
Judicial: Nominally independent District Courts, Courts of Appeal, Highest Court (Cour de Cassation). Judges of the Highest Court are appointed by the president.
•
•
06_Africa_Report09_Tunisia.indd 12606_Africa_Report09_Tunisia.indd 126 2/25/09 4:21:51 PM2/25/09 4:21:51 PM

Country Report for Tunisia
127
OU
TS
OU
RC
IN
G
TO
A
FR
IC
AAdministrative subdivisions: 24 governorates—Ariana, Beja, Ben Arous, Bizerte, El Kef, Gabes, Gafsa, Jendouba, Kairouan, Kasserine, Kebili, Mahdia, Manouba, Medenine, Monastir, Nabeul, Sfax, Sidi Bou Zid, Siliana, Sousse, Tataouine, Tozeur, Tunis, Zaghouan.
Principal political parties: Democratic Constitutional Rally (Rassemblement Consti-tutionnel Democratique—ruling party) or RCD, President Zine El Abidine Ben Ali; Et-Tajdid Movement (Mohamed Harmel); Democratic Forum for Labour and Liber-ties or FDTL (Mustapha Ben Jaafar); Liberal Social Party or PSL (Mondher Thabet); Movement of Democratic Socialists or MDS (Ismail Boulahia); Popular Unity Party or PUP (Mohamed Bouchiha); Unionist Democratic Union or UDU (Ahmed Inoubli); Progressive Democratic Party or PDP (Maya Jribi); Green Party for Progress or PVP (Mongi Khamassi).
Suffrage: Universal at 18. (Active duty members of the military cannot vote.)
Economy
The government of Tunisia has been methodically reducing its role in the economy. By 1994, forty-six of the 189 public enterprises were completely or partially privatized either through sale of shares or assets; most of these forty-six fi rms, however, were small-scale. Although the privatization program is supported by the National Labor Federation (UGTT), the govern-ment is moving carefully to avoid mass fi rings in unprofi table public companies.
The government is focusing on the stock market as the principal vehicle for the privatiza-tion program. Specifi c targets are companies operating in competitive sectors. Tunis Air and other major state-owned companies will be partially or wholly privatized by selling shares through the stock market.
The most dramatic re-orientation has occurred in the fi nancial and banking sectors. The Central Bank is gradually shifting to a supervisory and regulatory role. Interest rates were offi cially deregulated and commercial banks allowed moving into the long-term credit mar-ket. The government made the Tunisian Dinar convertible for current account transactions, and currency trading was privatized.
In the fi nancial markets, the former state-controlled stock exchange, the Bourse, was priva-tized. The new structure is composed of brokerage houses. Similarly, a privately held central stock clearing house company was established. The state will continue to exercise its super-visory and regulatory role through the Financial Market Council.
In 1995, the government restructured its economic ministries. The former Ministry of National Economy was split into the Ministries of Industry and Commerce. The Ministry of Industry is responsible for improving the international competitiveness of Tunisian industry. It also retains control of the majority of state-owned industries. The Ministry of Commerce manages consumer subsidy and price control policies. Finally, the Ministry of Economic Development, formerly the Ministry of Planning, is responsible for long-term budget and policy development.
•
•
•
06_Africa_Report09_Tunisia.indd 12706_Africa_Report09_Tunisia.indd 127 2/25/09 4:21:51 PM2/25/09 4:21:51 PM
128
Country Report for Tunisia
OU
TS
OU
RC
IN
G
TO
A
FR
IC
AReforms
Tunisia, under the leadership of president Zine El Abidine Ben Ali, has implemented an International Monetary Fund-style economic stabilization program highlighted by rigorous budget balancing, foreign trade liberalization, and private sector incentives. Consequently, economic growth rates have surged. Not surprisingly, so, too, has the rate of direct foreign investment, which according to offi cial statistics was up 22 per cent during the fi rst nine months of 1995 from the comparable period in 1994 to some US$ 300 million.
Most of this capital came from European Union investors who were encouraged by Tunisia’s proximity to southern Mediterranean markets, relatively low cost labor force, and enhanced fi scal transparency.
It has been in the vital area of local economic restructuring that Ben Ali’s accomplishments have been most impressive. Within the past year or so, Tunisia has emerged as the unquali-fi ed fi nancial success story of Arab North Africa, with high GDP growth rates (7 per cent for 1996), relatively low infl ation rates (6.1 per cent in 1995), and a highly command rigorously realistic exchange rate structure.
In addition, Tunisia took in foreign capital in 1994 by issuing a samurai bond ( Japanese yen denominated government paper). In order to do so, it became the fi rst Arab country to be assigned a country credit rating provided by the Japan Bond Research Institute.
All signs now point towards considerably higher levels of both local and foreign investment and sustainable overall economic growth.
Commercial Outlook
As of 1995, 87 per cent of prices are free at the production level and 85 per cent at the distribution level. Over 93 per cent of imports are unrestricted.
At the end of the structural adjustment program in 1994, all basic economic indicators had improved. The average growth rate over 1987–1994 was 4.5 per cent with an average infl a-tion rate of 5 per cent. The government budget defi cit declined from 5.5 per cent of Gross Domestic Product (GDP) in 1986 to 2.6 per cent in 1994. Over the same period, the current accounts defi cit went from 8 per cent of GDP to 4.6 per cent. Similarly, debt service as a percentage of exports declined from 27.9 per cent to 18.5 per cent.
Constant GDP was US$ 12.8 billion in 1994 and US$ 13.3 billion in 1995, of which serv-ices accounted for about 33 per cent. The manufacturing and agriculture sectors each comprised about 15 per cent. Non-manufacturing industries, primarily phosphate mining and hydrocarbons, contributed 12 per cent to GDP. The remainder was made up of non-commercial activities.
06_Africa_Report09_Tunisia.indd 12806_Africa_Report09_Tunisia.indd 128 2/25/09 4:21:52 PM2/25/09 4:21:52 PM
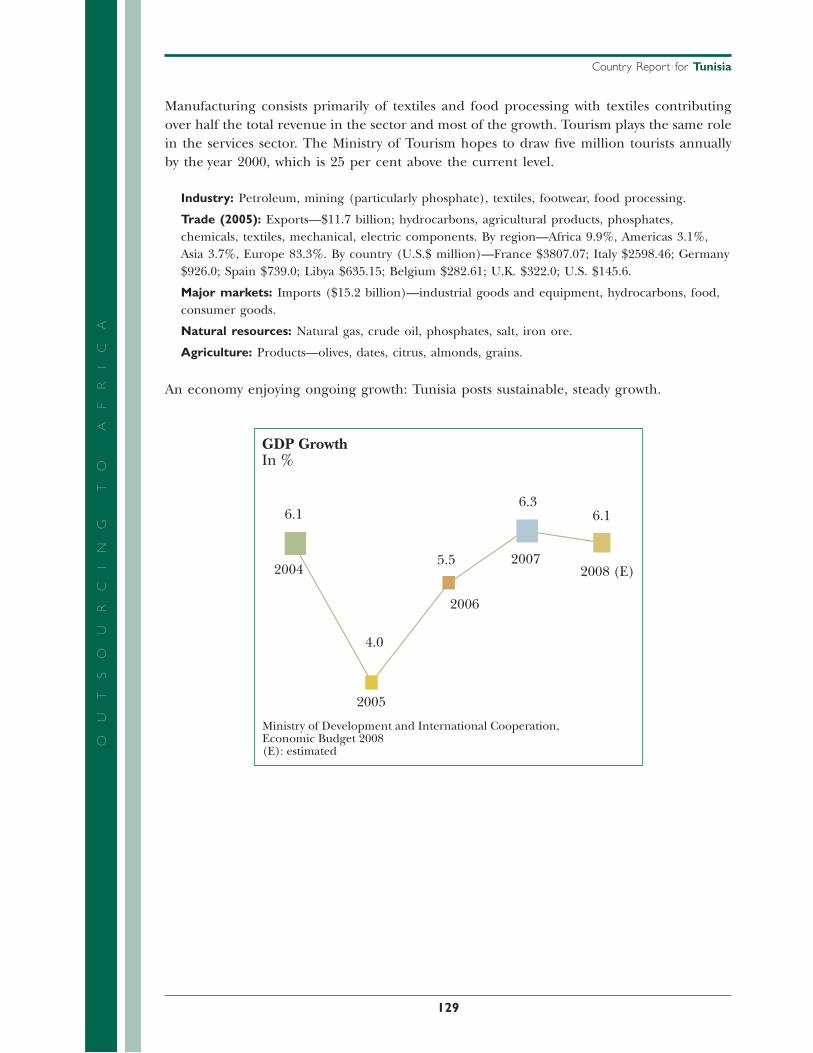
Country Report for Tunisia
129
OU
TS
OU
RC
IN
G
TO
A
FR
IC
AManufacturing consists primarily of textiles and food processing with textiles contributing over half the total revenue in the sector and most of the growth. Tourism plays the same role in the services sector. The Ministry of Tourism hopes to draw fi ve million tourists annually by the year 2000, which is 25 per cent above the current level.
Industry: Petroleum, mining (particularly phosphate), textiles, footwear, food processing.
Trade (2005): Exports—$11.7 billion; hydrocarbons, agricultural products, phosphates, chemicals, textiles, mechanical, electric components. By region—Africa 9.9%, Americas 3.1%, Asia 3.7%, Europe 83.3%. By country (U.S.$ million)—France $3807.07; Italy $2598.46; Germany $926.0; Spain $739.0; Libya $635.15; Belgium $282.61; U.K. $322.0; U.S. $145.6.
Major markets: Imports ($15.2 billion)—industrial goods and equipment, hydrocarbons, food, consumer goods.
Natural resources: Natural gas, crude oil, phosphates, salt, iron ore.
Agriculture: Products—olives, dates, citrus, almonds, grains.
An economy enjoying ongoing growth: Tunisia posts sustainable, steady growth.
GDP GrowthIn %
Ministry of Development and International Cooperation,Economic Budget 2008(E): estimated
6.1
4.0
5.5
6.36.1
2006
20072008 (E)
2005
2004
06_Africa_Report09_Tunisia.indd 12906_Africa_Report09_Tunisia.indd 129 2/25/09 4:21:52 PM2/25/09 4:21:52 PM

130
Country Report for Tunisia
OU
TS
OU
RC
IN
G
TO
A
FR
IC
AA diversifi ed economy: The services sector and manufacturing industries account for 43.2 per cent and 19.2 per cent of GDP, respectively.
GDP Structure–Factor Costs in 2007In %
Ministry of Development and International Cooperation,Economic Budget 2008
Agriculture & fishingNon-manufacturing industriesManufacturing industriesTourismTransportCommunicationsOther Services
36.5
11.5
14.0
19.2
6.36.75.8
Growing and diversifi ed exports: Tunisian exports currently post sound performance and a diversifi ed mix, accounting for 54.1 per cent of GDP, with a growth rate of 17 per cent in 2007.
Trends in Export of Goods and ServicesIn billion TND
Ministry of Development and International Cooperation,Economic Budget 2008(E): estimated
16.48
18.68
20.62
24.28
26.39
2004
2005
2006
2007
2008 (E)
•
•
06_Africa_Report09_Tunisia.indd 13006_Africa_Report09_Tunisia.indd 130 2/25/09 4:21:52 PM2/25/09 4:21:52 PM

Country Report for Tunisia
131
OU
TS
OU
RC
IN
G
TO
A
FR
IC
AStructure of Export of Goods and Services in 2007In %
Ministry of Development and International Cooperation,Economic Budget 2008
Textile and leatherMechanical and electric industriesAgriculture and agro-foodTourismTransportChemical productsEnergyOther
8.6
6.8
14.9
20.7
23.8
7.5
7.0
10.8
A country open to the outer world: Exports are the backbone for growth in Tunisia and thus are given high priority.
Trends in Exports (% of GDP)
Ministry of Development and International Cooperation,Economic Budget 2008(E): estimated
20042005200620072008 (E)
46.8
49.6
50.4
54.1
54.3
•
06_Africa_Report09_Tunisia.indd 13106_Africa_Report09_Tunisia.indd 131 2/25/09 4:21:53 PM2/25/09 4:21:53 PM

132
Country Report for Tunisia
OU
TS
OU
RC
IN
G
TO
A
FR
IC
AFree access to the European Union market: The European Union is Tunisia’s primary economic and commercial partner. Tunisia was the fi rst country on the southern rim of the Mediterranean to sign a free-trade association agreement with the European Union (1995).
Trends of Tunisian Exports of Goods to the European UnionIn million TND
National Institute of Statistics
20032004200520062007
8,343
9,991
10,886
11,784
15,387
Ongoing integration of the Maghreb and Arab markets: Tunisia is tied to Maghreb and Arab countries by preferential agreements. Bilateral agreements have set up free-trade zones with Turkey, Egypt, Morocco, Jordan, Iraq, and Libya that govern trade with these countries. A regional agreement was signed in 1998 to set up an Arab free-trade zone. The Agadir free-trade agreement was signed in 2004 by Jordan, Egypt, Morocco, and Tunisia.
Trends in Tunisian Exports of Goods to Maghreb,Middle-East and Gulf CountriesIn million TND
National Institute of Statistics
2003
796 815
1,145
1,373
1,644
2004
2005
2006
2007
•
•
06_Africa_Report09_Tunisia.indd 13206_Africa_Report09_Tunisia.indd 132 2/25/09 4:21:53 PM2/25/09 4:21:53 PM

Country Report for Tunisia
133
OU
TS
OU
RC
IN
G
TO
A
FR
IC
ALow infl ation: Infl ation has on average been kept on 3 per cent thanks to strengthening of rules governing competitiveness and ongoing improvement in productivity.
Trends in the Inflation RateIn %
National Institute of Statistics, 2008
2003
2004
2005
2006
20072.7
3.6
2.0
4.5
3.1
Economic risk: A low-risk economy Tunisia has been awarded an investment rating by fi nancial institutions and rating agencies since 1994.
Tunisia’s Rating in 2007
US agencies Standing & Poor’s BBB
Monday’s Baa2
European agency IBCA BBB
Japanese agency R & I A-
All this data published by Tunisia generally agrees with our fi ndings. It is worth looking into why the data on share of ICT in exports is so low whereas the profi le presented by Tunisia in their investment guide should have given a much better fi gure. One possible explanation could be that the total exports are so high that even a fairly large ICT export fi gure would give a small percentage as the total export fi gure is large in absolute terms.
Government and Political Condition
Political pressure groups and leaders.
Authorized: Tunisian Human Rights League or LTDH (Mokhtar Trifi ); Tunisian Asso-ciation of Democratic Women or ATFD (Khadija Cherif); Tunisian Bar Association (Adbessatar Ben Moussa); National Syndicate of Tunisian Journalists or SNJT (Neji Bhouri).
•
•
•
•
06_Africa_Report09_Tunisia.indd 13306_Africa_Report09_Tunisia.indd 133 2/25/09 4:21:54 PM2/25/09 4:21:54 PM
134
Country Report for Tunisia
OU
TS
OU
RC
IN
G
TO
A
FR
IC
AUnauthorized: An-Nahdha (Renaissance) the Islamic fundamentalist party (Rached El Ghanouchi, in exile); National Council for Liberties in Tunisia or CNLT (Sihem Ben Sedrine); Movement of 18 October (Nejib Chebbi, Hamma Hammami, et. al) Con-gress for the Republic or CPR (Moncef Marzouki); Tunisian Communist Labor Party or POCT (Hamma Hammami); Tunisian Green Party or PVT (Abdelkader Zitouni); International Association for the Support of Political Prisoners or AISPP (Co-ordina-tor—Mokhtar Yahyaoui); Tunisian Journalists’ Syndicate or SJT (Lotfi Hajji).
Administrative divisions: 24 governorates—Ariana, Beja, Ben Arous, Bizerte, El Kef, Gabes, Gafsa, Jendouba, Kairouan, Kasserine, Kebili, Mahdia, Manouba, Medenine, Monastir, Nabeul, Sfax, Sidi Bou Zid, Siliana, Sousse, Tataouine, Tozeur, Tunis, Zaghouan.
Tunisia is a republic with a presidential system President Zine El Abidine Ben Ali has been in offi ce since 1987, when he deposed Habib Bourguiba, president since Tunisia’s independence from France in 1956. The ruling party, the Democratic Constitutional Rally (RCD), used to be the sole legal party for twenty-fi ve years but now it is one among several other political parties in the country. The president is elected to fi ve-year terms and appoints a prime minister and cabinet, who play a strong role in the execution of policy.
Freedom of opinion and expression has been consolidated through a host of measures, including successive reforms in the Press Code (1988, 1993, 2001 and 2006), aimed at further reinforcing public freedoms. The latest amendments abolished the crime of “defamation of the public order” as well as the procedure of legal obligation to submit copies of published material. The Tunisian media landscape is today open and plural-istic. Access to the Internet, satellite channels and foreign newspapers and magazines is readily available to all Tunisian citizens all over the country.
Democratic pluralism fi nds its illustration in the presence of nine legally recognized political parties, which freely express their views, hold public activities, participate in elections and publish their own newspapers. Political parties are represented in local, regional and national councils. They are also entitled to public funds to fi nance their activities and publish their own newspapers.
Pluralism in elections is now a concrete reality in Tunisia. In 1994, the Electoral Code was amended in such a way as to guarantee at least 20% of parliamentary seats to opposition parties. This minimum proportion will be brought up to 25% based on a new revision of the Electoral Code announced on March 21, 2008.
The 2002 Constitutional Reforms reinforced the protection of personal privacy and consecrated the inviolability and confi dentiality of communications and personal data. Article 5 of the Constitution confi rmed the importance Tunisia attaches to human rights in their universality and comprehensiveness.
Tunisia is a leader in the Arab world in promoting the legal and social status of women. A Personal Status Code was adopted shortly after independence in 1956, which, among other things, gave women full legal status (allowing them to run and own businesses, have bank accounts, and seek passports under their own authority).
It also, for the fi rst time in the Arab world, outlawed polygamy.
Tunisia’s judiciary is headed by the Court of Cassation, whose judges are appointed by the president. The country is divided administratively into 24 governorates. The president appoints all governors.
•
•
•
•
•
•
•
•
•
•
06_Africa_Report09_Tunisia.indd 13406_Africa_Report09_Tunisia.indd 134 2/25/09 4:21:54 PM2/25/09 4:21:54 PM

Country Report for Tunisia
135
OU
TS
OU
RC
IN
G
TO
A
FR
IC
ATunisia is considered safe from an Islamic fundamentalist take-over. The thirty-one year rule of Tunisian president Habib Bourghiba (1956–87) left the country relatively free of bureaucratic corruption and steered it clear of the same command economy structure that decimated Algeria.
President Zine El Abidine Ben Ali introduced several amendments mainly into article 40 of the Constitution to ease the conditions of presidential candidacy, enable opposi-tion party leaders to participate in presidential elections, even if they cannot receive the support of 30 members of parliament or heads of local councils as required by the Constitution. In October 1999, then in October 2004, Tunisia witnessed pluralist presidential elections where the incumbent President was challenged respectively by two then three contenders from the opposition for the highest executive offi ce.
Moderately concerned about the potentially destabilizing effects of home-grown Islamic fundamentalism, he has stood fi rm against the offi cially banned Islamic Ennadha (Renewal) Party. At the same time, he has also expanded on a fl ourishing social serv-ice net (Tunisian medical care and education are arguably the best in the Arab world) and kept the bureaucracy clean.
4. Principal Government Offi cials
President: Zine El Abidine Ben Ali.
Prime Minister: Mohamed Ghannouchi.
Minister of Foreign Affairs: Abdelwahab Abdallah.
Minister of National Defense: Kamel Morjane.
5. Foreign Relations
President Ben Ali has maintained Tunisia’s long-time policy of seeking good relations with the West, including the United States, while playing an active role in Arab and African regional bodies. President Bourguiba took a nonaligned stance but emphasized close relations with Europe and the United States.
(The PLO Political Department remains in Tunis.) Tunisia consistently has played a moderating role in the negotiations for a comprehensive Middle East peace. In 1993, Tunisia was the fi rst Arab country to host an offi cial Israeli delegation as part of the Middle East peace process. The Government of Tunisia operated an Interests Section in Israel from April 1996 until the outbreak of the second Intifada in 2000. Israeli citizens may travel to Tunisia on their Israeli passports.
President Ben Ali has maintained Tunisia’s long-time policy of seeking good relations with the West, including the United States, while playing an active role in Arab and African regional bodies. President Bourguiba took a nonaligned stance but emphasized close relations with Europe and the United States.
Tunisia’s relations with neighboring Libya appear to be stable. In fact, Libyan leader Muammar Gaddafi began urging Tunisian businessmen to invest in his country in October 1996. His calls for investments included the agriculture, fi sheries, petrochemi-cals, and iron and steel industries.
•
•
•
•
•
•
•
06_Africa_Report09_Tunisia.indd 13506_Africa_Report09_Tunisia.indd 135 2/25/09 4:21:54 PM2/25/09 4:21:54 PM
136
Country Report for Tunisia
OU
TS
OU
RC
IN
G
TO
A
FR
IC
ABeing a member of the new ‘Club Med’ Alliance, Tunisia will have access to Southern European markets.
In the case of preferential access to several markets, Tunisia is eligible for tariff reduc-tions under the Generalized Preference System, mainly for manufactured, agricul-tural and handicraft products with the United States, Canada, Japan, Switzerland and Australia. It is also eligible for preferential access to markets in several African countries in the framework of bilateral agreements.
In the case of Trade Agreements, Tunisia prides itself on maintaining preferential trading-partner relations with African, Arab, and Mediterranean nations. Tunisia has entered into trade agreements with forty-one developed and developing countries, which granted Tunisia most-favored-nation status. Tunisia has entered into bilateral and regional trade preference agreements with the European Union and the Arab Maghreb Union as well as certain agreements under the framework of the Inter-Arab Coopera-tion, the Inter-African Cooperation and the Organization of the Islamic Conference. Furthermore, Tunisia is a member of the World Trade Organization (WTO) and is a signatory to the Global System on Trade Preferences.
In 1995, the Tunisian government and the European Union negotiated a major eco-nomic agreement on free trade. The pact establishes the framework for free trade between Tunisia and the European Union. The agreement, which came into effect in 1997, has a twelve-year phase-in period.
6. Living, Security and Safety Perceptions
Tunisia is a country that has done a good job of reconciling tradition and modernity. Tunisians are tolerant, hospitable, graced with boundless joy of living and blessed with a strong will to succeed. Tunisia is the number one tourist destination on the southern rim of the Mediterranean, thanks to its extensive hotel infrastructure and leisure facilities. Aside from its clement weather, Tunisia offers all the conveniences anyone could want—modern residential neighborhoods, numerous shopping centers and hypermarkets, foreign schools, high level medical services, amusement parks, and recreational facilities. Contrary to our fi gures of the ‘Cost of Living’ from the World Development Indicators (WDI) data base Tunisia claims to be one of the least expensive cities. Tunisia is ranked among the least expensive countries in the world. It is thirteenth out of 144 in the list of the most expensive cities issued by Mercer Human Resource in 2007.
In the present day situation it is necessary to take precautions and it is necessary to be alert even in a country as hospitable as Tunisia. Without being alarmed it is worthwhile to be ready for possible adverse incidents and take cognizance of the warnings issued by responsible governments to their people visiting Tunisia.
Criminals have targeted tourists and business travelers for theft, pickpocketing, and scams. Care should be taken with wallets and other valuables kept in handbags or backpacks that can be easily opened from behind in crowded streets or marketplaces. Criminals may violently grab at items worn around the neck (purses, necklaces, backpacks) and then run away, sometimes causing injury to their victims. Criminals have been known to rob pedes-trians by snatching purses and handbags from their victims while on a motorcycle.
•
•
•
•
•
•
06_Africa_Report09_Tunisia.indd 13606_Africa_Report09_Tunisia.indd 136 2/25/09 4:21:55 PM2/25/09 4:21:55 PM

Country Report for Tunisia
137
OU
TS
OU
RC
IN
G
TO
A
FR
IC
AHarassment of unaccompanied females occurs rarely in hotels, but it occurs more frequently elsewhere. Dressing in a conservative manner can diminish potential harass-ment, especially for young women. It is always wise to travel in groups of two or more people. Women are advised against walking alone in isolated areas. Travelers are advised to avoid buses and commuter rail when possible, and to never enter a taxi if another passenger is present.
Theft from vehicles is also common. Items high in value like luggage, cameras, laptop computers, or briefcases are often stolen from cars. Travelers are advised not to leave valuables in parked cars, and to keep doors locked, windows rolled up, and valuables out of sight. American residents in Tunisia are also advised to not leave items of value unattended in the yards of their homes, as there have been reports of theft of items such as tools and bicycles.
In May and June 2008, there were also reports of disturbances in communities in the south of Tunisia near the Algerian border.
Medical care in Tunisia is adequate, with a number of new, private ‘polyclinics’ available that function as simple hospitals and can provide a variety of procedures. Specialized care or treatment may not be available. Facilities that can handle complex trauma cases are virtually non-existent. While most private clinics have a few physicians who are fl u-ent in English, the medical establishment uses French, and all of the ancillary staff in every clinic communicates in Arabic and/or French.
Medical care could be expensive, and it is advisable to have a proper medical insur-ance cover.
Driving practices are poor. Drivers fail to obey the rules of the road even in the pres-ence of the police.
Emergency services are widely available in the larger towns. They can be less reliable in rural areas.
Travelers’ checks and credit cards are accepted at some establishments in Tunisia, mainly in urban or tourist areas. Cash machines (ATMs) are available in urban and tourist areas. The Tunisian dinar is not a fully convertible currency. While the export or import of Tunisian banknotes and coins is prohibited, the export of foreign currency declared when entering Tunisia is allowed.
7. ICT Policy, Infrastructure, and Service
ICT Policy: Tunisia has committed to the institutionalisation of ICT in all aspects of the economy and has played a leading role on the global level by hosting the second phase of the world summit on the information system. To introduce and sustain the integration of ICT in education, Tunisia has implemented a multi-dimensional strategy based on modernizing its infrastructure. Education is an important sector affected by this policy where a major restructuring took place, and reforms have taken into con-sideration the integration of ICT. Training and professional development of teachers and administrators were also considered as keys to successfully implementing ICT at all stages of the teaching-learning process. Distance education opens new horizons
•
•
•
•
•
•
•
•
•
06_Africa_Report09_Tunisia.indd 13706_Africa_Report09_Tunisia.indd 137 2/25/09 4:21:55 PM2/25/09 4:21:55 PM
138
Country Report for Tunisia
OU
TS
OU
RC
IN
G
TO
A
FR
IC
Aand constitutes a rich fi eld of research, innovation, and creation that still needs to be reinforced and further developed.
Communications infrastructure: The telecommunication sector in Tunisia is one of the most dynamic ones with an outstanding growth rate (more than 20 per cent between 2002 and 2006). The investment has reached 5,302 million dinars between 2001 and 2006, and it will reach 6,300 million dinars during the period 2007–2011. There are all kinds of networks in Tunisia, so foreign companies can set up communication links to virtually everywhere in the world at low cost. High performance, multiplicity, and the availability of systems and facilities for telecommunications transmission are based on the following:
Pair gain system.
Pleysychrone, SDH systems.
WLL.
ISDN, ATM, Frame Relay, X25.
LS, ADSL.
VSAT.
MOBIRIF (Rural network based in MGS technology).
GFA, WIFI, GPS.
Technology Infrastructure: Tunisia is home to seven technopoles and seven cyber parks in a number of regions, each devoted to a given area of specialization. The mid-term objective is that each governorate is granted a science park.
Industrial zones and economic activity parks: In 2007, Tunisia had 121 industrial zones distributed all over the territory covering a surface of 3,807 hectares and offer-ing several facilities. The eleventh economic development plan (2007–2011) provides for the achievement of thirty-one industrial zones covering 650 ha to reach a total area of 4,500 ha in 2011. There are also two high-level operational economic activity parks—Bizerte and Zarzis–Jerba. The Bizerte park is located at the city’s port (just 60 km from Tunis Airport), and the Zarzis park is located just half an hour from Jerba Airport.
Energy infrastructure: Tunisia has eighteen electrical plants—thermal, combined cycle, gas turbine, and steam turbine providing coverage for the entire country. Installed capacity stands at 3,110 M Watt. Gas mains in Tunisia are made up of 7,808 km for the transportation, of which 1,810 km are for the dispatch and 5,998 km for the distribu-tion. In his report Tunisia is not scoring as well as described here. The fi gures used in this study were from the WEF and US department of state data. Tunisia claims very competitive electricity and gas costs.
Competitive production costs: There are particularly favorable conditions for setting up a business in Tunisia. Wage costs are very competitive, as are factor costs. Here’s a deviation from this report.
•
•
•
•
•
•
•
•
•
•
•
•
•
06_Africa_Report09_Tunisia.indd 13806_Africa_Report09_Tunisia.indd 138 2/25/09 4:21:55 PM2/25/09 4:21:55 PM

Country Report for Tunisia
139
OU
TS
OU
RC
IN
G
TO
A
FR
IC
AAverage Sales Price Index Exclusive of Tax on Gas and Electricity for
Industrial Usage Tunisia = base 100
CountryElectricity costs
100 kW–160 MWh/yearNatural gas costs
1,000 toe/year
Tunisia 100 100
France 149.1 310.6
Spain 181.7 285.4
Portugal 203.8 318.7
Germany 215.2 478.0
Italy 216.2 349.6
Eurelectric, January 2007
Physical Infrastructure
Offi ce market: The four principal offi ce districts of the capital Tunis are the city centre (Montplaisir), Les Berges du Lac, Centre Urbain Nord, and out-of-town. Of these areas, Les Berges du Lac has tended to attract most interest from new corporate tenants, particularly as it represents a recent extension to the existing city providing an oppor-tunity for developers and occupiers to create new low-rise developments. The location provides better communications than the current congested inner city areas.
Retail market: There are a number of signifi cant retail developments on the edge of the city, of which the most popular is on the road to Carthage and anchored by Car-refour. As an alternative, there is boutique shopping in Les Berges du Lac and high street retailers in the city centre. The general trend in retailing in Tunis is towards offering more to the sophisticated shopper.
Industrial market: There are a number of major industrial areas located around Tunis, together with new areas which are being promoted by the inward investment agency, mainly located to the south of the city. Some of these locations provide new areas which effectively comprise plots of serviced land where the construction of new buildings is yet to start.
Residential market: The residential market tends to be dominated by the locations to the east of the city and north of the lake in Les Berges du Lac, including areas such as La Marsa and Carthage. There are also plans for a massive new Sports City development, which will include apartments and leisure uses and will further enhance this area.
Prime rents Prime yields
Offi ces US$ 12 per sq m per month 11%
Retail US$ 18 per sq m per month 8%
Industrial US$ 4 per sq m per month 13%
Residential US$ 4,000 per month* 9%
*Four bedroom executive house—prime location
•
•
•
•
06_Africa_Report09_Tunisia.indd 13906_Africa_Report09_Tunisia.indd 139 2/25/09 4:21:55 PM2/25/09 4:21:55 PM

140
Country Report for Tunisia
OU
TS
OU
RC
IN
G
TO
A
FR
IC
A8. ICT and BPO Industry Environment
Outsourcing to Tunisia Many reports rate Tunisia as a leader in Africa and in the Arab World for its excellent performance worldwide. World Economic Forums Africa Com-petitiveness Report, 2007 identifi es it as the fi rst most competitive economy in Africa and twentieth in the world.
A small north-African country, Tunisia has become a favoured destination for foreign direct investment over a few years now. It is its modern infrastructure, stable govern-ment, strong economy, accessible location and most importantly, the availability of high tech professionals at low costs, which make it ideal market for the investors.
Many European IT fi rms have set up operations here, as the cost of a Tunisian engineer is about 80 per cent lower than that in Europe. Tunisia’s thriving economy creates an attractive atmosphere for investors from the European Countries, Japan, and the US.
Around 2,600 foreign fi rms have invested in the country, and few chose Tunisia for its close proximity and preferential trading relations with the European Community and the Arab Maghreb Union, as well as for the Investment Code, which offers foreign investors considerable incentives and exemptions.
Tunisia seeks to attract 2,000 new outsourcing jobs this year to minimize its double-digit jobless rate.
A.T. Kearney’s recent study has ranked Tunisia amongst the world’s top-50 competitive ‘offshore locations’ for outsourcing company services abroad. The Kearney index also noted that French-speaking countries like Tunisia, engage in the outsourcing of their company services by serving francophone markets with stronger business environments contending with lower costs.
Many reports rate Tunisia as a leader in Africa and in the Arab World for its excellent per-formance worldwide. World Economic Forum’s Africa Competitiveness Report, 2007 iden-tifi es it as the fi rst most competitive economy in Africa and twenty-nineth in the world.
World Economic Forum’s Global Information Technology Report, 2006–2007 ranks it fi rst in Africa and in the Maghreb, and thirty-fi fth in the world in the fi eld of ‘global information technology’, and A.T. Kearney’s Global Services Location Index, 2007, gives it 26th position in the world in terms of ‘labour cost advantages’.
Tunisia, with a population of 10.3 million attracted foreign direct investment of $3.270 million in 2008. Furthermore, despite the intensifi cation of the world debt problem, Tunisia managed to reduce its total debt burden.
Tunisia is a serious destination. Software Technology Parks with state-of-the-art IT infrastruc-ture and telecom facilities have helped Tunisia emerge as a prominent outsourcing hub. The ICT and BPO environment is favorable and established.
9. Human Resource Effi ciency and Cost
Tunisia is a knowledge-based society and has what is needed for the outsourcing industry. In addition to its modern infrastructure, stable government, strong economy, accessible location, and most importantly, the availability of high-tech professionals at low costs, which
•
•
•
•
•
•
•
•
•
06_Africa_Report09_Tunisia.indd 14006_Africa_Report09_Tunisia.indd 140 2/25/09 4:21:56 PM2/25/09 4:21:56 PM

Country Report for Tunisia
141
OU
TS
OU
RC
IN
G
TO
A
FR
IC
Amake it an ideal market for the investors. Many European IT fi rms have set up operations here, as the cost of a Tunisian engineer is about 80 per cent lower than that in Europe. Tunisia seeks to attract 2,000 new outsourcing jobs this year to minimize its double-digit jobless rate. The government is committed:
To quote from a recent speech by President Zine El Abidine Ben Ali
“We are counting on our students, who are our most precious national resource and our strength for the future. We have opened the paths to knowledge for them and are doing all we can to boost their employability, with any holder of a baccalaureate eligible to go on to university. This is the option we have chosen for building a knowledge-based society”.
A Modern Educational System
Tunisia assigns a quarter of its budget and 7 per cent of GDP to education and is continually investing in the education system to meet the increasing needs of the economy.
Quality of the Educational System
Tunisia ranks fi rst among the fi fteen in this study. An independent assessment by the World Economic Forum shows the global position:
Quality of the Educational System
Rank Country Score
12 Tunisia 5.2
22 Germany 4.9
27 France 4.8
52 Spain 3.8
70 Turkey 3.5
77 Italy 3.4
90 Morocco 3.1
119 Egypt 2.5
(1 = does not meet the needs of a competitive economy)(7 = meets the needs of competitive economy)Global Competitiveness Report 2007–2008, Davos World Economic Forum
Magnitude of the Human Resource
There is a huge pool of skilled human resources. Over a period of just three decades, the number of students of higher education increased from 17,257 in 1975 to 335,649 in 2007. Female students accounted for 59.1 per cent of the student body in 2007.
06_Africa_Report09_Tunisia.indd 14106_Africa_Report09_Tunisia.indd 141 2/25/09 4:21:56 PM2/25/09 4:21:56 PM
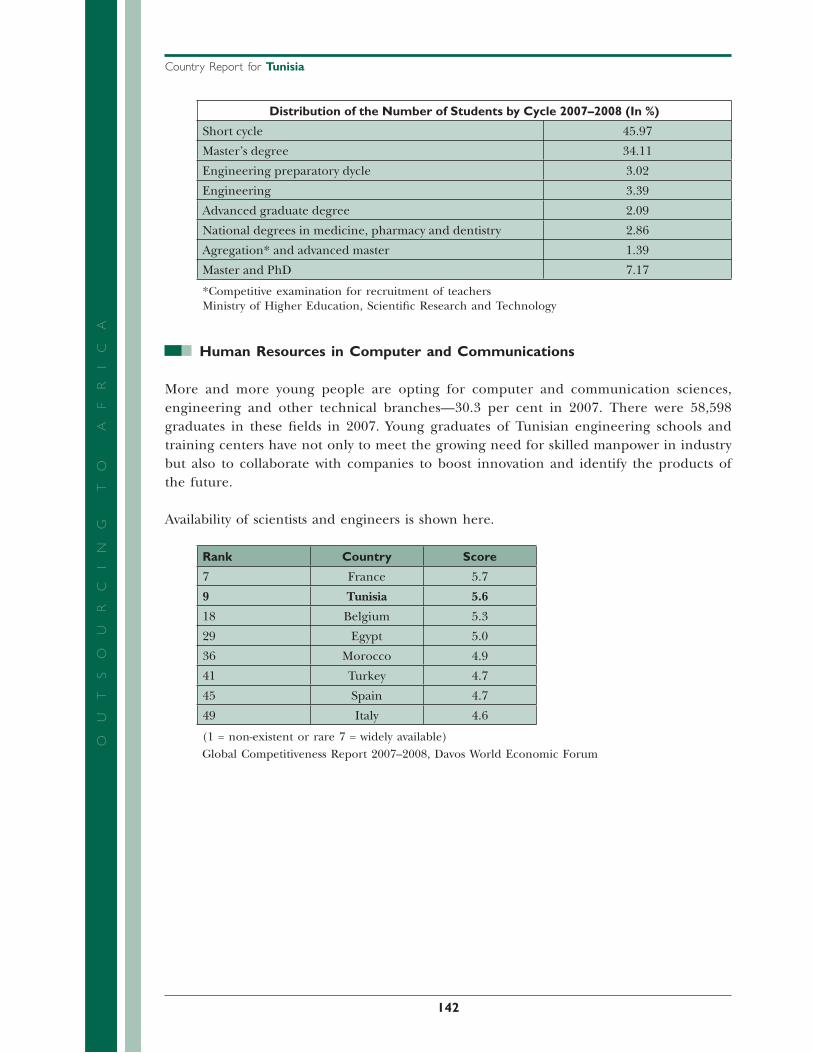
142
Country Report for Tunisia
OU
TS
OU
RC
IN
G
TO
A
FR
IC
ADistribution of the Number of Students by Cycle 2007–2008 (In %)
Short cycle 45.97
Master’s degree 34.11
Engineering preparatory dycle 3.02
Engineering 3.39
Advanced graduate degree 2.09
National degrees in medicine, pharmacy and dentistry 2.86
Agregation* and advanced master 1.39
Master and PhD 7.17
*Competitive examination for recruitment of teachersMinistry of Higher Education, Scientifi c Research and Technology
Human Resources in Computer and Communications
More and more young people are opting for computer and communication sciences, engineering and other technical branches—30.3 per cent in 2007. There were 58,598 graduates in these fi elds in 2007. Young graduates of Tunisian engineering schools and training centers have not only to meet the growing need for skilled manpower in industry but also to collaborate with companies to boost innovation and identify the products of the future.
Availability of scientists and engineers is shown here.
Rank Country Score
7 France 5.7
9 Tunisia 5.6
18 Belgium 5.3
29 Egypt 5.0
36 Morocco 4.9
41 Turkey 4.7
45 Spain 4.7
49 Italy 4.6
(1 = non-existent or rare 7 = widely available)Global Competitiveness Report 2007–2008, Davos World Economic Forum
06_Africa_Report09_Tunisia.indd 14206_Africa_Report09_Tunisia.indd 142 2/25/09 4:21:56 PM2/25/09 4:21:56 PM

Country Report for Tunisia
143
OU
TS
OU
RC
IN
G
TO
A
FR
IC
AQuality of Math and Science Education
The current study ranks Tunisia as the fi rst.
Rank Country Score
2 Belgium 6.3
6 France 5.7
7 Tunisia 5.6
36 Germany 4.8
42 Morocco 4.6
59 Italy 4.3
60 Turkey 4.3
69 Spain 3.9
106 Egypt 3.1
(1 = lag far behind most other countries’ schools, 7 = are among the best in the world)Global Competitiveness Report 2007–2008, Davos World Economic Forum
Targeted Vocational Training
In 2007, Tunisia’s vocational training system includes some 134 public centers throughout the country, providing training for 93,796 trainees in more than 336 specialties covering the full range of economic sectors.
Breakdown of trainees by level of training in 2007 is shown here.
Breakdown of Trainees by Level of Training in 2007
National Agency for Employment and Independent Work, 2008
Certificate of vocational aptitude (CAP)Certificate of vocational technician (BTP)Certificate of higher technician (BTS)Certificate of skills and certificateof professional trainingConventional apprenticeship8,926
22,479
24,94532,784
Total93,796
4,662
Skilled and Competitive Labor Force
A large number of young graduates are available on Tunisia’s job market. Their skills and qualifi cations in a wide range of technical fi elds are recognized worldwide, at very competi-tive costs. Illustrative costs are shown.
06_Africa_Report09_Tunisia.indd 14306_Africa_Report09_Tunisia.indd 143 2/25/09 4:21:56 PM2/25/09 4:21:56 PM
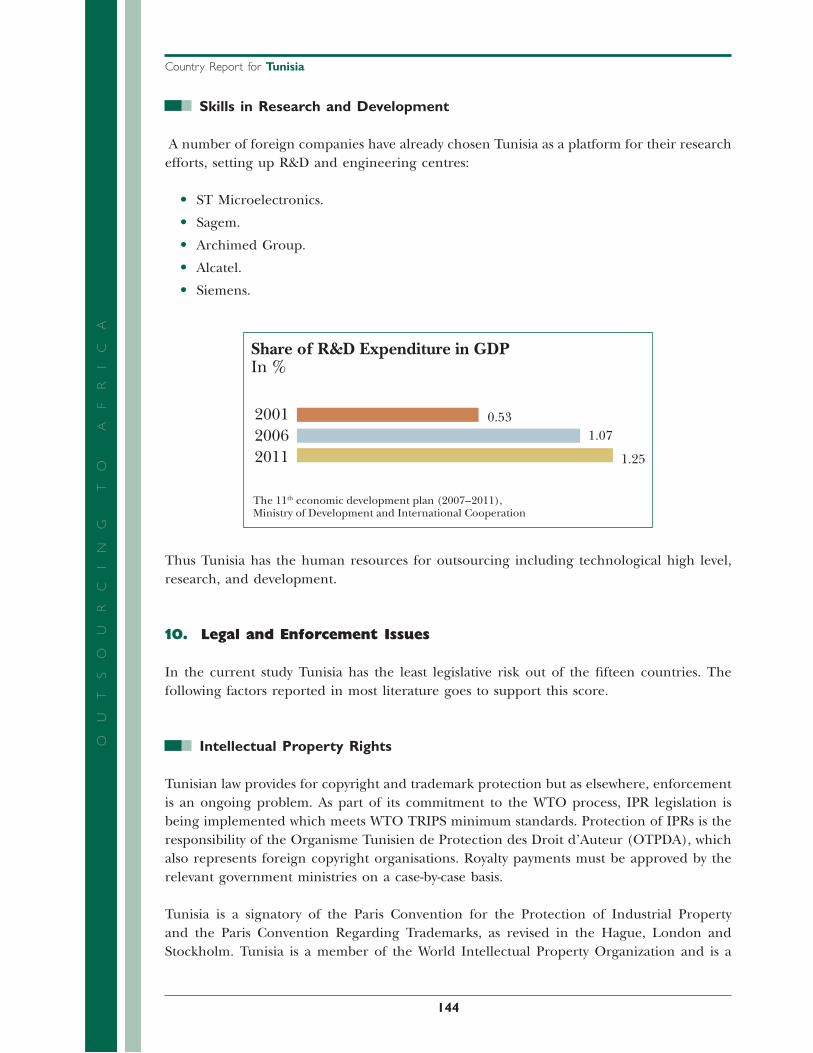
144
Country Report for Tunisia
OU
TS
OU
RC
IN
G
TO
A
FR
IC
ASkills in Research and Development
A number of foreign companies have already chosen Tunisia as a platform for their research efforts, setting up R&D and engineering centres:
ST Microelectronics.
Sagem.
Archimed Group.
Alcatel.
Siemens.
Share of R&D Expenditure in GDPIn %
The 11th economic development plan (2007–2011),Ministry of Development and International Cooperation
200120062011 1.25
1.070.53
Thus Tunisia has the human resources for outsourcing including technological high level, research, and development.
10. Legal and Enforcement Issues
In the current study Tunisia has the least legislative risk out of the fi fteen countries. The following factors reported in most literature goes to support this score.
Intellectual Property Rights
Tunisian law provides for copyright and trademark protection but as elsewhere, enforcement is an ongoing problem. As part of its commitment to the WTO process, IPR legislation is being implemented which meets WTO TRIPS minimum standards. Protection of IPRs is the responsibility of the Organisme Tunisien de Protection des Droit d’Auteur (OTPDA), which also represents foreign copyright organisations. Royalty payments must be approved by the relevant government ministries on a case-by-case basis.
Tunisia is a signatory of the Paris Convention for the Protection of Industrial Property and the Paris Convention Regarding Trademarks, as revised in the Hague, London and Stockholm. Tunisia is a member of the World Intellectual Property Organization and is a
•
•
•
•
•
06_Africa_Report09_Tunisia.indd 14406_Africa_Report09_Tunisia.indd 144 2/25/09 4:21:57 PM2/25/09 4:21:57 PM

Country Report for Tunisia
145
OU
TS
OU
RC
IN
G
TO
A
FR
IC
Asignatory of the UNCTAD agreement on the protection of patent and trademarks. Tunisia has withdrawn from the Madrid Agreement regarding trademarks.
Patent applications are examined by the Patent Offi ce only with regard to form and, while novelty of an invention is examined, merit is not. A patent application, together with the grant of a patent are published in the Offi cial Gazette. Opposition to a patent application must be fi led within two months of the date when the application was fi led. Applications for the issue of letters patent should be made before the invention has been published, used, or otherwise has received suffi cient publicity to allow it to be put into practice.
The protection period of a patented invention is twenty years from the date on which the patent application was fi led. Working of a patent is an offi cial requirement, and must be done for two consecutive years, starting within three years of the date on which the patent application was fi led or two years from the date on which the patent was granted. Nomi-nal working of a patent, by way of direct offer or solicitation, is suffi cient to meet the standards.
Rights in a patent may be transferred or assigned to third parties, including, by the laws of succession, to heirs.
The Tunisian Copyright Law of 1994 determined the copyright as the right of the owner of the work to have the exclusive right to copy the work in a material form, whatever its type, and to present his work to the public. The protected work may be literary, scientifi c, or artistic, whatever its value or the purpose for which it is prepared.
According to Article 18 of the Law, the copyright is valid during the author’s lifetime and continues for fi fty calendar years after the author’s death. The copyright with respect to photographic works is valid, according to Article 19, for twenty-fi ve calendar years as from the date of work completion. The copyrights are assignable by sale, wholly or partially, according to Article 22.
The law establishes the Tunisian Institution for the Protection of Copyright. The Institution has several functions, including the protection of copyright.
Any party which does not respect copyright as defi ned by the law, shall be obligated to pay damages to the owner of this right. The law also establishes monetary sanctions for viola-tions or infringements. A person who violates the law may be obliged to pay fi nes ranging from TD 500 to 5,000.
Legal Review
Tunisia is a Civil Law Republic, founded upon a constitution that embodies the principles of sovereignty of the people and separation of powers between the branches of government. The republic is divided into twenty-three regions, each of which has its own local govern-ment and is competent to conduct and manage local affairs.
06_Africa_Report09_Tunisia.indd 14506_Africa_Report09_Tunisia.indd 145 2/25/09 4:21:57 PM2/25/09 4:21:57 PM

146
Country Report for Tunisia
OU
TS
OU
RC
IN
G
TO
A
FR
IC
AJudiciary
Powers are vested in the Court of Justice (Cour de Cassation). The judicial branch of gov-ernment has criminal, administrative, and civil systems.
Civil Court System: The civil court system is divided into four levels; the District Courts, Courts of First Instance, Appeal Courts, and the Supreme Court.
District Courts have jurisdiction to hear matters the value of which does not exceed TD 7,000 as well as matters relating to nationality and labor issues. A single judge hears cases in the District Courts. Appeal of a judgement from a District Court is made to the Courts of First Instance.
A Court of First Instance is located in each of Tunisia’s twenty-three regions. The Courts of First Instance are vested with the power to hear all civil and commercial matters without regard to the monetary value of the claim, including divorces and applications for immediate relief in urgent matters. The Courts of First Instance also hear appeals of decisions from the District Courts. Each Court of First Instance is composed of a panel of three judges.
Cases which began in the Courts of First Instance may be appealed to the Appeal Courts. Appeals of District Court judgements decided by Courts of First Instance may not be appealed to the Appeal Courts, but, rather, relief may be sought from the Supreme Court.
The Appeals Courts have jurisdiction to hear appeals of decisions rendered by the Courts of First Instance except where the decision was an appeal from a decision of a District Court. The Appeal Courts cover several regions, and, therefore, cases from several Courts of First Instance are heard by the same Appeals Court.
Supreme Court: The Tunisian Supreme Court examines decisions appealed from either the Appeals Court or from the Courts of First Instance sitting in its appellate capacity to determine whether the law was correctly applied by the lower court. The Supreme Court does not examine the substantive aspects of the case on appeal, and only points of law may be appealed to it. Submitting a matter to the review of the Supreme Court does not automatically stay execution of the original judgement. A stay of execution may be granted by the First President of the Supreme Court; the applicant making the motion for such a stay must deposit a bond with the court to secure the judgement.
In the event that the Supreme Court voids a lower court judgement, the matter is resub-mitted to another judge or panel of judges of the court which rendered the original judgement. For example, a judgement from the Appeals Court covering several regions would be resubmitted to an Appeals Court covering a different area. In the event that the court, on re hearing the matter, fails to comply with the ruling of the Supreme Court regarding the application of law, the matter is heard by the full panel of the Supreme Court whose decision on the case is binding.
The criminal court system is very similar in structure to the civil court system. Misde-meanor offenses are handled by the District Courts, while all other criminal offenses, except felonies, are submitted to the Courts of First Instance for determination. Felony crimes are submitted to the criminal courts division of the Appeal Courts after an
•
•
06_Africa_Report09_Tunisia.indd 14606_Africa_Report09_Tunisia.indd 146 2/25/09 4:21:57 PM2/25/09 4:21:57 PM
Country Report for Tunisia
147
OU
TS
OU
RC
IN
G
TO
A
FR
IC
Aindictment is issued by a judge based on the fi ndings of the grand jury (Chambre dMises en Accusation).
The administrative court system is responsible for resolving disputes between individu-als and the government and any governmental subdivision or agency.
11. Labour and Expatriate Worker's Permits
Employment relations in Tunisia are governed by the Labor Code of 1956. Labor contracts may be for a defi nite or an indefi nite period of time. A defi nite period contract may specify that it is valid for either a limited period of time or for a specifi c task. If the parties con-tinue such a contract after the agreed expiration date, then it becomes a contract for an indefi nite period.
A labor contract may be terminated by agreement of the contracting parties or as a result of resignation or dismissal of the employee. In the latter case, the employee is entitled to severance pay. The Labor Code sets standards regarding other employment conditions, such as the maximum number of work hours per week, the minimum wage level, overtime work rate, and annual leave. Regional labor inspectors are responsible for the enforcement of such regulations. Worker health and safety standards are regulated and enforced by the Social Affairs Ministry.
Foreign Labor
The law providing incentives to foreign investors has granted wide employment facilities for expatriate personnel. For instance, foreign managers acting in their capacity as employ-ers are not required to hold a work contract, and their company or enterprise may, with a simple declaration to the appropriate authorities, hire up to four expatriate technicians who may choose either a foreign social security system or the Tunisian system to which they must contribute a fi xed amount set at 20 per cent of their gross income.
Social security payments in respect of Tunisian employees are paid by the employer who contributes 20 per cent of the employee’s wage to the system and deducts 6.25 per cent from the employee’s wages for this purpose to be paid on the employee’s behalf.
12. Revenue, Tax and Repatriation Issues
Taxation: The maximum business tax rate is fi xed at 35 per cent; however, to encourage Tunisian fi rms to list on the stock exchange, the government has instituted tax incentives which reduce corporate tax to 20 per cent for companies with at least 30 per cent of their shares listed. Maximum tariff rates on imports can be as high as 230 per cent for some goods, and there are also a wide range of non-tariff barriers on imports, especially for non-capital items. Consumer items are also liable for a consumption tax that can be as high as 700 per cent, and all imported goods are subject to a customs formality
•
06_Africa_Report09_Tunisia.indd 14706_Africa_Report09_Tunisia.indd 147 2/25/09 4:21:58 PM2/25/09 4:21:58 PM

148
Country Report for Tunisia
OU
TS
OU
RC
IN
G
TO
A
FR
IC
Afee of 3 per cent of the total duties paid. There is a three-tier VAT rate of 29 per cent, 18 per cent, and 6 per cent, with most goods being covered by the 18 per cent rate. Tax relief to encourage investment includes relief on re-invested revenues and profi ts, a reduction of VAT to 10 per cent on many imported capital goods, and improved depreciation schedules for production equipment. Companies producing over 80 per cent for export receive 100 per cent tax exemption for the fi rst 10 years and a 50 per cent reduction thereafter, as well as duty-free import of capital goods and tax/duty exemption for raw materials and semi-fi nished goods used in the business.
Tunisia simplifi ed its tax system and reduced tax rates, with a fi xed maximum rate of 35 per cent. Banking and fi nancial sectors were partly liberalized and restruc-tured. Some public companies were privatized and foreign trade and domestic prices de-controlled.
Financing and funds transfer: The fi nancial markets, which have shown signifi cant recent growth, comprise a semi-privatised stock exchange and a variety of bond and mixed bond/stock funds. The exchange lists about fi fty companies, but the lack of secondary markets has limited the potential of the exchange to become an important vehicle for obtaining capital. While credit is usually available, and the banking system is sound, interest rates can be relatively high and a generally conservative bank sector is often reluctant to deal with newer fi rms. The opening of the fi nancial sector to com-petition in 2001 is expected to substantially improve the situation. Although interest rates have been offi cially deregulated they are not yet market-determined in practice. Trading operates around a rate established by the central bank based on a basket of currencies. However, commercial banks are permitted to participate in the foreign exchange market, and the currency is fully convertible for current account transactions. Foreign investors may transfer returns on investments without authorization. Tunisia is a member of the International Centre for the Settlement of Investment Disputes.
Foreign Currency Control: Foreign exchange controls in Tunisia are regulated by the Foreign Trade and Foreign Exchange Code of 1976. The government has undertaken a review of the code and is in the process of instituting liberalization changes. The Tunisian Dinar is not fully convertible to foreign currencies; however, in recent years Tunisia has relaxed foreign exchange control provisions regarding current account transactions. A currency account transaction law was enacted in 1993 which incorpo-rates liberalizing provisions in this regard. Today the Tunisian Dinar is commercially convertible for all bona fi de trade and investment operations. Foreign investors in Tunisian companies are entitled to repatriation capital and may receive dividends in foreign currency.
In the area of import of goods, all import documents which involve payments must be handled through authorized banks. Foreign currency may be purchased from the Central Bank of Tunisia (CBT) or from banks which have been designated by the CBT for the payment of imports, subject to licensing restrictions and provided that the license has been obtained prior to importation.
Payments for exports received in foreign currency ordinarily must be repatriated within ten days of payment. Capital transfers are subject to the approval of the CBT.
•
•
06_Africa_Report09_Tunisia.indd 14806_Africa_Report09_Tunisia.indd 148 2/25/09 4:21:58 PM2/25/09 4:21:58 PM

Country Report for Tunisia
149
OU
TS
OU
RC
IN
G
TO
A
FR
IC
ANon- residents are allowed to repatriate invested capital and net proceeds of such invest-ment in foreign currency.
Banking: The CBT monitors the commercial, development, and investment banks oper-ating in Tunisia. The commercial banks provide short and mid-term credit. Develop-ment banks grant only long-term credit for the fi nancing of large scale projects in tourism, agriculture, and industry. Investment banks, which were recently created, are responsible for promoting investment projects and managing capital risks.
New legislation enacted in 1994 is aimed at broadening the range of banking services and products available, easing restrictions regarding loan approvals, and increasing competition in the banking industry. These new laws also created a new type of bank-ing category which specializes in providing fi nancial management banking services for business enterprises.
13. Investment Policy and Incentives
Free investment: Investment is free for Tunisian citizens and foreigners in most sectors. In general, a foreign investor can hold up to 100 per cent of capital in a given initiative without having to obtain authorization.
Major Investment Incentives
The Investment Incentives Law offers many advantages. Additional incentives can be awarded for investments that are of particular interest for the economy or for areas along the border.
Tax breaks Export income and agriculture projects enjoy a full exemption of income tax for ten years, and the projects established in regional development zones benefi t from fi ve or ten years of exemption according to the zone’s priority.
Subsidies In regional development zones, capped subsidies can reach 8, 15, or 25 per cent of the project cost according to the zone’s priority and 7 per cent for agricultural projects.
Assumption of employer’s cost Total or partial, for several years, for recruitment of new graduates, jobs created in regional development zones, or employment of more than one team.
Assumption of certain infrastructure costs
For certain agricultural activities and projects in regional development zones.
Investment Incentives
Tunisia has enacted several laws to encourage foreign investment in the industrial, agricul-tural and tourism sectors. Legislation promoting foreign investment in the service sector has been drafted and may be adopted by the government.
•
06_Africa_Report09_Tunisia.indd 14906_Africa_Report09_Tunisia.indd 149 2/25/09 4:21:58 PM2/25/09 4:21:58 PM

150
Country Report for Tunisia
OU
TS
OU
RC
IN
G
TO
A
FR
IC
AForeign investors wishing to invest in these sectors under the enabling legislation may do so through the form of a partnership (Association of Person) or as either a public or private company (Association of Capital).
In order to promote economic growth, narrow existing trade imbalances, and increase exports, Tunisia offers extensive investment incentives. These incentives have been available since the 1970s. The Investment Incentives Code, which became effective in January 1994, promotes these goals. The Investment Incentives Code offers two types of incentives. The fi rst kind of investment incentives is applied to all investment projects, except projects relat-ing to mining, energy, and fi nance. The second kind of investment incentives is reserved for projects engaged in specifi ed fi elds or projects of a special nature.
All investment projects, except projects relating to mining, energy, and fi nance are entitled to the following investment incentives:
A deduction from taxable income, of up to 35 per cent of net income or profi ts, for income or profi ts reinvested in share capital or invested in capital increase.
A suspension of VAT and sales tax on locally produced equipment.
A reduction of 10 per cent from customs duties and the suspension of VAT and sales taxes on imported equipment for which there is no Tunisian manufactured substitute.
An option to apply an installment method of depreciation for production plants and equipment, excluding offi ce equipment, having a life expectancy of more than seven years.
The second kind of investment incentives is available to investment projects in the fi eld of exporting (whether in whole or in part), regional development projects, or projects engaged in agriculture, environmental protection, research and development, and new small enterprises. The investment incentives are substantial and vary depending on the fi eld in which the enterprise engages and the industry concerned. A brief overview of some of the incentives available follows:
A full deduction of income or profi ts from taxable income or corporate taxable income for a period of ten years, and a reduction of up to 50 per cent beginning in the elev-enth year.
A full tax allowance in respect of profi ts reinvested in share capital or in the increase of the company’s registered share capital.
A full tax allowance in respect of profi ts reinvested in the company.
Financial support for amounts paid for social security levies.
Investment bonuses equal to 8 per cent of the cost of the investment made.
The option to elect a fl at-tax rate of 20 per cent of gross earnings.
In addition to the incentives available under the Investment Incentives Code, non-residents enjoy the tax-free transfer of capital invested in the investment project and the profi ts arising as a result thereof. Also, non-residents may freely repatriate their profi ts and capital upon the sale of their holdings in such investment projects.
•
•
•
•
•
•
•
•
•
•
06_Africa_Report09_Tunisia.indd 15006_Africa_Report09_Tunisia.indd 150 2/25/09 4:21:58 PM2/25/09 4:21:58 PM
Country Report for Tunisia
151
OU
TS
OU
RC
IN
G
TO
A
FR
IC
AThe High Commission for Investments is authorized to grant further incentives to investment projects deemed to be of special or signifi cant importance. Such benefi ts may take the form of exemptions from income tax or corporate tax for a period up to fi ve years, state-funded contri-butions to the costs of infrastructure development, an investment bonus of up to 5 per cent of the total investment in the project, or the suspension of tariffs and taxes levied on equipment.
Free Trade Zones
Over 130 companies have submitted requests to invest in Tunisia’s two free trade zones. Sixty companies, of which fi fty are foreign, made requests to operate in the Bizerte Harbor Free Trade Zone located sixty kilometers north of Tunis. Most of these companies are French, but requests have also come from American, German, British, Danish, Belgian, Japanese, Indonesian, and Egyptian companies. These foreign companies are seeking to invest in the electronics, metals, pharmaceuticals, and food industries.
The second free trade zone, in Zarzis Harbor, is 450 kilometres south of Tunis, near the Libyan border. Over seventy foreign companies have already submitted requests to invest in this zone, most of them French. The Zarzis zone spans over 380,000 square metres. Twenty million dollars have been invested to establish this zone, part of which will be utilized to expand the harbor facilities at Zarzis. The harbor is currently used to import oil from Libya, among other activities.
Customs
Since March 1994 and the enactment of Law No. 94-41, which embodies the policy of the free trade principle adopted in other liberalization measures, Tunisia has allowed the free importa-tion and exportation of goods, with the exception of restrictions relating to national security, public order, health and hygiene, and the protection of fl ora, fauna, and natural heritage.
Tunisia’s basic tariff rate ranges from 10 per cent to 43 per cent. In addition, several years ago Tunisia imposed a temporary supplemental duty on certain imports that compete with locally produced goods. This duty was originally scheduled to be phased out at the end of 1994 but remains in effect.
14. Overall Assessment and Recommendations
Tunisia is topping in infrastructure and doing very well in people and skills. It has very good links with Europe. A bit of introspection on taxes and a greater focus on outsourcing invest-ment among all other investments will make Tunisia go much further.
15. Government Agencies Giving Support to Outsourcing
Foreign Investment Promotion Agency FIPA-Tunisia as per contact details are shown here.
06_Africa_Report09_Tunisia.indd 15106_Africa_Report09_Tunisia.indd 151 2/25/09 4:21:59 PM2/25/09 4:21:59 PM

152
Country Report for Tunisia
OU
TS
OU
RC
IN
G
TO
A
FR
IC
A16. Contact Details
Foreign Investment Promotion Agency FIPA-Tunisia
Tunisia
Rue Salaheddine EI Ammami
1004 Tunis
Tel: (+216-71) 752540; Fax: (+216-71) 231400
E-mail: bic.fi [email protected]
Website: http://www.investintunisia.tn
Brussels
31/33, rue Montoyer, Bte 4
1000 Bruxelles
Tel: (+32-2) 5129327; Fax: (+32-2) 5111757
E-mail: fi [email protected]
Cologne
Hohenstaufenring 44-46
50674 Koln
Tel: (+49-221) 2403346/2403347; Fax: (+49-221) 2403446
E-mail: fi [email protected]
London
63-66 Hatton Garden
London EC1N 8LE
Tel: (+44-0207) 4301315; Fax: (+44-0207) 4301400
E-mail: London@fi pa.co.uk
Madrid
Avenida Alfonso XIII, N 68
28016 Madrid
Tel: (+34-91)4473512/4473518; Fax: (+34-91) 5938416
E-mail: [email protected]
Milan
Via M. Gonzaga, 5
(Piazza Missori)
20123 Milano
Tel: (+39-02) 8092/809298; Fax: (+39-02) 809353
E-mail: fi [email protected]
06_Africa_Report09_Tunisia.indd 15206_Africa_Report09_Tunisia.indd 152 2/25/09 4:21:59 PM2/25/09 4:21:59 PM
Country Report for Tunisia
153
OU
TS
OU
RC
IN
G
TO
A
FR
IC
AParis
8, rue de la Bienfaisance
75008 Paris
Tel: (+33-01) 45226857; Fax: (+33-01)45226853
E-mail: [email protected]
Embassy of Tunisia in China, France, Germany, India, UK, USA
Tunisian Embassy in Beijing, China
1 Sanlitun Dong Lu
City: Beijing
Tel: (+86) 10-65322435/(+86) 10-65322436; Fax: (+86) 10-65325818
Consulate General of Tunisia in Nanterre, France
101, Avenue Jean Lolive-93502 Pantin
City: Nanterre
Tel: 01.48.91.61.00; Fax: 01.48.91.39.51
Tunisian Embassy in Paris, France
25, rue Barbet de Jouy-75007
City: Paris
Tel: 01.45.55.95.98; Fax: 01.45.56.02.64
Email: [email protected]
Website: http://www.amb-tunisie.fr/
Tunisian Embassy in Grenoble, France
4, rue Alexandre 1er de Yougoslavie-38000
City: Grenoble
Tel: 04.76.43.26.01; Fax: 04.76.43.25.96
Email: [email protected]
Consulate General of Tunisian in Lyon, France
14, avenue du Marechal Foch-69453 Cedex 06
City: Lyon
Tel: 04.78.93.42.87; Fax: 04.72.44.05.90
Email: [email protected]
Tunisian Consulate in Marseille, France
8, boulevard d’Athènes-13001
City: Marseille
Tel: 04.91.50.28.68; Fax: 04.91.08.59.69
06_Africa_Report09_Tunisia.indd 15306_Africa_Report09_Tunisia.indd 153 2/25/09 4:21:59 PM2/25/09 4:21:59 PM
154
Country Report for Tunisia
OU
TS
OU
RC
IN
G
TO
A
FR
IC
AConsulate General of Tunisia in Nice, France
18, avenue des Fleurs-06000
City: Nice
Tel: 04.93.96.81.81; Fax: 04.93.37.63.02
Consulate General of Tunisia in Paris, France
19, rue de Lubeck-75016
City: Paris
Tel: 01.53.10.69.10; Fax: 01.47.04.27.79
Consulate General of Tunisia in Toulouse, France
19, allée Jean-Jaurès-31000
City: Toulouse
Tel: 05.61.63.61.61; Fax: 05.61.63.48.00
Tunisian Consulate in Strasbourg, France
6, rue Schiller
City: Strasbourg
Tel: (+33) 3-88365275; Fax: (+33)3-88371871
Email: [email protected]
Embassy of Tunisia in Germany
Lindenallee 16
City: Berlin
Tel: (+49) 30-36-41-07-0; Fax: (+49) 30-308-20-683
Consulate of Tunisia in Germany
Godesberger Allee 103
City: Bonn
Tel: (+49) 228-8-48-96-00; Fax: (+49) 228-8-48-97-00
Overbeckstraýe 19
City: Hamburg
Tel: (+49) 40-226-926-3; Fax: (+49) 40-2-27-97-86
Embassy of Tunisia in Hungary
Pusztaszei út 24/A
City: Budapest
Tel: (+36) 1-3361616/(+36) 1-3361617; Fax: (+36) 1-3257291
Email: [email protected]
06_Africa_Report09_Tunisia.indd 15406_Africa_Report09_Tunisia.indd 154 2/25/09 4:21:59 PM2/25/09 4:21:59 PM
Country Report for Tunisia
155
OU
TS
OU
RC
IN
G
TO
A
FR
IC
A29 Princes Gate
London SW7 1QG
City: London
Tel: 004420-(7)5848117; Fax: 004420-(7)225 2884
Email: [email protected]
Tunisian Embassy in Washington, United States
Embassy of Tunisia in USA
1515 Massachusetts Avenue, NW, 20005
City: Washington
Tel: (+202) 862-1850; Fax: (+202) 862-1858
Useful Links
The World Factbook 2007. https://cia.gov/cia//publications/factbook/geos/ts.html
SURVEY OF ICT AND EDUCATION IN AFRICA: Tunisia Country Report
Tunisia–11.
http://www.infodev.org
Offi cial Portal of the Ministry of Education and Training.
http://www.edunet.tn
Education Act.2002. Edunet. http://www.edunet.tn/ressources/reforme/orientationan.pdf
Information and Communication technologies in Tunisia-Main Achivements. Ministry of Communication Technologies.
http://www.infocom.tn/index.php?id=199
Selected ICT Priority Issues.
http://www.libc.net/CMS/uploadedfi les/Publications/ICTPrty_2002.pdf
The National Institute of Bureautics and Computing.
http://www.inbmi.edunet.tn
World Education News & Reviews.
http://www.wes.org/ewenr
El Khawarizmi Calculus Center.
http://www.cck.rnu.tn
The Virtual University of Tunis.
http://www.obhe.ac.uk
06_Africa_Report09_Tunisia.indd 15506_Africa_Report09_Tunisia.indd 155 2/25/09 4:21:59 PM2/25/09 4:21:59 PM

156
Country Report for Tunisia
OU
TS
OU
RC
IN
G
TO
A
FR
IC
AThe Tunisian Virtual School.
http://www.evt.edunet.tn
The Virtual University of Tunis.
http://www.uvt.rnu.tn
Global Challenges of eDevelopment.
http://www.uta.fi /jour/global/hietanen2.pdf
06_Africa_Report09_Tunisia.indd 15606_Africa_Report09_Tunisia.indd 156 2/25/09 4:22:00 PM2/25/09 4:22:00 PM

157
OU
TS
OU
RC
IN
G
TO
A
FR
IC
A
Country Report for Morocco
Disclaimer
This short Country Report, a result of a larger Survey of ICT Outsourcing in Africa, provides a general overview of current activities and issues related to ICT Outsourcing in the country. The data presented here should be regarded as illustrative rather than exhaustive. ICT Outsourcing is at a particularly dynamic stage in Africa; with new developments and announcements happening on a daily basis somewhere or the other on the continent. Therefore, these reports should be seen as 'snapshots' that were current at the time they were taken; it is expected that certain facts and fi gures presented may become outdated very quickly.
The fi ndings, interpretations and conclusions expressed herein are a faithful representation of the respondents of the interviews and secondary data collected from the countries and published literature. Strict analysis has been carried out with the minimal infl uence of the authors/team members. References to data sources have been made as far as possible. In the case of the detailed data parameters used for scores, and ranking, the same data source and timeline has been used for all the fi fteen countries compared. In the descriptive section of the country reports all data received from the individual country has been used in order to give as complete an assessment as possible. Thus these countries that have provided more information have a better coverage than those who have not been able to provide data to the research team.
Board of Executive Directors of the CBC or Cyber Media cannot guarantee the accuracy of the data included in this work. The boundaries, colours, denominations, and other information shown on any map in this work do not imply on the part of the CBC and Cyber Media any judgement of the legal status of any territory or the endorsement or acceptance of such boundaries.
It is expected that individual Country Reports from the Survey of ICT Outsourcing in Africa will be updated in an iterative process over time based on additional research and feedback received through the CBC and Cyber Media website.
0 100 200km
0 100 200mi
2828
32
3636
12
32
12 8
8 4
Tangier
Casablanca MohammediaEl Jadida
SafiMarrakech
OuarzazateAgadir
Sebkha Tah
JbelToubkal
Mediterranean SeaStrait of Gibraltar
NORTHATLANTIC OCEAN
MeknèsFès
Oujda
BouArfa
Tarfaya
MAUR.Western Sahara
SPAINPORT.
KenitraMelilla (SP.)
Ceuta (SP.)Tétouan
RABAT
ALGERIA
07_Africa_Report09_Morocco.indd 15707_Africa_Report09_Morocco.indd 157 2/25/09 4:22:34 PM2/25/09 4:22:34 PM
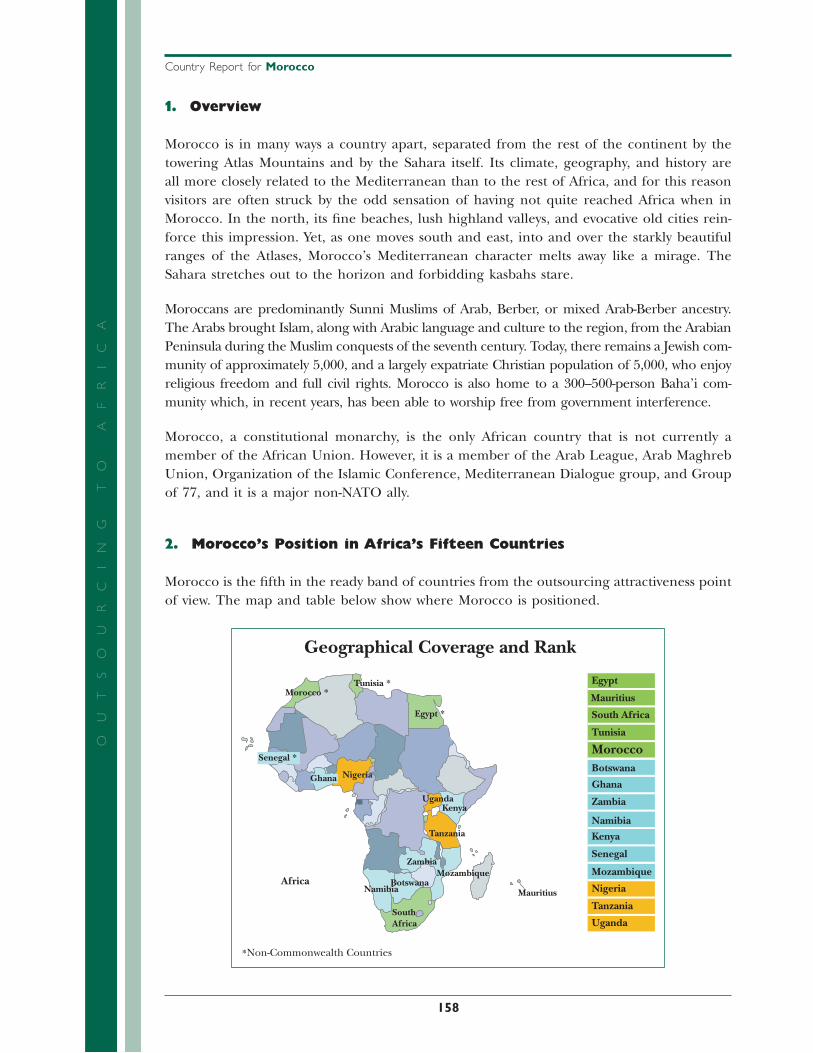
158
Country Report for Morocco
OU
TS
OU
RC
IN
G
TO
A
FR
IC
A1. Overview
Morocco is in many ways a country apart, separated from the rest of the continent by the towering Atlas Mountains and by the Sahara itself. Its climate, geography, and history are all more closely related to the Mediterranean than to the rest of Africa, and for this reason visitors are often struck by the odd sensation of having not quite reached Africa when in Morocco. In the north, its fi ne beaches, lush highland valleys, and evocative old cities rein-force this impression. Yet, as one moves south and east, into and over the starkly beautiful ranges of the Atlases, Morocco’s Mediterranean character melts away like a mirage. The Sahara stretches out to the horizon and forbidding kasbahs stare.
Moroccans are predominantly Sunni Muslims of Arab, Berber, or mixed Arab-Berber ancestry. The Arabs brought Islam, along with Arabic language and culture to the region, from the Arabian Peninsula during the Muslim conquests of the seventh century. Today, there remains a Jewish com-munity of approximately 5,000, and a largely expatriate Christian population of 5,000, who enjoy religious freedom and full civil rights. Morocco is also home to a 300–500-person Baha’i com-munity which, in recent years, has been able to worship free from government interference.
Morocco, a constitutional monarchy, is the only African country that is not currently a member of the African Union. However, it is a member of the Arab League, Arab Maghreb Union, Organization of the Islamic Conference, Mediterranean Dialogue group, and Group of 77, and it is a major non-NATO ally.
2. Morocco’s Position in Africa’s Fifteen Countries
Morocco is the fi fth in the ready band of countries from the outsourcing attractiveness point of view. The map and table below show where Morocco is positioned.
Morocco *
Morocco
Tunisia *
Geographical Coverage and Rank
Tunisia
Egypt *
Egypt
Senegal *
Senegal
GhanaGhana
Nigeria
Nigeria
Uganda
Uganda
Kenya
KenyaTanzania
Tanzania
Zambia
Zambia
Mozambique MozambiqueBotswana
Botswana
Namibia
Namibia
SouthAfrica
South Africa
MauritiusAfrica
*Non-Commonwealth Countries
Mauritius
07_Africa_Report09_Morocco.indd 15807_Africa_Report09_Morocco.indd 158 2/25/09 4:22:35 PM2/25/09 4:22:35 PM

Country Report for Morocco
159
OU
TS
OU
RC
IN
G
TO
A
FR
IC
AContributing scores and ranks are as under.
Overall
Band Score (PS & BE) Rank in band
Ready 6.43 Fifth
Infrastructure
Score Rank Band
6.7 Fourth Ready
While achieving the fourth position, Morocco has scored the fi rst fi ve ranks for six out of nine parameters that go towards this lower level abstraction. Morocco is the best in avail-ability and International Internet bandwidth; in electricity availability the country is third, fourth in road and rail transport, and fi fth in network readiness. At the other end, space and facilities are expensive in Morocco with a rank of twelve out of fi fteen.
People and Skills (PS)
Score Rank
3.173 7
In the case of ‘People and Skills’, Morocco comes seventh with fourth position in the quan-tity and quality of human resources, and fi fth in Education, language, and domain skills. At the other end the cost of living is in the fi fteenth place and the cost of human resources at the thirteenth position.
Business Environment (BE)
Score Rank
3.261 7
In this lower level abstraction, Morocco is seventh. In achieving this position it is third in the share of services in exports, geopolitical risk and currency risk; fourth in share of ICT in exports, share of ICT in services, and foreign exchange reserves. At the other end tax rates, and ease and cost of fi nance are at the thirteenth and fourteenth position.
07_Africa_Report09_Morocco.indd 15907_Africa_Report09_Morocco.indd 159 2/25/09 4:22:35 PM2/25/09 4:22:35 PM

160
Country Report for Morocco
OU
TS
OU
RC
IN
G
TO
A
FR
IC
A3. Country, Political and Economic Profi le
The Kingdom of Morocco is situated in North Africa, with a long coast on the Atlantic Ocean that reaches past the Strait of Gibraltar into the Mediterranean Sea. Its climate, geography, and history are all more closely related to the Mediterranean than to the rest of Africa.
Salient features are as follows:
Area: 446,550 sq km (172,413 sq mi).
Cities: Rabat (capital), Casablanca, Marrakech, Fes, Meknes, Tangier.
Terrain: Coastal plains, mountains, desert.
Climate: Mediterranean to more extreme in the interior and south.
Population: (2007) 33,757,175. (The population of the disputed territory of Western Sahara is 350,000.)
Education: Years compulsory—9. Literacy (age 15 and over can read and write)—total population 51.7%; female 39.4% (2003 est.).
Government Type: Parliamentary democracy.
Independence: 2 March 1956.
Branches: Executive—King (head of state), Prime Minister (head of government).
Legislative: Bicameral Parliament.
Morocco is divided into sixteen administrative regions (further broken into provinces and prefectures); the regions are administered by Walis (governors) appointed by the king.
The Moroccan constitution provides for a monarchy with a parliament and an inde-pendent judiciary. Ultimate authority rests with the king.
The king presides over the Council of Ministers; appoints the prime minister following legislative elections; appoints all members of the government taking into account the prime minister’s recommendations; and may, at his discretion, terminate the tenure of any minister, dissolve the parliament, call for new elections, or rule by decree.
The king is the commander-in-chief of the military and holds the title of Amir al-Mou’minin, the country’s religious leader.
Since the constitutional reform of 1996, the bicameral legislature consists of a lower chamber called the Chamber of Representatives, which is directly elected, and an upper chamber, the Chamber of Counsellors, whose members are indirectly elected through various regional, local, and professional councils.
In order to create employment opportunities, the government is promoting investment in the tourism, industrial, fi shing, and service industries, and is ameliorating, restructur-ing, and modernizing the education system.
Parliamentary elections were held in September 2007. Abbas El Fassi was designated to form a new government.
•
•
•
•
•
•
•
07_Africa_Report09_Morocco.indd 16007_Africa_Report09_Morocco.indd 160 2/25/09 4:22:36 PM2/25/09 4:22:36 PM

Country Report for Morocco
161
OU
TS
OU
RC
IN
G
TO
A
FR
IC
AEconomy
Macroeconomic stability, coupled with low infl ation and relatively slow economic growth, has characterized the Moroccan economy over the past several years. The government continues to pursue reform, liberalization, and modernization aimed at stimulating growth and creat-ing jobs. Employment, however, remains overly dependent on the agriculture sector, which is extremely vulnerable to inconsistent rainfall. Morocco’s primary economic challenge is to accelerate growth in order to reduce high levels of unemployment and underemployment. While overall unemployment stands at 7.7 per cent, this fi gure masks signifi cantly higher urban unemployment which is as high as 33 per cent.
The current government is continuing a series of structural reforms begun in recent years. The most promising reforms have been in the labour market and fi nancial sectors, and privatization has accelerated the sale of Global System for Mobile Communications (GSM) licenses in recent years. Morocco also has liberalized rules for oil and gas exploration and has granted concessions for many public services in major cities. The tender process in Morocco is becoming increasingly transparent. Many believe, however, that the process of economic reform must be accelerated in order to reduce urban unemployment.
GDP (2006): $56.72 billion.
Per capita GDP (PPP) (2006): $4,400.
Industry: Phosphate mining, manufacturing and handicrafts, construction and public works, energy.
Sector Information as percentage of GDP (2006): Agriculture 13.3%, industry 31.2%, services 55.5%.
Monetary unit: Moroccan dirham.
Trade: Exports—$11.72 billion (2006).
Major markets: EU 71.5%, India 4.1%, US 2.6%, and Brazil 2.4%.
Imports: $21.22 billion (2006).
Major partners: EU 52.1%, Saudi Arabia 4.8%, Russia 6.7%, China 5.2%, U.S. 3.4%.
Natural resources: Phosphates, fi sh, manganese, lead, silver, and copper.
Agriculture products: Barley, citrus fruits, vegetables, olives, livestock, and fi shing.
Economy: Macroeconomic stability, coupled with low infl ation and relatively slow economic growth, has characterized the Moroccan economy over the past several years.
Foreign exchange: Foreign exchange reserves are strong, with over $16 billion in reserves, the equivalent of eleven months of imports at the end of 2005. The combination of strong foreign exchange reserves and active external debt management gives Morocco ample capacity to service its debt. Current external debt stands at about $17.9 billion.
Government and Political Condition
Morocco is an Islamic, democratic, and social constitutional monarchy with a king, executive branch, bicameral legislature, and judiciary branch.
07_Africa_Report09_Morocco.indd 16107_Africa_Report09_Morocco.indd 161 2/25/09 4:22:36 PM2/25/09 4:22:36 PM

162
Country Report for Morocco
OU
TS
OU
RC
IN
G
TO
A
FR
IC
AThe king is considered the Supreme Representative of the Nation, the symbol of its unity and Defender of the Faith. He is entrusted with protecting the rights and liberties of all citizens, social groups, and organizations. His powers include appointing the prime minister and cabinet members, presiding over cabinet meetings, promulgating laws, dissolving parlia-ment, addressing the nation and parliament, issuing royal decrees, commanding the Royal Armed Forces, and being in charge of foreign policy, presiding over the Supreme Magistrate Council, appointing judges, and granting pardons. The crown is passed down to the eldest son unless the king names a different successor during his lifetime. The closest male relative is chosen if the past king did not have sons and did not appoint another successor.
The Regent Council
The Regent Council performs the constitutional roles of the king until he reaches the age of sixteen and serves as an advisory board until he turns twenty.
Legislative
The legislature consists of the House of Representatives and the House of Counsellors. House of Representatives members are elected to six-year terms. For the House of Counsellors, two-fi fths of members are elected by the people and three-fi fths are chosen by regional electoral colleges for nine-year terms. The legislature’s powers include voting on laws, determining crimes and penalties, determining the statute of magistrates and pubic offi ces, determining the electoral system of local assemblies and councils, establishing new public agencies, and nationalizing enterprises.
Executive
The prime minister is selected by the king and ensures the execution of laws. His powers include introducing bills, the co-ordination of ministerial activities, and other administrative tasks.
Judiciary
The king appoints magistrates based on recommendations of the Supreme Magistrate Council. They are independent of the legislative and executive branches and cannot be removed. The High Court of Justice, which consists of an equal number of legislators from both the House of Representatives and House of Counsellors, conducts trials for government mem-bers accused of crimes.
Principal political parties: Socialist Union of Popular Forces (USFP), Istiqlal (Independ-ence) Party (PI), Party of Justice and Development (PJD), National Rally of Independents (RNI), Popular Movement (MP), National Popular Movement (MNP), Constitutional
•
07_Africa_Report09_Morocco.indd 16207_Africa_Report09_Morocco.indd 162 2/25/09 4:22:36 PM2/25/09 4:22:36 PM
Country Report for Morocco
163
OU
TS
OU
RC
IN
G
TO
A
FR
IC
AUnion Party (UC), Democratic Forces Front (FFD), National Democratic Party (PND), Party of Progress and Socialism (PPS), Democratic Union (UD), Democratic and Social Movement (MDS), Social Democratic Party (PSD), The Pact (AHD), Liberty Alliance (ADL), United Socialist Leftists (GSU), Moroccan Liberal Party (PML), Party of Reform and Development (PRD), Citizen Forces (FC), National Itihadi (Unity) Congress (CNI), Party of Action (PA), Social Center Party (PCS), Party of Environment and Develop-ment (PED), Citizens Initiative for Development (ICD), Party of Renewal and Equity (PRE), Consultation and Independence Party (PCI), Advancing Democratic and Social Party (PAGDS).
Suffrage: Universal starting at eighteen years of age.
4. Principal Government Offi cials
President: King Mohammed VI.
Prime Minister: Driss Jettou.
5. Foreign Relations
Morocco is a moderate Arab state which maintains close relations with Europe and the United States. It is a member of the UN and belongs to the Arab League, Arab Maghreb Union (UMA), Organization of the Islamic Conference (OIC), and the Non-Aligned Movement.
Organization of African Unity (OAU), Morocco remains involved in African diplomacy. It contributes consistently to UN peacekeeping efforts on the continent.
Morocco is active in Maghreb, Arab, and African affairs. It supports the search for peace and moderation in the Middle East.
Morocco was the fi rst Arab state to condemn Iraq’s invasion of Kuwait in 1990, and sent troops to help defend Saudi Arabia.
Morocco was among the fi rst Arab and Islamic states to denounce the 11 September, 2001 terrorist attacks in the United States and declare solidarity with the American people in the war against terror.
6. Living, Security, and Safety Perceptions
Living in Morocco is fairly comfortable; however, it is necessary to take precautions against the following problems.
Demonstrations occur in Morocco and usually centre on local domestic issues. During periods of heightened regional tension, large demonstrations may take place in the major cities.
Travellers should be cognizant of the current levels of tension in Morocco and stay informed of regional issues that could resonate in Morocco and create an anti-American response.
•
•
•
•
•
•
•
•
07_Africa_Report09_Morocco.indd 16307_Africa_Report09_Morocco.indd 163 2/25/09 4:22:36 PM2/25/09 4:22:36 PM

164
Country Report for Morocco
OU
TS
OU
RC
IN
G
TO
A
FR
IC
ACrime in Morocco is a concern, particularly in the major cities and tourist areas.
Residential break-ins also occur and have, on occasion, turned violent, but most crimi-nals look for opportunities based on stealth rather than confrontation.
Women walking alone in certain areas of cities and rural areas are particularly vulner-able to harassment from men.
Fraud in Morocco may involve a wide range of situations from fi nancial fraud to rela-tionship fraud for the purpose of obtaining a visa.
Adequate medical care is available in Morocco’s largest cities, particularly in Rabat and Casablanca, although not all facilities meet high quality standards. Specialized care or treat-ment may not be available. Medical facilities are adequate for non-emergency matters, par-ticularly in the urban areas, but most medical staff will have limited or no English skills. Most ordinary prescription and over-the-counter medicines are widely available. However, specialized prescriptions may be diffi cult to fi ll, and availability of all medicines in rural areas is unreliable. Medical facilities would be expensive and valid, and adequate medical insurance cover is necessary.
7. ICT Policy, Infrastructure, and Service
Morocco has a very well-developed telecommunications and ICT network. It has high capac-ity digital fi bre links with France and is a landing station for the West African undersea fi bre broadband links. Internal links to remote corners of the country are available.
Maroc Telecom has activated more than 83,000 lines over this fi rst half year. This represents an increase +141 per cent compared to June 2005.
These results translate into a broadband penetration rate of 28 per cent (number of broad-band connections in relation to the number of fi xed lines excluding public telephones), the highest on the African continent. In May this year, Maroc Telecom launched IPTV, a fi rst among Morocco, Africa, and the Arab world.
Maroc Telecom has continued to stimulate the broadband market during this fi rst half year with promotions, and a new ADSL offers price cut from May 1, ranging between 17 per cent and 33 per cent depending on the broadband. For existing customers, broadband upgrades were granted without tariff change.
A recent report on North Africa Internet Country Market Profi les published earlier this year already noted, “Morocco has over 300,000 DSL broadband subscribers, making it the largest broadband market on the continent. Not surprisingly, Morocco currently has the cheapest DSL connection on the continent, starting at US$ 17 per month for a 128/64k uncapped broadband connection.”
For the fi rst half part of this year fi xed-line and Internet gross revenues amounted to MAD 6,145 million, up 6.2 per cent. Maroc Telecom’s mobile activity has achieved gross revenues of MAD 6,957 million, up 16.4 per cent. This performance is mainly due to the growth of
•
•
•
•
07_Africa_Report09_Morocco.indd 16407_Africa_Report09_Morocco.indd 164 2/25/09 4:22:37 PM2/25/09 4:22:37 PM

Country Report for Morocco
165
OU
TS
OU
RC
IN
G
TO
A
FR
IC
Athe customer base, that stands at 8.924 million, corresponding to an increase of 24.2 per cent compared to June 2005 and a net add of 687,000 customers over the fi rst half year.
Specifi cally for the Outsourcing Parks
Dedicated zones in three main cities (Casablanca, Rabat, and soon, Fez), have infrastructure up to the best standards of quality and cost—at around 90 Dh per sq m, way cheaper than the current market price for such facilities—as well as tailor-made services.
This ‘ready for output’ offi ce space will come with air-conditioning, eco-friendly design, pre-cabling and Internet connections, as well as world class telecom offers leveraging the competition between the local and international operators.
In December 2005, His Majesty King Mohammed VI launched the construction of the fi rst zone Casa near Shore Park, the fi rst business area dedicated to offshore services and out-sourcing, which is developed and managed by the CDG group. The offshoring zone, to cost over Dh2.7bn ($300 M), is being built on a fi fty-three hectare site at the outskirts of Casablanca, and the Mohammed-V airport. The fi rst phase, which will consist of 34,000 sq m of offi ce fl oor and 6,000 sq m of services available, is expected to be operational by early 2008. The remaining 210,000 sq m will be delivered in two phases over the next three years. 30,000 BPO/ITO jobs are expected, and about as many indirect jobs.
The next step will be the launch of Techno polis also under construction. Financing and management are through the CDG as well. This park will target in priority ITO but also KPO, due to the presence in the capital of a large number of prestigious engineering schools. The objective is to create up to 12,000–15,000 jobs at the opening. Techno polis will hold separately engineering, high tech colleges and R&D spaces. Next in line is FesShore where at this stage land acquisition and master plans are being fi nalized. Marrakech Shore is on a ‘blue print’ road map for the time being.
Physical Infrastructure
Prime rents Prime yields
Offi ces US$ 10 per sq m per month 12%
Retail US$ 37 per sq m per month 14%
Industrial US$ 3 per sq m per month 15%
Residential US$ 3,500 per month* 9%
*Four bed room executive house—prime location
Thus Morocco has the entire infrastructure that is needed to be an attractive outsourcing destination.
07_Africa_Report09_Morocco.indd 16507_Africa_Report09_Morocco.indd 165 2/25/09 4:22:37 PM2/25/09 4:22:37 PM

166
Country Report for Morocco
OU
TS
OU
RC
IN
G
TO
A
FR
IC
A8. ICT and BPO Industry Environment
Morocco’s fate changed with the construction of the Casa Near Shore Park—the fi rst busi-ness area dedicated to offshore services and outsourcing in December ’05. Another park, Techno polis, constitutes engineering colleges, and R&D spaces to target service providers.
World leaders of IT and communication established in Morocco include Cisco, Capgemini, Compaq, and more.
According to McKinsey’s own study, when compared with competitors such as Mauritius, Senegal, and Tunisia, Morocco is geographically closer to France and boasts a better telecom-munications infrastructure. Rabat is the commercial and industrial capital, Casablanca, the major economic capital, and Marrakech, the commercial and cultural destination.
Reliable telephone infrastructure and reduced operating costs are attracting multinational corporations to invest in Morocco. With state-of-the-art high-speed transportation lines, ports and harbours, railways, principal highways and airports with paved runways, Morocco’s suc-cess story till date is widely seen as a foundation to develop more offshore services there generating value.
With businesses bent on reducing their cost base, Morocco’s aim is to become a leading provider of offshore services and the preferred destination for the francophone and Spanish markets, betting on offshore services to spur growth and job creation.
The kingdom has devised a strategy dubbed the ‘Moroccan offer’, which aims at sharpening its competitive edge in this sector, providing world class infrastructure and training as well as offering a set of unique incentives.
The CAISSE DE DEPOT ET DE GESTION (CDG) group which has been entrusted with the mission to accompany this strategy and develop infrastructure and specialist know-how for offshore services, spearheaded a fi rst fully integrated park in Casablanca, ‘Casanearshore’, growing the trend of relocating entire business functions to either self-owned or third-party service providers, typically in low-cost locations.
The development of BPO/ITO was initiated in the early 1990s by US and UK-based busi-nesses, which were soon followed by Northern Europe. The French, Spanish, Belgian, and Swiss markets started bridging the gap only in the late 1990s, with BPO expenses estimated at slightly over $10 bn in 2005, according to prevailing analysis and research.
Thanks to its cost-effective multilingual labour supply and modern, liberalized telecom sector, Morocco has attracted roughly half of the French-speaking call centres that have gone offshore so far, and a number of the Spanish ones, including leaders such as Attento, which caters to the French and Spanish markets from Morocco. The country currently has about 200 call centres, including thirty of signifi cant size, that employ a total of over 18,000 people.
07_Africa_Report09_Morocco.indd 16607_Africa_Report09_Morocco.indd 166 2/25/09 4:22:37 PM2/25/09 4:22:37 PM

Country Report for Morocco
167
OU
TS
OU
RC
IN
G
TO
A
FR
IC
AAs an example, the global PC and laptop leader Dell established helpdesks in Morocco to serve its French and Spanish customers, creating some 1,500 jobs and with discussions to extend to another 3,500 positions. The success story of the Moroccan call centre industry is widely seen as a foundation to develop other offshore services generating added value.
9. Human Resource Effi ciency and Cost
Education in Morocco is free and compulsory through primary school (age fi fteen). Never-theless, many children—particularly girls in rural areas—do not attend school. The country’s literacy rate reveals sharp gaps in education, both in terms of gender and location; while country-wide literacy rates are estimated at 39 per cent among women and 64 per cent among men, the female literacy rate in rural areas is only 10 per cent.
Morocco is home to fourteen public universities. Mohammed V University in Rabat is one of the country’s most famous schools, with faculties of law, sciences, liberal arts, and medicine. Karaouine University, in Fes, is a longstanding centre for Islamic studies and is the oldest university in the Maghreb. Morocco has one private, English language university, Al-Akhawayn, in Ifrane, founded in 1993 by King Hassan II and King Fahd of Saudi Arabia. The curricu-lum is based on an American model. This lays a sustainable foundation of a regular supply of human resources.
Morocco boasts of a large pool of HR as well—producing up to 50,000 university graduates annually. To ensure that the talent is well-suited to the BPO, ITO and KPO industries, pro-motion of technology and professional training for 25,000 recruits are being provided—from low-level administrative functions to technicians, engineers, and managers. All measures are being taken to boost skilled talent to 100,000 by 2015, in order to maintain an abundant supply of labour and prevent wage infl ation.
Such is the level of development that Morocco’s employment ministry indicates a fall in the overall unemployment rate—from 13.9 per cent in 1999 to 9.8 per cent in 2007 and 9.6 per cent over the fi rst quarter of 2008, which is again expected to drop to 9.2 per cent in the second quarter of this year.
When compared with competitors such as Mauritius, Senegal, and Tunisia, Morocco is geo-graphically closer to France, and has a larger and more qualifi ed talent pool when measured against eastern European countries, Morocco presents reduced labour costs and a larger pool of French speakers.
10. Legal and Enforcement Issues
A strong intellectual property rights legislation, economic reforms, privatization program, and willingness to build long-term trade and investment ties put Morocco in a strong posi-tion in this area.
07_Africa_Report09_Morocco.indd 16707_Africa_Report09_Morocco.indd 167 2/25/09 4:22:37 PM2/25/09 4:22:37 PM

168
Country Report for Morocco
OU
TS
OU
RC
IN
G
TO
A
FR
IC
AIntellectual Property
Morocco has a relatively comprehensive regulatory and legislative system for the protection of intellectual property. Intellectual property rights, however, must be registered in both Casablanca and Tangier in order to be protected in Morocco. Morocco is a member of the World Intellectual Property Organization (WIPO) and party to a number of other inter-national agreements and conventions dedicated to the protection of intellectual property, including the Bern Copyright, Paris Industrial Property and Universal Copyright conven-tions, the Brussels Satellite Convention, and the Madrid, Nice and the Hague Agreements for the Protection of Intellectual Property. Moroccan law provides copyright protection for the literary or artistic expression of an idea, and there are no registration requirements to invoke such protection.
A copyright confers upon the author two principal rights: a property right and an ethical right. The property right gives the author the exclusive right to exploit the copyrighted work for pecuniary gain. This right extends throughout the author’s lifetime, and, thereafter, it is transferred to the benefi t of the author’s heirs for a period of fi fty years.
The ethical right protects an author’s non-pecuniary interest in the literary or artistic work, which includes the protection of authorship and integrity. This right is perpetual, inal-ienable, and remains with the author until death, and thereafter, with the author’s heirs. Authors may sell all or part of their property rights, or the right to perform or reproduce the work, without forfeiting their ethical rights.
11. Labour and Expatriate Worker's Permits
Labour Law
The employment contract binding the employer to each of his employees is governed by the Royal Decree dated 13 August 1913, which lays down a code of obligations and contracts. Such contract may be written or oral. A decree of 23 October 1948 sets out a specimen contract applicable to all industrial and commercial establishments. It defi nes the reciprocal rights and duties of employer and employees. An employer, however, can make more favour-able arrangements in his establishment, subject to agreement with the Minister of Labour. Workers have the right to join together in unions for the protection of their rights and to strike in defence for their collective interests.
The work week is limited to forty-eight hours, with no more than ten hours worked per day. Every employee is entitled to a weekly day of rest and a number of statutory paid holidays.
Salaries and Wages
There are no legislated wage controls in Morocco other than the minimum wage. Therefore, wages and salaries can be freely contracted between employees and employers. Apart from agreed pay increases, an indexing system enables the government to raise by decree all wages
07_Africa_Report09_Morocco.indd 16807_Africa_Report09_Morocco.indd 168 2/25/09 4:22:37 PM2/25/09 4:22:37 PM

Country Report for Morocco
169
OU
TS
OU
RC
IN
G
TO
A
FR
IC
Aand salaries effectively paid when the Central Commission for Prices and Wages records an increase of at least fi ve per cent in the cost of living.
Health and Safety
The provision of medical services is compulsory in every fi rm employing more than fi fty persons. Employers must provide the services of a doctor; alternatively, they may set up a joint service with other fi rms, supervised by a chairman. The operation of such health service is subject to inspection.
Termination of Employment
Dismissal of personnel may take place for a number of reasons, such as reduction of jobs in the particular branch, incapacity owing to age or insuffi cient aptitude, or as a disciplinary measure owing to a serious offense. Except in the case of a serious offense, the worker is entitled to notice, which varies according to his seniority in the fi rm and the nature of his work. Such a dismissed worker is also entitled, after a year’s service, to compensation pro-portionate to the length of his service with the fi rm.
Social Benefi ts
All employers and employees are covered by the social security system. Foreign workers coming to take up employment in Morocco participate on the same basis as Moroccan nationals.
Moroccan Business Visa
Business visas are also issued for duration of three months although they can be granted as either a single entry or multiple entry permits. In Morocco, business visas are designed for those who wish to visit the country in order to engage in business activities other than working in Morocco.
All applications for either Moroccan visa service outlined above must satisfy the following requirements:
Applications must include a fully signed and completed application form with passport photos and the appropriate fee.
Each candidate must be in possession of a current and valid passport with at least one blank page.
Where candidates are visiting Morocco as tourists, evidence of the purpose of the visit must be provided through holiday-booking documentation.
•
•
•
07_Africa_Report09_Morocco.indd 16907_Africa_Report09_Morocco.indd 169 2/25/09 4:22:38 PM2/25/09 4:22:38 PM

170
Country Report for Morocco
OU
TS
OU
RC
IN
G
TO
A
FR
IC
AWhere visitors are entering under a business permit, a letter of introduction from their company will be necessary as well as a letter of invitation from a Moroccan fi rm.
Living and Working in Morocco
In Morocco, immigration requires candidates who wish to stay in the country for longer than the three-month period discussed to apply for a visa extension within the fi fteen days immediately following their arrival.
For applicants who wish to apply for a Moroccan residence permit, the procedure is to enter the country on a short-term entry visa, then apply for permanent residency once in Morocco.
Candidates for Moroccan immigration who wish to apply for a residence permit must do so within two weeks of their initial arrival in Morocco. In Morocco, work permit applica-tions are employer led and work permits may only be granted to candidates who have been offered a specifi c position with a particular Moroccan company. The company in question must apply on behalf of the candidate and will be required to demonstrate that the position being offered could not have been fi lled by a Moroccan citizen or permanent resident.
Processing Times and Fees: In Morocco, visa applications can often be processed within fi ve working days. However, immigration visa services are frequently subject to change and may be affected by the type of entry clearance being pursued and the nationality of the applicant. In some circumstances, applications may take up to two months to process.
12. Revenue, Tax and Repatriation Issues
The Moroccan government has made the Moroccan Dirham (MDh) convertible for an increasing number of transactions over the last few years. As of February 1993, the MDh was made convertible for all current transactions and for some capital transactions, notably, capital repatriation by foreign investors. Foreign exchange is routinely available through commercial banks for such transactions upon presentation of documents. The Central Bank sets the exchange rate for the MDh against a basket of currencies of its principal trading partners. The rate against the basket has been steady since a 9 per cent devaluation in May 1990, with changes in the rate of individual currencies refl ecting changes in cross rates. In a further move, the Ministry of Finance recently decided that private enterprises are allowed to access international fi nancial markets directly.
International fi nancial transactions are subject to the control of the Moroccan Exchange Offi ce, which retains the authority to act in a balance of payments or liquidity crisis.
The liberalization of the exchange control has removed all barriers for international trade transactions, foreign investments, income transfer, foreign technical assistance, and tourism. Remittances of capital and related income to non-residence are guaranteed. No limitations
•
07_Africa_Report09_Morocco.indd 17007_Africa_Report09_Morocco.indd 170 2/25/09 4:22:38 PM2/25/09 4:22:38 PM
Country Report for Morocco
171
OU
TS
OU
RC
IN
G
TO
A
FR
IC
Aare imposed on the time or amount of profi t remitted. Loans, however, must be authorized by the Offi ce of Exchange. Another important decision gives the banks the power to freely conduct investment operations in international capital market sites and, also, to engage in hard currency accounts or in any other amount of capital deposited by foreign entities.
Taxation
The Moroccan taxation system consists of direct and indirect taxes. Indirect taxes provide a greater source of tax revenue than the direct taxes. The system is statutory-based and has been recently updated in part with effect from 1 January 1996 by the Investment Charter (Law No. 18/95). There is virtually no case law on taxation, and tax issues hardly come before the courts. In general, the tax authorities do not issue advance rulings on taxation matters.
Taxation of Companies: Moroccan corporations are subject to a unitary tax system. The corporate tax (impôt sur les sociétés or IS) rate has been reduced to 35 per cent in 1996. Corporations are taxed under a special tax regime, which covers limited liability companies, limited partnerships by shares, general and limited partnerships in which at least one part-ner is a corporate entity, civil companies, branches of foreign corporations, public sector companies having profi t-oriented activity and joint ventures having business-oriented activity. General partnerships and limited partnerships in which all partners are individuals may elect to be taxed under the corporate tax regime. The same applies to joint ventures in which all parties are individuals.
Foreign corporations are subject to taxation on income arising in Morocco if they have or are deemed to have a permanent establishment in Morocco. Taxation of corporations is the same irrespective of ownership, and foreign-owned corporations are essentially regarded as Moroccan corporations insofar as they are incorporated in Morocco.
The corporate tax regime is based upon territoriality. Net profi ts earned by foreign subsidi-aries and establishments of Moroccan companies are not taxable until profi ts are actually repatriated and distributed to shareholders.
Taxable income is based on receipts and accruals from products delivered, services rendered, and work carried out and accepted by customers. Interest, royalties, income, and service fees are subject to corporate income tax at the rate of 36 per cent. Dividends received by corporate shareholders from taxable entities incorporated in Morocco are not taxable. This exemption does not apply, however, to foreign investment income, which is taxed after deducting foreign-withholding taxes.
Morocco exempts certain types of income from corporate taxation. The fi rst is income derived from agriculture which is exempt until the year 2020. The second concerns income of compa-nies set up in Western Sahara. There are also specifi c tax incentives exempting some compa-nies from corporate tax for specifi ed periods. In addition, Moroccan corporations can distrib-ute tax-free dividends of common-stock pro rata to all common-stock shareholders.
07_Africa_Report09_Morocco.indd 17107_Africa_Report09_Morocco.indd 171 2/25/09 4:22:38 PM2/25/09 4:22:38 PM

172
Country Report for Morocco
OU
TS
OU
RC
IN
G
TO
A
FR
IC
AAll expenses incurred for the purpose of the business are normally deductible, including salaries and wages, depreciation, rent, and representation expenses. Only 75 per cent of the amount paid for purchases of raw materials and products, start-up expenses, donations, and other general expenses equal to or exceeding MDh 10,000 are deductible, unless the pay-ment is made by a non-assignable crossed check, bank transfer, or bill of exchange. Except for the corporate tax (IS), taxes are deductible.
Expenses incurred outside Morocco by a foreign company having permanent activity in Morocco require adequate justifi cation and documentation before they may be deducted. Losses may be carried forward and deducted from taxable profi t for a period of four years.
A minimum amount of corporate tax is payable by companies other than foreign compa-nies (cotisation minimale or CM), irrespective of the company’s profi ts or losses. The CM is based on turnover, income from interest, subsidies, bonuses, or donations received. The CM is levied at a rate of 0.5 per cent of income and is not payable by companies during their fi rst thirty-six months of operation.
Registration Fees
Morocco imposes a registration fee at a fi xed rate of 0.50 per cent on the forming or increas-ing of company capital. This rate is reduced to 0.25 per cent for deeds of partnership or capital increase of investment banks and companies the main purpose of which is either stocks and shares management or application for other companies on joint account.
Subsidiaries of Foreign Companies
Subsidiaries set up in Morocco by foreign companies are treated as local companies, inde-pendent of their foreign parent company for legal and taxation purposes. Inter-company transactions must be on an arm’s length basis. Expenses must be incurred in the furthering of the subsidiary’s objectives and not those of its parent company.
Dividends paid to non-resident shareholders are subject to a 15 per cent withholding tax. Interest, royalties and service or management fees paid to non residents are subject to a 10 per cent withholding tax. These rates may be reduced or waived under prevention of double taxation treaties.
National Solidarity Levy
Companies subject to corporate tax must pay a levy called National Solidarity Levy (PSN). The base used to asses this levy is equal to the base chosen for the assessment of corporate tax, and it is calculated by applying a 10 per cent rate to the amount of the corporate tax. If a company is fully exempt from corporate tax, PSN has to be paid in an amount of 25 per cent to a theoretical corporate tax. The PSN cannot be less than MDh 1,500 for a
07_Africa_Report09_Morocco.indd 17207_Africa_Report09_Morocco.indd 172 2/25/09 4:22:38 PM2/25/09 4:22:38 PM
Country Report for Morocco
173
OU
TS
OU
RC
IN
G
TO
A
FR
IC
Ayearly turnover of less than MDh 1,000,000 and not less than MDh 3,000 for a turnover of more than MDh 1,000,000.
Capital Gains Tax
Morocco instituted a tax on the proceeds from stocks and company’s shares and comparable income (TPT), distributed by companies based in Morocco and paying taxes on corpora-tions. The tax of 15 per cent is collected at the source and applies to the following:
Dividends.
Capital interest.
Profi t percentages.
Special allowances or the payment of fees and other compensations allotted to mem-bers of the board of directors (except for the fraction of these compensations consid-ered as salary and subject to personal income tax-IGR).
Sums levied on profi ts to repay capital produced to stockholders or to buy over stocks.
Benefi ciary/founder’s shares.
Surpluses from winding up augmented by reserves built up over at least ten years.
Profi ts made in Morocco by establishments whose home offi ce is located abroad, as these profi ts are made available to such companies abroad.
Taxation of Individuals
Individuals, regardless of nationality or activity, who have their habitual residence in Morocco, are subject to a personal income tax (impôt général sur le revenue or IGR) on their world-wide income on a progressive scale between 13 and 44 per cent. Individuals not having their habitual residence in Morocco are subject to tax only on Moroccan-source income. Habitual residence status is established by reference to one of the following:
Place of permanent abode.
Centre of economic interest.
Duration of stay in the country exceeding 183 days within any period of 365 days. The issue of double taxation is partially addressed by tax treaties or unilateral relief in the form of tax credit.
Generally speaking, there are no concessions for foreign nationals working in Morocco, but the cost of home travel is exempt from tax every two years, and a substantial reduction in tax on pensions received from other countries is granted. In addition to employment income, tax is levied on professional and business activities, investments, and rent.
All compensation paid to employees is taxable, including salaries and wages, allowances, pen-sions, annuities, reimbursement of taxes, and all benefi ts derived from employment. Taxable
•
•
•
•
•
•
•
•
•
•
•
07_Africa_Report09_Morocco.indd 17307_Africa_Report09_Morocco.indd 173 2/25/09 4:22:38 PM2/25/09 4:22:38 PM

174
Country Report for Morocco
OU
TS
OU
RC
IN
G
TO
A
FR
IC
Abenefi ts include the furnishing of an automobile for the employee’s private use, housing benefi ts, and profi t sharing or retirement plans paid by foreign companies.
An individual taxpayer can deduct from taxable income any necessary travelling and enter-tainment expenses, provided they are incurred in the performance of that individual’s duties and are justifi ed by the nature of the profession.
The Value Added Tax (VAT) is a non-cumulative tax levied at each stage of the production and distribution cycle. Thus, suppliers of goods and services must add VAT to their net prices. Where the purchaser is also liable for VAT, input VAT may be offset against output VAT. The standard VAT rate is 19 per cent and applies to all suppliers of goods and services, except those taxed at other rates or those who are exempt. A reduced rate of 7 per cent applies to specifi c items such as banking and credit services, leasing, gas, water and electric-ity. A reduced rate of 14 per cent applies to building and construction activities and to the transport and hotel industries.
Two types of exemptions from VAT are provided. The fi rst is an exemption with credit, equiv-alent to the zero-tax concepts, which applies to exports, agricultural material and equipment, and fi shing equipment. The second is an exemption without credit, i.e., the seller receives no credit for input VAT paid. This exemption applies to basic foodstuffs, newspapers, and international transport services.
A business tax, or patente, is levied on individuals and enterprises that habitually carry out business in Morocco. The tax consists of a tax on the rental value of business premises (rented or owned) and a fi xed amount depending on the size and nature of the business. The tax rates range from 5 per cent to 30 per cent and pro rata reimbursements are granted for businesses which commence or cease activities during the tax year.
The Patent Tax is to be paid by individuals involved in commercial activities who are not exempted by special decree (dahir). The tax includes a proportional tax which averages 10 per cent of the rental value of industrial establishments and a variable tax which depends on the number and kind of pieces of equipment owned by the business entity.
Stamp Duty/Notarial Tax
Corporate stocks, founder’s shares, and bonds issued by companies are free from both stamp duty and formalities. A notarial tax is imposed based on the capital stock, in the amount of 1 per cent for stock up to MDh 5.000, 0.5 per cent from MDh 5,000 to 10,000 and 0.2 per cent for over MDh 10,000.
Urban Property Tax and Municipal Tax
Owners of real estate are subject to urban property tax on the rental value of the property. The same applies to owners of machines and appliances that are integral parts of the establishment producing goods or services. The general urban property tax rate is 13.5 per cent of the
07_Africa_Report09_Morocco.indd 17407_Africa_Report09_Morocco.indd 174 2/25/09 4:22:39 PM2/25/09 4:22:39 PM

Country Report for Morocco
175
OU
TS
OU
RC
IN
G
TO
A
FR
IC
Arental value. It is 3 per cent for lots and 4 per cent for structures and fi ttings as well as for machines and appliances.
The tenants of rented property are subject to a municipal tax on the value of the property. The rate is 10 per cent of the normal rental value of the buildings located within the urban areas and 6 per cent of the normal value on peripheral zones of urban communes.
Tax on Interest
Tax is imposed on individual or corporate residents in respect of interest earned on bonds and other loan securities, fi xed and current account deposits, loans and advances, and vari-ous loans conducted through banks or fi nancial institutions.
Customs Duties
All goods and services may be imported; goods deemed to have a negative impact on national production, however, may require an import license. Most products imported are subject to import duties, the rates of which vary between 2.5 per cent and 10 per cent for equip-ment, materials, spare parts and accessories. Some materials and products, however, are exempted, especially those imported under the investment charter, imported under customs economic systems and those using renewable energies. Value-added tax is also payable on goods imported into Morocco.
The Import Tax Levy (PFI) is imposed on imported commodities at a fi xed rate of 15 per cent. It is reduced or eliminated, however, as follows:
A rate of 12.5 per cent for pharmaceuticals or raw materials used in the manufacturing of pharmaceuticals.
Exemption for the import of material subject to customs duties.
Exemption for enterprises which engage in research activities involving mineral substances.
Exemption for materials using renewable energies.
Exemption for fertilizer products.
Exemption for certain antibiotic medical products.
There is also a para fi scal tax of 0.25 per cent which applies to imported commodities.
Treaties for the Prevention of Double Taxation
Since a Moroccan resident is taxed on worldwide income, the Moroccan tax system provides relief from foreign taxes paid on such worldwide income by means of a foreign tax credit. This foreign tax credit cannot exceed the Moroccan tax otherwise payable in respect of the foreign-source income.
•
•
•
•
•
•
07_Africa_Report09_Morocco.indd 17507_Africa_Report09_Morocco.indd 175 2/25/09 4:22:39 PM2/25/09 4:22:39 PM

176
Country Report for Morocco
OU
TS
OU
RC
IN
G
TO
A
FR
IC
AThe Moroccan government is eager to encourage foreign investment. This is refl ected by the territoriality principle for taxation applicable to corporations mentioned above. In addition, Morocco has concluded about seventeen treaties for the prevention of double taxa-tion, mainly with developed countries. Morocco’s list of treaty-partners include Belgium, Canada, France, Germany, Italy, Luxembourg, the Netherlands, Norway, Romania, Spain, Sweden, Tunisia, the United Kingdom, and the United States.
Most of the tax treaties are based on the OECD model and do not contain specifi c anti-abuse provisions. Reduced withholding tax rates vary from one treaty to another and in the case of the treaty with Sweden, the rate is zero. Of special interest is the treaty with France which offers advantages involving self-employed foreigners and payments for technical assistance and contracts (e.g., imported supplies).
In short, taxes are heavy in Morocco and thus Morocco has the second lowest score in taxes.
13. Investment Policy and Incentives
The strategy for attracting off-shoring is in place.
Being the central plank of the ‘Emergence’ program, Morocco’s ‘Off shoring’ strategy aims at strengthening the country attractiveness by establishing an environment conducive to this activity, with a view to boosting investment and job creation. It enjoys long-term political stability and a business-friendly government, a good telecoms and ICT environment, plenty of well-trained multi-lingual graduates pool, and both geographical and cultural proximity to Europe, Morocco is well-positioned to secure a large share of the European BPO/ITO market. Our approach has therefore devised an aggressive action plan based on three pillars:
State-of-the-art infrastructure and services.
Skilled and widely available human resources.
An attractive fi scal and incentive scheme.
A specifi c scheme for companies established within dedicated zones. This encompasses an effec-tive overall 20 per cent income tax rate, in addition to the corporate tax relieves already included in the investment charter for FDI (0 Corporate tax during fi rst fi ve years and 50 per cent break afterwards, VAT exemption for exports, ~2.5 per cent customs, etc.) and a subsidy for training pur-poses to the tune of Dh65,000 ($7,000) per Moroccan recruit over the fi rst three years of hire.
In addition, the Investment Charter would apply to the following:
Investments Policy
Resident or non-resident foreign nationals are entitled to invest freely in Morocco; no invest-ment operation in Morocco requires any prior authorization from the Control Exchange Offi ce. Prior to 1996, Morocco offered foreign investors a package of investment incentives
•
•
•
07_Africa_Report09_Morocco.indd 17607_Africa_Report09_Morocco.indd 176 2/25/09 4:22:39 PM2/25/09 4:22:39 PM

Country Report for Morocco
177
OU
TS
OU
RC
IN
G
TO
A
FR
IC
Acontained in various investment codes in different areas of business such as exports, tourism, industrial, mining, maritime, handicraft, and real estate investments. Those codes have been replaced by a new Investment Charter, promulgated by Decree No.1-95-213 of November 8, 1995. Effective as of January 1996, the new charter set up as a framework the main objectives regarding the promotion and development of investments in Morocco within the next ten years. It also codifi ed several existing regulations some of which have been implemented through their inclusion in the Corporate Tax Law in 1996. Further, the charter establishes that benefi ts for investors under previously existing laws will be maintained until expiration of their term and of the conditions for which they had been granted.
Investment Incentives
The charter gives the same preference to all sectors except for agriculture. The top fi ve sectors Morocco is trying to develop are as follows:
Banking
Industry
Holdings
Real estate
Trade
Special incentives have been made available to attract these industries; these incentives dif-ferentiate between the installation phase and the operational phase of a company.
Incentives offered for the Installation Phase are as follows:
Exemption from formalities for land acquisition.
Application of a registration fee of 2.5 per cent for acquisition formalities for land.
Application of 0.5 per cent registration fee for inputs in capital formation of companies or increases in capital.
Reduced import dues (between 2.5 per cent and 10 per cent maximum ad valorem).
Exemption from import tax levy (PFI).
Patent tax is suppression of the variable tax and exemption due fi rst fi ve years of operation.
Exemption of urban tax for fi rst fi ve years after the completion or installation of new buildings.
Exemption of reimbursement of VAT for equipment, material, and tools acquired locally or imported.
Incentives for the Operational Phase are as follows:
Profi ts and income liable to corporate tax are not subject to the National Solidarity Contribution (PSN).
•
•
•
•
•
•
•
•
•
•
•
•
•
•
07_Africa_Report09_Morocco.indd 17707_Africa_Report09_Morocco.indd 177 2/25/09 4:22:39 PM2/25/09 4:22:39 PM

178
Country Report for Morocco
OU
TS
OU
RC
IN
G
TO
A
FR
IC
AProfi ts and income completely exonerated from corporate tax pay a contribution at a rate of 25 per cent of the normal corporate tax.
Exemption from corporate tax for exporting enterprises for fi ve years.
50 per cent reduction in corporate tax or income tax during the fi rst fi ve years thereafter.
Enterprises are allowed to create an annual investment reserve free of tax.
Application of sliding scale amortization for equipment.
Exemption from real estate profi ts tax when premises are fi rst ceded for use as accommodation.
In addition, special incentives are available to encourage companies to comply with environ-ment protection laws or to install environment protection equipment.
14. Government Agencies Giving Support to Outsourcing
It appears that the best way to contact the government agencies is through the embassies in UK, USA, Germany, France, India or China, or alternatively, the director of the investment directorate.
15. Overall Assessment and Recommendations
Outlook
With less than 10 per cent of the French-speaking offshoring business having moved off-shore, there is little doubt that the offshoring sector still has a lot of growth potential for call centers, BPO, and ITO. Indeed, Morocco could also develop knowledge process outsourcing (KPO) activities, which generate far more added value. This was evidenced in early 2006 when European banking leader BNP Paribas announced it was stepping up its presence in Morocco by investing some Dh75m ($8.3 m) over the 2005–2009 period to develop ‘Mediha Informatique’ and ‘BDSI’, two local subsidiaries in charge of software development for the group. This move will create some 500 jobs. Other offshore software development opera-tions established in Morocco include Logica, Cap Gemini, Atos-Origin, and SQLI to name a few.
16. Contact Details
Investment Directorate: www.invest.gov.ma
Hassan Bernoussi, Director: [email protected]
Laila Sbiti, Deputy Director: [email protected]
•
•
•
•
•
•
07_Africa_Report09_Morocco.indd 17807_Africa_Report09_Morocco.indd 178 2/25/09 4:22:39 PM2/25/09 4:22:39 PM

Country Report for Morocco
179
OU
TS
OU
RC
IN
G
TO
A
FR
IC
AEmbassies in UK, USA, Germany, France, India and China
Embassy of Morocco: Washington
Ambassador: M. Aziz Mekouar
Chancellerie: 1601 - 21st Street N.W. Washington DC 20009
Tel: (+1) 202-462-79-79; Fax: (+1) 202-462-76-43/62-35-77/62-13-27/62-65-01
E-mail: [email protected]
Website: http://www.themoroccanembassy.com
Consulate General of Morocco: New York
Consul General: M. Mohamed Karmoune
Chancellerie: 10 East 40th Street 24 Floor
New York NY 10016
Tel: (+1) 212-213-96-44; Fax: (+1) 212-725-41-98
E-mail: [email protected]
Website: http://www.moroccanconsulate.com
Embassy of Morocco: Londres
Ambassador: Mme. Chrifa Lalla Joumala Alaoui
Chancellerie: 49, Queen’s Gate Gardens
London SW7 5NE UK
Tel: (+44) 207-581-50-01 à 04; Fax: (+44) 207-225-38-62
E-mail: [email protected]
Consulate General of Morocco: Londres
Consul General: M.
Chancellerie: Diamond House 97/99 Praed Street
Paddington-london W2-1NT
Tel: (+44) 207-724-07-19/06-24; Fax: (+44) 207-706-74-07
E-mail: [email protected]
Embassy of Morocco: New Delhi
Ambassador: M. Larbi Moukhariq
Chancellerie: 33, Archbishop Makarios Marg
New Delhi-110003
Tel: (+91) 11-24-63-69-24; Fax: (+91) 11-24-63-69-25
E-mail: [email protected]
Website: http://www.moroccoembindia.com
Embassy of Morocco: Berlin
Ambassador: M. Mohammed Rachad Bouhlal
Chancellerie: Niederwallstr 39, 10117-Berlin
Tel: (+49) 30-20-61-240; Fax: (+49) 30-20-61-24-20
E-mail: [email protected]
Website: http://www.maec.gov.ma/berlin
07_Africa_Report09_Morocco.indd 17907_Africa_Report09_Morocco.indd 179 2/25/09 4:22:40 PM2/25/09 4:22:40 PM
180
Country Report for Morocco
OU
TS
OU
RC
IN
G
TO
A
FR
IC
AConsulate General of Morocco: Dusseldorf
Consul General: M. Ahmed Mesgguid
Chancellerie: Oststrasse 86-40210 Dusseldorf
Allemagne
Tel: 00-49 (+211) 65-04-510; Fax: 00-49 (+211) 65-04-51-51
E-mail: [email protected]
Consulate General of Morocco: Francfort
Consul General: M. Fath-allah Bencherif
Chancellerie: 49-Mittelweg-60318 Frankfurt/Am Main
Tel: (+49) 69-95-50-12-57/42; Fax: (+49) 69-95-50-12-55
E-mail: [email protected]
Website: http://www.consulatmarocfrankfurt.de
Embassy of Morocco: Paris
Ambassador: M. El Mostapha Sahel
Chancellerie: .5, Rue Le Tasse 75016 Paris
Tel: (+33) 1-45-20-69-35; Fax: (+33) 1-45-20-22-58
E-mail: [email protected]
Consulate General of Morocco: Paris
Ambassador: M. L’amb. Abderrazak Jaidi
Chancellerie: 12, Rue De La Saida 75015 Paris
Tel: (+33) 1-56-56-72-00; Fax: (+33) 1-56-56-72-14
E-mail: [email protected]
Consulate General of Morocco: Bordeaux
Consul General: M. Samir Addahre
Chancellerie: 12 Rue Mexico 33200 Bordeaux
Cauderan
Tel: (+33) 5-56-02-42-21; Fax: (+33) 5-56-42-02-75
E-mail: [email protected]
Website: www.cgmb-maroc.com
Consulate General of Morocco: Lyon
Consul General: M. Mohamed Bentaja
Chancellerie: 2-4 Rue Carry 69003 Lyon
Tel: (+33) 4-72-36-96-17/30-07; Fax: (+33) 4-72-36-89-46
E-mail: [email protected]
Website: http://www.cgml.net
07_Africa_Report09_Morocco.indd 18007_Africa_Report09_Morocco.indd 180 2/25/09 4:22:40 PM2/25/09 4:22:40 PM

Country Report for Morocco
181
OU
TS
OU
RC
IN
G
TO
A
FR
IC
AConsulate General of Morocco: MarseilleConsul General: M. Abdelmalek Chiheb
Chancellerie: 22, Allee Leon Gambetta 13001
Marseille
Tel: (+33) 4-91-70-02-13/91-50-93-50; Fax: (+33) 4-91-50-86-09
E-mail: [email protected]
Website: http://www.consulat-maroc-marseille.fr
Consulate General of Morocco: Strasbourg
Consul General: M. Mohammed Alaoui Belrhiti
Chancellerie: 7, Rue Erckmann-Chatrian 67000
Strasbourg
Tel: (+33) 3-88-35-23-09; Fax: (+33) 3-88-35-68-51
E-mail: [email protected]
Consulate General of Morocco: Toulouse
Consul General: M. Abdelkrim Smaili
Chancellerie: 57, Avenue Jean Rieux
31500 Toulouse
Tel: (+33) 562-47-10-47; Fax: (+33) 562-47-04-00
E-mail: [email protected]
Website: http://www.consulatmaroc-toulouse.org
Consulate General of Morocco: BastiaConsul General: M. Driss Benamara
Chancellerie: Route Nationale 193
Casatorra-20620 Biguglia-Bastia
Phone: (+33) 495-30-10-70; Fax: (+33) 495-30-71-86
E-mail: [email protected]
Consulate General of Morocco: Dijon
Consul General: M. Salah Rami
Chancellerie: 26 Rue Louis de Broglie 21000 Dijon
Tel: (+33) 3-80-56-64-23; Fax: (+33) 3-80-55-26-21
E-mail: [email protected]
Website: http://www.consulatmarocdijon.net
Consulate General of Morocco: Lille
Consul General: M. Mohammed Ali Lazreq
Chancellerie: 20, Rue De Bourgogne 59000 Lille
Tel: (+33) 3-20-54-90-28; Fax: (+33) 3-20-15-12-31
E-mail: [email protected]
07_Africa_Report09_Morocco.indd 18107_Africa_Report09_Morocco.indd 181 2/25/09 4:22:40 PM2/25/09 4:22:40 PM

182
Country Report for Morocco
OU
TS
OU
RC
IN
G
TO
A
FR
IC
AConsulate General of Morocco: Montpellier
Consul General: M. Sidi Abdelfattah El Kadiri
Chancellerie: 16, Rue Remy Belleau B.P.
55-103-34-072 Montpellier Cedex 3
Tel: (+33) 4-67-06-88-30; Fax: (+33) 467-06-88-33
E-mail: [email protected]
Consulate General of Morocco: Colombes
Consul General: M. Yahia Bennani
Chancellerie: 89 Rue des Gros Grès 92700
Colombes-France
Tel: (+33) 1-56-83-80-20; Fax: (+33) 1-56-83-85-54
E-mail: [email protected]
Website: http://www.cgm-colombes.com
Consulate General of Morocco: Pontoise
Consul General: M. Said Lahmiri
Chancellerie: 7, Rue Thiers, 95300 Pontoise
Tel: (+33) 1-30-30-32-26; Fax: (+33) 1-30-30-11-47
E-mail: [email protected]
Website: http://www.consulatmaroc-pontoise.fr
Consulate General of Morocco: Rennes
Consul General: M. Majid Halim
Chancellerie: 19, Bd De Sevigne 35 700 Rennes
Tel: (+33) 2-99-27-54-00; Fax: (+33) 2-99-36-99-31
E-mail: [email protected]
Website: http://www.cg-maroc-rennes.com
Consulate General of Morocco: Villemomble
Consul General: M. Farhat Bouazza
Chancellerie: 40, Av. Du Raincy 93 250 Villemomble
Tel: (+33) 1-48-94-99-31; Fax: (+33) 1-48-94-99-21
E-mail: [email protected]
Consulate General of Morocco: Orleans
Consul General: Mme Faouz El Achchabi
Chancellerie: 6, Avenue Claude
Guillemin 45100 Orleans
Tel: (+33) 2-38-24-92-31; Fax: (+33) 2-38-25-95-17
E-mail: [email protected]
Website: http://www.cg-maroc-orleans.org
07_Africa_Report09_Morocco.indd 18207_Africa_Report09_Morocco.indd 182 2/25/09 4:22:40 PM2/25/09 4:22:40 PM

Country Report for Morocco
183
OU
TS
OU
RC
IN
G
TO
A
FR
IC
AEmbassy of Morocco: Pekin
Ambassador: M. Jaafar Alj Hakim
Chancellerie: 16 San Li Tun Lu–Beijing 100600, R.P. Chine
Tel: (+86) 10-65-32-14-89; Fax: (+86) 10-65-32-14-53
E-mail: [email protected]
Useful Links
The World Fact book 2007.
https://www.cia.gov/cia/publications/factbook/geos/mo.html
Mots du Ministre Missions Textes Juridiques An2000 Plan Quinquennal Projets Manifestations Contacts Liens Forum home- Plan Quinquennal 1999-2003. United Nations Economic Commission for Africa (UNECA).
http://www.uneca.org/aisi/nici/Documents/Maroc%20NICI%20Country%20Plan.doc
Algeria Internet Usage and Marketing Report. Internet World Stats.
http://www.internetworldstats.com/af/dz.htm
Morocco News. USAID. 2005. www.usaid.gov/ma/news/sept05.html
Technologies for Education for All: Possibilities and Prospects in the Arab World. Hamid Behaj.
http://www.uneca.org/aisi/NICI/country_profi les/Morocco/morocinfra.htm;
http://www.uneca.org/aisi/NICI/country_profi les/Morocco/morocinfra.htm
Moroccan Education and Resource Network.
http://www.mearn.org
Country profi le: Morocco. UNECA.
http://www.uneca.org/aisi/NICI/country_profi les/Morocco/morocinfra.htm
Community Voices Collaborative Solutions (CIVICS).
http://www.iearn.org/civics/
GOM (Moroccan Government) Agencies:
Foreign Exchange Offi ce.
http://www.oc.gov.ma
Statistics Department.
www.statistic-hcp.ma
Telecommunications Regulatory Agency (ANRT).
http://www.anrt.net.ma
Customs Service.
http://www.douane.gov.ma
07_Africa_Report09_Morocco.indd 18307_Africa_Report09_Morocco.indd 183 2/25/09 4:22:40 PM2/25/09 4:22:40 PM

184
Country Report for Morocco
OU
TS
OU
RC
IN
G
TO
A
FR
IC
AMinistry of Finance.
http://www.fi nances.gov.ma
National Potable Water Authority (ONEP).
http://www.onep.ma/onep.htm
Railways Corporation (ONCF).
http://www.oncf.ma
Intellectual Property Service (OMPIC).
http://www.ompic.org.ma
Airport Authority (ONDA).
http://www.onda.org.ma/onda/indexfl ash.htm
Port Authority (ODEP).
http://www.odep.org.ma/
Export Control and Product Analysis Institute (EACCE).
http://www.eacce.org.ma/Home.html
Renewable Energy Agency (CDER).
http://www.cder.org.ma/
Electricity Corporation (ONE).
http://www.one.org.ma
Hydrocarbons and Mining Agency (ONHYM).
http://www.onhym.com
National Employment Promotion Agency (ANAPEC).
http://www.anapec.org
Employment Promotion and Professional Training Offi ce (OFPPT).
http://www.ofppt.org.ma
Small and Medium Sized Entreprises Agency (ANPME).
http://www.anpme.ma
GOM Ministries.
Prime Minister’s Department.
http://www.pm.gov.ma
Ministry of Foreign Affairs & Cooperation.
http://www.maec.gov.ma
07_Africa_Report09_Morocco.indd 18407_Africa_Report09_Morocco.indd 184 2/25/09 4:22:41 PM2/25/09 4:22:41 PM

Country Report for Morocco
185
OU
TS
OU
RC
IN
G
TO
A
FR
IC
AMinistry of Communication.
http://www.mincom.gov.ma
Ministry of Finance and Privatization.
http://www.fi nances.gov.ma
Ministry of Tourism, Ministry of Commerce, Industry and Economic Upgrading.
http://www.mcinet.gov.ma/
Ministry of Justice.
http://www.justice.gov.ma
Ministry of Health.
http://www.sante.gov.ma;
Ministry of Agriculture, Rural Development, and Fisheries.
http://www.madrpm.gov.ma
Ministry of Education, Higher Education, and Scientifi c Research.
http://www.enssup.gov.ma
http://www.men.gov.ma
Information Technology and Postal Services Department.
http://www.septi.gov.ma/
Ministry of Energy and Mining.
http://www.mem.gov.ma
Ministry of Foreign Trade.
http://www.mce.gov.ma
Ministry of Housing & Urbanism.
http://www.mhu.gov.ma
Ministry of Town and Country Planning, Water, and Environment.
http://www.minenv.gov.ma
Regional Investment Centers (RICs)
The mission of the regional investment centres is the simplifi cation of administrative proce-dures, the enhancement of communication with investors, and the promotion of investment in respective regions.
There are sixteen centers in Morocco, which are as follows (with names of directors)
http://www.cimr.ma/fr/lienutiles.php?id_rub=13&id_srub=61
http://www.invest.gov.ma/CRIS.htm
http://www.anpme.ma/fr/Liens_Utils/Liens.aspx?m=5&id=3
07_Africa_Report09_Morocco.indd 18507_Africa_Report09_Morocco.indd 185 2/25/09 4:22:41 PM2/25/09 4:22:41 PM

186
Country Report for Morocco
OU
TS
OU
RC
IN
G
TO
A
FR
IC
AAgadir (Karim Lahlou)
Tel: (+212) 48-82-69-77; Fax: (+212) 48-82-69-80
E-mail: contact@cri_agadir.ma
Website: http://www.cri-agadir.ma/pages/cri.htm (temporarily down?)
Chamber of Commerce and Industry and Services in Agadir.
Website: http://www.ccis-agadir.com/
Al Hoceim (Othman Badich)
Tel: (+212) 39-39-98-39; Fax: (+212) 39-98-39-88
E-mail: [email protected]
Website: http://www.alhoceimainvest.ma/fr/index.asp
Casablanca (Abdelhamid Benelafdil)
Tel: (+212) 22-48-18-88/22-48-21-15/22-48-18-54; Fax: (+212) 48-21-15
E-mail: [email protected]
Website: http://www.casainvest.ma/
Dakhla (Mamay Bahiya)
Tel: (+212) 48-89-85-35; Fax: (+212) 48-89-79-12
Website: http://www.cridakhla.ma/fr/index.asp
Fez (Fouad Ouzzine)
Tel: (+212) 55-65-20-57; Fax: (+212) 55-65-16-46
E-mail: [email protected]
Website: http://crifes.ma/
Guelmim-Essmara (Bari Bourqqia)
Tel: (+212) 48-77-17-77; Fax: (+212) 48-77-14-44
E-mail: [email protected]
Website: http://www.criguelmim.com/ (temp. down)
Kenitra (Jamal Attari)
Tel: (+212) 37-37-46-27; Fax: (+212) 37-37-45-36
E-mail: [email protected]
Website: http://www.kenitrainvesti.ma
Laayoune (Ech Charki Ritab)
Tel: (+212) 48-99-12-01; Fax: (+212) 48-89-11-79
E-mail: [email protected]
Website: http://www.laayouneinvest.ma/fr/index.asp
07_Africa_Report09_Morocco.indd 18607_Africa_Report09_Morocco.indd 186 2/25/09 4:22:41 PM2/25/09 4:22:41 PM
Country Report for Morocco
187
OU
TS
OU
RC
IN
G
TO
A
FR
IC
AMarrakesh (Abderrazaq Moumni)
Tel: (+212) 44-42-04-93/44-42-04-92; Fax: (+212) 44-31-01-34
E-mail: [email protected]
Website: http://www.crimarrakech.ma/
Meknes/Tafi lalt (Hassan Bahi)
Tel: (+212) 55-51-18-46/55-51-19-63; Fax: (+212) 55-51-39-22
E-mail: [email protected]
Website: http://www.meknesinvest.ma/fr/index.asp
Oujda (Farid Chourak???? *)
Tel: (+212) 56-68-28-27/56-68-57-45**; Fax: (+212) 56-69-06-81
E-mail: [email protected]
Website: http://www.orientalinvest.ma/, http://www.orientalinvest.ma/contact.html
Rabat (Nabil Kharoubi)
Tel: (+212) 37-73-13-07; Fax: (+212) 37-70-25-94
E-mail: [email protected]
Website: www.rabatinvest.ma
Safi /Doukalla/Abda (Mohamed Lemrabet)
Tel: (+212) 44-61-01-54/44-61-21-40/44-61-21-39; Fax: (+212) 44-61-01-58
E-mail: cri@safi -invest.com, lemrabet@safi -invest.com
Website: http://www.safi -invest.ma/
Settat ( Jelloul Samsseme)
Tel: (+212) 23-72-37-61; Fax: (+212) 23-72-36-81
E-mail: [email protected]
Website: http://www.settatinvest.ma/ (temp. down?)
Tadla/Azilal (Ahmed El Haouti)
Tel: (+212) 23-48-20-72; Fax: (+212) 23-48-23-13
E-mail: [email protected]
Website: http://www.tadlazilalinvest.ma/fr/index.asp
Tangiers/Tetouan (Mohamed Yacoubi)
Tel: (+212) 39-94-68-24; Fax: (+212) 39-94-33-14
Website: www.tangiers-tetouaninvest.ma
07_Africa_Report09_Morocco.indd 18707_Africa_Report09_Morocco.indd 187 2/25/09 4:22:41 PM2/25/09 4:22:41 PM

188
Country Report for Morocco
OU
TS
OU
RC
IN
G
TO
A
FR
IC
AProfessional Associations
Investment Division, Moroccan Economic and General Affairs Ministry.
http://www.invest-in-morocco.gov.ma
Caisse Centrale de Garantie.
http://www.ccg.ma
Bouskoura Industrial Estate.
http://www.gepib.ma/
Tangiers Free Zone.
http://www.tangiersfreezone.com
Tangiers Mediterranean Special Agency.
http://www.tmsa.ma
CGEM (Moroccan Employers Federation).
http://www.cgem.ma
ONA Group.
http://www.ona.co.ma
Moroccan Clothing and Textile Association.
http://www.amith.org.ma
Moroccan Exporters Association.
http://www.asmex.org
Moroccan Export Promotion Center.
http://www.cmpe.org.ma
Moroccan Foreign Trade Council.
http://www.cnce.org.ma
Maroc Export Site.
http://www.maroc-export.com/
National Chambers of Commerce, Industry and Services
Casablanca
98, Boulevard Mohamed V, Casablanca
Tel: (+212) 22-26-43-27; Fax: (+212) 22-26-84-36
http://www.ccisc.gov.ma
07_Africa_Report09_Morocco.indd 18807_Africa_Report09_Morocco.indd 188 2/25/09 4:22:41 PM2/25/09 4:22:41 PM

Country Report for Morocco
189
OU
TS
OU
RC
IN
G
TO
A
FR
IC
ARabat
1, rue Ghandi, Rabat
Tel: (+212) 37-70-64-42; Fax: (+212) 37-70-64-66
http://www.rabat.ma/, http://www.rabatville.com/
Tangiers
Angle rue Hariri et Ibn Tagmia BP 411, Tanger
Tel: (+212) 39-94-63-80; Fax: (+212) 39-94-63-88
Marrakesh
Jnan El Harti, Gueliz BP 529, Marrakech
Tel: (+212) 44-43-61-91; Fax: (+212) 44-43-52-56
E-mail: [email protected]
Agadir
Avenue Hassan II, BP 420, Agadir
Tel: (+212) 48-84-71-24; Fax: (+212) 48-84-54-55
http://www.ccis-agadir.com
Fez
Boulevard Abdellah Chefchaouni, BP 2032, Fès
Tel: (+212) 55-62-28-32; Fax: (+212) 55-62-68-84
Information Technology (IT) Contacts
Association of IT Professionals.
http://www.apebi.org.ma/
E-government website.
http://www.mmsp.gov.ma/egov/index.asp
On-line purchasing service provider.
http://www.maroctelecommerce.com/
Casablanca Technopark.
http://www.casablanca-technopark.ma/ (under construction as of 5-Jun-07)
IT News in Morocco.
http://www.itmaroc.com/
Directory to the computer industry in Morocco.
http://www.infomagazine.ma/
Moroccan Telecommunications Regulatory Agency.
http://www.anrt.net.ma/
07_Africa_Report09_Morocco.indd 18907_Africa_Report09_Morocco.indd 189 2/25/09 4:22:41 PM2/25/09 4:22:41 PM

190
Country Report for Morocco
OU
TS
OU
RC
IN
G
TO
A
FR
IC
AGovernment department responsible for postal services, telecommunications and IT.
http://www.septi.gov.ma/
Offshoring Contacts
Moroccan Call Center Trade Show.
http://www.siccam.com/
Information on call centers in Morocco.
http://www.maroc-callcenters.com/
IT news in Morocco.
http://www.itmaroc.com/
Association of IT Professionals.
http://www.apebi.org.ma/
Energy and Mining Contacts
National Hydrocarbon and Mines Agency (ONHYM).
http://www.onhym.com/
Moroccan Electricity Corporation.
http://www.one.org.ma/
Moroccan Ministry of Energy and Mining.
http://www.mem.gov.ma/
Moroccan Phosphate Corporation.
http://www.ocpgroup.ma/
Phosphoric Acid Shipping Company.
http://www.marphocean.com/
Mineral Phosphates Research Center.
http://www.cerphos.com/
Mining Industry Federation.
http://www.fdim.ma/
National Hydrocarbon and Mines Agency.
http://www.onhym.com/
Moroccan Renewable Energy Center (CDER).
http://www.cder.org.ma/
07_Africa_Report09_Morocco.indd 19007_Africa_Report09_Morocco.indd 190 2/25/09 4:22:42 PM2/25/09 4:22:42 PM

Country Report for Morocco
191
OU
TS
OU
RC
IN
G
TO
A
FR
IC
ABanking and Finance Contacts
Moroccan Ministry of Finance and Privatization.
http://www.fi nances.gov.ma/
Casablanca Stock Exchange.
http://www.casablanca-bourse.com/
Caisse de Dépôt et de Gestion (CDG) group.
http://www.cdg.ma/
Moroccan Federation of Micro credit Associations.
http://www.fnam.ma/
Foreign Exchange Offi ce.
http://www.oc.gov.ma/
Barid Al Maghreb (Moroccan Postal Service).
http://www.bam.net.ma/
Moroccan fi nance gateway.
http://www.maroc-fi nance.com/
Moroccan Ministry of Commerce and Industry.
http://www.mcinet.gov.ma/
Moroccan Ministry of Communication.
http://www.mincom.gov.ma/
Country Profi les
http://www.ambamad.sn/maroc.htm
BBC News
http://news.bbc.co.uk/2/hi/middle_east/country_profi les/791867.stm
CIA
https://www.cia.gov/library/publications/the-world-factbook/geos/mo.html
Lonely Planet
http://www.lonelyplanet.com/worldguide/destinations/africa/morocco/
07_Africa_Report09_Morocco.indd 19107_Africa_Report09_Morocco.indd 191 2/25/09 4:22:42 PM2/25/09 4:22:42 PM
192
Country Report for Morocco
OU
TS
OU
RC
IN
G
TO
A
FR
IC
AMorocco Site
http://www.morocco.com/
Investment Brief for Morocco/Future Plans
http://www.essentialmorocco.com/investment-brief-for-morocco.html
http://lexicorient.com/morocco/z_getting_around.htm
http://www.uneca.org/aisi/NICI/country_profi les/Morocco/morocinfra.htm
http://www.nationsencyclopedia.com/economies/Africa/Morocco-INFRASTRUCTURE-POWER-AND-COMMUNICATIONS.html
http://lexicorient.com/e.o/morocco_2.htm
07_Africa_Report09_Morocco.indd 19207_Africa_Report09_Morocco.indd 192 2/25/09 4:22:42 PM2/25/09 4:22:42 PM

193
OU
TS
OU
RC
IN
G
TO
A
FR
IC
A
Country Report for Botswana
Disclaimer
This short Country Report, a result of a larger Survey of ICT Outsourcing in Africa, provides a general over-view of the current activities and issues related to ICT Outsourcing in the country. The data presented here should be regarded as illustrative rather than exhaustive. ICT Outsourcing is at a particularly dynamic stage in Africa with new developments and announcements happening on a daily basis somewhere or the other on the continent. Therefore, these reports should be seen as ‘snapshots’ that were current at the time they were taken; it is expected that certain facts and fi gures presented may become outdated very quickly.
The fi ndings, interpretations, and conclusions expressed herein are a faithful representation of the respond-ents of the interviews and secondary data collected. Strict analysis has been carried out with the minimal infl uence of the authors/team members. References to data sources have been made as far as possible. In the case of the detailed data parameters used for scores and ranking, the same data source and timeline has been used for all the fi fteen countries compared. In the descriptive section of the country reports all data received from the individual country has been used in order to give as complete an assessment as possible. Thus these countries that have provided more information have a better coverage than those who have not been able to provide data to the research team.
Board of Executive Directors of the CBC or Cyber Media cannot guarantee the accuracy of the data included in this work. The boundaries, colours, denominations, and other information shown on any map in this work do not imply on the part of the CBC and Cyber Media any judgment of the legal status of any territory or the endorsement or acceptance of such boundaries.
It is expected that individual Country Report from the Survey of ICT Outsourcing in Africa will be updated in an iterative process over time, based on additional research and feedback received through the CBC and Cyber Media website.
ANGOLA ZAMBIA LakeKariba
Kasane
ZIMBABWE
NA
MIB
IA
S O U T H A F R I C A
GABORONE
Maun
Francistown
BobonongSerowe
Mahalapye
Kalahari Desert
Tshabong
Ghanzi
Mamuno
0 50 100 km
0 50 100 mi
08_Africa_Report09_Botswana.indd193 19308_Africa_Report09_Botswana.indd193 193 2/25/09 4:24:31 PM2/25/09 4:24:31 PM

194
Country Report for Botswana
OU
TS
OU
RC
IN
G
TO
A
FR
IC
A1. Overview (ICT, Policies, and Outsourcing)
Botswana is a small, dynamic country with visionary leadership particularly in the sector of ICTs in all facets of life. Not only does it boast a liberal telecom policy, its education and national ICT policies are linked to a broader economic vision for the country. Moreover, in practice, Botswana arguably boasts the highest PC penetration in education institutions in Africa. The government has committed fi nancial resources to improve connectivity and promote the educational use of ICTs. This gives Botswana a strong potential for a sustainable outsource destination. Whether all related labour, telecommunications, and other policies look at outsourcing as a priority is not clear. Outsourcing is just another task among many in the fi eld of ICT.
2. Botswana’s Position in Africa’s Fifteen Countries
Botswana is the fi rst in the upcoming band of countries from the outsourcing attractiveness point of view. The following map and table show where Botswana is positioned.
Morocco *
Morocco
Tunisia *
Geographical Coverage and Rank
Tunisia
Egypt *
Egypt
Senegal *
Senegal
GhanaGhana
Nigeria
Nigeria
Uganda
Uganda
Kenya
KenyaTanzania
Tanzania
Zambia
Zambia
Mozambique MozambiqueBotswana
Botswana
Namibia
Namibia
SouthAfrica
South Africa
MauritiusAfrica
*Non-Commonwealth Countries
Mauritius
08_Africa_Report09_Botswana.indd194 19408_Africa_Report09_Botswana.indd194 194 2/25/09 4:24:32 PM2/25/09 4:24:32 PM

Country Report for Botswana
195
OU
TS
OU
RC
IN
G
TO
A
FR
IC
AThe contributing scores and ranks are as under.
Overall
Band Score (PS & BE) Rank in Band
Upcoming 6.57 First
Infrastructure
Score Rank Band
6.1 8 Upcoming
While achieving this score for ‘Infrastructure’, Botswana has been third and fourth, respec-tively, in the scores for road and rail network and cost of space and has fallen to eleventh and twelfth in electricity availability, telecommunications and data tariffs. In all others Bot-swana is average.
People and Skills (PS)
Score Rank
3.215 6
In the case of ‘People and Skills’, Botswana has done well in human resource cost and work satisfaction (fourth and fi fth among fi fteen countries), whereas for quantity it has fallen to twelfth position. In all other scores Botswana is average.
Business Environment (BE)
Score Rank
3.357 5
Botswana is in the second place in tax rates, geo political and legislative risk, third place in ease and cost of fi nance, fourth place in share of services in GDP, and fi fth in foreign exchange reserves. On the other hand it has fallen to twelfth position in ICT Security, Cyber Laws, and IPR. In the case of currency risk, the score is as low as thirteen.
08_Africa_Report09_Botswana.indd195 19508_Africa_Report09_Botswana.indd195 195 2/25/09 4:24:37 PM2/25/09 4:24:37 PM

196
Country Report for Botswana
OU
TS
OU
RC
IN
G
TO
A
FR
IC
A3. Country, Political, and Economic Profi le
Salient features are as follows
Area: 582,000 sq km.
Population: 1.8 million.
Cities: Gaborone (pop. 186,007).
Other towns: Francistown, Selebi-Phikwe, Molepolole, Kanye, Serowe, Mahalapye, Lobatse, Maun, Mochudi.
Terrain: Desert and savannah; Mostly subtropical.
Education: Adult literacy (81%).
GDP (2007 est.): $26 billion. Growth 4.8%.
Per capita GDP (2007 est.): $5846.
Industry types: Mining, diamonds, copper, nickel, coal, tourism, textiles, construction, beef processing, chemical products production, food and beverage production.
Trade (2007) (Exports—$7.2 billion): Diamonds, nickel, copper, meat products, textiles, hides, skins, and soda ash.
Partners: EU, South Africa.
Major markets: South Africa.
Imports ($4.2 billion): Machinery, transport equipment, manufactured goods, food, chemicals, fuels.
Major suppliers: South Africa, EU, and US.
Natural resources: Diamonds, copper, nickel, coal, soda ash, salt, gold, potash.
Agriculture products (1.7% of real GDP, 2006/2007): livestock, sorghum, white maize, millet, cowpeas, beans.
Government type: Republic.
Independence: 30 September 1966.
Constitution: March 1965.
Branches (Executive): President (Chief of state and head of Government).
Legislative: Popularly elected National Assembly; advisory House of Chiefs.
Judicial: High Court, Court of Appeal, local and customary courts, industrial labour court.
Administrative subdivisions: Five town councils and nine district councils.
Major political parties: Botswana Democratic Party (BDP)—48 seats, Botswana National Front (BNF)—12 seats, Botswana Congress Party (BCP)—1 seat, Botswana Alliance Movement (BAM)—0 seats.
Ruling political party: Botswana Democratic Party (BDP)—48 seats
Principal opposition parties: Botswana National Front (BNF)—12 seats, Botswana Congress Party (BCP)—1 seat, Botswana Alliance Movement (BAM)—0 seats.
Suffrage: Universal at 18.
08_Africa_Report09_Botswana.indd196 19608_Africa_Report09_Botswana.indd196 196 2/25/09 4:24:37 PM2/25/09 4:24:37 PM

Country Report for Botswana
197
OU
TS
OU
RC
IN
G
TO
A
FR
IC
A4. Principal Government Offi cials
From the present till the end of 2009, when the next election takes place, the political leadership is as follows:
President: Lt. Gen. (retired) Seretse Khama Ian Khama.
Vice-President: Lt. Gen. (retired) Mompati S Merafhe.
Foreign Affairs and International Cooperation: Phandu TC Skelemani.
Trade and Industry: Daniel Neo Moroka.
Ministry of Communications Science Technology: Pelonomi Venson-Moitoi.
5. Foreign Relations
Botswana puts a premium on economic and political integration in southern Africa. It seeks to make SADC a working vehicle for economic development and promotes efforts to make the region self-policing in terms of preventative diplomacy, confl ict resolution, and good governance.
Botswana joins the African consensus on most major international matters and is a member of international organizations such as the United Nations and the African Union (AU). In 2008, Botswana has taken a leadership role within SADC. Botswana has most favoured Nation partnerships with many countries.
6. Security and Safety Perceptions
Living conditions in Botswana are comfortable, as most of the areas are safe. However, wherever one stays some moderate caution is necessary. There are a few suburbs that could be avoided. The following pointers give an indication of the situation and hints on how to remain safe:
Petty crime and ‘smash and grab’ robberies from vehicles are a signifi cant concern in Botswana.
Visitors must be vigilant and take common sense security precautions and avoid display of wealth.
Adequately equipped emergency rooms and trained physicians are available in the capital, but services are rudimentary elsewhere.
Medical attention and evacuation to South Africa in emergencies is expensive and adequate. Valid medical insurance cover is essential.
Civil unrest and disorder are rare. However, people should avoid crowds, political ral-lies, and street demonstrations and maintain security awareness at all times.
Crime is a signifi cant concern in Botswana. Visitors must be vigilant and take common sense security precautions. The criminal threat is very similar to that of any large urban area. Petty street crime and crimes of opportunity, primarily the theft of money and
•
•
•
•
•
•
08_Africa_Report09_Botswana.indd197 19708_Africa_Report09_Botswana.indd197 197 2/25/09 4:24:37 PM2/25/09 4:24:37 PM
198
Country Report for Botswana
OU
TS
OU
RC
IN
G
TO
A
FR
IC
Apersonal property, are not uncommon. Home invasions ‘smash and grab’ from vehicles, and cell phone thefts, often at knife point, are routinely reported to the police.
Since February 2008, rolling electric power outages have left many areas without power for several hours each week. This situation is likely to continue. Visitors are urged to carry fl ashlights. All must be aware of how power outages might affect home security systems, garage doors and gates, and the adverse elements do take advantage of such situations.
There has been a positive improvement in the situation over the last six months when special steps have been taken to improve the policing and security services.
7. ICT Policy, Infrastructure, and Service
A National ICT Policy was approved by parliament in 2007 with the following programmes among others to support the outsourcing environment:
Economic Development & Growth of the ICT Sector
Infrastructure and Security
Legislation and Policy
Basic ICT
Botswana has a large ICT base of about two hundred million US dollars (2005 estimates). There are adequate capabilities in the local industry to support computers, networks, large servers and all allied hardware, software, and systems. This is due to the major computerisation in the government and private sector players big and small. Most of the ICT services in the government and private sector are run by outsourced service providers; thus outsourcing is well known and understood by the industry.
The ICT sector is supported by a ministry, a regulator, ICT departments, and a fully government-owned telecommunications corporation. Civil society associations to support the interests of the ICT community are virtually absent. The established Botswana Infor-mation Technology Society (BITS) is almost inactive and the association for citizen-owned business in IT is just a lobby for citizen-owned businesses to gain a larger reserved share of the government ICT market. The government is going in for aggressive localisation at the cost of basic needs of reliable service delivery.
Local and Overseas Data Communication Links
As of 2006 major liberalisation policies have been approved; however, the implementa-tion is yet to take place fully. Most of the major links that a medium size or large out-source centre would need as of now would have to be routed through the national serv-ice provider, the Botswana Telecommunication Corporation (BTC), which at present has capability and capacity constraints to provide a basic service level.
•
•
•
•
•
•
•
•
08_Africa_Report09_Botswana.indd198 19808_Africa_Report09_Botswana.indd198 198 2/25/09 4:24:37 PM2/25/09 4:24:37 PM

Country Report for Botswana
199
OU
TS
OU
RC
IN
G
TO
A
FR
IC
AAccurate estimates of the cost of such links could not be obtained as the Botswana Telecommunications Authority refrained from giving an estimate. The estimates obtained from possible suppliers and reported in reviews carried out for policy and strategy exercises indicate that the cost of a one-megabyte link through satellite is as high as USD 3250 per month and for a terrestrial link USD 6000 per month. The BTC has recently quoted USD 3714 per month.
Thus until the overseas links like the Seacom, EASSy, and Infraco project are complete, no improvement will be possible. In addition, till the service levels of BTC in providing the national linkages or some big operator taking these over and running them well comes up, it is expected that this may take till 2010 when the overseas links will come up.
Physical Infrastructure
Cost: There is no shortage of space with all facilities necessary to support the outsourc-ing activity. The costs are competitive with any in Africa.
Offi ce market: Extensive development in Gaborone in the early 2000s coincided with slowing economic growth and a resultant decrease in demand. In 2005, approximately 35 per cent of new offi ce space was vacant. Rents fell by up to 20 per cent between 2004 and 2006. A recent upswing in the economy has created increased demand, help-ing rents to stabilise and grow for high quality accommodation. There is currently no quality large space available. Development of smaller buildings is resuming based on higher rental returns.
Retail market: Oversupply and cooling market conditions caused rents to fall by up to 25 per cent between 2003 and 2006. Most major retailers are South African; they have been concentrating on their booming domestic market and have not seen Botswana consumer demand as affording an opportunity for growth. However, the recent upturn in the economy has led to the stabilisation of rents and the take-up of vacant space. Very little prime space is currently available in Gaborone.
Industrial market: The cooling market saw rents fall by up to 15 per cent between 2004 and 2006. Economic uplift and the infl ux of foreign direct investment, especially in the diamond-producing sector, have caused an increase in demand and a stabilisation of rents, especially for hi-tech properties. Current low rents mean that it is currently uneconomic to construct new accommodation. Rents will rise on the back of increas-ing demand.
Residential market: The economic slowdown of 2003/4 led to disinvestment and an exodus of companies and personnel, causing house values to stagnate, with some areas seeing a 30 per cent fall in both values and rental levels, together with signifi cant increases in void periods. Since the end of 2006, there has been an uplift in the econ-omy and with it an increase in demand, to the extent that there is now a shortage of quality stock. However, high building costs will continue to make it unviable to build to rent, until rental levels increase.
Diamond and Innovation Hub: With the Diamond Hub and the Innovation Hub com-ing up the value of property may rise, but there are unlikely to be shortages or abnor-mally high prices.
•
•
•
•
•
•
•
•
08_Africa_Report09_Botswana.indd199 19908_Africa_Report09_Botswana.indd199 199 2/25/09 4:24:38 PM2/25/09 4:24:38 PM
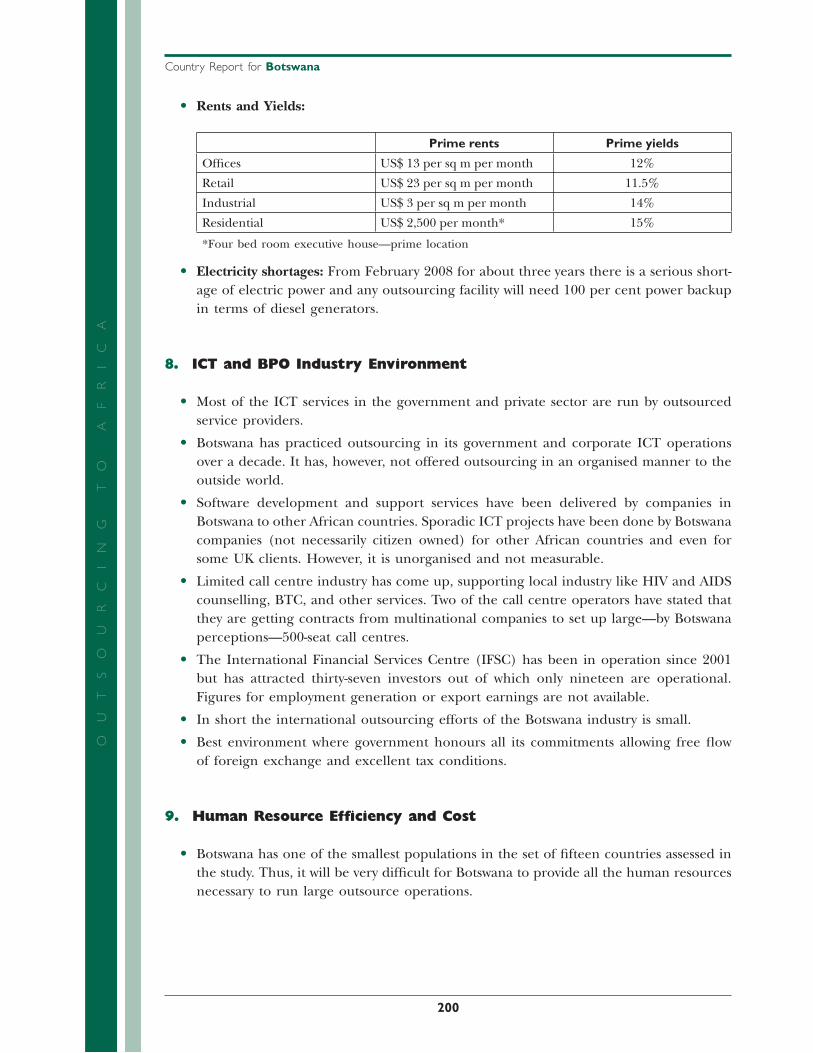
200
Country Report for Botswana
OU
TS
OU
RC
IN
G
TO
A
FR
IC
ARents and Yields:
Prime rents Prime yields
Offi ces US$ 13 per sq m per month 12%
Retail US$ 23 per sq m per month 11.5%
Industrial US$ 3 per sq m per month 14%
Residential US$ 2,500 per month* 15%
*Four bed room executive house—prime location
Electricity shortages: From February 2008 for about three years there is a serious short-age of electric power and any outsourcing facility will need 100 per cent power backup in terms of diesel generators.
8. ICT and BPO Industry Environment
Most of the ICT services in the government and private sector are run by outsourced service providers.
Botswana has practiced outsourcing in its government and corporate ICT operations over a decade. It has, however, not offered outsourcing in an organised manner to the outside world.
Software development and support services have been delivered by companies in Botswana to other African countries. Sporadic ICT projects have been done by Botswana companies (not necessarily citizen owned) for other African countries and even for some UK clients. However, it is unorganised and not measurable.
Limited call centre industry has come up, supporting local industry like HIV and AIDS counselling, BTC, and other services. Two of the call centre operators have stated that they are getting contracts from multinational companies to set up large—by Botswana perceptions—500-seat call centres.
The International Financial Services Centre (IFSC) has been in operation since 2001 but has attracted thirty-seven investors out of which only nineteen are operational. Figures for employment generation or export earnings are not available.
In short the international outsourcing efforts of the Botswana industry is small.
Best environment where government honours all its commitments allowing free fl ow of foreign exchange and excellent tax conditions.
9. Human Resource Effi ciency and Cost
Botswana has one of the smallest populations in the set of fi fteen countries assessed in the study. Thus, it will be very diffi cult for Botswana to provide all the human resources necessary to run large outsource operations.
•
•
•
•
•
•
•
•
•
•
08_Africa_Report09_Botswana.indd200 20008_Africa_Report09_Botswana.indd200 200 2/25/09 4:24:38 PM2/25/09 4:24:38 PM

Country Report for Botswana
201
OU
TS
OU
RC
IN
G
TO
A
FR
IC
AYoung workers are of a very high quality, sincerity, honesty, and capability and are trained in the best schools in Botswana or abroad. Yet they are small in numbers, and there are many opportunities for them in government and local industry because of the reservations and localisation policies.
The inward-looking immigration policies make recruitment of the necessary expatriate human resources very diffi cult as no analysis of human resource needs is done. For example, modern, developed, and heavily populated nations carry out internal surveys to determine what skills are available and what are not.
The Botswana IFSC has taken the initiative with the Botswana Accountancy College to run special courses to generate suitable human resources for the BPO industry.
Botswana ranks sixth in the combined ‘Human Resource’ score that covers quantity and working satisfaction, quality, ICT exposure, education, language, and domain skills, personnel, and cost of living.
10. Legal and Enforcement Issues
Cyber Laws and Their Enforcement
The National ICT Policy recommended the enactment of a comprehensive set of laws and acts (of which Cyber crime and computer related crimes act had been enacted) to make transactions in cyberspace safe. It also recommended the establishment of a mechanism to enforce such laws.
Other related acts like the acts necessary for digital signatures, electronic transactions, etc., are yet to be enacted.
For outsourcing to fl ourish, especially in the fi nancial services sector that Botswana is proud of, these acts and related enforcement mechanisms need to be put in place as soon as possible.
The Intellectual Property Legislation
It is administered by the Offi ce of Registrar of Companies, Copyright, and Industrial Property in the Ministry of Trade and Industry.
IP is covered under the Industrial Property Act and the Copyright and Neighbouring Rights Act.
11. Labour and Expatriate Worker’s Permits
There is one application form for work and residence permits with the following factors considered in assessing the application: availability of suitable candidates in the labour market and whether the applicant meets the requirements for the job.
Turnaround time for processing applications is approximately six weeks.
•
•
•
•
•
•
•
•
•
•
•
08_Africa_Report09_Botswana.indd201 20108_Africa_Report09_Botswana.indd201 201 2/25/09 4:24:38 PM2/25/09 4:24:38 PM
202
Country Report for Botswana
OU
TS
OU
RC
IN
G
TO
A
FR
IC
A12. Revenue, Tax, and Repatriation Issues
In Botswana, manufacturing industry qualifi es for a company tax rate of 15 per cent instead of the usual 25 per cent. Further concessions in the tax rate up to as low as nil for a period of fi ve to ten years is possible under the ‘Development Approval Order’. In this case a specifi c concession is given to an industry that will give the industry a zero tax rate for fi ve to ten years. This is applicable if the order is obtained/negotiated before starting the operations. Industries that contribute to employment and training of citizens, make provision for eventual replacement of non-citizens, provide for par-ticipation of Botswana citizens in management—area where the business is located and the business contributes to the reduction of price of consumer goods.
Capital can be moved without restriction in Botswana, and there are no foreign exchange controls and profi ts; dividends and capital can be readily repatriated.
13. Investment Policy and Incentives
To encourage companies to train their employees, companies are allowed a deduction of 200 per cent of their training expenditure in determining their taxable income.
14. Agencies Giving Support to Outsourcing
The Government of Botswana encourages any investment in the establishment of an industry by assistance in setting up the infrastructure, licensing procedures, immigra-tion, and customs formalities through the Botswana Investment and Export Develop-ment and Investment Authority (BEDIA) (http://www.bedia.co.bw).
BEDIA is an autonomous private sector-led organisation mandated by an act of parliament (1997) to encourage, promote, and facilitate the establishment of export-oriented enterprises and selected services which will result in economic diversifi ca-tion, rapid economic growth, and creation of sustained employment opportunities; it is entrusted with the task of identifying market outlets for locally manufactured products and constructs factory buildings for setting up of manufacturing enterprises. BEDIA also works closely with the Government of Botswana to ensure that the country has a positive investment climate.
BEDIA investment guide recognises service as an industry but does not clearly indicate if delivering service is manufacturing. For example, development of software is as noble an industry as any manufacturing industry but would be deemed to be service.
The Government of Botswana recognises International Financial Services and has set IFSC (http://www.botswanaifsc.com/), an agency whose role is to establish and develop Botswana as a world-class hub to facilitate the delivery of a wide range of cross-border fi nancial services to clients in other countries.
The Botswana Innovation Hub (BIH) (http://www.bih.co.bw) is a recent initiative that will encourage high-end outsourcing activities for innovative output in Information and Communications Technologies (ICT), mining technologies, energy, and Biotechnology.
•
•
•
•
•
•
•
•
08_Africa_Report09_Botswana.indd202 20208_Africa_Report09_Botswana.indd202 202 2/25/09 4:24:38 PM2/25/09 4:24:38 PM

Country Report for Botswana
203
OU
TS
OU
RC
IN
G
TO
A
FR
IC
AIt promises linkages with the local university and intellectual organisations. BIH plans to be a true singe point facilitation centre for high-level technology investments.
15. Overall Assessment and Recommendations
The country should address the shortage of electricity and reduce its power depend-ence on other countries. It is understood that some projects are in hand, but, perhaps, greater attention is necessary.
The standard of ICT services and service quality available to individuals of small and medium industries is questionable. In practice it is very diffi cult for such small-scale operators to deliver services due to the absence of reliable support. It is expected that the facilities in the BIH will address this problem when the BIH is operational.
At present it will be worthwhile for very large multinationals of status who can negotiate with the government attractive terms for all the needs like infrastructure, people and skills, and business environment facilities and carry out a large operation. The govern-ment is used to such deals and honours all the commitments made.
From the Botswana angle, investment promotion agencies could best look for such partners and try to attract them to set up operations in Botswana.
16. Contact Details
Investment Promotion Agency (ies)
Botswana Innovation Hub, Ministry of Communications, Science and Technology
P/Bag 00414
Gaborone, Botswana
Tel: (+267) 39133281/3907466; Fax: (+267) 3913289
Botswana International Financial Services Centre, Fairgrounds Offi ce Park Off Machel Drive
P/Bag 160
Gaborone, Botswana
Tel: (+267) 3605000; Fax: (+267) 3913075
Botswana Export Development and Investment Authority
P.O. Box 3122 Gaborone
Plot 28, Matsitama Road
Tel: (+267) 3181931; Fax: (+267) 3181941
Website: www.bedia.co.bw
•
•
•
•
08_Africa_Report09_Botswana.indd203 20308_Africa_Report09_Botswana.indd203 203 2/25/09 4:24:39 PM2/25/09 4:24:39 PM

204
Country Report for Botswana
OU
TS
OU
RC
IN
G
TO
A
FR
IC
AICT Industry Promotion Agency/Ministry
Ministry of Communications, Science and Technology
P/Bag 00414
Gaborone, Botswana
Tel: (+267) 3907230; Fax: (+267) 3907230/3907207
Revenue Agency
Botswana Unifi ed Revenue Services
P/Bag 0013, Plot 53976
Kudumatse Road
Gaborone, Botswana
Tel: (+267) 36395101; Fax: (+267) 3951918
Company Affairs Agency
Registrar of Companies
P.O. Box 102
Gaborone, Botswana
Tel: (+267) 3188754; Fax: (+267) 3188310
Labour and Residence Permits Agency/Ministry/Department
Commissioner of Labour and Social Security
Department of Labour and Social Security
Ministry of Labour and Home Affairs
P/Bag 0072
Gaborone, Botswana
Tel: (+267) 3611500; Fax: (+267) 3952427
Department of Immigration and Citizenship
P.O. Box 942
Gaborone, Botswana
Tel: (+267) 36113900; Fax: (+267) 3914289
U.S., UK, Germany, France, China, and Indian Mission
Embassy of Botswana in Washington
1531-1533 New Hampshire Avenue, NW Washington D.C. 20036
United States
Washington DC
Tel: (+1) 202-244-4990; Fax: (+1) 202-244-4164
Website: http://www.botswanaembassy.org
08_Africa_Report09_Botswana.indd204 20408_Africa_Report09_Botswana.indd204 204 2/25/09 4:24:39 PM2/25/09 4:24:39 PM
Country Report for Botswana
205
OU
TS
OU
RC
IN
G
TO
A
FR
IC
ABotswana Consulate in New York, United States, Botswana Permanent Mission to the UN
New York, 154 East 46th Street
New York, NY, 10016
Tel: (+212) 8892277; Fax: (+212) 7255061
Botswana Consulate in Atlanta, United States
Consulate General of Botswana in Atlanta, United States
5580 Queens Borough Drive, NE
Atlanta, Georgia 30338
United States
Atlanta
Tel: (+1) 770-394-3303
Botswana Consulate in Houston, United States
Consulate of Botswana in Houston, United States
10000 Memorial Drive, Suite, 400
Houston, Texas 77024
United States
Houston
Tel: (+1) 713-680-1155; Fax: (+1) 713-680-8055
Botswana Consulate in Los Angeles, United States
Consulate of Botswana in Los Angeles, United States
355 S. Grand Avenue, Suite 4000
Los Angeles, California 90071
United States
Los Angeles
Tel: (+1) 213-626-8484
Botswana Consulate in San Francisco, United States
Consulate of Botswana in San Francisco, United
2333 Octavia Street
San Fancisco, California 94109
United States
San Francisco
Tel: (+1) 415-885-2733
High Commissioner
High Commission of the Republic of Botswana
F-8/3, Vasant Vihar, New Delhi-110057
India
Tel: (+91) 11-46537000; Fax: (+91) 11-46036191
08_Africa_Report09_Botswana.indd205 20508_Africa_Report09_Botswana.indd205 205 2/25/09 4:24:39 PM2/25/09 4:24:39 PM

206
Country Report for Botswana
OU
TS
OU
RC
IN
G
TO
A
FR
IC
AEmbassy of Botswana in China
Chancery: Unit 811, IBM Tower Pacifi c Century Place # 2A Gong Ti Beilu
Beijing P.R. China
Tel: (+86) 10-65391616; Fax: (+86) 10-65391199
E-mail: [email protected]@gov.bw
Useful Links
The World Fact book 2007.
https://www.cia.gov/cia/publications/factbook/geos/bc.html Ibid.
WITFOR. 2005.
http://www.witfor.org.bw/about_botswana/economic_success.htm
http://education.stateuniversity.com/pages/186/Botswana-EDUCATIONAL-SYSTEM-OVERVIEW.html
Dyman, A. and S. Oestmann. Universal Access and Service for Botswana Program for Internet and ICT Workshop. August 2006. Grand Palm, Gaborone.
http://209.85.165.104/search?q=cache:Xf3eFTEYmLkJ:www.bta.org.bw/pubs/UNIVERSAL%2520ACCE
SS%2520AND%2520SERVICE%2520POLICY/DAY3/Universal%2520Access%2520and%2520Service
%2520for%2520Internet%2520and%2520ICT%2520presented%2520by%2520Ms%2520Sonja%2520Oest
man%2520and%2520Mr%2520Andrew%2520Dymond%2520Intelecon%2520Consultants%25202%2520
Aug%25202006.ppt+thutonet+botswana&hl=en&ct=clnk&cd=5&gl=za
The World Fact book 2007.
https://www.cia.gov/cia/publications/factbook/geos/lt.html
http://hdr.undp.org/hdr2006/statistics/countries/country_fact_sheets/cty_fs_LSO.html
Republic of Botswana ICT Landscape.
http://www.american.edu/initeb/jn9779a/sources/index.shtml#4
Moanakwena, P. et al. “Improving the Quality of Literacy Learning in the Content Areas: Situational Analysis of Secondary Level Education in Botswana.” 2005. UNESCO.
http://portal.unesco.org/education/en/ev.php-URL_ID=45087&URL_DO=DO_TOPIC&URL_SECTION=201.html
Stockholm Challenge Project Data.
http://old.stockholmchallenge.se/projectdata.asp?id=1&projectid=232
08_Africa_Report09_Botswana.indd206 20608_Africa_Report09_Botswana.indd206 206 2/25/09 4:24:39 PM2/25/09 4:24:39 PM

Country Report for Botswana
207
OU
TS
OU
RC
IN
G
TO
A
FR
IC
AKajevu, Z. “BOCODOL to Improve Learner Support Services.” Mmegi, Tuesday 19 October, 2004.
http://www.mmegi.bw/2004/October/Tuesday19/6712157781513.html
Moody’s Investors Service 2007 credit rating report on Botswana.
http://www.bankofbotswana.bw/fi les/attachments/ood153107476.pdf
http://www.bankofbotswana.bw/fi les/attachments/p%202006%20ratings.1980471207.pdf
http://www.weforum.org/pdf/GCR08/GCR08.pdf
http://www.doingbusiness.org/economyrankings/
http://www.transparency.org/policy_research/surveys_indices/cpi/2008
Doing Business 2009 report by World Bank.
http://www.doingbusiness.org/EconomyRankings/
Country profi le by Foreign and Commonwealth Offi ce.
http://www.fco.gov.uk/en/about-the-fco/country-profi les/sub-saharan-africa/botswana?profi le=economy&pg=2
Botswana Country Overview by Capital Resources (Pty) Ltd.
http://www.capital.bw/securities/doc/2008_Capital_Resources_Botswana_Country_Economic_Overview.pdf
08_Africa_Report09_Botswana.indd207 20708_Africa_Report09_Botswana.indd207 207 2/25/09 4:24:39 PM2/25/09 4:24:39 PM

08_Africa_Report09_Botswana.indd208 20808_Africa_Report09_Botswana.indd208 208 2/25/09 4:24:39 PM2/25/09 4:24:39 PM

209
OU
TS
OU
RC
IN
G
TO
A
FR
IC
A
Country Report for Ghana
Disclaimer
This short Country Report, a result of a larger Survey of ICT Outsourcing in Africa, provides a general overview of current activities and issues related to ICT Outsourcing in the country. The data presented here should be regarded as illustrative rather than exhaustive. ICT Outsourcing is at a particularly dynamic stage in Africa with new developments and announcements happening on a daily basis somewhere or the other on the continent. Therefore, these reports should be seen as ‘snapshots’ that were current at the time they were taken; it is expected that certain facts and fi gures presented may become outdated very quickly.
The fi ndings, interpretations, and conclusions expressed herein are a faithful representation of the respondents of the interviews and secondary data collected from the countries and published literature. Strict analysis has been carried out with the minimal infl uence of the authors/team members. References to data sources have been made as far as possible. In the case of the detailed data parameters used for scores and ranking, the same data source and timeline has been used for all the fi fteen countries compared. In the descriptive section of the country reports all data received from the individual country has been used in order to give as complete an assessment as possible. Thus those countries that have provided more information have a better coverage than those who have not been able to provide data to the research team.
Board of Executive Directors of the CBC or Cyber Media cannot guarantee the accuracy of the data included in this work. The boundaries, colours, denominations, and other information shown on any map in this work do not imply on the part of the CBC and Cyber Media any judgement of the legal status of any territory or the endorsement or acceptance of such boundaries.
It is expected that individual Country Report from the Survey of ICT Outsourcing in Africa will be updated in an iterative process over time, based on additional research and feedback received through the CBC and Cyber Media website.
B U R K I N A F A S O
Bolgatanga
Tamale
KumasiHo
AsamankeseNsawam
Tarkwa Tema
Cape CoastTakoradi
Bight of Benin
LakeVolta
COTED’IVOIRE
BENIN
ACCRA
TOGO
Gulf of Guinea
0 50 100 km
0 50 100 mi
09_Africa_Report09_Ghana.indd 20909_Africa_Report09_Ghana.indd 209 2/25/09 4:25:27 PM2/25/09 4:25:27 PM
210
Country Report for Ghana
OU
TS
OU
RC
IN
G
TO
A
FR
IC
A1. Overview
The Republic of Ghana is a country in West Africa. It borders Côte d’Ivoire (Ivory Coast) to the west, Burkina Faso to the north, Togo to the east, and the Gulf of Guinea to the south. The word Ghana means ‘Warrior King’,[4] and was the source of the name ‘Guinea’ that is used to refer to the West African coast (as in Gulf of Guinea).
Ghana was inhabited in pre-colonial times by a number of ancient kingdoms, including the Ga-Da_mes on the eastern coast, inland Empire of Ashanti, and various Fante states along the coast and inland. Trade with European states fl ourished after contact with the Portu-guese in the fi fteenth century, and the British established a crown colony, Gold Coast, in 1874.[5]
Upon being the fi rst sub-Saharan African nation to achieve independence from the United Kingdom in 1957[6], the name Ghana was chosen for the new nation to refl ect the ancient Empire of Ghana that once extended throughout much of western Africa.
Ghana is a country located on the Gulf of Guinea, only a few degrees north of the Equator, therefore, giving it a warm climate. The Greenwich Meridian also passes through Ghana, specifi cally through the industrial city of Ghana-Tema; so it is said that Ghana is geographi-cally closer to the ‘centre’ of the world than any other country. The coastline is mostly a low, sandy shore backed by plains and scrubl and intersected by several rivers and streams. Formerly, a tropical rainforest belt, broken by heavily forested hills and many streams and rivers, extended northward from the coast, but most of the rainforest was felled in the twen-tieth century, leaving scattered remnants, principally in the southwest, some of which are under protection. North of this belt, the land is covered by low bush, park-like savannah, and grassy plains.
The climate is tropical. The eastern coastal belt is warm and comparatively dry (see Dahomey Gap); the southwest corner, hot and humid; and the north, hot and dry. Lake Volta, the world’s largest artifi cial lake, extends through large portions of eastern Ghana.
09_Africa_Report09_Ghana.indd 21009_Africa_Report09_Ghana.indd 210 2/25/09 4:25:30 PM2/25/09 4:25:30 PM
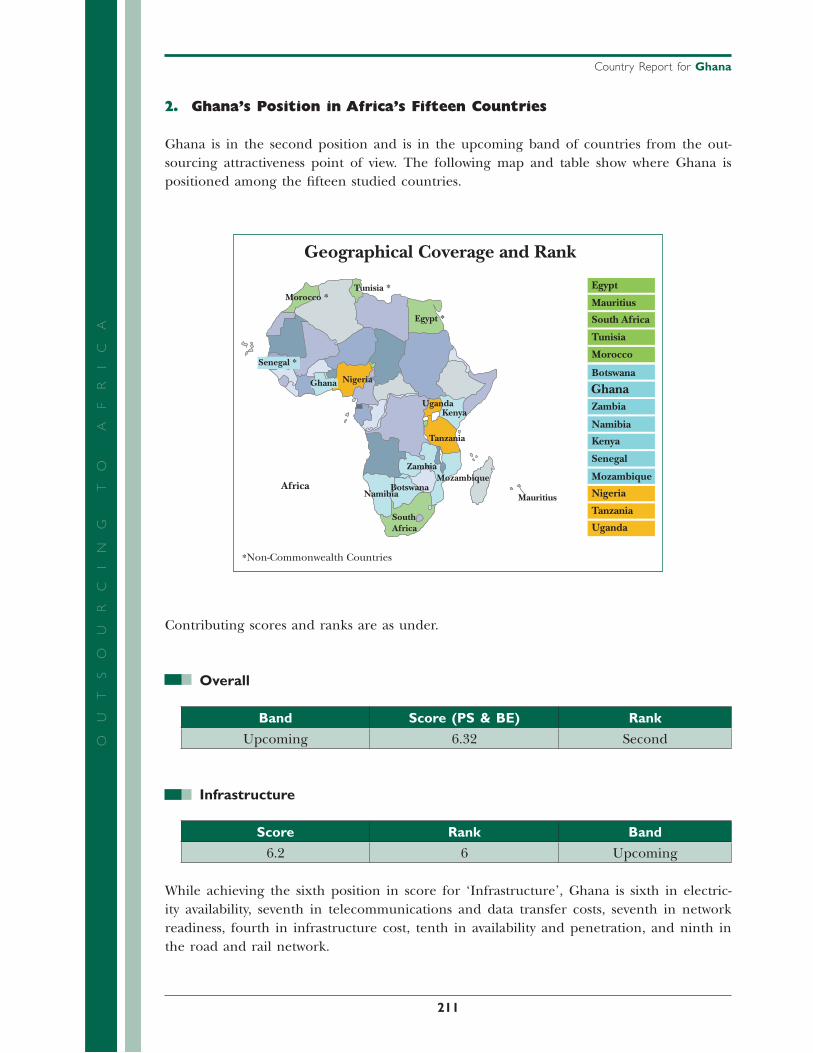
Country Report for Ghana
211
OU
TS
OU
RC
IN
G
TO
A
FR
IC
A2. Ghana’s Position in Africa’s Fifteen Countries
Ghana is in the second position and is in the upcoming band of countries from the out-sourcing attractiveness point of view. The following map and table show where Ghana is positioned among the fi fteen studied countries.
Morocco *
Morocco
Tunisia *
Geographical Coverage and Rank
Tunisia
Egypt *
Egypt
Senegal *
Senegal
Ghana GhanaNigeria
Nigeria
Uganda
Uganda
Kenya
KenyaTanzania
Tanzania
Zambia
Zambia
Mozambique MozambiqueBotswana
Botswana
Namibia
Namibia
SouthAfrica
South Africa
MauritiusAfrica
*Non-Commonwealth Countries
Mauritius
Contributing scores and ranks are as under.
Overall
Band Score (PS & BE) Rank
Upcoming 6.32 Second
Infrastructure
Score Rank Band
6.2 6 Upcoming
While achieving the sixth position in score for ‘Infrastructure’, Ghana is sixth in electric-ity availability, seventh in telecommunications and data transfer costs, seventh in network readiness, fourth in infrastructure cost, tenth in availability and penetration, and ninth in the road and rail network.
09_Africa_Report09_Ghana.indd 21109_Africa_Report09_Ghana.indd 211 2/25/09 4:25:30 PM2/25/09 4:25:30 PM
212
Country Report for Ghana
OU
TS
OU
RC
IN
G
TO
A
FR
IC
APeople and Skills (PS)
Score Rank
3.543 2
Ghana is the second in the case of ‘People and Skills’, being seventh in quantity, ninth for quality, and eighth in working satisfaction, and last in ICT exposure. It has ranked fi rst in human resource costs and tenth in education, language, and domain skills.
Business Environment (BE)
Score Rank
2.781 12
Ghana has ranked twelfth in this lower-level abstraction. In achieving this position it has come seventh in ICT security, Cyber, and IPR laws, and eleventh in share of services in GDP. Ghana has the eleventh highest foreign exchange reserves and is the fourth in ease and cost of fi nances, fourteenth for exports and share of ICT, and eighth in legislative risk. In the tax rate Ghana is eighth, and in share of services in exports it has come twelfth. Ghana has come twelfth in both geopolitical risk and currency risk.
3. Country, Political, and Economic Profi le
Area: 238,538 sq km (92,100 sq mi); about the size of Illinois and Indiana combined.
Cities: Capital—Accra (metropolitan area pop. 3 million estimate).
Other cities: Kumasi (1 million est.), Tema (500,000 estimate), Sekondi-Takoradi (370,000 estimate).
Terrain: Plains and scrubland, rainforest, savannah.
Climate: Tropical.
Population (2007 estimate): 22.50 million.
Education: Years compulsory—9.
Literacy: 53.7 per cent.
GDP: (2007): $10.7 billion.
Per capita GDP (2007): $485.
Growth: 2 per cent.
Industry: Mining, lumber, light manufacturing, fi shing, aluminium, tourism.
Trade (2006): Exports—$3.9 billion; cocoa ($1.26 billion), gold, timber, diamonds, and manganese.
Major markets: Nigeria, China, the United States, UK, Germany, Togo, France, Netherlands, and Spain.
Imports: $6.8 billion; petroleum ($1.3 billion), food, industrial raw materials, machinery, and equipment.
09_Africa_Report09_Ghana.indd 21209_Africa_Report09_Ghana.indd 212 2/25/09 4:25:30 PM2/25/09 4:25:30 PM

Country Report for Ghana
213
OU
TS
OU
RC
IN
G
TO
A
FR
IC
AMajor trade partners: Nigeria, China, the United States, UK, Germany, Togo, France, Netherlands, and Spain.
Natural resources: Gold, timber, diamonds, bauxite, manganese, fi sh.
Agriculture Products: cocoa, coconuts, coffee, tea, cork and wood manufactures, pineapples, cashews, spices, other food crops, and rubber.
Land: 70 per cent arable and forested. By West African standards, Ghana has a relatively diverse and rich natural resource base.
Minerals: principally gold, diamonds, manganese ore, and bauxite are produced and exported.
In 2007, a major oil discovery off the coast of Ghana led to greater multinational interest in entering the Ghanaian market. Ghana’s industrial base is relatively advanced compared to many other African countries.
Key economic challenges include the following:
Overcoming infrastructure bottlenecks, especially in energy and water.
Poor management of natural resources; improving human resource capacity and development.
Establishing a business and investment climate that encourages and allows private sector-led growth, and privatizing remaining state-owned enterprises, several of which are signifi cant budget liabilities.
Government type: Republic.
Independence: 6 March 1957.
Branches: Executive—President popularly elected for a maximum of two four-year terms; Council of State, a presidential appointed consultative body of twenty-fi ve members required by the constitution.
Legislative: Unicameral parliament popularly elected for four-year terms.
The 1993 constitution that established the Fourth Republic provided a basic charter for the republican democratic government. The constitution calls for a system of checks and bal-ances, with power shared between a president, a unicameral parliament, an advisory Council of State, and an independent judiciary.
4. Principal Government Offi cials
President: John Agyekum Kufuor.
Vice-President: Alhaji Aliu Mahama.
Minister of Foreign Affairs: Nana Akufo-Addo.
Minister MCIT1: Alan Kyeremateng.
•
•
•
1 Ministry of Communications and Information Technology
09_Africa_Report09_Ghana.indd 21309_Africa_Report09_Ghana.indd 213 2/25/09 4:25:31 PM2/25/09 4:25:31 PM

214
Country Report for Ghana
OU
TS
OU
RC
IN
G
TO
A
FR
IC
A5. Foreign Relations
Ghana is active in the United Nations and many of its specialized agencies, as well as the World Trade Organization, the Nonaligned Movement, the African Union (AU), and the Economic Community of West African States (ECOWAS). Generally, Ghana follows the con-sensus of the Non-aligned Movement and the AU on economic and political issues that do not directly affect its own interests. Ghana is a critically important peacekeeping partner; it is the largest African peacekeeping contributor nation to multinational peacekeeping opera-tions (PKO) and the sixth-largest among all peacekeeping contributing nations.
It has large contingents deployed in Democratic Republic of the Congo (DRC), the Darfur region of Sudan, Lebanon, Liberia, and Cote d’Ivoire, with smaller contingents deployed in Chad, Western Sahara, Kosovo, Southern Sudan, and Georgia. Ghana contributes military and police personnel to UN Peacekeeping Operations outside of Africa, including nearly 900 troops to the UN Interim Force in Lebanon.
6. Living, Security, and Safety Perceptions
Pickpocketing, purse snatching, and various types of scams are common forms of crime con-fronting visitors. Travellers have reported these types of theft at crowded markets, beaches, parks, and tourist attractions.
Incidents of violent crime, such as armed robbery, do take place; there are reports of armed robberies in expatriate residential areas.
Use of credit cards in Ghana should be avoided, if possible, as a growing number of travel-lers have been victims of credit card fraud.
Another type of fraud is committed by persons claiming to live in Ghana or who claim to be travelling to Ghana on business, and who profess friendship or romantic interest over the Internet.
Medical facilities in Ghana are limited, particularly outside Accra, the capital. Travellers should carry adequate supplies of any needed prescription medicines, along with copies of their prescriptions, the generic name of the drugs, and a supply of preferred over-the-counter medications. Medical insurance is essential.
Primary roads are generally paved and well maintained. However, some side roads within major cities and roads outside of major cities are in poor condition.
09_Africa_Report09_Ghana.indd 21409_Africa_Report09_Ghana.indd 214 2/25/09 4:25:31 PM2/25/09 4:25:31 PM

Country Report for Ghana
215
OU
TS
OU
RC
IN
G
TO
A
FR
IC
A7. ICT Policy, Infrastructure, and Service
Ghana’s ICT Policy
Ghana ICT For Accelerated Development (ICT4AD), 2003
Sets out Vision for Ghana in information age.
Expanding bandwidth.
Establishment of Technology Parks.
Well-educated workforce with ever-improving computer literacy.
Political instability.
Proactive government policy towards DFI.
Establishment of IT-Enabled Services Secretariat of Ministry of Communication to pro-mote and facilitate Ghana’s BPO potential.
A scan of Ghana’s ICT performance as measured by the World Bank is shown as follows:
Telecommunications Revenue, 2000–06Percentage of GDP
Ghana Sub-Saharan Africa Region
2000
4
3
2
1
02001 2002 2003 2004 2005 2006
Price of Call to the United States, 2000–05US$ per 3 minutes
Ghana Sub-Saharan Africa Region
8
6
4
2
2000 2001 2002 2003 2004 20050
•
•
•
•
•
•
•
•
09_Africa_Report09_Ghana.indd 21509_Africa_Report09_Ghana.indd 215 2/25/09 4:25:31 PM2/25/09 4:25:31 PM

216
Country Report for Ghana
OU
TS
OU
RC
IN
G
TO
A
FR
IC
A
ICT Access Indicators, 2000–06Number per 100 people
Fixed + mobile subscribers
Internet users
PCs
30
20
10
02000 2001 2002 2003 2004 2005 2006
Physical Infrastructure
Offi ce market: In the capital city of Accra, a number of major high-rise offi ce buildings have been developed in the last ten years by the Social Security and National Insurance Trust (SSNIT), a state pension fund. All these buildings are fully let. Alternative good quality offi ce accommodation is diffi cult to fi nd although a number of smaller new offi ce buildings are planned.
Retail market: Retailing in Accra has until recently been a combination of the estab-lished old-style central city locations together with street traders. Opening shortly, how-ever, will be the fi rst shopping mall, which will have anchor tenants including Game of Africa and Shoprite. The centre extends to some 20,000 sq m and will undoubtedly become a major force, which will help with the emergence of other competing retail schemes.
Industrial market: Small-scale industrial concerns continue to dominate the Accra mar-ket where there is little demand for high-quality buildings. The historical agricultural base of the economy generates little demand for industrial premises. Should offshore oil or gas fi elds of suffi cient commercial quantities be discovered, Accra will undergo a renaissance similar to that experienced in other similar countries.
Residential market: High-quality houses are continuing to be developed in the best residential areas where the demand for housing is very strong. Many of the sites being developed comprise larger plots which are now being subdivided. Rental levels are now rising, having been stagnant throughout 2006. A three bed-room house in a gated com-munity would typically cost circa US$ 300,000, whilst a four bed-room house would sell for circa US$ 350,000. Many of the purchasers are non-resident Ghanaians.
•
•
•
•
09_Africa_Report09_Ghana.indd 21609_Africa_Report09_Ghana.indd 216 2/25/09 4:25:32 PM2/25/09 4:25:32 PM

Country Report for Ghana
217
OU
TS
OU
RC
IN
G
TO
A
FR
IC
A
Prime rents Prime yields
Offi ces US$ 14 per sq m per month 10.00%
Retail US$ 20 per sq m per month 8.00%
Industrial US$ 3 per sq m per month 12.00%
Residential US$ 4,000 per month* 11.00%
*four bedroom executive house--prime location(Source: Knight Frank LLP)
8. ICT and BPO Industry Environment
Although Ghana comes after Botswana in the outsourcing attractiveness score, it has a very strong BPO and outsourcing industry. BPO was a $128.8 billion market in 2005 and is fore-cast to be a $191.3 billion market by 2010 (Gartner). Offshore IT industry is growing at 21per cent and IT-enabled services at 49 per cent.
Some BPO/KPO services in place are as follows:
24-hour call centre operations
Professional development support
Outsourced services
Microsoft Navision ERP Solutions
HR & Payroll solutions
Custom business software built on Microsoft Navision
Financial Analysis & Reporting
Cash Book and General Ledger A/C
Inventory Management
Purchasing & Payable Management
Fixed Asset Management
Multi-currency functionality
9. Human Resource Effi ciency and Cost
The human resources in Ghana are the most cost-effective but need to improve in quality, ICT exposure, language, and domain skills.
India US/UK *Ghana
Average per agent labour costs per month $400 $2,084 $233
Labour costs as percentage of total costs 33% 67% 22%
Total costs assuming 150 agents $2,181,818 5,598,805 $1,112,481
Annual cost savings for Ghana operations vs. India $1,069,337
*Estimated(Source: Data Monitor CRM Research Program)
•
•
•
•
•
•
•
•
•
•
•
•
09_Africa_Report09_Ghana.indd 21709_Africa_Report09_Ghana.indd 217 2/25/09 4:25:32 PM2/25/09 4:25:32 PM

218
Country Report for Ghana
OU
TS
OU
RC
IN
G
TO
A
FR
IC
A10. Legal and Enforcement Issues
The protection of intellectual property is a fl uid area of law in Ghana but efforts have been made recently to give protection to a variety of intellectual property under both local and international law of WIP and the English-speaking African Regional Industrial Property Organization (ESARIPO).
11. Labour and Expatriate Worker's Permits
An investment of US$ 10,000 to $100,000 entitles an enterprise to two automatic immi-grant quotas. An investment of US$ 500,000 and above gives an enterprise four auto-matic immigrant quotas. Expatriates can be applied for, but it is incumbent on the investor to justify why a foreigner must be employed rather than a Ghanaian. There are no restrictions on issuing of work and residence permits to investors and employees.
US$100,000
US$500,00
Less than US$ 500,00 paid-up capital
From US$ 500,000 paid-up capital
2 quotas/persons
4 quotas/persons
1 quota/personLess than US$ 100,000 paid-up capitalUS$10,000
IMMIGRANT QUOTAS FOR EXPATRIATE PERSONNEL
12. Revenue, Tax & Repatriation Issues
Established capital market with free transferability of profi ts, dividends, and capital.
There are no restrictions on the conversion and transfer of funds once there is docu-mentary evidence to support it. Ghanaian cedis are fully exchangeable with foreign currencies and Ghana’s investment the investor the transfer, in convertible currency, out of Ghana of the following:
Dividends or net profi ts attributable to the investment; payments for loan servicing where a foreign loan has been obtained; transfer fees.
The remittance of proceeds in the sale or liquidation of the enterprise.
Corporate tax is 35 per cent for all sectors except income from non-traditional exports, which is 8 per cent (noteworthy in the case of the ICT sector). Location incentives using tax rebates are also allowance in the form of accelerated depreciation. Allowance is also applicable in all sectors except banking, fi nance, commerce, insurance, mining,
•
•
•
•
•
•
•
09_Africa_Report09_Ghana.indd 21809_Africa_Report09_Ghana.indd 218 2/25/09 4:25:32 PM2/25/09 4:25:32 PM

Country Report for Ghana
219
OU
TS
OU
RC
IN
G
TO
A
FR
IC
Aand petroleum. All imports are subject to import. The sales tax of 15 per cent was replaced by a value-added sales tax (VAT) of 10 per cent.
Currency risk is a problem, but it is much better than in Botswana or South Africa
13. Investment Policy and Incentives
Incentives under Ghana Investment Promotion Centre (GIPC) Act are as follows:
Sector-specifi c tax holidays ranging from 3–10 years.
Automatic immigrant quotas for expatriate personnel depending on paid-up capital; additional quotas on request.
14. Government Agencies Giving Support to Outsourcing
Establishment of IT-Enabled Services Secretariat of Ministry of Communication to pro-mote and facilitate Ghana’s BPO potential.
The GIPC was re-established as a government agency under the GIPC Act 1994 [Act 478]. Its role is to encourage, promote, and facilitate investments in all sectors of the economy excluding mining, petroleum, free-zone activities, privatization of government enterprises, and portfolio investment.
15. Overall Assessment and Recommendations
Many ICT-training institutions like India-Ghana Kofi Annan Centre of Excellence, GT University College, IPMC, and several others. (There is need to set up and enforce quality standards for the industry.)
Ghana needs a legal and regulatory framework that will take advantage of the rapidly changing technologies, promote innovation, and enhance consumer choices, while reinforcing fair competition in the industry.
Focus of on-going reforms is on regulating cyber activities to address promotion of electronic commerce, protection of intellectual property, data protection and security, dealing with cyber fraud, and generally integrating Ghana into info age.
16. Contact Details
Investment Promotion Agency (s)
The Chief Executive
Ghana Investment Promotion Centre
Address: P.O. Box M.193, Accra–Ghana
Tel: (+233) 21-665125-9; Fax: (+233) 21-663801
E-mail: [email protected]
Website: http://www.gipc.org.gh
•
•
•
•
•
•
•
•
09_Africa_Report09_Ghana.indd 21909_Africa_Report09_Ghana.indd 219 2/25/09 4:25:35 PM2/25/09 4:25:35 PM

220
Country Report for Ghana
OU
TS
OU
RC
IN
G
TO
A
FR
IC
AOffi ce of the President
Tel: 666392/665415; Fax: 666392
Ministry for Private Sector Development
Tel: 678361
E-mail: [email protected]
Ghana Export Promotion Council
Tel: 228830/228813; Fax: 668263/233725
E-mail: [email protected]
Ghana Free Zones Board
Tel: 780537/780532-5; Fax: 780534/6
E-mail: [email protected]
Ghana National Petroleum Corp
Tel: (+022) 206020; Fax: (+022) 205499
Minerals Commission
Tel: 772783/772786; Fax: 773324
EMPRETEC Ghana Ltd
Tel: 226090/231238; Fax: 231239
E-mail: [email protected]
Ghana Tourist Board
Tel: 231779/222153; Fax: 231779
E-mail: [email protected]
Ghana Trade Fair Company Ltd
Tel: 775187/776613-5; Fax: 772012
E-mail: [email protected]
Ministry of Communications
Tel: 229870; Fax: 229786
Ministry of Foreign Affairs
Tel: 664951-3/664621; Fax: 665363
Ministry of Trade, Industry and Presidential Initiatives
Tel: 665421; Fax: 662428
Customs, Excise & Preventive Service
Tel: 666841-2; Fax: 668263
Website: http://www.cepsghana.org
09_Africa_Report09_Ghana.indd 22009_Africa_Report09_Ghana.indd 220 2/25/09 4:25:35 PM2/25/09 4:25:35 PM

Country Report for Ghana
221
OU
TS
OU
RC
IN
G
TO
A
FR
IC
AGhana Immigration Service
Tel: 221667; Fax: 226996
Internal Revenue Service
Tel: 664961; Fax: 664938
Registrar General’s Department
Tel: 666469; Fax: 6662043
Electricity Company of Ghana
Tel: 664941/676747; Fax: 6662626
E-mail: [email protected]
Ghana Telecom
Tel: 200215-6; Fax: 667979
Ghana Water Company Ltd
Tel: 666781-5; Fax: 663552
E-mail: [email protected]
Ghana Civil Aviation Authority
Tel: 776171/777320; Fax: 773293
E-mail: [email protected]
Ghana Ports and Harbours Authority
Tel: (022) 202632-9; Fax: (022)204136
Ghana Standards Board
Tel: 501495/501937; Fax: 5000092
E-mail: [email protected]
National Communications Authority
Tel: 776621/771701; Fax: 763449
E-mail: [email protected]
Association of Ghana Industries
Tel: 779023-4/779793; Fax: 773143
E-mail: [email protected]
Ghana Stock Exchange
Tel: 669908/669914; Fax: 669193
E-mail: [email protected]
Divestiture Implementation Committee
Tel: 772049/773119; Fax: 773126
E-mail: [email protected]
09_Africa_Report09_Ghana.indd 22109_Africa_Report09_Ghana.indd 221 2/25/09 4:25:35 PM2/25/09 4:25:35 PM
222
Country Report for Ghana
OU
TS
OU
RC
IN
G
TO
A
FR
IC
AEmbassy of Ghana in China, France, Germany, India, UK, USA
Embassy of Guyana in Beijing, China
8, San Li Tun Lu
Beijing 100600
China
Tel: (+86) (10) 6532-1319/1544; Fax: (+86) (10) 6532-3602
Embassy of Ghana in France
8, villa Saïd - 75116 Paris
Tel: 01.45.00.09.50; Fax: 01.45.00.81.95
Website: http://www.expatries.diplomatie.fr/annuaires/repdipfrview.asp?pays=GHANA
Embassy of Ghana in Washington DC
3512 International Drive NW,
Washington DC 20008
United States
City: Washington DC
Tel: (+202) 686-4520 to 4526; Fax: (+202) 686-4527
Website: http://www.ghanaembassy.org/
E-mail: [email protected]
Ghanaian Consulate in New York
Ghana Permanent Mission to the UN
19 East 47th Street
New York, NY 10017
United States
Tel: (+212) 832-1300; Fax: (+212) 751-6743
(Offi ce hours: Mondays through Thursdays; 9:30 a.m. to 3:00 p.m.)
Ghanaian Consulate in Houston
The Honorary Consulate of Ghana
Jack M. Webb (Honorary Consul of Ghana)
3434 Locke Lane
Houston, Texas 77027
Tel: (+713) 960-8806; Fax: (+713) 960-8833
(Offi ce hours: Working hours; 9 a.m. to 5 p.m. [by appointment only])
09_Africa_Report09_Ghana.indd 22209_Africa_Report09_Ghana.indd 222 2/25/09 4:25:35 PM2/25/09 4:25:35 PM
Country Report for Ghana
223
OU
TS
OU
RC
IN
G
TO
A
FR
IC
AUseful Links
The World Fact book 2007.
https://cia.gov/cia//publications/factbook/geos/gh.html
Country Brief: Ghana. World Bank. 2007.
http://web.worldbank.org/WBSITE/EXTERNAL/COUNTRIES/AFRICAEXT/GHANAEXTN/0,,menuPK:351962~pagePK:141132~piPK:141107~theSitePK:351952,00.html
“Beyond Scarcity: Power, Poverty, and the Global Water Crisis.” Human Development Report 2006. 2006. UNDP.
http://hdr.undp.org/hdr2006/
Ghana-Education System. IAU, World Higher Education Database. n.d.
http://www.unesco.org/iau/onlinedatabases/systems_data/gh.rtf
Summary Education Profi le: Ghana. n.d. World Bank.
http://devdata.worldbank.org/edstats/SummaryEducationProfi les/CountryData/GetShowData.asp?sCtry=GHA, Ghana
“The Ghana ICT for Accelerated Development (ICT4AD) Policy”. The Republic of Ghana. 2003.
http://www.moc.gov.gh/moc/PDFs/Ghana_ICT4AD_Policy.pdf
http://www.edughana.net/ict_policy.htm
Towards an African e-Index: SME e-Access and Usage. 2006.
http://www.researchictafrica.net/images/upload/SME_book-Web.pdf
09_Africa_Report09_Ghana.indd 22309_Africa_Report09_Ghana.indd 223 2/25/09 4:25:36 PM2/25/09 4:25:36 PM

09_Africa_Report09_Ghana.indd 22409_Africa_Report09_Ghana.indd 224 2/25/09 4:25:36 PM2/25/09 4:25:36 PM

225
OU
TS
OU
RC
IN
G
TO
A
FR
IC
A
Country Report for Zambia
Disclaimer
This short Country Report, a result of a larger Survey of ICT Outsourcing in Africa, provides a general over-view of the current activities and issues related to ICT Outsourcing in the country. The data presented here should be regarded as illustrative rather than exhaustive. ICT Outsourcing is at a particularly dynamic stage in Africa with new developments and announcements happening on a daily basis somewhere or the other on the continent. Therefore, these reports should be seen as ‘snapshots’ that were current at the time they were taken; it is expected that certain facts and fi gures presented may become outdated very quickly.
The fi ndings, interpretations, and conclusions expressed herein are a faithful representation of the respondents of the interviews and secondary data collected from the countries and published literature. Strict analysis has been carried out with the minimal infl uence of the authors/team members. References to data sources have been made as far as possible. In the case of the detailed data parameters used for scores and ranking, the same data source and timeline has been used for all the fi fteen countries compared. In the descriptive sec-tion of the country reports, all data received from the individual country has been used in order to give as complete an assessment as possible. Thus in this part those countries that have provided more information have a better coverage than those who have not been able to provide data to the research team.
Board of Executive Directors of the CBC or Cyber Media cannot guarantee the accuracy of the data included in this work. The boundaries, colours, denominations, and other information shown on any map in this work do not imply on the part of the CBC and Cyber Media any judgement of the legal status of any territory or the endorsement or acceptance of such boundaries.
It is expected that individual Country Reports from the Survey of ICT Outsourcing in Africa will be updated in an iterative process over time, based on additional research and feedback received through the CBC and Cyber Media website.
ZIMBABWE
LUSAKA
NAMBIA
TANZANIADEMOCRATIC
REPUBLIC OF THECONGO
BOSTWANA
Mongu
Ndola
SolweziMufulira
Kitwe
Livingstone
Kabwe
Kapiri MposhiChipata MAL
MOZ
Kasama
Mpulungu
MatingaHills
LakeMweru
LakeTanganyika
LakeBangweulu
LakeKanba
Luapula
Zambezi
Zambezi
25
10
15 15
30
25
0 100 200 Km
0 100 200 Km
ANGOLA
10_Africa_Report09_Zambia.indd 22510_Africa_Report09_Zambia.indd 225 2/25/09 4:26:24 PM2/25/09 4:26:24 PM

226
Country Report for Zambia
OU
TS
OU
RC
IN
G
TO
A
FR
IC
A1. Overview
The Republic of Zambia is a landlocked country in southern Africa. The neighbouring countries are the Democratic Republic of the Congo to the north, Tanzania to the north-east, Malawi to the east, Mozambique, Zimbabwe, Botswana, and Namibia to the south, and Angola to the west. The capital city is Lusaka, located in the south-east of the country. The population is concen-trated mainly around the capital Lusaka in the south and the Copper belt to the north-west.
Zambia has been inhabited for thousands of years by hunter gatherers and migrating tribes. After sporadic visits by European explorers starting in the eighteenth century, Zambia was gradually claimed and occupied by the British a as protectorate of Northern Rhodesia towards the end of the nineteenth century. On 24 October 1964, the protectorate gained independence with the new name of Zambia, derived from the Zambezi River which fl ows through the country. After independence the country moved towards a system of one-party rule with Kenneth Kaunda as the president. Kaunda dominated Zambian politics until multi-party elections were held in 1991.
Zambia’s economy has been traditionally dominated by the copper mining industry; however, the government has recently been pursuing an economic diversifi cation programme. During the 1970s, the country began sliding into a poverty from which it has not recovered. Zambia’s total foreign debt exceeded $6 billion in 2000; the growing population strains the economic growth and HIV/AIDS is widespread. The average per capita income is US$ 800 (World Bank, 2007), placing Zambia as one of the world’s poorest countries. About 51 per cent of the population is reportedly living on less than one dollar per day.
2. Zambia’s Position in Africa’s Fifteen Countries
Zambia is in the third position in the yet upcoming band of countries from the outsourcing attractiveness point of view. The map and table below show where Zambia is positioned in among the fi fteen studied countries.
Morocco *
Morocco
Tunisia *
Geographical Coverage and Rank
Tunisia
Egypt *
Egypt
Senegal *
Senegal
GhanaGhana
Nigeria
Nigeria
Uganda
Uganda
Kenya
KenyaTanzania
Tanzania
Zambia
Zambia
Mozambique MozambiqueBotswana
Botswana
Namibia
Namibia
SouthAfrica
South Africa
MauritiusAfrica
*Non-Commonwealth Countries
Mauritius
10_Africa_Report09_Zambia.indd 22610_Africa_Report09_Zambia.indd 226 2/25/09 4:26:25 PM2/25/09 4:26:25 PM

Country Report for Zambia
227
OU
TS
OU
RC
IN
G
TO
A
FR
IC
AContributing scores and ranks are as under.
Overall
Band Score (PS & BE) Rank
Upcoming 5.91 Third
Infrastructure
Score Rank Band
5.5 12 Upcoming
While achieving the twelfth position in score for ‘Infrastructure’, Zambia is fi fth in electric-ity availability, ninth in telecommunications and data transfer costs, fourteenth in network readiness, eleventh in infrastructure cost, eleventh in availability and penetration, twelfth in the road/rail network and air travel, and tenth in international Internet bandwidth.
People and Skills (PS)
Score Rank
2.884 12
Zambia is the twelfth in the case of ‘People and Skills’, being eleventh in quantity, fourteenth for quality, fourteenth in working satisfaction, and eleventh in ICT exposure; it has ranked thirteenth in human resource costs and twelfth in education, language, and domain skills.
Business Environment (BE)
Score Rank
3.026 8
Zambia is ranked eighth in this lower level abstraction. In achieving this position it has come fourteenth in ICT security, Cyber and IPR laws, thirteenth in share of services in GDP. Zambia has the fourteenth highest foreign exchange reserves and is the tenth in ease and cost of fi nances, fi fteenth for share in ICT in exports, and ninth in legislative risk. In the tax rate, Zambia is the lowest, and in share of services in exports it has come last. Zambia’s position is sixth and eleventh respectively in geopolitical risk and currency risk.
10_Africa_Report09_Zambia.indd 22710_Africa_Report09_Zambia.indd 227 2/25/09 4:26:26 PM2/25/09 4:26:26 PM

228
Country Report for Zambia
OU
TS
OU
RC
IN
G
TO
A
FR
IC
A3. Country, Political, and Economic Profi le
Geography
Area: 752,614 sq km (290,585 sq mi); slightly larger than Texas.
Cities: Capital—Lusaka (population approx. 1 million).
Other cities: Kitwe, Ndola, Livingstone, Kabwe.
Terrain: Varies; mostly savannah plateau land.
Climate: Generally dry and temperate.
People
Nationality: Zambian(s) (noun and adjective).
Population (2006): Approx. 11.9 million.
Annual growth rate (2006): 1.6 per cent.
Ethnic groups: More than seventy ethnic groups.
Religions: Christian, indigenous beliefs, Muslim, Hindu.
Languages: English (offi cial), about seventy local languages and dialects, including Bemba, Lozi, Kaonde, Lunda, Luvale, Tonga, and Nyanja.
Education: No compulsory education; seven years of free education.
Literacy: Women—60.6 per cent; men—81.6 per cent.
Health: Infant mortality rate 102/1,000.
Life expectancy: Thirty-seven years.
HIV prevalence (15–49): 17 per cent.
Work force: Agriculture—75 per cent.
Mining and manufacturing: 6 per cent.
Services: 19 per cent.
Government type: Republic.
Independence: 24 October 1964.
Constitution: 1991 (as amended in 1996).
Branches: Executive—President (Chief of state and head of government), cabinet.
Legislative: Unicameral National Assembly.
Judicial: Supreme Court, High Court, magistrate courts, and local courts.
Ruling political party: Movement for Multi-party Democracy (MMD).
Suffrage: Universal adult.
Subdivisions: Nine provinces subdivided into seventy-two districts.
Economy
GDP (2007, current prices): $11.4 billion.
Annual growth rate (2008, preliminary): 6 per cent.
Per capita GDP (2006, current prices): $956.
10_Africa_Report09_Zambia.indd 22810_Africa_Report09_Zambia.indd 228 2/25/09 4:26:26 PM2/25/09 4:26:26 PM

Country Report for Zambia
229
OU
TS
OU
RC
IN
G
TO
A
FR
IC
ANatural resources: Copper, cobalt, zinc, lead, coal, emeralds, gold, silver, uranium, hydroelectric power, fertile land.
Agriculture: Products—corn, sorghum, rice, groundnuts, sunfl ower seeds, vegetables, horticultural products, tobacco, cotton, sugar cane, livestock, coffee, and soya beans.
Industry types: Mining, transport, construction, foodstuffs, beverages, chemicals, and textiles.
Trade (2007): Exports—$4.3 billion; copper, cobalt, lead, and zinc, cut vegetables, cotton, tobacco.
Major markets: South Africa, United Kingdom, Tanzania, Malawi, Zimbabwe, Japan.
Imports ($3.6 billion): Crude oil, refi ned petroleum products, manufactured goods, machinery, transport equipment, foodstuffs, chemicals.
Major suppliers: South Africa, China, Tanzania, United Kingdom.
Major donors: Donors provided $1.4 billion in development assistance to Zambia in 2007. The World Bank is Zambia’s largest multilateral donor. Other key multilateral donors include the International Monetary Fund (IMF), the European Union, UN agencies, and the African Development Bank. Counting direct bilateral assistance and assistance through multilateral agencies, the United States is Zambia’s largest country donor.
People: Zambia’s population comprises more than Bantu-speaking ethnic groups. Some ethnic groups are small, and only two have enough people to constitute at least 10 per cent of the population. Most Zambians are subsistence farmers. The predominant religion is a blend of traditional beliefs and Christianity; Christianity is the offi cial national religion. Expatriates, a majority of whom are British (about 15,000) and South African, live mainly in Lusaka and in the Copperbelt in northern Zambia, where they are employed in mines and related activities. Zambia also has a small but economically important Asian population, most of whom are Indians. The HIV/AIDS epidemic is ravaging Zambia. Approximately 14.3 per cent of Zambians are infected by HIV. Over 800,000 Zambian children have lost one or both of their parents due to HIV/AIDS. Life expectancy at birth is forty-two years.
Government: Zambia became a republic immediately upon attaining independence in October 1964. The constitution promulgated on 25 August 1975, abrogated the original 1964 constitution. The new constitution and the national election that followed in December 1973 were the fi nal steps in achieving what was called a ‘one-party participatory democracy’.
The 1973 constitution provided for a strong president and a unicameral National Assembly. National policy was formulated by the Central Committee of the United National Independence Party (UNIP), the sole legal party in Zambia. The cabinet executed the central committee’s policy.
Economy: About two-thirds of Zambians live in poverty. Per capita annual incomes are well below their levels at independence and, at $921, place the country among the world’s poorest nations. Social indicators continue to decline, particularly in measurements of life expectancy at birth (about forty-two years) and maternal mortality (729 per 100,000 pregnancies). The country’s rate of economic growth cannot support rapid population growth or the strain which HIV/AIDS-related issues (i.e. rising medical costs, decline in worker productivity) place on government resources. Zambia is also one of sub-Saharan Africa’s most highly urbanized countries. Over one-third of the country’s 12 million people are concentrated in a few urban zones strung along the major transportation corridors, while rural areas are under populated. Unemployment and underemployment are serious problems.
10_Africa_Report09_Zambia.indd 22910_Africa_Report09_Zambia.indd 229 2/25/09 4:26:26 PM2/25/09 4:26:26 PM
230
Country Report for Zambia
OU
TS
OU
RC
IN
G
TO
A
FR
IC
A4. Principal Government Offi cials
President: Rupiah Banda.
Vice-President and Minister of Justice: George Kunda.
Minister of Communications: Ms Dora Siliya.
5. Foreign Relations
Zambia is a member of the Non-Aligned Movement (NAM), the African Union, the Southern African Development Community (SADC), and the Common Market for Eastern and Southern Africa (COMESA), which is headquartered in Lusaka.
President Kaunda was a persistent and visible advocate of change in Southern Africa, supporting liberation movements in Angola, Mozambique, Namibia, Southern Rhodesia (Zimbabwe), and South Africa. Many of these liberation organisations were based in Zambia during the 1970s and 1980s.
President Chiluba assumed a visible international role in the mid- and late- 1990s. His government sponsored Angola peace talks that led to the 1994 Lusaka Protocols. Zambia provided troops to the UN peacekeeping initiatives in Mozambique, Rwanda, Angola, and Sierra Leone. Zambia was the fi rst African state to cooperate with the International Tribunal investigation of the 1994 genocide in Rwanda.
In 1998, Zambia took the lead in efforts to establish a ceasefi re in the Democratic Republic of Congo. After the signing of a ceasefi re agreement in Lusaka in July and August 1999, Zambia was active in supporting the Congolese peace effort, although activity diminished considerably after the Joint Military Commission tasked with imple-menting the ceasefi re relocated to Kinshasa in September 2001.
During President Mwanawasa’s administration, Zambia contributed troops to support the UN peacekeeping operations in Sudan. In 2007, the Zambian Government publicly appealed to other African nations to contribute to a joint African Union-United Nations (UNAMID) peacekeeping force in Darfur. During his tenure as SADC Chair, President Mwanawasa’s brought the issue of Zimbabwe to the SADC fore.
Zambia’s history of stability and its commitment to regional peace has made it a haven for large numbers of refugees. Currently, Zambia hosts approximately 87,000 refugees (down from a high of 203,000 in 2002), including roughly 51,000 Congolese, 27,000 Angolans, and 9,000 other nationalities (mainly Rwandans, Burundians, and Somalis). In recent years, Zambia has made serious efforts to repatriate many of these refugees, including organized repatriation for 74,000 Angolan and 17,000 Congolese refugees.
6. Living, Security, and Safety Perception
Zambia is a pleasant place to live in, but caution is necessary as follows:
Travel in many sections of Lusaka, Livingstone, and most other major cities as well as in the major game parks, is generally safe during daylight hours. Travellers using public transportation or visiting high pedestrian traffi c areas are advised to be vigilant against robbery and pickpocketing.
•
•
•
•
•
•
•
10_Africa_Report09_Zambia.indd 23010_Africa_Report09_Zambia.indd 230 2/25/09 4:26:26 PM2/25/09 4:26:26 PM
Country Report for Zambia
231
OU
TS
OU
RC
IN
G
TO
A
FR
IC
AVehicle thefts, burglaries, and armed robberies occur throughout the country. Carjack-ing remains an ongoing problem, especially in Lusaka and other major cities. Carjack-ers generally employ a strategy of blocking the back of one’s car when the car is waiting to pass through a security gate into a residence or other facility. It is recommended to drive with doors locked and windows closed at all times and remain vigilant when entering or exiting one’s residence.
Land mines and unexploded ordnance along the western, southern, and eastern bor-ders make off-road travel to those areas potentially hazardous.
Medical facilities are expensive and medical insurance with provision for evacuation is necessary.
7. ICT policy, Infrastructure, and Service
ICT Policies: The Zimbabwean government adopted a national ICT policy in 2005 that was informed both by a Harvard University-guided e-readiness survey, which suggested the country was not uniformly e-ready, and by a host of preceding general and secto-ral policies including Vision 2020, the national science and technology policy adopted in 2002, and the Nziramasanga Education Commission Report which in 1999 recom-mended the promotion of the educational use of computers for teaching and learning in educational institutions.
The policy’s vision is to transform Zimbabwe into a knowledge-based society by 2020, while its mission is to accelerate the development and application of ICTs in support of economic growth and development. The policy’s objectives are to promote the develop-ment of ICT infrastructure, provide education and training programmes to produce knowledge workers and qualifi ed human resources, to establish relevant structures and institutional mechanisms to promote ICTs, and to encourage equitable access to ICTs across genders and to the youth, the elderly, and people with disabilities. It also has a separate section on human resource development where it promotes skills training and capacity-building at all levels in the private and public sectors and in all training centres and institutions of learning.
A major boost to Zimbabwe’s ICT infrastructure is the impending establishment of the East African Submarine Cable System (EASSy), which is a submarine optical fi bre system running along the east coast of Africa and which includes Zimbabwe. This project is facilitated by the New Partnership for Africa’s Development (NEPAD) e-Africa Commission in partnership with a host of telecom companies in Africa.
•
•
•
•
•
•
10_Africa_Report09_Zambia.indd 23110_Africa_Report09_Zambia.indd 231 2/25/09 4:26:27 PM2/25/09 4:26:27 PM
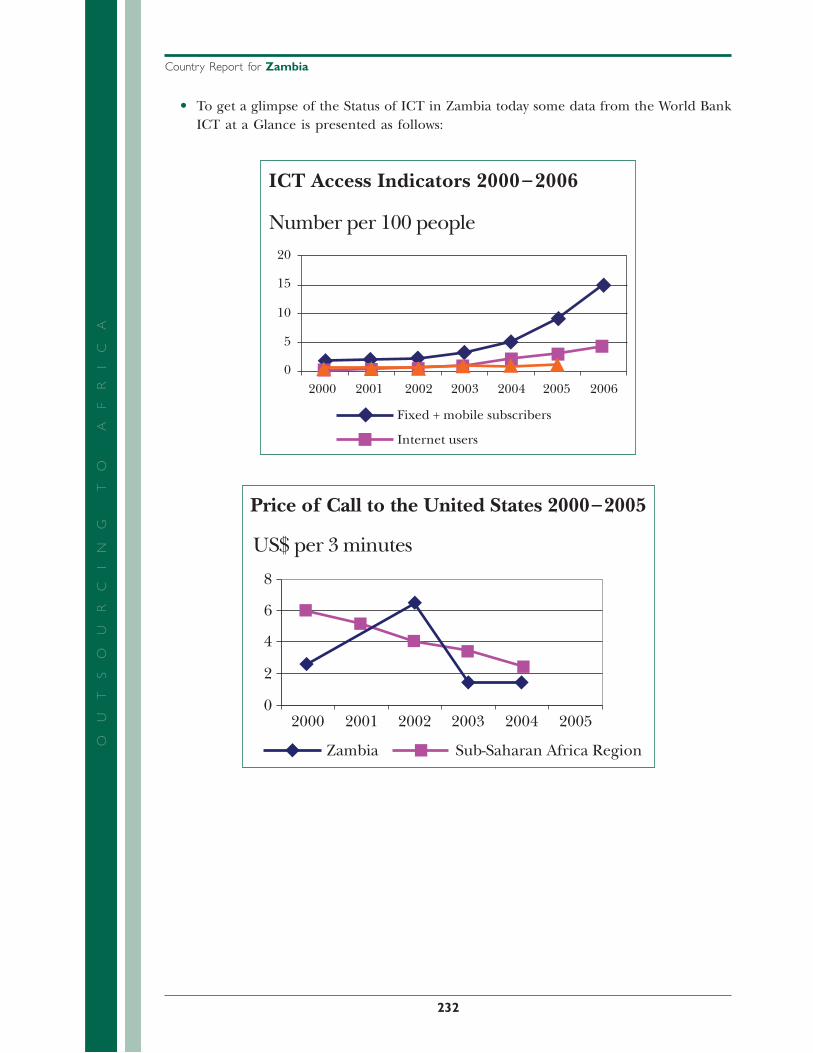
232
Country Report for Zambia
OU
TS
OU
RC
IN
G
TO
A
FR
IC
ATo get a glimpse of the Status of ICT in Zambia today some data from the World Bank ICT at a Glance is presented as follows:
ICT Access Indicators 2000–2006
Number per 100 people
Fixed + mobile subscribers
Internet users
20
15
10
5
02000 2001 2002 2003 2004 2005 2006
Price of Call to the United States 2000–2005
US$ per 3 minutes
Zambia Sub-Saharan Africa Region
8
6
4
2
2000 2001 2002 2003 2004 20050
•
10_Africa_Report09_Zambia.indd 23210_Africa_Report09_Zambia.indd 232 2/25/09 4:26:27 PM2/25/09 4:26:27 PM
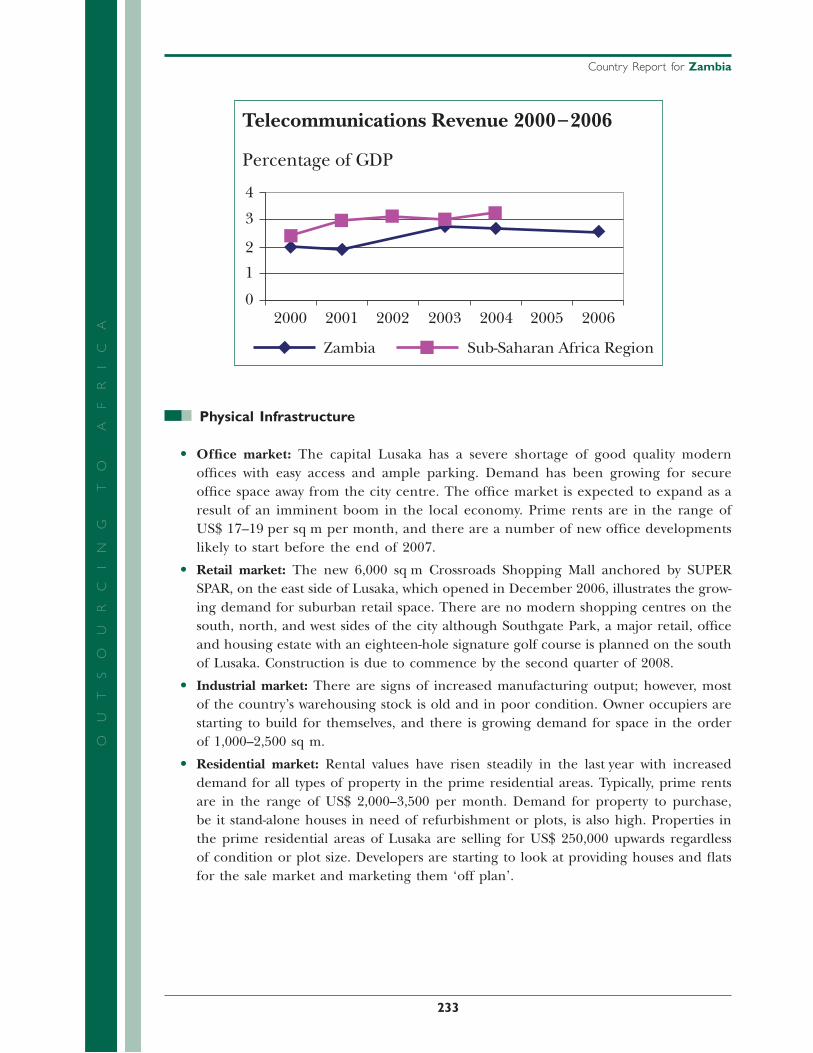
Country Report for Zambia
233
OU
TS
OU
RC
IN
G
TO
A
FR
IC
A
Telecommunications Revenue 2000–2006
Percentage of GDP
Zambia Sub-Saharan Africa Region
2000
4
3
2
1
02001 2002 2003 2004 2005 2006
Physical Infrastructure
Offi ce market: The capital Lusaka has a severe shortage of good quality modern offi ces with easy access and ample parking. Demand has been growing for secure offi ce space away from the city centre. The offi ce market is expected to expand as a result of an imminent boom in the local economy. Prime rents are in the range of US$ 17–19 per sq m per month, and there are a number of new offi ce developments likely to start before the end of 2007.
Retail market: The new 6,000 sq m Crossroads Shopping Mall anchored by SUPER SPAR, on the east side of Lusaka, which opened in December 2006, illustrates the grow-ing demand for suburban retail space. There are no modern shopping centres on the south, north, and west sides of the city although Southgate Park, a major retail, offi ce and housing estate with an eighteen-hole signature golf course is planned on the south of Lusaka. Construction is due to commence by the second quarter of 2008.
Industrial market: There are signs of increased manufacturing output; however, most of the country’s warehousing stock is old and in poor condition. Owner occupiers are starting to build for themselves, and there is growing demand for space in the order of 1,000–2,500 sq m.
Residential market: Rental values have risen steadily in the last year with increased demand for all types of property in the prime residential areas. Typically, prime rents are in the range of US$ 2,000–3,500 per month. Demand for property to purchase, be it stand-alone houses in need of refurbishment or plots, is also high. Properties in the prime residential areas of Lusaka are selling for US$ 250,000 upwards regardless of condition or plot size. Developers are starting to look at providing houses and fl ats for the sale market and marketing them ‘off plan’.
•
•
•
•
10_Africa_Report09_Zambia.indd 23310_Africa_Report09_Zambia.indd 233 2/25/09 4:26:28 PM2/25/09 4:26:28 PM

234
Country Report for Zambia
OU
TS
OU
RC
IN
G
TO
A
FR
IC
APrime rents Prime yields
Offi ces US$ 19 per sq m per month 12%
Retail US$ 25 per sq m per month 11%
Industrial US$ 4 per sq m per month 15%
Residential US$ 3,500 per month* 14%
*four bedroom executive house—prime location(Source: Knight Frank LLP)
8. ICT and BPO Industry Environment
It has not been possible to fi nd signifi cant data of outsourcing operations in Zambia. Recent reports have indicated that the government has recently decided to liberalise international gateways.
Report is also available of some outsourcing activity starting and research and academic presentations comparing Zambian ICT capabilities with India.
Numerically, it is within the fi rst fi ve in terms of the share of ICT in export of services. Thus there is a potential, but this capability has not been projected.
9. Human Resource Effi ciency and Cost
The penetration levels of ICTs in Zambia’s education institutions remains low, with those schools that are equipped mostly utilizing second-hand and refurbished computers.
The integration of ICTs in learning and teaching practice has been limited, although the introduction of computer studies as a school study subject has begun to change this.
The recent adoption of a national ICT policy, as well as the development of a draft ICT policy for education and an associated implementation framework, provides an enabling policy environment to promote far greater access and use of ICTs across all sectors of Zambia’s education system, including a system for enhancing education management, administration, and teaching and learning. While the goals and targets set in these policy documents seem realistic, realizing them within the established time frames remains a challenge.
Thus Zambia, though having the potential, has scored low.
Zambia has ranked twelfth in People and Skills fairing as low as eleventh in quantity and fourteenth in quality.
•
•
•
•
•
•
•
•
10_Africa_Report09_Zambia.indd 23410_Africa_Report09_Zambia.indd 234 2/25/09 4:26:28 PM2/25/09 4:26:28 PM
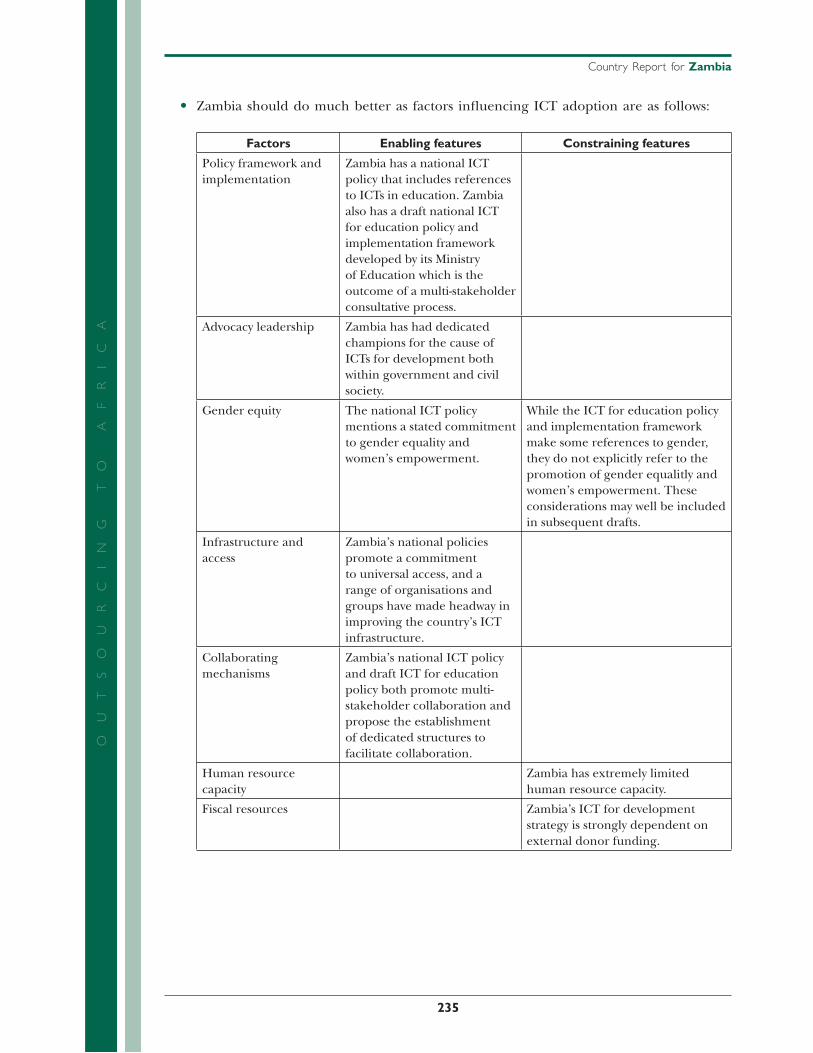
Country Report for Zambia
235
OU
TS
OU
RC
IN
G
TO
A
FR
IC
AZambia should do much better as factors infl uencing ICT adoption are as follows:
Factors Enabling features Constraining features
Policy framework and implementation
Zambia has a national ICT policy that includes references to ICTs in education. Zambia also has a draft national ICT for education policy and implementation framework developed by its Ministry of Education which is the outcome of a multi-stakeholder consultative process.
Advocacy leadership Zambia has had dedicated champions for the cause of ICTs for development both within government and civil society.
Gender equity The national ICT policy mentions a stated commitment to gender equality and women’s empowerment.
While the ICT for education policy and implementation framework make some references to gender, they do not explicitly refer to the promotion of gender equalitly and women’s empowerment. These considerations may well be included in subsequent drafts.
Infrastructure and access
Zambia’s national policies promote a commitment to universal access, and a range of organisations and groups have made headway in improving the country’s ICT infrastructure.
Collaborating mechanisms
Zambia’s national ICT policy and draft ICT for education policy both promote multi-stakeholder collaboration and propose the establishment of dedicated structures to facilitate collaboration.
Human resource capacity
Zambia has extremely limited human resource capacity.
Fiscal resources Zambia’s ICT for development strategy is strongly dependent on external donor funding.
•
10_Africa_Report09_Zambia.indd 23510_Africa_Report09_Zambia.indd 235 2/25/09 4:26:28 PM2/25/09 4:26:28 PM

236
Country Report for Zambia
OU
TS
OU
RC
IN
G
TO
A
FR
IC
A10. Legal and Enforcement Issues
Zambia has scored second last in ICT Security and enforcement of IPR and Cyber Laws but it is midway in overall legislative risk.
11. Labour and Expatriate Worker's Permits
Labour availability: Zambia has abundant reserves of unemployed labour force compris-ing both skilled and unskilled personnel. Unemployment levels are higher in urban than rural areas. Government’s liberalised economic policies, since 1991, necessitated restructuring of both the public and parastatal (quasi-government) sectors leading to massive redundancies of both skilled and unskilled labour force. Rationalisation aris-ing from stiff competition in both the private and parastatal sectors led to liquidation and receiverships, which further resulted in mass lay offs of the labour force. The high level of graduate turnout from the country’s high schools, colleges, and universities has not matched employment generation opportunities from private and public sector investment. The availability of both skilled and unskilled labour thus exceeds available employment opportunities.
Work permits for expatriate labout: Employers seeking to employ expatriate staff are required to apply for work permits from Immigration Headquarters. Such permits are usually issued for an initial period of one year with provision for subsequent extensions or renewals. A company that holds an Investment License, invests US$ 250,000, and employs a minimum of ten Zambians could be entitled to obtain work permits for up to fi ve expatriate employees.
Visa requirements: All visitors from Commonwealth countries except a few restricted ones can obtain visas at the port of entry. Visitors from EEC, USA, and South Africa can also obtain visas at the port of entry. Visitors from other countries need to obtain visas prior to arrival in Zambia. Maximum visa duration is ninety days.
Self employment permit or resident permit: Notwithstanding the provisions of the Immigration and Deportation Act, an investor who invests a minimum of US$ 250,000 or equivalent in convertible currency and who employs a minimum of ten persons shall be entitled to a self-employment permit or resident permit.
12. Revenue, Tax and Repatriation Issues
Exchange control: With effect from February 1994, the Exchange Control Act, which was restrictive in mobility of hard currency, was scrapped; an investor can now repat-riate all amounts of capital introduced into Zambia and can externalise dividends, management fees, interest earned, profi ts earned, technical fees, royalties, etc. freely. All earnings by expatriates can also be externalised without diffi culties.
In summary, there is no exchange control in Zambia for anyone doing business in Zambia either as a resident or non-resident.
•
•
•
•
•
•
•
10_Africa_Report09_Zambia.indd 23610_Africa_Report09_Zambia.indd 236 2/25/09 4:26:28 PM2/25/09 4:26:28 PM

Country Report for Zambia
237
OU
TS
OU
RC
IN
G
TO
A
FR
IC
ALocal borrowings: With the abolishment of exchange control, any investor can borrow for investing in Zambia, but certain fi nancial institutions will not provide loans to inves-tors deemed as non-residents unless a wholly owned Zambian company participates in the business.
Taxation: In order to be liable to tax in Zambia, a person has to be in receipt of income from a source within or deemed to be within the republic.
A company incorporated in the republic is liable to tax on the trading profi ts, Zambian dividends, and interest.
A partnership is not liable to tax in Zambia, but the income is divided among the partners who are taxed on the partnership income.
An individual ordinarily resident in Zambia is liable to tax on interest and dividends received from a source outside the republic.
A non-resident is liable to pay tax if he is in receipt of income from a source within Zambia.
Double taxation: Zambia has double tax agreements with a few countries to prevent the taxation of the same income in either country.
A foreign resident business undertaking will only be liable to tax if business is con-ducted in Zambia through a Permanent Establishment.
Where a double taxation agreement exists between Zambia and another country, foreign tax payable by an investor to the other country in respect of any foreign income shall be allowed as a credit for that investor against Zambia in respect of that foreign income.
Tax rates: Profi ts from companies incorporated in Zambia are taxed at 35 per cent on the taxable profi t.
Dividends: The rate applicable is 15 per cent. The dividend tax is paid in the same manner as PAYE to the Zambia Revenue Authorities.
There is no further tax on Zambian dividends.
Income received by way of dividend from farming shall be exempt from tax for the fi rst fi ve years of operations.
Other taxes: Employers are required to deduct tax (PAYE) from the remuneration of employees.
Customs and excise taxes: Duties on imports at various rates.
VAT: Value Added Tax has replaced Sales Tax. The rate is 17.5 per cent on all vatable supplies.
Personal levy: Charged by councils on gross salaries of employees at 1 per cent after an allowance of K300,000 allowances.
Rates: Payable to the council on all rateable properties at a rate of 1,015 per cent.
Withholding tax: A withholding tax rate of 15 per cent is levied on income from divi-dends, rent, entertainment, contractor, and supplies and interest (above K60,000).
•
•
•
•
•
•
•
•
•
•
•
•
•
•
•
•
•
•
•
10_Africa_Report09_Zambia.indd 23710_Africa_Report09_Zambia.indd 237 2/25/09 4:26:29 PM2/25/09 4:26:29 PM
238
Country Report for Zambia
OU
TS
OU
RC
IN
G
TO
A
FR
IC
AIndividuals: The tax rates applicable to individuals are as follows (husband and wife are each entitled to separate rates):
First K600,000 Free; available as a tax credit of K60,000
Next K600,000 10 per cent
Next K600,000 20 per cent
Over K1,800,000 30 per cent
13. Investment Policy and Incentives
The Government of Zambia does incentives for investors and exporters. The informa-tion is available in the website of the new Zambia Development Agency (http://www.zda.org.zm).
As we complete this report, parts of this website are under construction but the basic information is available. The agency at the moment has the look and feel of a regula-tor rather than a promoter of investment.
There are no specifi c incentives for outsourcing or BPO as in South Africa or Botswana. The incentives available are listed, and it has to be determined what will be applicable to outsourcing.
General Incentives
Income from farming shall be taxed at a rate of 15 per cent.
Portion of income which is determined by the Commissioner of Taxes as originating from the export of non-traditional products is taxed at a rate of 15 per cent.
Income received from a rural enterprise for each of the fi rst fi ve years of operation will be exempt from tax.
Capital allowances: An investor will be entitled to a capital allowance which shall be deducted in ascertaining the gains or profi ts at the following special rates:
Building used for manufacturing, mining, and hotels qualify for a wear and tear allowance of 5 per cent per year plus an initial allowance of 10 per cent of the cost in the year in which the building was fi rst used.
Implements, machinery, and plant used exclusively for farming, manufacturing and tourism qualify for a wear and tear allowance of 50 per cent per year of the cost in the fi rst two years (straight line).
Capital expenditure on farm improvements qualify for a farm improvement allowance of 100 per cent in the year the expenditure is incurred.
The wear and tear allowance on non-commercial vehicles is 20 per cent (straight line).
Expenditure on other assets used in creating income qualifi es for a wear and tear allowance of 25 per cent (straight line).
Income tax deductions: An investor shall be entitled to the following deductions in ascertaining the gains or profi ts:
Any loss incurred other than in investment in mining in any charge year shall be deducted only from the income of the investor from the same source as that in which
•
•
•
•
•
•
•
•
•
•
•
•
•
•
•
•
•
•
•
•
10_Africa_Report09_Zambia.indd 23810_Africa_Report09_Zambia.indd 238 2/25/09 4:26:29 PM2/25/09 4:26:29 PM

Country Report for Zambia
239
OU
TS
OU
RC
IN
G
TO
A
FR
IC
Aloss was incurred. Such loss shall be deducted from his income in the following year from year to year.
Any payments made for the purpose of technical education by a business enterprise, or for the purpose of obtaining further experience, training, or qualifi cation, relat-ing to that business enterprise.
Any expenditure, not being expenditure of a capital nature incurred by a busi-ness enterprise during the current year on experiments or research relating to that business enterprise.
Bonded facility: An investor may apply to be appointed and licensed by the Commissioner General to establish and operate a bonded factory under Section 65 of the Customs and Excise Act.
Special incentives: An investor who qualifi es in one of the fi ve categories below shall be entitled, in addition to the general incentives, to an exemption from customs duties and sales duties on all machinery and equipment (other than motor vehicles) required for the establishment, rehabilitation, or expansion of that enterprise:
An exporter of non-traditional products (other than copper) which result in net foreign exchange earnings, or
Produces products for the use locally in agriculture and the production of agricul-tural commodities or other agro-related products for export, or
Is engaged in tourism resulting in foreign exchange earnings in excess of 25 per cent of the gross annual earnings of the business unit, or
Is engaged in an import substitution industry using a signifi cant proportion of local raw materials resulting in net foreign exchange savings, or is located in a rural area.
14. Government Agencies Giving Support to Outsourcing
These are no agency specifi cally for ICT or the Outsourcing Industry. A potential investor would have to approach the Zambia Development Agency.
Zambia Development Agency
XY Building (Privatization House)
New Government Complex Annex
Nasser Road
Lusaka
Tel: (+260) 1-220177/223859 (main),
(+260) 1-222176 (Small Enterprises),(+260) 1-254214 (Investments),
(+260) 1-228106 (Exports); Fax: (+260) 1-225270
Websites: http://www.zpa.org.zm
http://www.ebz.co.zm
http://www.zic.org.zm
•
•
•
•
•
•
•
•
•
10_Africa_Report09_Zambia.indd 23910_Africa_Report09_Zambia.indd 239 2/25/09 4:26:29 PM2/25/09 4:26:29 PM

240
Country Report for Zambia
OU
TS
OU
RC
IN
G
TO
A
FR
IC
A15. Overall Assessment and Recommendations
Zambia is the third in the up and fi fth in the share of ICT in service exports. Thus there is a potential to be exploited.
Zambia could, like Kenya, approach the Indian Fund for Technical Cooperation or the Commonwealth Fund for Technical Cooperation (CFTC) to fi nance a study to map a strategy to make the best of this potential.
16. Contact Details
Embassy of Zambia in China, France, Germany, India, UK, USA
Zambian Embassy in Beijing
Embassy of Zambia
5 Dong Jie San Li Tun
Beijing 100600
P.R. of China
Beijing
Tel: (+86-10) 65321778, 65321554; Fax: (+86-10) 65321891
E-mail: [email protected]
Zambian Embassy in Paris
Embassy of Zambia
Paris, France
Paris
Tel: (+33-1) 56881270; Fax: (+33-1) 4225698
Zambian Embassy in Berlin
Zambia Embassy in Germany
Axel-Springer-Str. 54a
10117 Berlin
Germany
Berlin
Tel: (+49-228) 2062940; Fax: (+49-228) 20629419
Zambian Consulate in New Delhi
Zambia High Commission
F-8/22 Vasant Vihar
New Delhi 110057
India
New Delhi
Tel: (+91-11) 26877681, 26877848, (+91-11) 24101289; Fax: (+91-11) 26147928
E-mail: [email protected], [email protected]
•
•
10_Africa_Report09_Zambia.indd 24010_Africa_Report09_Zambia.indd 240 2/25/09 4:26:29 PM2/25/09 4:26:29 PM

Country Report for Zambia
241
OU
TS
OU
RC
IN
G
TO
A
FR
IC
AZambian Consulate in London
Zambia High Commission in London, United Kingdom
2 Palace Gate, Kensington
London W8 5NG
United Kingdom
London
Tel: (+44-20) 75896655; Fax: (+44-20) 75811353
E-mail: [email protected]
Zambian Embassy in Washington DC
Embassy of Zambia in Washington DC, United States
2419 Massachusetts Avenue
NW Washington DC 20008
Washington DC
Tel: (202) 265-9717; Fax: (202) 265- 9718
E-mail: [email protected], [email protected]
Website: http://www.zambiaembassy.org
Useful Links
The World Fact book 2007.
https://www.cia.gov/cia/publications/factbook/geos/za.html
Critical Issues for Children, ESARO. 2007. UNICEF.
http://www.unicef.org/har07/index_37543.htm
Where We Work – Zambia. 2007. World Food Program.
http://www.wfp.org/country_brief/indexcountry.asp?region=3§ion=9&sub_section=3&country=894
Hesselmark, O. and P. Esselaar. “A Country ICT Survey for Zambia.” 2003. Sida.
List of Countries by Human Development Index. Wikipedia.
http://en.wikipedia.org/wiki/List_of_countries_by_Human_DevelopmentIndex#Low
DFID: Zambia.
http://www.dfi d.gov.uk/countries/africa/zambia.asp
Zambian Ministry of Education. 2006. National ICT Policy.
http://education.stateuniversity.com/pages/1698/Zambia-EDUCATIONAL-SYSTEM-OVERVIEW.html.
Critical Issues for Children. ESARO. 2007. UNICEF.
http://www.unicef.org/har07/index_37543.htm
10_Africa_Report09_Zambia.indd 24110_Africa_Report09_Zambia.indd 241 2/25/09 4:26:30 PM2/25/09 4:26:30 PM

242
Country Report for Zambia
OU
TS
OU
RC
IN
G
TO
A
FR
IC
AThe World Fact book 2007.
https://www.cia.gov/cia/publications/factbook/geos/za.html
DFID: Zambia.
http://www.dfi d.gov.uk/countries/africa/zambia.asp
World Telecommunications Development Report. 2006. ITU.
“NEPAD ICT Infrastructure Program: Addressing Africa’s ICT Infrastructure Challenges Using
Broadband Networks.” E-Africa Commission.
http://www.doc.gov.za/signing/Infrastructure.pdf
Zulu, B. “Zambia’s National Development Plan 2006-2010.” ICT Journalist. 19 August 2006.
http://brendait.blogspot.com/2006/08/zambias-national-development-plan-2006.html
“Zambia: New National ICT Policy.” Pambazuka News. 30 March 2007.
http://www.pambazuka.org/en/category/internet/40552
Draft ICT Policy. 2006. Ministry of Education. 2006.
SURVEY OF ICT AND EDUCATION IN AFRICA: Zambia Country Report Zambia—12.
http://www.infodev.org
Draft MOE ICT Policy: Implementation Framework: Objectives, Activities, Timeframes, Budgets.
January 2007. Ministry of Education.
http://portal.unesco.org/ci/en/ev.phpURL_ID=13920&URL_DO=DO_TOPIC&URL_SECTION=201.html
http://www.iicd.org/fi les/NdolaResourceCentreZambia.pdf/view?searchterm=zambia
10_Africa_Report09_Zambia.indd 24210_Africa_Report09_Zambia.indd 242 2/25/09 4:26:30 PM2/25/09 4:26:30 PM
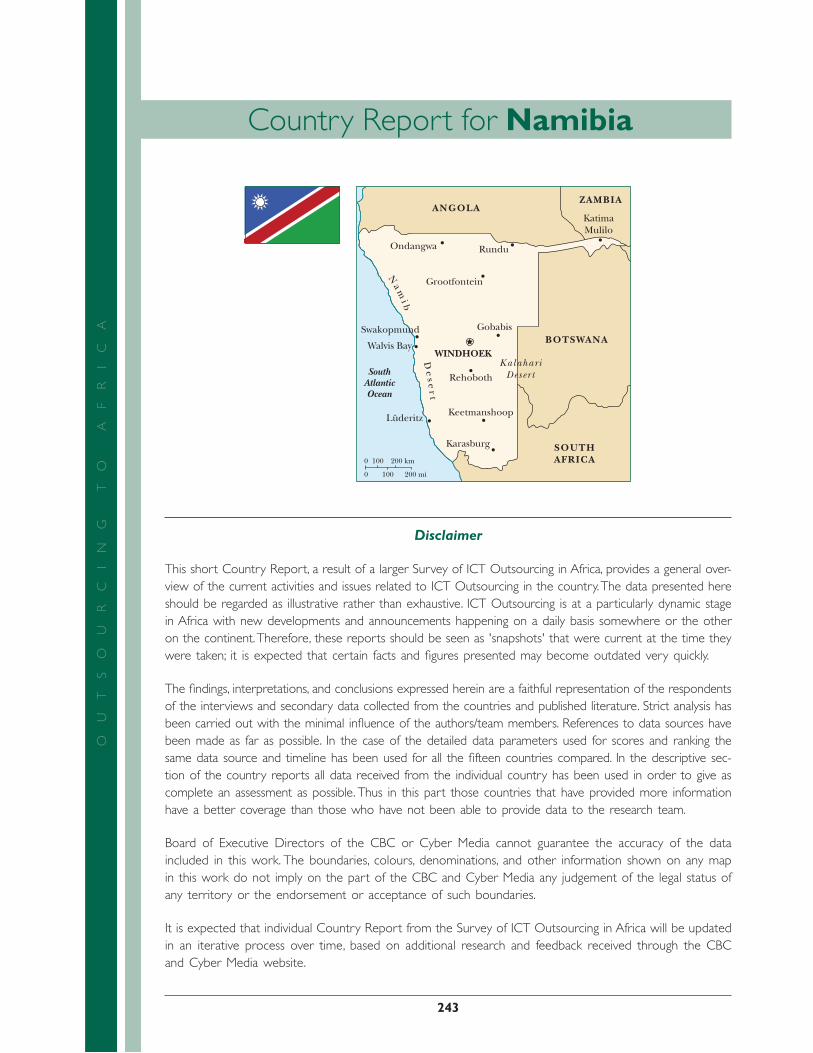
243
OU
TS
OU
RC
IN
G
TO
A
FR
IC
A
Country Report for Namibia
Disclaimer
This short Country Report, a result of a larger Survey of ICT Outsourcing in Africa, provides a general over-view of the current activities and issues related to ICT Outsourcing in the country. The data presented here should be regarded as illustrative rather than exhaustive. ICT Outsourcing is at a particularly dynamic stage in Africa with new developments and announcements happening on a daily basis somewhere or the other on the continent. Therefore, these reports should be seen as 'snapshots' that were current at the time they were taken; it is expected that certain facts and fi gures presented may become outdated very quickly.
The fi ndings, interpretations, and conclusions expressed herein are a faithful representation of the respondents of the interviews and secondary data collected from the countries and published literature. Strict analysis has been carried out with the minimal infl uence of the authors/team members. References to data sources have been made as far as possible. In the case of the detailed data parameters used for scores and ranking the same data source and timeline has been used for all the fi fteen countries compared. In the descriptive sec-tion of the country reports all data received from the individual country has been used in order to give as complete an assessment as possible. Thus in this part those countries that have provided more information have a better coverage than those who have not been able to provide data to the research team.
Board of Executive Directors of the CBC or Cyber Media cannot guarantee the accuracy of the data included in this work. The boundaries, colours, denominations, and other information shown on any map in this work do not imply on the part of the CBC and Cyber Media any judgement of the legal status of any territory or the endorsement or acceptance of such boundaries.
It is expected that individual Country Report from the Survey of ICT Outsourcing in Africa will be updated in an iterative process over time, based on additional research and feedback received through the CBC and Cyber Media website.
ZAMBIAANGOLA
WINDHOEK
SOUTHAFRICA
BOTSWANA
KatimaMulilo
RunduOndangwa
Grootfontein
Gobabis
KalahariDeser tRehoboth
Keetmanshoop
Karasburg
Luderitz
SouthAtlanticOcean
0
Nam
i b
De
s er
t
100 200 km
0 100 200 mi
Walvis Bay
¨
Swakopmund
11_Africa_Report09_Namibia.indd 24311_Africa_Report09_Namibia.indd 243 2/25/09 4:27:01 PM2/25/09 4:27:01 PM

244
Country Report for Namibia
OU
TS
OU
RC
IN
G
TO
A
FR
IC
A1. Overview
Namibia, offi cially the Republic of Namibia, is a country in southern Africa on the Atlantic coast. It shares borders with Angola and Zambia to the north, Botswana to the east, and South Africa to the south. It gained independence from South Africa in 1990, and its capi-tal city is Windhoek (German: Windhuk). Namibia is a member state of the United Nations (UN), the Southern African Development Community (SADC), the African Union (AU), and the Commonwealth of Nations. It is named after the Namib Desert and is the second most sparsely populated country in the world (after Mongolia).
Once a colony of Germany and later occupied by South Africa’s apartheid government, Namibia gained full independence in 1990 following South Africa’s withdrawal from Angola. Namibia is one of Africa’s most developed and stable countries, with a stable multi-party parliamentary democracy and an estimated population of 1,820,916. Tourism and diamond mining form the backbone of Namibia’s economy.
Namibia’s economy consists primarily of mining and manufacturing which represent 8 per cent of the gross domestic product (GDP) respectively. Namibia has a 30–40 per cent unem-ployment rate and recently passed a 2004 labour act to protect people from job discrimina-tion stemming from pregnancy and HIV/AIDS status. Namibia’s economy is tied closely to South Africa’s due to their shared history. The Central Plateau serves as a transportation corridor from the more densely populated north to South Africa, the source of four-fi fths of Namibia’s imports. Namibia is the fourth largest exporter of non-fuel minerals in Africa and the world’s fi fth largest producer of uranium. There has been signifi cant investment in uranium mining, and Namibia is set to become the largest exporter of uranium by 2015. Rich alluvial diamond deposits make Namibia a primary source for gem-quality diamonds. Namibia also produces large quantities of lead, zinc, tin, silver, and tungsten.
2. Namibia’s Position in Africa’s Fifteen Countries
Namibia is in the fourth position in the yet upcoming band of countries from the outsourc-ing attractiveness point of view. The map and table below show where Namibia is positioned among the fi fteen studied countries.
11_Africa_Report09_Namibia.indd 24411_Africa_Report09_Namibia.indd 244 2/25/09 4:27:02 PM2/25/09 4:27:02 PM

Country Report for Namibia
245
OU
TS
OU
RC
IN
G
TO
A
FR
IC
A
Morocco *
Morocco
Tunisia *
Geographical Coverage and Rank
Tunisia
Egypt *
Egypt
Senegal *
Senegal
GhanaGhana
Nigeria
Nigeria
Uganda
Uganda
Kenya
KenyaTanzania
Tanzania
Zambia
Zambia
Mozambique MozambiqueBotswana
Botswana
Namibia
Namibia
SouthAfrica
South Africa
MauritiusAfrica
*Non-Commonwealth Countries
Mauritius
Contributing scores and ranks are as under.
Overall
Band Score (PS & BE) Rank
Upcoming 5.91 Fourth
Infrastructure
Score Rank Band
5.7 11 Upcoming
While achieving the thirteenth position in score for ‘Infrastructure’, Namibia is eight in electricity availability, last in telecommunications and data transfer costs, tenth in network readiness, thirteenth in infrastructure cost, sixth in availability and penetration, second in the road/rail network and air travel, and eighth in international Internet bandwidth.
People and Skills (PS)
Score Rank
2.933 11
Namibia is the eleventh in the case of ‘People and Skills’, being fi fteenth in quantity, eighth in quality, sixth in working satisfaction, and fi fth in ICT exposure; it has ranked
11_Africa_Report09_Namibia.indd 24511_Africa_Report09_Namibia.indd 245 2/25/09 4:27:03 PM2/25/09 4:27:03 PM

246
Country Report for Namibia
OU
TS
OU
RC
IN
G
TO
A
FR
IC
Asixth in human resource costs and has the last position in education, language, and domain skills.
Business Environment (BE)
Score Rank
2.976 9
Namibia ranked ninth in this lower level abstraction. In achieving this position it has come eighth in ICT security, Cyber, and IPR laws, sixth in share of services in GDP. Namibia has the lowest foreign exchange reserves and is the sixth in ease and cost of fi nances, twelfth for share in ICT in exports and fourth position in legislative risk. In the tax rate Namibia is fourth, and in share of services in exports it has come eighth. Namibia has scored seventh and fourteenth respectively in geopolitical risk and currency risk.
3. Country, Political, and Economic Profi le
Geography
Area: 823,145 sq km (320,827 sq mi); the size of Texas and Louisiana combined.
Cities: Capital—Windhoek (2001 census) pop. 233,529.
Other cities: Grootfontein, Katima Mulilo, Keetmanshoop, Luderitz, Ondangwa, Oranjemund, Oshakati, Otjiwarongo, Swakopmund, Tsumeb, Walvis Bay.
Terrain: Varies from coastal desert to semi-arid mountains and plateau.
Climate: Semi desert and high plateau.
People
Nationality: Noun and adjective—Namibian(s).
Population (2008, projected): 2.1 million.
Average annual growth rate (2001 est.): 2.6 per cent. The population growth rate is depressed by an HIV/AIDS prevalence rate estimated to be 15.3 per cent.
Ethnic groups: About 50 per cent of the population belong to Ovambo ethnic group, and 9 per cent to the Kavango ethnic group. Other ethnic groups are: Herero 7 per cent, Damara 7 per cent, Nama 5 per cent, Caprivian 4 per cent, San 3 per cent, Baster 2 per cent, and Tswana 0.5 per cent.
Religions: Predominantly Christian; also indigenous beliefs.
Languages: English (offi cial); Afrikaans, German, Oshivambo, Herero, Nama/Damara, other indigenous languages.
Education: Years compulsory—to age sixteen.
Attendance (2001): 82 per cent.
Adult literacy rate (2005): 85 per cent.
Work force (2004): 493,448.
11_Africa_Report09_Namibia.indd 24611_Africa_Report09_Namibia.indd 246 2/25/09 4:27:03 PM2/25/09 4:27:03 PM

Country Report for Namibia
247
OU
TS
OU
RC
IN
G
TO
A
FR
IC
AGovernment
Type: Republic.
Independence: 21 March 1990.
Branches: Executive—President (elected for fi ve-year term), Prime Minister.
Legislative—bicameral parliament: National Assembly and National Council.
Judicial: Supreme Court, the High Court, and lower courts.
Subdivisions: Thirteen administrative regions.
Major political parties: South West Africa People’s Organization (SWAPO), Democratic Turnhalle Alliance (DTA), United Democratic Front of Namibia (UDF), Congress of Democrats (COD), Republican Party (RP), National Unity Democratic Organization (NUDO), Monitor Action Group (MAG).
Suffrage: Universal adult.
Economy
GDP (2007): $6.7497 billion.
Annual growth rate (2007): 5.9 per cent.
Per capita GNI (2007): $3,360.
Infl ation rate (2008): 8.4 per cent.
Natural resources: Diamonds, uranium, zinc, gold, copper, lead, tin, fl uorspar, salt, fi sheries, and wildlife.
Agriculture (10.6 per cent of GDP, 2007): Products—livestock and meat products, fi sh and fi sh products, grapes.
Mining (12.4 per cent of GDP, 2007): Gem-quality diamonds, uranium, zinc, copper, other.
Trade: Exports (2007)—$4.36 billion; diamonds, uranium, zinc, copper, lead, beef, cattle, fi sh, karakul pelts, and grapes.
Imports (2007): $4.56 billion; foodstuffs, construction material, manufactured goods.
Major partners: South Africa, Angola, Botswana, Germany, UK, US.
Sources: Namibia Central Bureau of Statistics (CBS); Namibia Labour Force Survey; Namibia Population and Housing Census; Bank of Namibia; World Bank; UN Human Development Report.
People
Namibians are of diverse ethnic origins. The principal groups are the Ovambo, Kavango, Herero/Himba, Damara, mixed race (‘colored’ and Rehoboth Baster), white (Afrikaner, German, and Portuguese), Nama, Caprivian, San, and Tswana.
The Ovambo make up about half of Namibia’s people. The Ovambo, Kavango, and East Caprivian peoples, who occupy the relatively well watered and wooded northern part of the country, are settled farmers and herders. Historically, these groups had little contact with the Nama, Damara, and Herero, who roamed the central part of the country vying for control of sparse pastureland. German colonial rule destroyed the war-making ability of the tribes
11_Africa_Report09_Namibia.indd 24711_Africa_Report09_Namibia.indd 247 2/25/09 4:27:03 PM2/25/09 4:27:03 PM

248
Country Report for Namibia
OU
TS
OU
RC
IN
G
TO
A
FR
IC
Abut did not erase their identities or traditional organization. People from the more populous north have settled throughout the country in recent decades as a result of urbanization, industrialization, and the demand for labour.
Missionary work during the 1800s drew many Namibians to Christianity. While most Namibian Christians are Lutheran, there also are Roman Catholic, Methodist, Anglican, Jewish, African Methodist Episcopal, and Dutch reformed Christians represented.
Education and services have been extended in varying degrees to most rural areas in recent years. Although the national literacy rate is quite high (estimated to be 85 per cent), it is important to note that the number of Namibians that are functionally literate and have the skills that the labour market needs is signifi cantly lower.
4. Principal Government Offi cials
President: Hifi kepunye Pohamba.
Prime Minister: Nahas Angula.
Deputy Prime Minister: Libertina Amathila.
Minister of Trade and Industry: Hage Geingob.
Minister of Information and Communication Technology: Joel Kaapanda.
5. Foreign Relations
Namibia follows a largely independent foreign policy, with lingering affi liations with states that aided the independence struggle, including Libya, the People’s Republic of China and Cuba.
Namibia is developing trade and strengthening economic and political ties within the Southern African region. A dynamic member of the Southern African Development Community (SADC) and the Southern African Customs Union (SACU), Namibia is a vocal advocate for greater regional integration.
Namibia became the 160th member of the United Nations on 23 April 1990, and the fi ftieth member of the British Commonwealth upon independence.
6. Living, Security, and Safety Perceptions
Crime is a concern in Namibia, but visitors who employ common-sense preventive measures normally enjoy an incident-free stay.
Incidents of violent crime directed specifi cally against foreigners are rare, but the number of overall incidents continues to increase.
The most common crimes are property-motivated crimes of opportunity, including pick-pocketing, purse snatching, vehicle theft, and vehicle break-ins.
Taxi drivers have robbed several passengers; if taxis must be used, radio taxis that dis-play the NABTA logo (Namibia Bus and Taxi Association) are the most reliable.
•
•
•
•
•
•
•
11_Africa_Report09_Namibia.indd 24811_Africa_Report09_Namibia.indd 248 2/25/09 4:27:03 PM2/25/09 4:27:03 PM

Country Report for Namibia
249
OU
TS
OU
RC
IN
G
TO
A
FR
IC
AViolent crimes are less frequent than non-violent incidents. Common sense measures such as being alert to one’s surroundings, avoiding isolated areas of town, not leaving valuables in parked cars, keeping car doors locked and windows up while driving, safe-guarding purses, wallets, and especially cellular phones are the best deterrents against becoming a victim.
Drivers should exercise caution at rest stops outside of towns or away from gasoline stations.
Medical care is expensive, and it is necessary to have a valid medical insurance with provision of evacuation to South Africa in the case of emergencies.
7. ICT Policy, Infrastructure, and Service
ICT Policies
The Namibian government developed Vision 2030 as its national plan to ‘improve the quality of life of the people of Namibia to the level of their counterparts in the devel-oped world by 2030.’
The policy aims to transform Namibia into a healthy and food-secure nation, in which all preventable, infectious, and parasitic diseases (including HIV/AIDS) are under con-trol, and where people enjoy a high standard of living, good quality life, and have access to quality education, health, and other vital services.
All of these aspirations translate into a long life expectancy and sustainable population growth. In support of the objectives of 2030, capacity-building will be pursued by both the private and public sectors and will continue to be promoted by the existence of a suitable enabling environment in terms of political stability and freedom, a sound legal system, economic resources and opportunities, and social norms that are conducive to sustained development.
As required by Vision 2030, the country will operate a totally integrated, unifi ed, fl ex-ible, and high-quality education and training system that prepares Namibian learners to take advantage of a rapidly changing global environment, including developments in science and technology.
Arising from the overall capacity-building investments, Namibia will be transformed into a knowledge-based society.
Infrastructure
According to the World Economic Forum’s Global Information Technology Report, Namibia ranks seventy-eighth out of 115 economies using the networked readiness index (NRI) which measures the degree of preparation of a nation to participate in and benefi t from ICT developments. Namibia’s rank is ahead of Uganda, Nigeria, Mali, Mozambique, and Zimbabwe.
•
•
•
•
•
•
•
•
•
11_Africa_Report09_Namibia.indd 24911_Africa_Report09_Namibia.indd 249 2/25/09 4:27:04 PM2/25/09 4:27:04 PM
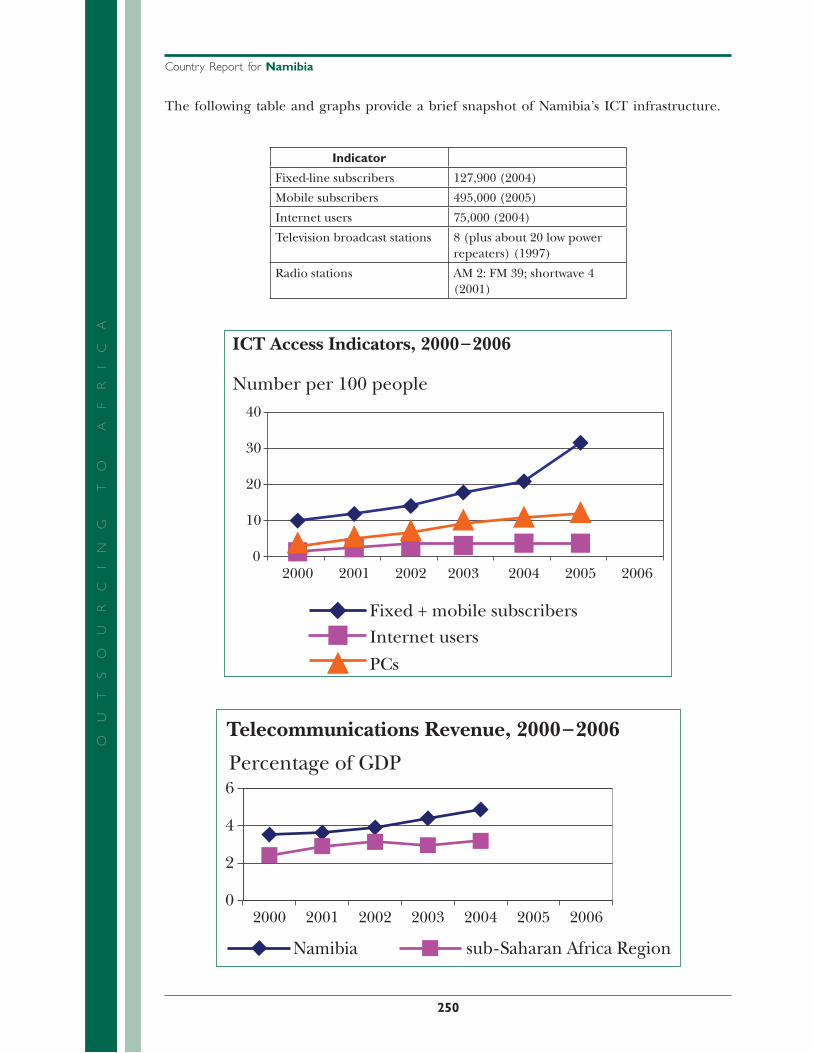
250
Country Report for Namibia
OU
TS
OU
RC
IN
G
TO
A
FR
IC
AThe following table and graphs provide a brief snapshot of Namibia’s ICT infrastructure.
Indicator
Fixed-line subscribers 127,900 (2004)
Mobile subscribers 495,000 (2005)
Internet users 75,000 (2004)
Television broadcast stations 8 (plus about 20 low power repeaters) (1997)
Radio stations AM 2: FM 39; shortwave 4 (2001)
40
Number per 100 people
ICT Access Indicators, 2000–2006
30
20
10
02000 2001 2002 2003 2004 2005 2006
Fixed + mobile subscribersInternet users
PCs
Telecommunications Revenue, 2000–2006
Percentage of GDP
Namibia sub-Saharan Africa Region
2000
6
4
2
02001 2002 2003 2004 2005 2006
11_Africa_Report09_Namibia.indd 25011_Africa_Report09_Namibia.indd 250 2/25/09 4:27:04 PM2/25/09 4:27:04 PM
Country Report for Namibia
251
OU
TS
OU
RC
IN
G
TO
A
FR
IC
ANamibia’s close economic and historical links to South Africa means that its telecom market is one of the most developed on the continent. Its modern, fully digital telecom network has helped to drive growth in the Internet and mobile telephony sectors.
While mobile and fi xed-line services are still a monopoly, plans are underway to intro-duce competition in both sub-sectors. The Internet sector is open to competition, although the telecoms industry in general ranks comparatively low in terms of openness of the telecommunications market.
The Telecommunications Policy and Regulatory Framework (1999) describe a vision of universal access and liberalization of the telecommunications sector.
The draft Telecommunications Bill provides for the regulation of telecommunication activities including the use and allocation of radio spectrum and the establishment of an independent Namibian Communications Authority.
The bill’s aim of universal access is pivotal to Namibia’s vision, and a universal service fund (USF) will be established and administered by the regulator. The existing telecom-munications regulatory framework provides for a universal service obligation (USO) by the monopolies.
The liberalisation of the telecommunications sector will introduce competition as a means of accelerating infrastructure development, increasing effi ciency, and diversify-ing services, thereby making government’s decentralisation efforts cheaper and increas-ing Namibia’s attractiveness for foreign investment.
Physical Infrastructure
Offi ce market: Following a period of sustained rental and capital value growth in the capital Windhoek, demand mainly from overseas companies looking to invest in the expanding mineral extraction fi eld has reduced. The offi ce market has now cooled as a result of this demand for accommodation having been satisfi ed. Consequently, rental levels have stabilised. There is approximately 5,000 sq m of modern offi ce space cur-rently available.
Retail market: The profi le of demand in the retail sector is similar to the offi ce market, with sustained growth over the last few years. Increased demand has now been satis-fi ed by the refurbishment of Town Square, which comprises a mixed use commercial development in Windhoek city centre as well as the 40,000 sq m Maerua Mall, which is located to the south of the city centre.
Industrial market: The industrial property sector is limited, due to the fact that Namibia does not have a large industrial market. Most space is either taken for warehouse pur-poses or as smaller ‘lock-up’ units by companies providing service industries rather than manufacturing. There is currently an oversupply of older industrial space.
Residential market: The residential market has been healthy in recent years, with strong demand evident from the public wanting to buy their own homes, coupled with an infl ux of ex-residents returning from abroad as a result of the perception that the country’s economy has now stabilised. There have been year-on-year price increases for over a decade, most notably in the high-cost areas of Ludwigsdorf, Eros, and Klein Windhoek, where price increases have been between 12–15 per cent per annum over the last few years.
•
•
•
•
•
•
•
•
•
•
11_Africa_Report09_Namibia.indd 25111_Africa_Report09_Namibia.indd 251 2/25/09 4:27:05 PM2/25/09 4:27:05 PM

252
Country Report for Namibia
OU
TS
OU
RC
IN
G
TO
A
FR
IC
APrime rents Prime yields
Offi ces US$ 15 per sq m per month 10.5%
Retail US$ 31 per sq m per month 10.5%
Industrial US$ 6 per sq m per month 12.5%
Residential US$ 1,950 per month* 10.5%
*4 bedroom executive house--prime location(Source: Knight Frank LLP)
8. ICT and BPO Industry Environment
There is no signifi cant outsourcing or BPO operation found in Namibia. The investment guides do not consider this as a potential investment opportunity.
9. Human Resource Effi ciency and Cost
Namibia is in the top fi ve in ICT exposure and sixth in work satisfaction. Namibia has ranked eleventh in people and skills fairing as low as fi fteenth in quantity and eighth in quality.
Namibia has played a pioneering and visionary role in Africa in the area of ICTs in education and serves as a beacon for many organizations and groups operating across the continent. Namibia offers innovative options on affordable and sustainable access to ICTs through the active involvement of local youth under the leadership of School Net Namibia. In addition to a visionary national ICT for education policy, the Namibian government has also taken the lead in committing a dedicated budget to support ICTs in education and the establishment of machinery for co-ordinated multi-stakeholder collaboration.
Thus Namibia has a potential to do better in the human resource scores.
10. Legal and Enforcement Issues
The Namibian legal system protects and facilitates acquisition and disposition of prop-erty rights. The Registrar of Companies, Patents and Trademarks in Windhoek admin-isters the registration of patents and designs. These laws include the Trademarks Act of 1963, the Designs Act of 1967 and the Patents Act of 1978; these provisions are generally in line with international norms.
Namibia is a member of the Berne Convention for the Protection of Literary and Artistic Works. As a member of SADC, Namibia is expected to adopt and implement measures in accordance with the Trade Related Aspects of Intellectual Property Rights (TRIPS).
Two ministries share responsibility for IPR protection. The Ministry of Information and Broadcasting manages copyrights and the Ministry of Trade and Industry’s Directorate for International Trade oversees industrial property and is responsible for registrations of companies, private corporations, patents, trademarks, and designs.
•
•
•
•
•
•
11_Africa_Report09_Namibia.indd 25211_Africa_Report09_Namibia.indd 252 2/25/09 4:27:05 PM2/25/09 4:27:05 PM
Country Report for Namibia
253
OU
TS
OU
RC
IN
G
TO
A
FR
IC
ANamibia is a member of regional bodies, such as the African Industrial Property Organization (ARIPO) and its Banjul Protocol governing trademarks and the Harare Protocol on patents.
Namibia is a member of the World Intellectual Property Organization. Namibia is currently drafting copyright legislation containing measures to implement the WIPO Internet Treaties. In the absence of new legislation, Namibia lacks adequate enforcement mechanisms to address problems associated with piracy and copyright violations.
11. Labour and Expatriate Worker’s Permits
The criteria for obtaining business visas, short-term and long-term work and residence permits and permanent residence are well defi ned and followed strictly. The websites of the embassies provide this information.
12. Revenue, Tax, and Repatriation Issues
The standard corporate tax rate is 30 per cent and dividends accruing to local compa-nies and resident shareholders are tax exempt. Import or purchase of manufacturing machinery is exempt from GST and Additional Sales Levy (ASL). GST is 10 per cent on goods and services; the ASL rate varies between zero and 25 per cent, depending on the perceived necessity or luxury status of the goods concerned.
There is a 50 per cent tax deduction on taxable income from manufacturing enter-prises for fi ve years which is then phased out on a proportional basis over the following ten years. In addition, for businesses setting up in Namibia, a special tax rate can be negotiated with the Ministry of Trade and Industry. There are also a variety of other incentives accorded to exporters including support for export promotion and training. Non-resident shareholder’s tax is 10 per cent.
The Namibian Stock Exchange is the second largest in Africa when measured by mar-ket capitalisation—a total of about US$ 30 billion at Namibia has a liberalised foreign exchange regime, and foreign investors may repatriate all profi ts and dividends.
There are foreign exchange controls in Namibia, and procedures need to be followed while transferring funds in or out of Namibia.
In terms of tax and cost and ease of fi nances Namibia is fourth and sixth, respectively.
13. Investment Policy and Incentives
Investment incentives concentrate on stimulating the manufacturing sector in Namibia and promoting exports to the region and the rest of the world. Foreign investors are treated on par with local special circumstances where the government will intervene to protect a local industry from being dominated by a foreign competitor. A variety of tax incentives are in place to stimulate local and foreign trade under Free Trade Zones and Taxation). Companies with over 75 per cent foreign ownership are affected by exchange control regulations.
•
•
•
•
•
•
•
•
•
11_Africa_Report09_Namibia.indd 25311_Africa_Report09_Namibia.indd 253 2/25/09 4:27:05 PM2/25/09 4:27:05 PM

254
Country Report for Namibia
OU
TS
OU
RC
IN
G
TO
A
FR
IC
ANamibia’s Foreign Investment Act of 1990 guarantees equal treatment of foreign and local investors. The act further provides for the following:
Liberal foreign investment conditions.
Non-discriminatory access to all sectors of the economy.
No local participation requirement.
Full protection of investments.
Repatriation of capital.
Right to remit profi ts.
Access to foreign exchange.
International arbitration in the case of disputes between investors and the govern-ment, and air compensation in the event of expropriation.
A summary of incentives is in the following table. It is expected that the incentives applicable to exports and export processing zones.
Summary of Special Incentives for Manufacturers and Exporters
Registered ManufacturersExporters of Manufactured Goods
Export Processing Zone Enterprises
Eligibility and registration
• Enterprises engaged in manufacturing.
• Application to the Ministry of Trade and Industry and approval by the Ministry of Finance.
Enterprises that export manufactured goods whether produced in Namibia or not. Application and approval by the Ministry of Finance.
Enterprises engaged in manufacturing, assembly, packaging or break-bulk and exporting mainly to outside of SACU markets.
Application to the EPZ Committee through the ODC or EPZMC.
Corporate tax Set at a rate of 18 per cent for a period of 10 years, whereafter it will revert to the general prevailing rate.
80 per cent allowance on income derived from exporting manufactured goods.
Exempt.
VAT Exemption on purchase and import of manufacturing machinery and equipment.
Normal treatment. Exempt.
Stamp & transfer duty
Normal treatment. Normal treatment. Exempt.
Establishment tax package
Negotiable rates and terms by special tax package.
Not eligible. Not eligible.
Special building allowance
Factory buildings written off at 20 per cent in fi rst year and balance at 8 per cent for 10 years.
Not eligible. Not eligible.
Transportation allowance
Allowance for land-based transportation by road or rail of 25 per cent deduction from total cost.
Not eligible. Not eligible.
•
•
•
•
•
•
•
•
•
•
Contd...
11_Africa_Report09_Namibia.indd 25411_Africa_Report09_Namibia.indd 254 2/25/09 4:27:06 PM2/25/09 4:27:06 PM

Country Report for Namibia
255
OU
TS
OU
RC
IN
G
TO
A
FR
IC
A
Registered ManufacturersExporters of Manufactured Goods
Export Processing Zone Enterprises
Export promotion allowance
Additional deduction from taxable income of 25 per cent.
Not eligible. Not eligible.
Incentive for training
Additional deduction from taxable income of between 25 per cent and 75 per cent.
Not eligible. Substantial, issued by government on implementation of approved training programme.
Industrial studies Available at 50 per cent of cost. Not eligible. Not eligible.
Cash grants 50 per cent of direct cost of approved export promotion activities.
Not eligible. Not eligible.
14. Government Agencies Giving Support to Outsourcing
The Ministry of Trade and Industry has established the Investment Centre (IC) as the offi cial investment promotion and service centre for the country.
The Namibia Investment Center (NIC) is Namibia’s offi cial investment promotion and facilitation offi ce and is often potential investors’ fi rst point of contact. NIC’s compre-hensive services range from the initial inquiry stage through to operational stages. NIC provides general information packages and tailored advice on investment opportunities, incentives, and procedures. NIC can also help investors minimize bureaucratic obstacles by working closely with key sector ministries and service and regulatory bodies.
The Executive Director
Namibia Investment Centre
Ministry of Trade and Industry
Private Bag 13340
Windhoek, Namibia
Tel: (+264) 61-283-7335; Fax: (+264) 61-220278
E-mail: [email protected]
Website: http://www.mti.gov.na
The Chief Executive Offi cer
Offshore Development Company
Private Bag 13379
Windhoek, Namibia
Tel: (+264) 61-283-7360; Fax: (+264) 61-231001
E-mail: [email protected]
•
•
11_Africa_Report09_Namibia.indd 25511_Africa_Report09_Namibia.indd 255 2/25/09 4:27:06 PM2/25/09 4:27:06 PM

256
Country Report for Namibia
OU
TS
OU
RC
IN
G
TO
A
FR
IC
A15. Overall Assessment and Recommendations
Namibia has a sound and growing ICT infrastructure. It has a potential to have the people and skills.
The IPR and Cyber Laws Enforcement and ICT security are among the top fi ve.
Last but the most important is that Namibia being an investor in the West African Undersea Optic fi bre cable has not negotiated having a landing station for its own use and also for providing alternate routes to the land-locked sub-Saharan and central African nations.
It would be worthwhile for Namibia to commission a strategy study to fi nd the way forward.
16. Contact Details
Investment Promotion Agency(s)
There is no special agency for outsourcing industry. It will be necessary to convince the government that outsourcing is an export of services and must be eligible for export and export zone benefi ts. If necessary the investment law may have to be fi ne tuned. All potential investors are supported by the Namibian Investment Centre (NIC), whose contacts are given under.
Registration and Implementation: All manufacturing concerns claiming incentives must fi rst register with the Ministry of Trade and Industry, and, in respect of taxa-tion Incentives, must also be registered with the Ministry of Finance. The Minister of Finance is empowered to prescribe accounting procedures and regulations for manu-facturing enterprises qualifying for Taxation Incentives. To promote control and prevent the misuse of Taxation Incentives, enterprises qualifying for such incentives will not be relieved on the duty to submit fully substantiated annual tax returns.
Further Details
The Executive Director
Namibia Investment Centre
Ministry of Trade and Industry
Private Bag 13340
Windhoek, Namibia
Tel: (+264) 61-283-7335; Fax: (+264) 61-220278
E-mail: [email protected]
Website: http://www.mti.gov.na
To Obtain EPZ Status
The Chief Executive Offi cer
Offshore Development Company
Private Bag 13379
Windhoek, Namibia
Tel: (+264) 61-283-7360; Fax: (+264) 61-231001
E-mail: [email protected]
•
•
•
•
•
•
11_Africa_Report09_Namibia.indd 25611_Africa_Report09_Namibia.indd 256 2/25/09 4:27:06 PM2/25/09 4:27:06 PM
Country Report for Namibia
257
OU
TS
OU
RC
IN
G
TO
A
FR
IC
AOr
The Manager
Walvis Bay EPZ Management Company
Private Bag 5017
Walvis Bay, Namibia
Tel: (+264) 64-205095/7; Fax: (+264) 64-206132
E-mail: [email protected]
Website: http://www.mti.gov.na and go to investment centre.
Embassies of Namibia in UK, USA, Germany, France, China, and India
Embassy of the Republic of Namibia in Beijing, China
2-9—2 Ta Yuan
Diplomatic Offi ce Building
Beijing 100600
China
Beijing
Tel: (+86) 10-653-24810/1; Fax: (+86) 10-653-24549
E-mail: [email protected]
Embassy of Namibia in Paris, France
80 Avenue Foch
75016 Paris
Paris
Tel: 01.44.17.32.65; Fax: 01.44.17.32.73
Namibian Embassy in Berlin, Germany
Embassy of Namibia in Berlin, Germany
Wichmannstrasse 5
2nd Floor
10787
Berlin
Tel: (+49) 30-254-0950; Fax: (+49) 30-254-09555
E-mail: [email protected]
Namibian Consulate in New Delhi, India
High Commission of the Republic of Namibia in New Delhi, India
D-6/24 Vasant Vihar
110 057
New Delhi
Tel: (+91) 11-614-0389; Fax: (+91) 11-614-6120
E-mail: [email protected]
11_Africa_Report09_Namibia.indd 25711_Africa_Report09_Namibia.indd 257 2/25/09 4:27:06 PM2/25/09 4:27:06 PM

258
Country Report for Namibia
OU
TS
OU
RC
IN
G
TO
A
FR
IC
ANamibian Consulate in London, United Kingdom
High Commissioner: Mr Ringo F Abed
High Commission of Namibia in London, United Kingdom
Namibian High Commission
6 Chandos Street
London W1G 9LU
United Kingdom
London
Tel: (+44) 20-7636-6244; Fax: (+44) 20-7637-5694
E-mail: [email protected]
(Offi ce hours: Mon–Fri; 9 a.m.–1 p.m. and 2 p.m.–5 p.m.)
Namibian Embassy in Washington DC, United States
Embassy of the Republic of Namibia
1605 New Hampshire Avenue, NW,
Washington DC 20009
Washington DC
Tel: (+202) 986-0540
Useful Links
The World Fact book 2007.
https://www.cia.gov/cia/publications/factbook/geos/wa.html
EFA Global Monitoring Report. 2007. UNESCO.
http://portal.unesco.org/education/en/ev.php-
URL_ID=49591&URL_DO=DO_TOPIC&URL_SECTION=201.html
UNICEF Namibia: Statistics.
http://www.unicef.org/infobycountry/namibia_statistics.html
Bonelli, R. and J. Odada. J. ‘Human Capital and Knowledge Development for Economic Growth.’ 2003. World Bank.
Namibia: Government to overhaul education sector.
http://www.irinnews.org/report.aspx?reportid=53403
Global Information Technology Report.
http://www2.weforum.org/site/homepublic.nsf/Content/Global+Competitiveness+Programme/Global+Information+Technology+Report.html
11_Africa_Report09_Namibia.indd 25811_Africa_Report09_Namibia.indd 258 2/25/09 4:27:06 PM2/25/09 4:27:06 PM

Country Report for Namibia
259
OU
TS
OU
RC
IN
G
TO
A
FR
IC
AAssessing consumer activity in the telecoms and Internet sectors in Africa.
http://www.afridigital.net/downloads/IDRCconsumerdftV2.doc
Global eSchools and Communities Initiative.
http://www.gesci.org/gesci/publisher/index.jsp
TECH/NA, Namibia’s ICTs in Education Initiative.
http://www.tech.na
Ibid.
11_Africa_Report09_Namibia.indd 25911_Africa_Report09_Namibia.indd 259 2/25/09 4:27:07 PM2/25/09 4:27:07 PM

11_Africa_Report09_Namibia.indd 26011_Africa_Report09_Namibia.indd 260 2/25/09 4:27:07 PM2/25/09 4:27:07 PM

261
OU
TS
OU
RC
IN
G
TO
A
FR
IC
A
Country Report for Kenya
Disclaimer
This short Country Report, a result of a larger Survey of ICT Outsourcing in Africa, provides a general over-view of the current activities and issues related to ICT Outsourcing in the country. The data presented here should be regarded as illustrative rather than exhaustive. ICT Outsourcing is at a particularly dynamic stage in Africa with new developments and announcements happening on a daily basis somewhere or the other on the continent. Therefore, these reports should be seen as ‘snapshots’ that were current at the time they were taken; it is expected that certain facts and fi gures presented may become outdated very quickly.
The fi ndings, interpretations, and conclusions expressed herein are a faithful representation of the respond-ents of the interviews and secondary data collected. Strict analysis has been carried out with the minimal infl uence of the authors/team members. References to data sources have been made as far as possible. In the case of the detailed data parameters used for scores and ranking, the same data source and timeline has been used for all the fi fteen countries compared. In the descriptive section of the country reports all data received from the individual country has been used in order to give as complete an assessment as possible. Thus those countries that have provided more information have a better coverage than those who have not been able to provide data to the research team.
Board of Executive Directors of the CBC or Cyber Media cannot guarantee the accuracy of the data included in this work. The boundaries, colours, denominations, and other information shown on any map in this work do not imply on the part of the CBC and Cyber Media any judgement of the legal status of any territory or the endorsement or acceptance of such boundaries.
It is expected that individual Country Reports from the Survey of ICT Outsourcing in Africa will be updated in an iterative process over time, based on additional research and feedback received through the CBC and Cyber Media website.
MoyaleLodwar
Marsabit
Wajir
MeruEldoret
GarissaMountKenya
Lamu
Malindi
Mombasa
Machakos
NakuruKisumu
LakeRudolf
LakeVictoria
ETHIOPIA
SOMALIA
UGANDA
HIGHLANDS
INDIANOCEAN
NAIROBI
TANZANIA
SUDAN
KENYA
0 100 200 km
39
3936
42
42
33
33
0
0 100 200 mi
GREAT R
IFT V
ALLEY
12_Africa_Report09_Kenya.indd 26112_Africa_Report09_Kenya.indd 261 2/25/09 4:27:38 PM2/25/09 4:27:38 PM

262
Country Report for Kenya
OU
TS
OU
RC
IN
G
TO
A
FR
IC
A1. Overview
Kenya is situated in the eastern part of the African Continent. The country lies between 5° N and 5° S latitude and between 24° and 31° E longitude. It is almost bisected by the equator. Ethiopia and Sudan border it to the north; Uganda to the west; Tanzania to the south; Somalia to the north-east; and Indian Ocean to the south-east.
Kenya has diverse physical features, which are a major source of tourist attraction. These include: vast plains which are home to world famous game parks and reserves; the Great Rift Valley, which runs north to south and whose fl oor has provided potential for geothermal power generation; Mount Kenya, the second highest mountain in Africa, which is about 5,199m above sea level; Lake Victoria, the largest freshwater lake on the continent, and which supports the fi shing industry in the East Africa region; Lake Nakuru, another tourist attraction because of its fl amingos; Lake Magadi, famous for its soda ash; and a number of major rivers, including Tana and Athi, Sondu-Miriu, which generate the hydropower resources of the country; Yala, Nzoia and Mara, the major feeders into Lake Victoria.
Some parts of the country experience an equatorial kind of climate especially the central highlands, whereas along the coastline the climate is mainly tropical. The country has a bimo-dal type of climate. The arid and semi-arid lands depend mainly on livestock production.
Kenya is the most developed economy in Eastern Africa with a 2007 Gross Domestic Product (GDP) of approximately USD 27 billion (at an exchange of USD 1 to Kshs 67). It is also the economic, commercial, and logistical hub of the entire East African region. Kenya’s esti-mated population is 37.2 million, and it is projected to grow to 60 million people in 2030. Kenya enjoys an extensive infrastructure, an extraordinarily well-educated, English- speaking, multi-lingual population, and a strong entrepreneurial tradition. It is also a very young country with almost 50 per cent of Kenya’s population under the age of fi fteen.
The economy has in the past registered high growth rates of 6.4 per cent and 7.0 per cent in 2006 and 2007 respectively. The government has taken steps to enhance Kenya’s economic competitiveness and democracy is fl ourishing.
12_Africa_Report09_Kenya.indd 26212_Africa_Report09_Kenya.indd 262 2/25/09 4:27:39 PM2/25/09 4:27:39 PM

Country Report for Kenya
263
OU
TS
OU
RC
IN
G
TO
A
FR
IC
A2. Kenya’s Position as in Africa’s Fifteen Countries
Kenya is the fi fth in the upcoming band of countries from the outsourcing attractiveness point of view. The map and table below show where Kenya is positioned.
Morocco *
Morocco
Tunisia *
Geographical Coverage and Rank
Tunisia
Egypt *
Egypt
Senegal *
Senegal
GhanaGhana
Nigeria
Nigeria
Uganda
Uganda
Kenya
KenyaTanzania
Tanzania
Zambia
Zambia
Mozambique MozambiqueBotswana
Botswana
Namibia
Namibia
SouthAfrica
South Africa
MauritiusAfrica
*Non-Commonwealth Countries
Mauritius
Contributing scores and ranks are as under.
Overall
Band Score (PS & BE) Rank
Upcoming 5.82 Fifth
Infrastructure
Score Rank Band
6.1 7 Upcoming
While achieving this score for ‘Infrastructure’, Kenya is the best in terms of cost of space and facilities and fi fth out of the fi fteen African nations in terms of cost of infrastructure. At the other end, Kenya has scored the least in terms of cost of travel and stay and telecom-munications cost.
12_Africa_Report09_Kenya.indd 26312_Africa_Report09_Kenya.indd 263 2/25/09 4:27:39 PM2/25/09 4:27:39 PM
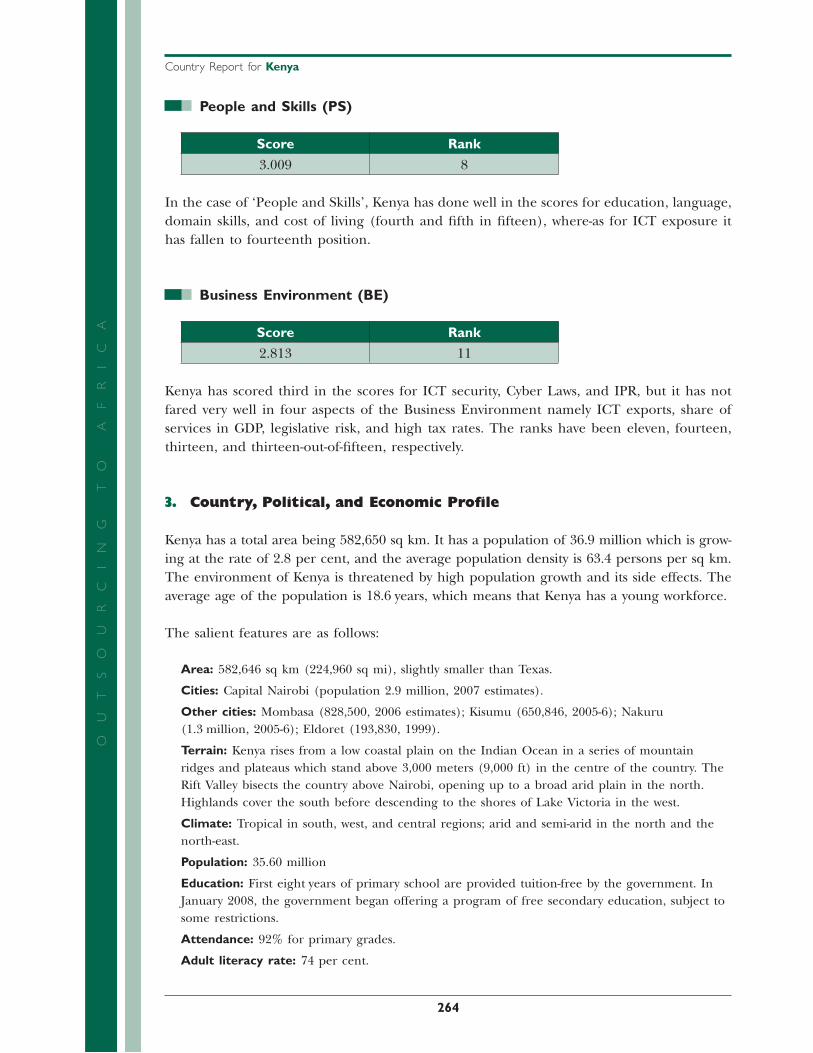
264
Country Report for Kenya
OU
TS
OU
RC
IN
G
TO
A
FR
IC
APeople and Skills (PS)
Score Rank
3.009 8
In the case of ‘People and Skills’, Kenya has done well in the scores for education, language, domain skills, and cost of living (fourth and fi fth in fi fteen), where-as for ICT exposure it has fallen to fourteenth position.
Business Environment (BE)
Score Rank
2.813 11
Kenya has scored third in the scores for ICT security, Cyber Laws, and IPR, but it has not fared very well in four aspects of the Business Environment namely ICT exports, share of services in GDP, legislative risk, and high tax rates. The ranks have been eleven, fourteen, thirteen, and thirteen-out-of-fi fteen, respectively.
3. Country, Political, and Economic Profi le
Kenya has a total area being 582,650 sq km. It has a population of 36.9 million which is grow-ing at the rate of 2.8 per cent, and the average population density is 63.4 persons per sq km. The environment of Kenya is threatened by high population growth and its side effects. The average age of the population is 18.6 years, which means that Kenya has a young workforce.
The salient features are as follows:
Area: 582,646 sq km (224,960 sq mi), slightly smaller than Texas.
Cities: Capital Nairobi (population 2.9 million, 2007 estimates).
Other cities: Mombasa (828,500, 2006 estimates); Kisumu (650,846, 2005-6); Nakuru (1.3 million, 2005-6); Eldoret (193,830, 1999).
Terrain: Kenya rises from a low coastal plain on the Indian Ocean in a series of mountain ridges and plateaus which stand above 3,000 meters (9,000 ft) in the centre of the country. The Rift Valley bisects the country above Nairobi, opening up to a broad arid plain in the north. Highlands cover the south before descending to the shores of Lake Victoria in the west.
Climate: Tropical in south, west, and central regions; arid and semi-arid in the north and the north-east.
Population: 35.60 million
Education: First eight years of primary school are provided tuition-free by the government. In January 2008, the government began offering a program of free secondary education, subject to some restrictions.
Attendance: 92% for primary grades.
Adult literacy rate: 74 per cent.
12_Africa_Report09_Kenya.indd 26412_Africa_Report09_Kenya.indd 264 2/25/09 4:27:44 PM2/25/09 4:27:44 PM
Country Report for Kenya
265
OU
TS
OU
RC
IN
G
TO
A
FR
IC
AGDP: $18.7 billion.
Per capita GDP: US$ 547.
GDP growth rate: 0.1 per cent.
Industry: Petroleum products, grain and sugar milling, cement, beer, soft drinks, textiles, vehicle assembly, paper and light manufacturing.
Trade (2007) exports: $4 billion; tea, coffee, horticultural products, petroleum products, cement, pyrethrum, soda ash, sisal, hides and skins, fl uorspar.
Major export markets: Uganda, United Kingdom, Tanzania, Netherlands, United States, Pakistan, and United Arab Emirates.
Imports: $8.5 billion; machinery, vehicles, crude petroleum, iron and steel, resins and plastic materials, refi ned petroleum products, pharmaceuticals, paper and paper products, fertilizers, wheat.
Major suppliers: United Arab Emirates, India, China, United States, Japan, South Africa, United Kingdom, Germany.
Natural resources: Wildlife, soda ash, land.
Agriculture: Products—tea, coffee, sugar cane, horticultural products, corn, wheat, rice, sisal, pineapples, pyrethrum, dairy products, meat and meat products, hides, skins.
Arable land: 5%.
Government type: Republic.
Independence: December 12, 1963.
Branches: Executive—president (chief of state, commander in chief of armed forces), prime minister (head of government), and two deputy prime ministers.
Legislative: Unicameral National Assembly (parliament).
Judicial: Court of Appeal, High Court, various lower and special courts, including Kadhi (Sharia) courts.
The unicameral National Assembly consists of 210 members elected to a term of fi ve years from single-member constituencies, plus 12 members nominated by political parties on a proportional representation basis.
Until post-election political unrest struck in early 2008, Kenya had, since independence, maintained considerable stability despite changes in its political system and crises in neigh-bouring countries. The December 2007 elections were marred by serious irregularities, and they set off a wave of violence throughout Kenya. Following the February 2008 signing of a power-sharing agreement between President Kibaki and the opposition, a new coalition cabinet was sworn in April 2008, headed by Prime Minister Odinga.
With the creation of the coalition government, the Kenyan government will focus its atten-tion on achieving its ambitious reform agenda, aimed at avoiding a repeat of early 2008’s post-election political and tribal violence. The government also plans to draft a new constitu-tion by mid-2009, specifi cally to address land rights issues and to restructure the government by strengthening institutions to create a more effective system of checks and balances.
12_Africa_Report09_Kenya.indd 26512_Africa_Report09_Kenya.indd 265 2/25/09 4:27:44 PM2/25/09 4:27:44 PM
266
Country Report for Kenya
OU
TS
OU
RC
IN
G
TO
A
FR
IC
AShura (consultative) Council
Judicial: Court of Appeal, High Court, various lower and special courts, including Kadhi (Sharia) courts.
Administrative subdivisions: Sixty-seven districts, joined to form seven rural provinces. The Nairobi area has special provincial status. The government has gazetted thirty-seven new districts. The process of establishing these districts is ongoing.
Principal political parties: Over 100 registered political parties. Two coalitions, the Party of National Unity (PNU) and the Orange Democratic Movement (ODM), dominate the political party scene. PNU membership is fi lled by parties representing Kikuyu and closely related ethnic groups; ODM membership ranks are fi lled by parties representing nearly everybody else. PNU and ODM agreed in February 2008 to form a grand coalition government in a power-sharing arrangement that ended the political crisis erupting after highly controversial national elections in December 2007.
Principal opposition parties: —
Suffrage: Universal at eighteen.
4. Principal Government Offi cials
President: Mwai Kibaki.
Vice-President: Kalonzo Musyoka.
Prime Minister: Raila Odinga.
Minister of Foreign Affairs: Moses Wetangula.
5. Foreign Relations
Despite internal tensions in Sudan and Ethiopia, Kenya has maintained good relations with its northern neighbours. Recent relations with Uganda and Tanzania are strengthening as the three countries work for mutual economic benefi t. Kenya has hosted and played an active role in the negotiations to resolve the civil war in Sudan and to reinstate a central government authority in Somalia.
Kenya is host to more than 300,000 refugees, of which 242,000 are from Somalia and the remainder primarily from Sudan and Ethiopia. Kenya maintains a moderate profi le in Third World politics. Kenya’s relations with Western countries are generally friendly, although cur-rent political and economic instabilities are sometimes blamed on Western pressures.
6. Security and Safety Perceptions
Political demonstrations can occur sporadically throughout Kenya. Travellers should maintain security awareness at all times and avoid public gatherings and street demonstrations.
Cross-border violence occurs periodically.
•
•
12_Africa_Report09_Kenya.indd 26612_Africa_Report09_Kenya.indd 266 2/25/09 4:27:44 PM2/25/09 4:27:44 PM
Country Report for Kenya
267
OU
TS
OU
RC
IN
G
TO
A
FR
IC
AThere is a high rate of crime in all regions of Kenya, particularly Nairobi, Mombasa, Kisumu, and at coastal beach resorts.
There are regular reports of attacks against tourists by groups of armed assailants. Pick-pockets and thieves carry out ‘snatch and run’ crimes on city streets and near crowds.
Violent criminal attacks, including armed carjacking and home invasions/burglary, can occur at any time and in any location, and are becoming increasingly frequent, brazen, vicious, and often fatal.
7. ICT Policy, Infrastructure and Service
Kenya has scored seventh in the Infrastructure scores. Kenya has a very comprehensive ICT policy and strategy in place, but the scores and ratings that Kenya has achieved show that although Kenya is taking steps to improve its ICT facilities, the other countries are doing better. Specifi c initiatives that have been reported in literature are as follows:
The Information and Communication Technology (ICT) board has started an aggres-sive campaign to market Kenya as the next outsourcing destination in the world after India.
The heavily funded board plans to use the $8 billion loans it received from the World Bank in May to expand use of existing bandwidth, increase capacity for outsourcing, as well as digitise the country’s 210 constituencies.
The second component that has been allocated $63 million is expected to help enhance connectivity through purchase of broadband capacity in regional and national networks for specifi c user groups such as universities, schools, and technical colleges as well as the business process outsourcing (BPO) industry.
High cost of bandwidth has hampered the industry’s growth. The bandwidth subsidy was provided by the World Bank through the ICT board, but the money is yet to be released to the benefi ciaries.
Thus Kenya has the potential and also has the strategies and policy in place, and it could be an attractive destination if the implementation is faster.
8. ICT and BPO Industry Environment
About thirty companies form Kenya’s growing BPO industry. More recently, the industry has seen a surge in the number of investors signalling a bright of its future for local entrepre-neurs. The government has identifi ed the outsourcing industry as one of fi ve major sectors to focus on for development and economic growth in its 2030 vision, hoping to rake in over $200 million by 2013. Currently the majority of companies that use the services are internally based, although local fi rms such as Kenya Airways and Safaricom are considering outsourc-ing their customer care centre functions locally. Thus the following observations have been made by reviewing the news and publications in this area. (There was no response from the agencies in Kenya to our questionnaires and calls.)
•
•
•
•
•
•
•
12_Africa_Report09_Kenya.indd 26712_Africa_Report09_Kenya.indd 267 2/25/09 4:27:44 PM2/25/09 4:27:44 PM
268
Country Report for Kenya
OU
TS
OU
RC
IN
G
TO
A
FR
IC
AThe BPO sector in Kenya is expanding rapidly with a large increase in the number of companies and seats. BPO in Kenya is attractive, given large pools of cheap and high quality labour. This has attracted customers both from around the world and from within Kenya.
Kenya plans to expand and grow the BPO industry further by establishing a state-of-the-art BPO Park.
The Government of Kenya is also in the process of designing a comprehensive set of incentives to improve the attractiveness of Kenya as a BPO destination.
The incentive levels will be competitive with those offered by other countries. Further-more, the environment of doing business has been improved (e.g. ease of obtaining licences, fi ling tax returns, and obtaining economic justice) to lower transaction costs.
A ‘one stop shop’ for all investor needs (e.g. licensing and recruiting) will be housed within the BPO Park. The BPO industry presents investment opportunities in the estab-lishment of the BPO Park, telecommunications infrastructure, and establishment of training institutions for the required BPO skills among others. The Government of Kenya will provide land in Nairobi for establishment of the park.
The Kenyan government also plans to complete a 5,000-seat technology park and export promotion zone by 2012, a move aimed at boosting the BPO industry.
Another initiative that the Government of Kenya wishes to promote is a secure information system that requires a data centre and recovery site. The Government of Kenya plans to estab-lish data centres to provide storage for all government databases. In addition, the Neutral Data Centre (NDC) will provide world-class services to government ministries, departments and agencies, private sector operators, and businesses. This provides investment opportuni-ties to interested companies. The success of this will depend on the perceived geopolitical risk. In this study, Kenya is tenth among the fi fteen countries studied.
Most of these initiatives reported are at planning stage, and success will depend on the implementation of these strategies and promises. But the industry has started and is growing slowly but steadily perhaps because Kenya does offer cost effectiveness with quality.
Kenya has recently approached the Commonwealth Fund for Technical Cooperation (CFTC) to provide constancy assistance to improve the BPO sector.
Physical Infrastructure
Offi ce market: Demand for offi ce space both inside and outside the Nairobi CBD has increased with prime rents in Westlands now achieving Kshs 645 (US$ 10) per sq m per month and CBD rents up to Kshs 376 (US$ 6) per sq m per month. Meanwhile, speculative offi ce development outside the CBD continues apace.
Retail market: Nairobi has seen a substantial increase in the number of decentralised shopping malls since the opening of The Junction in 2004. New shopping centres include Crossroads Centre in Karen (7,500 sq m), which opened in 2006, and the new
•
•
•
•
•
•
•
•
12_Africa_Report09_Kenya.indd 26812_Africa_Report09_Kenya.indd 268 2/25/09 4:27:45 PM2/25/09 4:27:45 PM

Country Report for Kenya
269
OU
TS
OU
RC
IN
G
TO
A
FR
IC
AWestgate Centre in Westlands (30,000 sq m), which opened in 2007 and has achieved record rents of Kshs 2,420 (US$ 37) per sq m per month.
Industrial market: Demand for industrial land is increasing, although principally for owner occupation, and speculative development in this sector is still risky. The pro-posed bypasses around Nairobi will increase land values and make Nairobi’s current industrial area a more attractive location for offi ces.
Residential market: Nairobi’s residential market has seen the most growth of all prop-erty sectors, particularly the mid-market cluster developments, which are currently in oversupply. This oversupply has led to an increase in vacancy levels, but has at the same time pushed land values up to an all-time high. Prime residential apartment rents now stand at around Kshs 160,000 (US$ 2,400) and have stagnated at this level for the last year.
Prime rents Prime yields
Offi ces US$ 10 per sq m per month 12%
Retail US$ 37 per sq m per month 14%
Industrial US$ 3 per sq m per month 15%
Residential US$ 3,500 per month* 9%
*Four bed room executive house—prime location
On an overall basis, physical infrastructure cost in Kenya are the best out of the 15 countries.
9. Human Resource Effi ciency and Cost
Kenya has scored between third to sixth in most of the parameters that contribute to people and skills. Thus there is a strong potential in Kenya. The cost effective, qualifi ed, and capable work force is a positive factor; the educational facilities, schools colleges, and universities of high quality that are in place will ensure that this supply of human resources is sustained.
Kenya prides itself in its large pool of professional workers, trained both within the country and in institutions in Europe, North America, Australia, and other parts of the world. For years, Kenya has produced well-educated professionals, fl uent in English and highly trained in various fi elds. Kenya holds the distinction of having the highest number of university- and college-educated English-speaking professionals in East Africa.
Most Kenyan universities offer degree courses in IT and various colleges; technical and man-agement training institutions offer diploma courses. Kenya, therefore, has skilled person-nel in the IT profession, including computer programmers, software developers, hardware maintenance engineers, systems analysts, and IT consultants.
The Kenyan government has also started training its own staff on IT-related subjects, and it proposes mainstreaming of IT training within all schools, colleges, and universities.
•
•
12_Africa_Report09_Kenya.indd 26912_Africa_Report09_Kenya.indd 269 2/25/09 4:27:45 PM2/25/09 4:27:45 PM

270
Country Report for Kenya
OU
TS
OU
RC
IN
G
TO
A
FR
IC
AKenya has a well-developed education system, with the primary language of instruction being English. There exists a large pool of English-speaking workers, trained in various professions. There are over eleven universities, four polytechnics, forty-one technical training institutions, and several management training institutions in the country. IT degrees are offered by most of the Kenyan universities, while diploma courses are also offered by both the public and private sector technical and management training institutions.
To summarize why one should choose a Kenyan professional?
Very good English and other international languages.
Well-trained in recognized institutions of higher learning—locally and overseas.
Highly-skilled, college graduate staff.
Highly computer-literate.
Up to 40 per cent lower professional fees than in Europe and North America.
24-hour availability.
Thus Kenya has a well-developed professional services sector with some multinational profes-sional companies such as KPMG, E&Y, etc. having regional offi ces in Nairobi. Most major insurance companies, banks etc. have a presence in Kenya. Some of the important banks have placed their African back-offi ce operations in Kenya.
This is perhaps bringing outsourcing to Kenya in spite of other limitations, a situation in India in the late eighties and early nineties when India had no liberalisation, ICT parks, or liberalised international connectivity, yet multinational players used Indians in India and abroad, went into a lot of trouble setting up shop in India like the fi rst ever Texas Instru-ments design support facility in Bangalore, India, done in spite of severe resistance from the then government-owned telecommunication operators.
10. Legal and Enforcement Issues
Kenya has scored very well in the ICT security, Cyber, and IPR law scores. On the other hand, legislative risk score is low indicating a high legislative risk. Some of the factors contributing to this are as follows:
The Companies Act specifi es Kenya is a member of the World Intellectual Property Organization (WIPO) and of the Paris Union, the international convention for the protection of industrial property, and it has signed the Universal Copyright Convention and the Berne Copyright Convention. Kenya is also a member of the African Regional Industrial Property Organization.
Investors are entitled to national treatment and priority right recognition for their pat-ent and trademark fi ling dates. The Trade Marks Act provides protection for registered trade and service marks.
•
•
•
•
•
•
•
•
12_Africa_Report09_Kenya.indd 27012_Africa_Report09_Kenya.indd 270 2/25/09 4:27:45 PM2/25/09 4:27:45 PM

Country Report for Kenya
271
OU
TS
OU
RC
IN
G
TO
A
FR
IC
AThe act establishes an independent national patent law and an Industrial Property Institute, which considers applications for and grants industrial property rights. The registration is valid for ten years and is renewable.
Similarly the Cyber Laws and their enforcement mechanisms done in cooperation with the rest of EAC contributed to these factors.
11. Labour & Expatriate Worker’s Permits
Expatriates are allowed to work in Kenya provided they have an entry permit (work permit) issued under the Immigration Act (Chapter 172, Laws of Kenya).
An applicant for an entry permit needs to describe the work he or she intends to engage in and will be allowed to engage only in that specifi c activity. Entry permits are usually granted to foreign enterprises approved to operate in Kenya as long as the applicants are key personnel.
Any enterprise, whether local or foreign, may recruit expatriates for any category of skilled labour if Kenyans are not available. The issue of work permits is closely control-led, although the government recognizes that foreign investors or shareholders need to be represented in senior management. This applies in particular to managing directors, senior fi nance and marketing executives, and highly specialized technical positions.
The Investment Promotion Centre facilitates the acquisition of entry permits, which can be obtained on arrival in Kenya if they have not been secured beforehand.
12. Revenue, Tax, and Repatriation Issues
The existing framework provides guarantees against the expropriation of private property; guarantees for the repatriation of capital and after-tax profi ts; a variety of incentives, includ-ing investment allowances of 60 per cent to 100 per cent; liberal depreciation rates based on book value; the offsetting of losses by future taxable profi ts; and so on.
Taxes that are levied by the governmentare as follows:
Income Tax.
Corporate tax.
30 per cent for local companies.
37.5 per cent for branch of overseas of foreign companies.
Withholding tax 5 per cent.
Pay-as-you-earn: graduated up to a maximum of 30 per cent of income.
Customs Duty 4 bands from 0–35 per cent.
Excise tax applicable to cigarettes, alcohol, petroleum, confectioneries.
VAT–16 per cent standard rate.
Kenya does have high taxes as the tax score is thirteen out of fi fteen.
•
•
•
•
•
•
•
•
•
•
•
•
•
•
•
12_Africa_Report09_Kenya.indd 27112_Africa_Report09_Kenya.indd 271 2/25/09 4:27:45 PM2/25/09 4:27:45 PM

272
Country Report for Kenya
OU
TS
OU
RC
IN
G
TO
A
FR
IC
A13. Investment Policy and Incentives
Any investment incentive will be applicable to outsourcing operations if they are for 100 per cent export of services. In any case that is the scope of this study. Thus all incen-tives applicable to Export Processing (EP) Zones should be applicable. (The investments guides are not explicit about services being an export commodity.)
The incentives applicable for EP’s are as follows:
10-year tax holiday.
Duty and VAT exemption.
Single license.
Exemption from stamp duty.
Exemption for withholding tax.
25 per cent corporate tax for ten years after the fi rst ten years expire.
100 per cent investment allowance.
Duty Remission.
Exemption on duties and VAT on raw materials utilized to process confi rmed exports orders.
Liberal Depreciation Rates.
Loss-Carry forward.
Business must recover previous losses before paying corporate tax.
Capital expenditure.
Duties paid for capital expenditure in excess of US$ 70,000 can be recovered from corporate tax.
Capital goods and basic raw materials are zero-rated.
14. Agencies Giving Support to Outsourcing
Chief Executive Offi ce
Kenya Investment Authority
P.O. Box 55704, 00200, Nairobi, Kenya
Tel: (+254) 020-2221401-4
E-mail: [email protected]
Website: http://www.investmentkenya.com
Location: Kenya Railways Headquarters, Block D, 3rd Floor
Or
•
•
•
•
•
•
•
•
•
•
•
•
•
•
•
12_Africa_Report09_Kenya.indd 27212_Africa_Report09_Kenya.indd 272 2/25/09 4:27:46 PM2/25/09 4:27:46 PM
Country Report for Kenya
273
OU
TS
OU
RC
IN
G
TO
A
FR
IC
AThe Permanent Secretary
Ministry of State for planning National Development and Vision 2030
Treasury Building, PO Box 30005, 00200, Nairobi, Kenya
Tel: (+254) 020-252299 Ext: 101/328
E-mail: [email protected]
Website: http://www.planning.go.ke
15. Recommendations
Before making recommendations it is necessary to summarise what the outsourcing industry professions are thinking about and saying about Kenya. What is the situation and what opportunity is Kenya getting and perhaps loosing?
With India’s rising costs and employee turnover encouraging information technology execu-tives to look beyond the subcontinent for offshore outsourcing providers, a country like Kenya could be poised to win more IT services business from abroad. The East African nation boasts a big pool of English-speaking professionals, and its government has invested millions to improve its telecommunications infrastructure.
However, recent events have conspired to slow Kenya’s growth potential in the near term. Most dramatically, a disputed election at the end of 2007 ignited ethnic tensions and violence for two months in the country, leaving hundreds of citizens dead and hundreds of thousands more displaced. In late February 2008, former United Nations Secretary General Kofi Annan negotiated a power-sharing deal between the two presidential candidates that established a coalition government. But uncertainty about the new government continues.
Geopolitical concerns are never good for IT services business. Kenya’s disputed presidential election, post-election violence, and civil unrest raised a signifi cant red fl ag for decision mak-ers considering outsourcing to Kenya. Watching riots and chaos broadcast around the world makes a very tough sell inside the board room. Political instability has derailed the Kenyan economy from its growth momentum. Early estimates put the cost of the political crisis to the Kenyan economy at US$1 billion, with some revising Kenya’s 2008 economic growth projections from 7 per cent down to 3.2 per cent. The economy is expected to recover in the mid-term, with growth estimates for 2009 nearing 5 per cent.
The IT services sector may be poised to persevere. Once the political issues are addressed, Kenya could well be one of the world’s fastest developing outsourcing destinations due to its large English-speaking population, low costs, and near shore status for European and Middle Eastern companies, putting it on par with its IT services competitors on the continent including South Africa, Mauritius, Egypt, and Ghana.
The East African nation could become a preferred destination for call center and smaller business process outsourcing contracts. Thus far, the local call center industry employs 3,000 professionals and has grown to $5 million since the fi rst call centre opened a few years ago; thus leaving plenty of room for growth.
12_Africa_Report09_Kenya.indd 27312_Africa_Report09_Kenya.indd 273 2/25/09 4:27:46 PM2/25/09 4:27:46 PM

274
Country Report for Kenya
OU
TS
OU
RC
IN
G
TO
A
FR
IC
AThe most established local providers include Skyweb Evans, Kencall, and Preciss, who serve customers in the United States, Canada, and Europe. One giant obstacle has been the local data and telecoms infrastructure.
Call centre operators in East Africa’s biggest economy rely on an outdated satellite system where echoes caused by latency—the time gap created when calls travel some 36,000 kilometres through space and back—spoil call quality, and for that shoddy service, they pay $7,000 per megabyte of bandwidth per month, compared to the $500 a month an Indian provider would pay. Infrastructure improvements are coming, slowly but surely.
The Kenyan government has invested $100 million in The East African Marine Systems (TEAMS), an undersea cable to connect Mombasa with Fujairah in the United Arab Emirates, which is expected to bring the cost of connectivity down to the levels India pays. In addi-tion, construction has fi nally begun on the Eastern Africa Submarine Cable System (EASSy), spearheaded by the World Bank back in 2003, which will connect East African countries to the rest of the world via high-bandwidth fi bre optic cable. The project is slated for comple-tion in late 2010.
The Kenyan government also plans to complete a 5,000-seat technology park and export promotion zone by 2012, a move aimed at boosting the BPO industry. IDC Kenya says data centres, managed services, help desks, call centres, and application and hosting services will be key areas to watch in 2009.
Quality and speed could be more important than cost in future growth for the Kenyan IT services industry.
Confi dentiality and the ability to handle important client information is another important factor that prospective buyers have as priority. One potential role for the East African country is as a subcontractor for other offshore IT service providers.
Indian companies have begun looking to outsource their own outsourcing operations to Kenya to battle higher wage infl ation, over-heated infrastructure. And there are reports of a ready pool of investors looking to enter the Kenyan industry, particularly from South Africa where labour costs are much higher.
Ultimately, for IT services customers, it comes down to a risk-reward calculation when decid-ing on a new offshore outsourcing destination.
Thus Kenya is poised to grow but will need concentrated efforts to comprehensively tackle the situations and carry out their strategies in a determined manner. Most of all, remem-bering that the competition in the rest of Africa is increasing with all the competitors moving fast.
12_Africa_Report09_Kenya.indd 27412_Africa_Report09_Kenya.indd 274 2/25/09 4:27:46 PM2/25/09 4:27:46 PM
Country Report for Kenya
275
OU
TS
OU
RC
IN
G
TO
A
FR
IC
A16. Contact Details
Investment Promotion Centre
National Bank Building, 8th Floor
Harambee Avenue
P.O. Box 55704 Nairobi, City Square, 00200
Tel: (+254) 020-221-401-4; Fax: (+254) 020-243-862
Website: http://www.investmentkenya.com; http://www.ipckenya.org
Export Processing Zones Authority (EPZA)
P.O. Box 50563-00200, Nairobi
Tel: (+254) 020-271-2801/6; Fax: (+254) 020-271-3704
E-mail: [email protected]; [email protected]
Website: http://www.epzakenya.com
Ministry of Planning and National Development
Treasury Building, Nairobi
Tel: (+254) 020-338-111
Website: http://www.planning.go.ke
Kenya Investment Authority
P.O. Box 55704, Nairobi, City Square, 00200, Kenya
Tel: (+254) 020-221401/4; Fax: (+254) 020-336663
E-mail: [email protected]
Website: http://www.investmentkenya.com
The Ministry of Information and Communications
Telsposa Towers, 10th Floor
P.O. Box 30025-00100, Nairobi, Kenya
Tel: (+254) 020-251152, 250517, 250978; Fax: (+254) 020-249664
E-mail: [email protected]
Ministry of Information and Communications
Kenya Bureau of Standards
P.O. Box 54974, Nairobi
Tel: (+254) 020-502-210-2; Fax: (+254) 2503-293
E-mail: [email protected]
Website: http://www.kebs.org
Ministry of Finance and Kenya Revenue Authority
Treasury Building, Nairobi
Times Towers, Haile Selassie Avenue
Tel: (+254) 020-310-900/315-553
Website: http://www.treasury.go.ke
12_Africa_Report09_Kenya.indd 27512_Africa_Report09_Kenya.indd 275 2/25/09 4:27:46 PM2/25/09 4:27:46 PM
276
Country Report for Kenya
OU
TS
OU
RC
IN
G
TO
A
FR
IC
ATelkom Kenya Ltd
Telposta Towers, Kenyatta Avenue
Tel: (+254) 020-323-2000; Fax: (+254) 020-243-338
E-mail: [email protected]
Website: http://www.telkom.co.ke
Registrar of Companies
Sheria House, Harambee Avenue, Nairobi
Tel: (+254) 020-227-461
Ministry of Trade and Industry Teleposta Towers, Nairobi
Tel: (+254) 020-315-001-7
Website: http://www.tradeandindustry.go.ke
Principal Immigration Offi cer
Immigration Department Nyayo House, Nairobi
Tel: (+254) 020-333-531
The Kenya High Commission
45 Portland Place London W1B 1AS United Kingdom
Tel: (+44) 20-76362371/5; Fax: (+44) 20-73236717
E-mail: [email protected]
Website: http://www.kenyahighcommission.uk.net
Embassy of the Republic of Kenya
2249 R Street, N.W. Washington DC 2008 United States
Tel: (+1) 202-387-6101; Fax: (+1) 202-462-3829
E-mail: [email protected]
Website: http://www.kenyaembassy.com
Embassy of the Republic of Kenya
3 Rue Freycinet 75116, Paris, France
Tel: (+331) 56622525; Fax: (+331) 47204441
E-mail: [email protected]
Website: http://www.kenyaembassyparis.org
Embassy of the Republic of Kenya
Markgrafen Strasse 63
10969 Berlin Germany
Tel: (+49) 30-2592660; Fax: (+49) 30-25926650
Emergency number after offi ce hours: (+49) 174-9365153
E-mail: offi [email protected]
Website: http://www.embassy-of-kenya.de
12_Africa_Report09_Kenya.indd 27612_Africa_Report09_Kenya.indd 276 2/25/09 4:27:47 PM2/25/09 4:27:47 PM

Country Report for Kenya
277
OU
TS
OU
RC
IN
G
TO
A
FR
IC
AHigh Commission of the Republic of Kenya
34 Paschimi Marg, Vasant Vihar New Delhi India
Tel: (+91) 11-26146537/38/40; Fax: (+91) 11-26146550
E-mail: [email protected]
Website: http://www.kenyamission-delhi.com
Useful Links
The World Fact book 2007.
https://cia.gov/cia//publications/factbook/geos/ke.html
Kenya Data Profi le. 2006. World Bank.
http://devdata.worldbank.org/external/CPProfi le.asp?CCODE=KEN&PTYPE=CP
Country Profi les: Africa. 2006. DIFD.http://www.dfi d.gov.uk/countries/africa/kenya.asp
Data & Statistics: Kenya. 2006. World Bank.
http://web.worldbank.org/WBSITE/EXTERNAL/COUNTRIES/AFRICAEXT/KENYAEXTN/0,,menuPK:356536~pagePK:141132~piPK:141109~theSitePK:356509,00.html
Mwololo Waema, T. “A Brief History of The Development of An ICT Policy In Kenya,” in At The Crossroads: ICT Policy Making In East Africa. 2005. IDRC.
http://www.idrc.ca/openebooks/219-8/#page_25
“National ICT Policy.” 2006. Ministry of Information and Communications.
http://www.information.go.ke/docs/ICT%20Policy.pdf
“Ministry of Education National ICT Strategy for Education and Training.” 2006. Ministry of Education, Science and Technology/Ministry of Information and Communication.
http://www.education.go.ke/MOESTDocs/NATIONAL%20ICT%20STRATEGY%20FOR%20EDUCATION%20AND%20TRAINING%20JUNE%202006.pdf;
http://www.education.go.ke/ICTFund.htm
Kenya Commission for Higher Education. 2006.
http://che.or.ke/news.html
“Kenya Internet Usage and Marketing Report.” 2006. Internet World Stats.
http://www.internetworldstats.com/af/ke.htm
NEPAD e-Schools Demonstration Project. 2005-2006. E-Africa Commission.
http://www.eafricacommission.org/nepad_eschool_initiative.html
Kenya Institute for Education.
http://www.kie.go.ke/
12_Africa_Report09_Kenya.indd 27712_Africa_Report09_Kenya.indd 277 2/25/09 4:27:47 PM2/25/09 4:27:47 PM

278
Country Report for Kenya
OU
TS
OU
RC
IN
G
TO
A
FR
IC
ASteiner, R., T. Nyaska, M. Jensen, and G. Karanja. “African Tertiary Institution Connectivity Survey (ATICS).” World Bank Institute.
http://www.gesci.org/fi les/Connectivity%20in%20African%20tertiary%20institutions.pdf
“AVU Capacity Enhancement Program (ACEP) Phase I.” 2005. African Virtual University.
http://www.avu.org/acep.asp
Kenya Education Network.
http://www.kenet.or.ke/main.php
Farrell, G.M. and C. Wachholz, eds. 2003. ICT in Education: Meta-survey on the Use of Technologies in Asia and the Pacifi c.” UNESCO.
http://www.unescobkk.org/index.php?id=1225
Etta, F.E. and L. Elder, eds. 2005. At The Crossroads: ICT Policy Making In East Africa. IDRC.
http://www.idrc.ca/openebooks/219-8/
Nyaki Adeya, C. and B. Oyelaran-Oyeyinka. 2002. The Internet in African Universities: Case Studies from Kenya and Nigeria. United Nations University, Institute for New Technologies.
Murray, Lize. “AVU Gap Analysis Report: August 2005.” 2005. Prepared for the Hewlett Foundation OdeL Initiative.
http://www.avu.org/acep.asp
12_Africa_Report09_Kenya.indd 27812_Africa_Report09_Kenya.indd 278 2/25/09 4:27:47 PM2/25/09 4:27:47 PM

279
OU
TS
OU
RC
IN
G
TO
A
FR
IC
A
Country Report for Senegal
Disclaimer
This short Country Report, a result of a larger Survey of ICT Outsourcing in Africa, provides a general over-view of the current activities and issues related to ICT Outsourcing in the country. The data presented here should be regarded as illustrative rather than exhaustive. ICT Outsourcing is at a particularly dynamic stage in Africa with new developments and announcements happening on a daily basis somewhere on the other on the continent. Therefore, these reports should be seen as ‘snapshots’ that were current at the time they were taken; it is expected that certain facts and fi gures presented may become outdated very quickly.
The fi ndings, interpretations, and conclusions expressed herein are a faithful representation of the respondents of the interviews and secondary data collected from the countries and published literature. Strict analysis has been carried out with the minimal infl uence of the authors/team members. References to data sources have been made as far as possible. In the case of the detailed data parameters used for scores and ranking, the same data source and timeline has been used for all the fi fteen countries compared. In the descriptive sec-tion of the country reports, all data received from the individual country has been used in order to give as complete an assessment as possible. Thus in this part those countries that have provided more information have a better coverage than those who have not been able to provide data to the research team.
Board of Executive Directors of the CBC or Cyber Media cannot guarantee the accuracy of the data included in this work. The boundaries, colours, denominations, and other information shown on any map in this work do not imply on the part of the CBC and Cyber Media any judgement of the legal status of any territory or the endorsement or acceptance of such boundaries.
It is expected that individual Country Report from the Survey of ICT Outsourcing in Africa will be updated in an iterative process over time, based on additional research and feedback received through the CBC and Cyber Media website.
DAKAR
Thiès
Kaolack
Diourbel
Linguère
THEGAMBIA
Matam
PodorMAURITANIA
Richard- TollSaint-Louis
Nayé MALI
Tambacounda
KoldaBignona
Ziguinchor Kédougou
GUINEA- BISSAU
GUINEA NorthAtlantic Ocean 0 50 100 km
0 50 100 mi
13_Africa_Report09_Senegal.indd 27913_Africa_Report09_Senegal.indd 279 2/25/09 4:29:35 PM2/25/09 4:29:35 PM
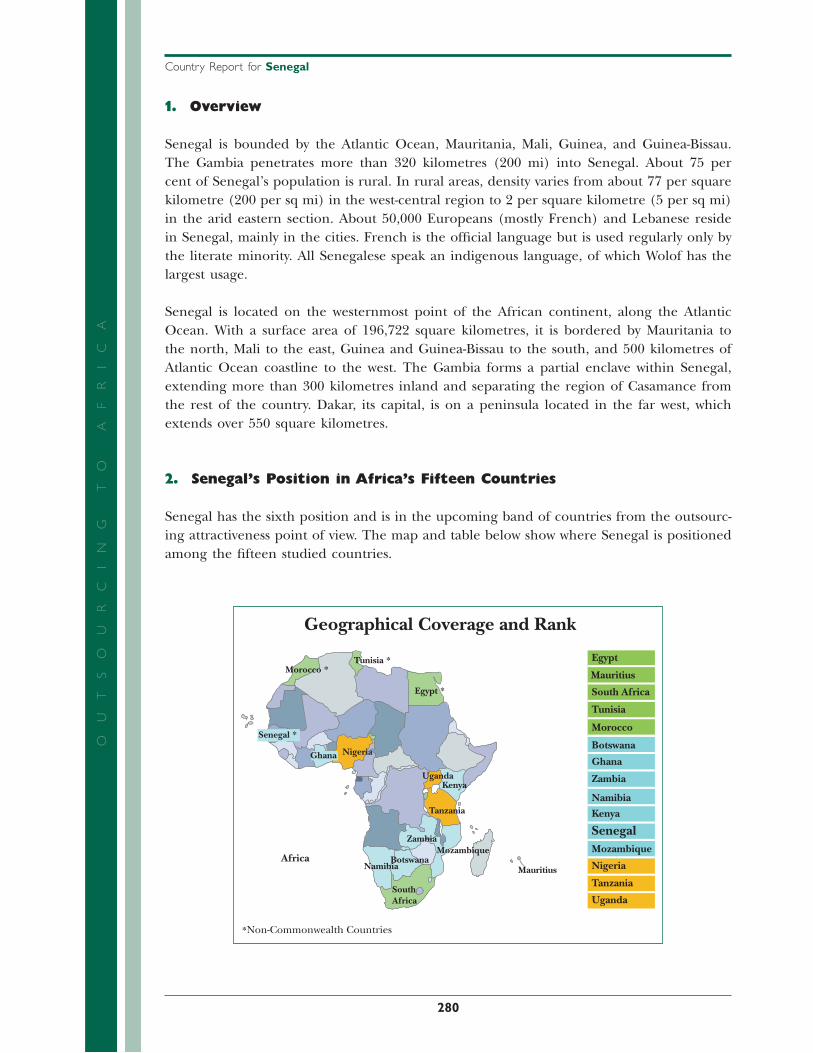
280
Country Report for Senegal
OU
TS
OU
RC
IN
G
TO
A
FR
IC
A1. Overview
Senegal is bounded by the Atlantic Ocean, Mauritania, Mali, Guinea, and Guinea-Bissau. The Gambia penetrates more than 320 kilometres (200 mi) into Senegal. About 75 per cent of Senegal’s population is rural. In rural areas, density varies from about 77 per square kilometre (200 per sq mi) in the west-central region to 2 per square kilometre (5 per sq mi) in the arid eastern section. About 50,000 Europeans (mostly French) and Lebanese reside in Senegal, mainly in the cities. French is the offi cial language but is used regularly only by the literate minority. All Senegalese speak an indigenous language, of which Wolof has the largest usage.
Senegal is located on the westernmost point of the African continent, along the Atlantic Ocean. With a surface area of 196,722 square kilometres, it is bordered by Mauritania to the north, Mali to the east, Guinea and Guinea-Bissau to the south, and 500 kilometres of Atlantic Ocean coastline to the west. The Gambia forms a partial enclave within Senegal, extending more than 300 kilometres inland and separating the region of Casamance from the rest of the country. Dakar, its capital, is on a peninsula located in the far west, which extends over 550 square kilometres.
2. Senegal’s Position in Africa’s Fifteen Countries
Senegal has the sixth position and is in the upcoming band of countries from the outsourc-ing attractiveness point of view. The map and table below show where Senegal is positioned among the fi fteen studied countries.
Morocco *
Morocco
Tunisia *
Geographical Coverage and Rank
Tunisia
Egypt *
Egypt
Senegal *
Senegal
GhanaGhana
Nigeria
Nigeria
Uganda
Uganda
Kenya
KenyaTanzania
Tanzania
Zambia
Zambia
Mozambique MozambiqueBotswana
Botswana
Namibia
Namibia
SouthAfrica
South Africa
MauritiusAfrica
*Non-Commonwealth Countries
Mauritius
13_Africa_Report09_Senegal.indd 28013_Africa_Report09_Senegal.indd 280 2/25/09 4:29:36 PM2/25/09 4:29:36 PM

Country Report for Senegal
281
OU
TS
OU
RC
IN
G
TO
A
FR
IC
AContributing scores and ranks are as under.
Overall
Band Score (PS & BE) Rank in Band
Upcoming 5.79 Sixth
Infrastructure
Score Rank Band
6.0 9 Upcoming
While achieving the ninth position in score for ‘Infrastructure’, Senegal is fi fteenth in elec-tricity availability, fi fth in telecommunications and data transfer costs, eight in network readi-ness, ninth in infrastructure cost, eighth in availability and penetration, and tenth in the road and rail network.
People and Skills (PS)
Score Rank
2.867 14
Senegal is the second lowest in the case of ‘People and Skills’, being tenth in quantity, sixth for quality, eleventh in working satisfaction, and eighth in ICT exposure; it has scored ninth in human resource costs and sixth in education, language, and domain skills.
Business Environment (BE)
Score Rank
2.927 10
Senegal ranked tenth in this lower level abstraction. In achieving this position it has come sixth in ICT security, Cyber and IPR laws, and share of services in GDP. Senegal has the twelfth highest foreign exchange reserves and is the last in ease and cost of fi nances. It ranks tenth share in ICT in exports and last in legislative risk. In the tax rate, Senegal is eleventh, and, in the share of services in exports, it has come ninth. Senegal has ranked ninth and fi fth respectively in geopolitical risk and currency risk.
13_Africa_Report09_Senegal.indd 28113_Africa_Report09_Senegal.indd 281 2/25/09 4:29:37 PM2/25/09 4:29:37 PM

282
Country Report for Senegal
OU
TS
OU
RC
IN
G
TO
A
FR
IC
A3. Country, Political, and Economic Profi le
Geography
Area: 196,840 sq km (76,000 sq mi), about the size of South Dakota.
Cities: Capital—Dakar.
Other cities: Diourbel, Kaolack, Kolda, Louga, Rufi sque, Saint-Louis, Thies, Tambacounda, Ziguinchor, Fatick, Matam, Kedougou, Sedhiou.
Terrain: Flat or rising to foothills.
Climate: Tropical/Sahelian—desert or grasslands in the north, heavier vegetation in the south and south-east.
People
Nationality (noun and adjective): Senegalese (singular and plural).
Population (2008 estimate): 12,853,259.
Annual growth rate: 2 per cent
Ethnic groups: Wolof 43 per cent; Fulani (Peulh) and Toucouleur 23 per cent; Serer 15 per cent; Diola, Mandingo, and others 19 per cent.
Religions: Muslim 95 per cent, Christian 4 per cent, traditional 1 per cent.
Languages: French (offi cial), Wolof, Pulaar, Serer, Diola, Mandingo, Soninke.
Education: Attendance—primary 75.8 per cent, middle school 26.5 per cent, secondary 11 per cent (estimated).
Literacy: 59.1 per cent.
Health: Infant mortality rate—60.15/1,000; life expectancy—56.69 years.
Work force (4.0 million): Agriculture—70 per cent (subsistence or cash crops).
Wage earners (350,000): Private sector 61 per cent, government and parapublic 39 per cent.
Government
Type: Republic.
Independence: 4 April 1960.
Constitution: 3 March 1963, last amended in 2001.
Branches: Executive—President (Chief of state, Commander-in-chief of armed forces).
Legislative: Bicameral parliament with a 150-member National Assembly and a 100-member Senate.
Judicial: Constitutional Council (appointed by the president from senior magistrates and eminent academics and attorneys), Court of Final Appeals, Council of State.
Administrative subdivisions: Fourteen regions, thirty-four departments, 320 rural councils.
Political parties: Seventy-three political parties are registered, the most important of which are the Democratic Party of Senegal (PDS), Rewmi, Socialist Party (PS), the Alliance of Forces for Progress (AFP), ‘and JEF/PADS’, the Union for Democratic Renewal (URD), ‘JEF JEL’, the
13_Africa_Report09_Senegal.indd 28213_Africa_Report09_Senegal.indd 282 2/25/09 4:29:37 PM2/25/09 4:29:37 PM

Country Report for Senegal
283
OU
TS
OU
RC
IN
G
TO
A
FR
IC
ANational Democratic Rally (RND), the Independence and Labour Party (PIT), and the Alliance for the Republic-Yakaar.
Suffrage: Universal adult over eighteen.
Central government budget (2007): Revenues—$2.948 billion; expenditures—$3.036 billion, including capital expenditures of $1.302 billion.
Defence (2007): $133 million.
National holiday: 4 April, Independence Day.
Economy
GDP (2008): $13.9 billion.
Real annual growth rate: 4.6 per cent (2007 estimate).
Per capita GDP (2008): $1,800 (purchasing power parity).
Natural resources: Fish, peanuts, phosphate, iron ore, gold, titanium, oil and gas, cotton.
Primary sector: Agriculture represents 15 per cent of GDP.
Products: Peanuts, millet, sorghum, manioc, rice, cotton, vegetables and fl owers, fruit.
Secondary sector: 21.4 per cent of GDP, of which industry and mining represent 22 per cent.
Types: Fishing; agricultural product processing; light manufacturing; mining including energy, oil mining, and construction.
Tertiary sector: 63 per cent of GDP, of which services represent 40 per cent of GDP and trade 22 per cent of GDP.
Trade (2006): Exports—$1.407 billion (fi sh products, peanut products, phosphate products).
Major markets: France, other European Union, West African CFA zone.
Imports: $3.040 billion (food, consumer goods, petroleum, machinery, transport equipment, petroleum products, computer equipment).
Major suppliers: France, Nigeria, Cameroon, United States.
Exchange rate: Fixed to the euro.
African Financial Community (CFA) 656 CFA = 1 euro.
Economic aid received: The United States provided $55.9 million in development assistance to Senegal in fi scal year 2008, including $29.2 million for Child Survival and Health, $22.1 million for Development Assistance, over $1 million for International Military Education and Training (IMET), and $3.4 million in Food Aid.
4. Principal Government Offi cials
President: Abdoulaye Wade.
Prime Minister: Cheikh Hadjibou Soumaré.
Minister of Foreign Affairs: Cheikh Tidiane Gadio.
Minister of State, Minister of Infrastructure, Land Transportation, Telecommunications and ITC: Habib Sy.
13_Africa_Report09_Senegal.indd 28313_Africa_Report09_Senegal.indd 283 2/25/09 4:29:37 PM2/25/09 4:29:37 PM

284
Country Report for Senegal
OU
TS
OU
RC
IN
G
TO
A
FR
IC
A5. Foreign Relations
President Senghor advocated close relations with France and negotiation and compromise as the best means of resolving international differences. To a large extent, the two succeeding presidents have carried on Senghor’s policies and philosophies. Senegal has long supported functional integration among French-speaking West African states through the West African Economic and Monetary Union. Senegal has a high profi le in many international organisa-tions and was a member of the UN Security Council in 1988–89. It was elected to the UN Commission on Human Rights in 1997. Friendly to the West, especially to France and to the United States, Senegal also is a vigorous proponent of more assistance from developed countries to the Third World.
Senegal enjoys mostly cordial relations with its neighbours. Clear progress has been made on many fronts with Mauritania to include border security, resource management, eco-nomic integration, and the return of an estimated 30,000 Afro-Mauritanian refugees living in Senegal.
6. Living, Security, and Safety Perceptions
Minor street crime is very common in Senegal, particularly in cities. People should avoid walking alone in isolated areas or on beaches, particularly at night, lock their doors and close their windows when driving, and avoid public transportation.
While violent crime is not common in Senegal, it does occur. Break-ins at residential houses occur frequently as in major cities everywhere. Fraud is prevalent in Senegal.
7. ICT Policy, Infrastructure, and Service
Policy makers recognize the value of ICT for Senegal’s economic and social development, and the government recognizes ICT as a powerful engine for progress in economic expan-sion and modernization.
Since 2000, the following legal and institutional measures have been taken:
Defi nition of a national strategy for developing ICT.
Adoption of a new telecommunications code.
Creation of an agency in charge of overseeing telecommunications.
Creation of the State Computer Science Bureau.
Creation of a ministry responsible for the promotion of ICT.
Complete liberalisation in the telecommunication sector.
Additionally, the Programme National de Bonne Governance (National Program for Good Governance) identifi ed ICT as a valuable instrument for improving productivity in public
•
•
•
•
•
•
13_Africa_Report09_Senegal.indd 28413_Africa_Report09_Senegal.indd 284 2/25/09 4:29:38 PM2/25/09 4:29:38 PM
Country Report for Senegal
285
OU
TS
OU
RC
IN
G
TO
A
FR
IC
Aservice, enhanced performance, and modern communication. Electricity is obviously a facili-tating factor for using the Internet. Senegal has recorded a great deal of progress in this regard. Currently 38.5 per cent of schools are connected to the electric network, but there is a disparity between rural and urban areas, with only 7.9 per cent connected in the district of Kedougou to 100 per cent in Dakar City. Senegal possesses modern telecommunication infra-structures. A completely digitised telephone network as well as an Internet protocol network covering a large area of the country is in place. There are twenty-fi ve fi xed telephone lines for every 1,000 residents, and in recent years, there has been a steep surge in mobile telephony, with a total of about 3.5 million users as of February 2007. The number of Internet users is estimated at about 100,000 with a huge increase having occurred in the last two years.
Senegal takes ICT policy seriously with the process being implemented by the information and communication technology secretariat at the offi ce of the president. An ICT park has been inaugurated in Dakar. Senegal’s ICT strategy involves the creation of enabling envi-ronment to attract investment and innovation, universal access to ICTs by all including young people, harnessing ICTs in health and delivery of other public services, enhancing the capacities of small and medium enterprises and creation of content, and building key instruments to advance information and knowledge.
The national strategy of Senegal has greatly benefi ted from the Acacia project of the Inter-national Development Research Centre. The Acacia strategy for Senegal has the following targets among others:
Building ICT infrastructure, human resources development.
Building the capacities of small enterprises and telecentres.
Creation of youth cyberspace experimental site and information resource centre.
The private sectors and ICT professionals have also been active in spearheading the imple-mentation of ICT programmes through a plan entitled ‘the ICT Grape’, which aims at harnessing ICTs to reduce unemployment and poverty, to increase literacy and access to the healthcare, and improve competitiveness and effi ciency in government and private sector institutions.
Since Senegal is the country in the world, after Japan, to have developed a very sophisti-cated government intranet system, the Senegalese have the opportunity to gain a signifi cant amount of training from their home country, thus avoiding the fi nancial burden of going overseas.
Telecommunication sector already plays a signifi cant role in the economic and social devel-opment of the country, comprising 7 per cent of the Gross Domestic Product (GDP) and 5.4 per cent in total capital. The will to make communication services one of the vehicles for the country’s economic and social development has been a goal since the mid-1990s. The president of the Republic of Senegal, the ‘fi rst in line’ in the fi ght to reduce the digital gap between the north and the south, enacted an in-depth ICT policy within the Senegalese civil service. The State Computer Science Bureau’s Government Intranet Project provides a 1 Gbps network, linking the different departments through optical fi bres. Outside services
•
•
•
13_Africa_Report09_Senegal.indd 28513_Africa_Report09_Senegal.indd 285 2/25/09 4:29:38 PM2/25/09 4:29:38 PM

286
Country Report for Senegal
OU
TS
OU
RC
IN
G
TO
A
FR
IC
Awill be connected to this intranet through wireless connection. The telephone lines between departments will be free. The government is also working at the community level, with the support of UNESCO, towards building community multimedia centres (CMCs), to provide radio broadcast and ICT services.
Telecommunications in Senegal
Indicator
Internet speed 1.24 Gbps
Number of cellular phone users 3.5 million
Number of operators 2 (Orange et Tigo)
Number of landline telephone users 274,054 (2006)
Televisions per 1,000 people 79
Radios per 1,000 people 126
Landline telephones per 1,000 people 25
Cellular phones per 1,000 people 31
Personal computers per 1,000 people 18.6
Internet users (in thousands) 100
Community multimedia centres 24
Also the quality of certain public services (electricity) hinders the country’s economic devel-opment and industrialisation, being focused only in Dakar, makes the city overpopulated. To counter all this, Senegal has not only taken the initiative to promote telecoms in rural zones but has also started implementing ambitious plans for the period 2005 to 2015 such as the plans to improve roads and expand Dakar Port.
Physical Infrastructure
Offi ce market: The main offi ce locations in the capital Dakar are the downtown area, which is known as Plateau, Point E, and Les Almadies/N’gor. Due to historical reasons, the downtown area remains the main administrative and banking area. Point E is qui-eter and as a consequence has attracted professional companies. Les Almadies/N’gor is an area around the airport where there are also high-end residential and tourist uses. Due to the relative stability of the country, a number of international organisations have relocated to Dakar from other less stable locations around the west coast of Africa, and as a consequence rental levels have been consistently increasing.
Retail market: Dakar’s retail market is mainly focused in the old downtown centre, around Place d’Indépendance, which is the established location for many airline offi ces and banks. The market is currently in its infancy, but there are the fi rst signs of more sophisticated development beginning to take place, particularly in relation to fast food and supermarket outlets associated with petrol retailers.
•
•
13_Africa_Report09_Senegal.indd 28613_Africa_Report09_Senegal.indd 286 2/25/09 4:29:38 PM2/25/09 4:29:38 PM
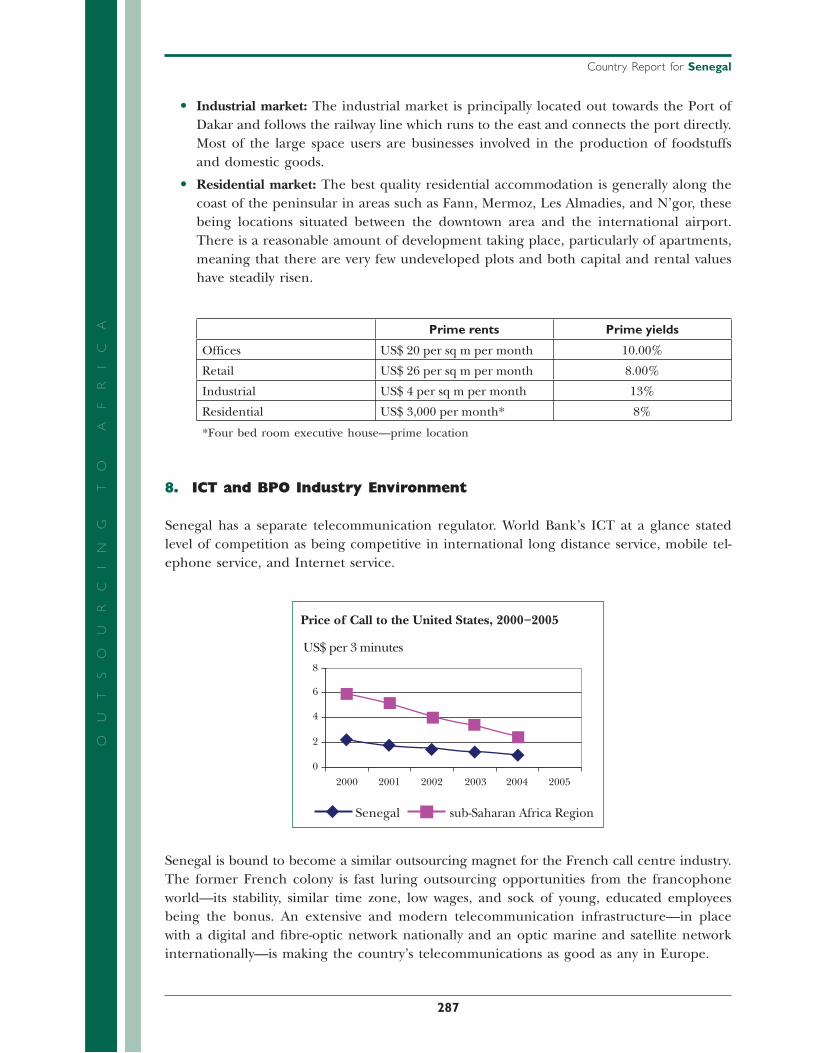
Country Report for Senegal
287
OU
TS
OU
RC
IN
G
TO
A
FR
IC
AIndustrial market: The industrial market is principally located out towards the Port of Dakar and follows the railway line which runs to the east and connects the port directly. Most of the large space users are businesses involved in the production of foodstuffs and domestic goods.
Residential market: The best quality residential accommodation is generally along the coast of the peninsular in areas such as Fann, Mermoz, Les Almadies, and N’gor, these being locations situated between the downtown area and the international airport. There is a reasonable amount of development taking place, particularly of apartments, meaning that there are very few undeveloped plots and both capital and rental values have steadily risen.
Prime rents Prime yields
Offi ces US$ 20 per sq m per month 10.00%
Retail US$ 26 per sq m per month 8.00%
Industrial US$ 4 per sq m per month 13%
Residential US$ 3,000 per month* 8%
*Four bed room executive house—prime location
8. ICT and BPO Industry Environment
Senegal has a separate telecommunication regulator. World Bank’s ICT at a glance stated level of competition as being competitive in international long distance service, mobile tel-ephone service, and Internet service.
Price of Call to the United States, 2000–2005
US$ per 3 minutes
Senegal
2000
8
6
4
2
0
2001 2002 2003 2004 2005
sub-Saharan Africa Region
Senegal is bound to become a similar outsourcing magnet for the French call centre industry. The former French colony is fast luring outsourcing opportunities from the francophone world—its stability, similar time zone, low wages, and sock of young, educated employees being the bonus. An extensive and modern telecommunication infrastructure—in place with a digital and fi bre-optic network nationally and an optic marine and satellite network internationally—is making the country’s telecommunications as good as any in Europe.
•
•
13_Africa_Report09_Senegal.indd 28713_Africa_Report09_Senegal.indd 287 2/25/09 4:29:38 PM2/25/09 4:29:38 PM
288
Country Report for Senegal
OU
TS
OU
RC
IN
G
TO
A
FR
IC
A9. Human Resource Effi ciency and Cost
Senegal has ranked fourteenth in People and Skills fairing as low as tenth and eleventh in quantity and quality respectively. In spite of this scoring, human resources in Senegal are carving out a niche market in the francophone world. With French as one of Senegal’s national languages, Dakar call centre staff have an accent neutral enough to pass for native French, and this allures French organisations towards Senegal. The major four call centres in Senegal—PCCI, Call Me, Access Value, Center Value——offer services mainly for French companies.
With the minimum education being a college degree, around 600 operators aged between twenty and twenty-fi ve work up to forty hours a week equipped with a French-sounding pseudonym. Senegal, in addition, plans a competitive and trained workforce in order to attract more foreign companies. For example, Senegal plans a network within the country linked by satellite to the University of New York (Project SMKS) to enable students to obtain American diplomas.
Though Senegal ranks among the twenty least developed countries in the world, and has an unemployment rate of 48 per cent, the centre taps into a pool of well-educated, young Senegalese people who are more respectful than the staff in Europe. With high levels of human skills, diversifi ed service fabric, and a deterministic approach, Senegal is bound to become a similar outsourcing magnet for the French call centre, putting it in competition with Morocco, Tunisia, and Mauritius.
10. Legal and Enforcement Issues
Although Senegal has ranked last in legislative risk, it has made efforts such as signing a bilateral investment treaty with the United States in December 1983. The treaty provides for most-favoured-nation treatment for investors and internationally recognized standards for dispute settlement. Senegal has signed similar agreements for protection of investment with France, Switzerland, Denmark, Finland, Spain, Italy, the Netherlands, and South Korea.
11. Labour and Expatriate Worker’s Permits
Large fi rms (with at least CFA 200 million in equity capital) are required to create at least fi fty full-time positions for Senegalese nationals and to contribute hard currency equivalent to CFA 100 million.
12. Revenue, Tax, and Repatriation Issues
In January 2000, Senegal put in place a new import tariff structure that conforms to a Com-mon External Tariff (CET) scheme agreed on by the member states of the West African Economic and Monetary for four product categories with tariff rates of 0, 5, 10, and 20 per cent.
13_Africa_Report09_Senegal.indd 28813_Africa_Report09_Senegal.indd 288 2/25/09 4:29:39 PM2/25/09 4:29:39 PM
Country Report for Senegal
289
OU
TS
OU
RC
IN
G
TO
A
FR
IC
AUnder this new regime, the government also eliminated a separate customs stamp tax of 5 per cent, replacing it with a 1 per cent tariff rates of which two are relevant to ICTs:
Category one (zero rate): Social, cultural and scientifi c goods, agriculture inputs, capi-tal goods, and computer and data-processing equipment not available.
Computer and data-processing equipment already available through local production, and new and used vehicles. On top of these duties, the value-added tax (VAT) of 20 per cent is levied at the port rate that is expected to be 18 per cent.
There are no restrictions on the transfer or repatriation of capital and income earned or investments fi nanced with convertible foreign exchange in Senegal.
13. Investment Policy and Incentives
Senegal has established the ‘Guichet Unique’ or one-stop shop at the Ministry of Finance providing the fi rst step for investors towards establishing a business in Senegal and qualify-ing for investment incentives which can through thirty different offi ces which takes between nine and twenty-four months to establish a company. Investors also need the assistance of a ‘notaire’ in order to register and incorporate their company under the newly created OHADA initiative to harmonize commercial codes. Senegal’s investment code provides equal incentives for foreign and local fi rms, and there are no barriers regarding 100 per cent ownership of businesses by foreign investors in most sectors. Their eligibility for investment incentives depends on the fi rm’s size and type of activity, the amount of the potential invest-ment, and the location of the project. To qualify for incentives, the investment of enterprises operating in ‘priority’ sectors are eligible for investment code advantages. These sectors include manufacturing, tourism, banking, trading complexes, and cultural activities. These benefi t goods not produced locally for small and medium-sized fi rms, and three years for all others. Also included is exoneration from direct and indirect taxes.
Enterprises that locate in less-industrialized areas of Senegal benefi t from exemption of the payroll tax of 3 per cent, with the exemption running from fi ve to twelve years, depending on the location.
14. Government Agencies Giving Support to Outsourcing
The ‘Guichet Unique’ or one-stop shop at the Ministry of Finance provides the fi rst step for investors towards establishing a business in Senegal.
15. Overall Assessment and Recommendations
In order to improve its People and Skill ranking, Senegal should hasten its plans for a com-petitive and trained workforce. Senegal plans to network within country linked by satellite to the University of New York (Project SMKS) to enable students to obtain qualifi cations.
•
•
13_Africa_Report09_Senegal.indd 28913_Africa_Report09_Senegal.indd 289 2/25/09 4:29:39 PM2/25/09 4:29:39 PM

290
Country Report for Senegal
OU
TS
OU
RC
IN
G
TO
A
FR
IC
A16. Contact Details
Investment Promotion Agency
Website: http://www.investinsenegal.com
Agence Nationale Chargée de la Promotion de l’Investissement et des Grands Travaux
52-54 Rue Mohamed V-BP 430 CP 18524
Dakar RP
Senegal
Tel: (+221) 849-05-55; Fax: (+221) 823-94-89
E-mail: [email protected]
Documentation and information centre.
One-stop offi ce.
Investment department.
Communication department.
Presidential council for investment.
Problem-solving unit.
Major projects department.
Administration and fi nance department.
Webmaster.
Embassy of Senegal in China, France, Germany, India, UK, USA
Senegalese Embassy in Beijing
Senegal Embassy, China
1 Ritan Dongyi Jie, Jianguomenwai
Beijing
Tel: (+86) 10-65322593/(+86) 10-65322646
13_Africa_Report09_Senegal.indd 29013_Africa_Report09_Senegal.indd 290 2/25/09 4:29:39 PM2/25/09 4:29:39 PM

Country Report for Senegal
291
OU
TS
OU
RC
IN
G
TO
A
FR
IC
ASenegalese Embassy in Beijing
Embassy of Senegal in Beijing, P.R. of China
Retan Ton Yi Lou Hao
Chikin Yuan
Beijing
Tel: (+86-10) 65322576; Fax: (+86-10) 65322745
Senegalese Embassy in Paris
Senegalese Embassy in Paris, French Republic
14, avenue Robert Schuman
75007
Paris
Tel: (+33-1) 47053945; Fax: (+33-1) 45560430
E-mail: [email protected]
Website: http://www.ambasseneparis.com/
Senegalese Consulate in Toulouse
Senegalese Consulate in Toulouse, France
1, rue Lapeyrouse
31008
Toulouse
Tel: (+33-5) 62151617; Fax: (+33-5) 62151717
Senegalese Consulate in Rouen
Senegalese Consulate in Rouen, France
2, rue Abb? Cochet
Rouen
Tel: (+33-2) 35700836; Fax: (+33-2) 20526877
Senegalese Consulate in Paris
Senegalese Consulate in Paris, France
22, rue Hamelin
75116
Paris
Tel: (+33-1) 44053848; Fax: (+33-1) 47559940
Senegalese Consulate in Strasbourg
Senegalese Consulate in Strasbourg, France
27, place Kleber
67000
Strasbourg
Tel: (+33-3) 88756116; Fax: (+33-3) 88230095
13_Africa_Report09_Senegal.indd 29113_Africa_Report09_Senegal.indd 291 2/25/09 4:29:39 PM2/25/09 4:29:39 PM
292
Country Report for Senegal
OU
TS
OU
RC
IN
G
TO
A
FR
IC
ASenegalese Consulate in Bordeaux
Senegal Consulate in Bordeaux, France
347, avenue Thiers
33100
Bordeaux
Tel: (+33-5) 56326287; Fax: (+33-5) 56862853
Senegalese Consulate in Le Havre
Senegalese Consulate in Le Havre, France
6, place Lion Meyer
76600
Le Havre
Tel: (+33-2) 35211082
Senegalese Consulate in Marseille
Senegalese Consulate in Marseille, France
83-85, La Canebire
13001
Marseille
Tel: (+33-4) 91506069; Fax: (+33-4) 91083920
Senegalese Consulate in Nantes
Senegalese Consulate in Nantes, France
Mairie de Nantes, Annexe de Chantenay
44036
Nantes
Tel: (+33-2) 43071871/404-6672
Senegalese Embassy in Bonn
Senegal Embassy, Germany
Argelanderstrasse 3
53115
Bonn
Tel: (+49-228) 218008; Fax: (+49-228) 217815
Senegalese Embassy in Berlin
Embassy of Senegal-Berlin, Germany
Dessauer Str. 28-29
10963
Berlin
Tel: (+49-30) 8562190; Fax: (+49-30) 85621921
Website: http://www.botschaft-senegal.de
13_Africa_Report09_Senegal.indd 29213_Africa_Report09_Senegal.indd 292 2/25/09 4:29:40 PM2/25/09 4:29:40 PM

Country Report for Senegal
293
OU
TS
OU
RC
IN
G
TO
A
FR
IC
ASenegalese Embassy in New Delhi
Senegal Embassy, India
C 6/11 Vasant Vihar
110057
New Delhi
Tel: (+91-11) 6147687/(+91-11) 6147025; Fax: (+91-11) 26142422
Senegalese Embassy in New Delhi
Embassy of Senegal in New Delhi, India
Paschimi Marg
Vasant Vihar 80
110057
New Delhi
Tel: (+91-11) 26873746, 26873720; Fax: (+91-11) 26875809
Senegalese Embassy in London
Senegalese Embassy in United Kingdom
39 Marloes Road
W8 6LA
London
Tel: (+44-207) 9384048/(+44-20) 79384048; Fax: (+44-207) 9382546
E-mail: [email protected]
Website: http://www.senegalembassy.com
Senegalese Embassy in New York
Consulate General of Senegal, New York
271 West 125th Street, Suite 412
NY 10027
USA
New York
Tel: (+1-917) 493-8950; Fax: (+1-917) 493-8953
Website: http://www.consulsenny.com/
Useful Links
http://www.infodev.org
The World Fact book 2007.
http://www.cia.gov/cia/publications/factbook/geos/sg.html
Observatoire des politques des TIC en Afrique.
http://afrique.droits.apc.org/index.shtml?apc=s21834e_1
13_Africa_Report09_Senegal.indd 29313_Africa_Report09_Senegal.indd 293 2/25/09 4:29:40 PM2/25/09 4:29:40 PM

294
Country Report for Senegal
OU
TS
OU
RC
IN
G
TO
A
FR
IC
ASituation des indicateurs de 2000 à 2005 Ministère de l’Education PDEF DPRE.
http://www.education.gouv.sn/
Etude pour l’élaboration d’une stratégie nationale et d’un plan d’actions visant l’insertion du Senegal dans la Société de l’Information. Mars 2001. Ministère des Postes, des Télécommunications et des Nouvelles Technologies de l’Information et de la Communication.
http://www.telecom.gouv.sn/documents/resume%20strategie[1].pdf
Lettre de Politique Sectorielle-Secteur des Télécommunications. Janvier 2005. Observatoire sur les Systèmes d’Information, les Réseaux et les Inforoutes au Senegal (OSIRIS).
http://www.osiris.sn/IMG/pdf/LPS_2005.pdf
TICE au Senegal, quelques chiffres. Octobre 2005. Mosaïque du Monde.
http://senegal.mosaiquedumonde.org/article.php3?id_article=45
Chiffres clés-Principaux Indicateurs. Avril 2007. Observatoire sur les Systèmes d’Information, les Réseaux et les Inforoutes au Senegal (OSIRIS).
http://www.osiris.sn/article26.html
ICT Policy in Senegal. Association for Progressive Communications (APC).
http://afrique.droits.apc.org/index.shtml?apc=s21834e_1
13_Africa_Report09_Senegal.indd 29413_Africa_Report09_Senegal.indd 294 2/25/09 4:29:40 PM2/25/09 4:29:40 PM

295
OU
TS
OU
RC
IN
G
TO
A
FR
IC
A
Country Report for Mozambique
Disclaimer
This short Country Report, a result of a larger Survey of ICT Outsourcing in Africa, provides a general over-view of the current activities and issues related to ICT Outsourcing in the country. The data presented here should be regarded as illustrative rather than exhaustive. ICT Outsourcing is at a particularly dynamic stage in Africa with new developments and announcements happening on a daily basis somewhere or the other on the continent. Therefore, these reports should be seen as ‘snapshots’ that were current at the time they were taken; it is expected that certain facts and fi gures presented may become outdated very quickly.
The fi ndings, interpretations, and conclusions expressed herein are a faithful representation of the respondents of the interviews and secondary data collected from the countries and published literature. Strict analysis has been carried out with the minimal infl uence of the authors/team members. References to data sources have been made as far as possible. In the case of the detailed data parameters used for scores and ranking, the same data source and timeline has been used for all the fi fteen countries compared. In the descriptive sec-tion of the country reports, all data received from the individual country has been used in order to give as complete an assessment as possible. Thus in this part those countries that have provided more information have a better coverage than those who have not been able to provide data to the research team.
Board of Executive Directors of the CBC or Cyber Media cannot guarantee the accuracy of the data included in this work. The boundaries, colours, denominations, and other information shown on any map in this work do not imply on the part of the CBC and Cyber Media any judgement of the legal status of any territory or the endorsement or acceptance of such boundaries.
It is expected that individual Country Report from the Survey of ICT Outsourcing in Africa will be updated in an iterative process over time, based on additional research and feedback received through the CBC and Cyber Media website.
0 100 200 km
0 100 200 mi
24
4032
24
30
12
32 40
Moz
ambi
que
Chann
el
INDIAN OCEAN
SOUTHAFRICA
MAPUTO
Inhambane
Vila Eduardo Mondiane
Chimoio
Quelimane
Nampula
Beira
Cidadede Nacala
PembaLichingaMALAWI
LakeNyasa
MonteBinga
Tete
SWAZ
ZIMBABWE
ZAMBIA
TANZANIA
Zambezi
14_Africa_Report09_Mozambique.in295 29514_Africa_Report09_Mozambique.in295 295 2/25/09 4:30:34 PM2/25/09 4:30:34 PM
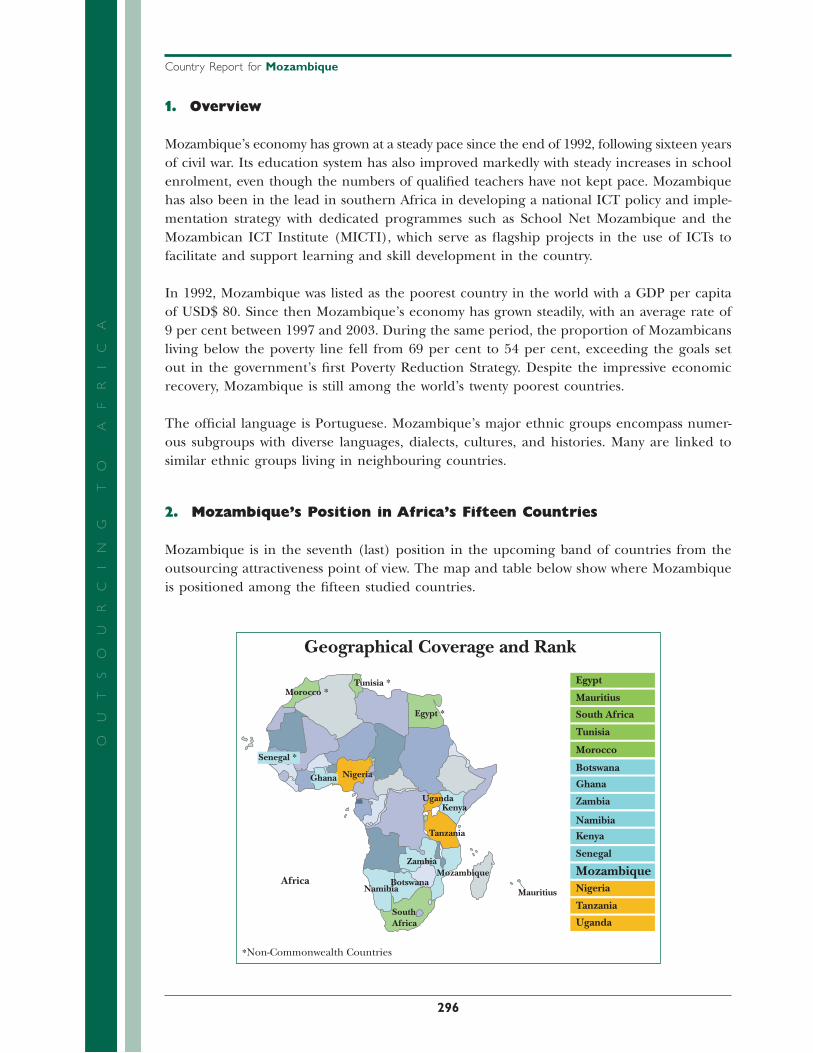
296
Country Report for Mozambique
OU
TS
OU
RC
IN
G
TO
A
FR
IC
A1. Overview
Mozambique’s economy has grown at a steady pace since the end of 1992, following sixteen years of civil war. Its education system has also improved markedly with steady increases in school enrolment, even though the numbers of qualifi ed teachers have not kept pace. Mozambique has also been in the lead in southern Africa in developing a national ICT policy and imple-mentation strategy with dedicated programmes such as School Net Mozambique and the Mozambican ICT Institute (MICTI), which serve as fl agship projects in the use of ICTs to facilitate and support learning and skill development in the country.
In 1992, Mozambique was listed as the poorest country in the world with a GDP per capita of USD$ 80. Since then Mozambique’s economy has grown steadily, with an average rate of 9 per cent between 1997 and 2003. During the same period, the proportion of Mozambicans living below the poverty line fell from 69 per cent to 54 per cent, exceeding the goals set out in the government’s fi rst Poverty Reduction Strategy. Despite the impressive economic recovery, Mozambique is still among the world’s twenty poorest countries.
The offi cial language is Portuguese. Mozambique’s major ethnic groups encompass numer-ous subgroups with diverse languages, dialects, cultures, and histories. Many are linked to similar ethnic groups living in neighbouring countries.
2. Mozambique’s Position in Africa’s Fifteen Countries
Mozambique is in the seventh (last) position in the upcoming band of countries from the outsourcing attractiveness point of view. The map and table below show where Mozambique is positioned among the fi fteen studied countries.
Morocco *
Morocco
Tunisia *
Geographical Coverage and Rank
Tunisia
Egypt *
Egypt
Senegal *
Senegal
GhanaGhana
Nigeria
Nigeria
Uganda
Uganda
Kenya
KenyaTanzania
Tanzania
Zambia
Zambia
Mozambique MozambiqueBotswana
Botswana
Namibia
Namibia
SouthAfrica
South Africa
MauritiusAfrica
*Non-Commonwealth Countries
Mauritius
14_Africa_Report09_Mozambique.in296 29614_Africa_Report09_Mozambique.in296 296 2/25/09 4:30:36 PM2/25/09 4:30:36 PM
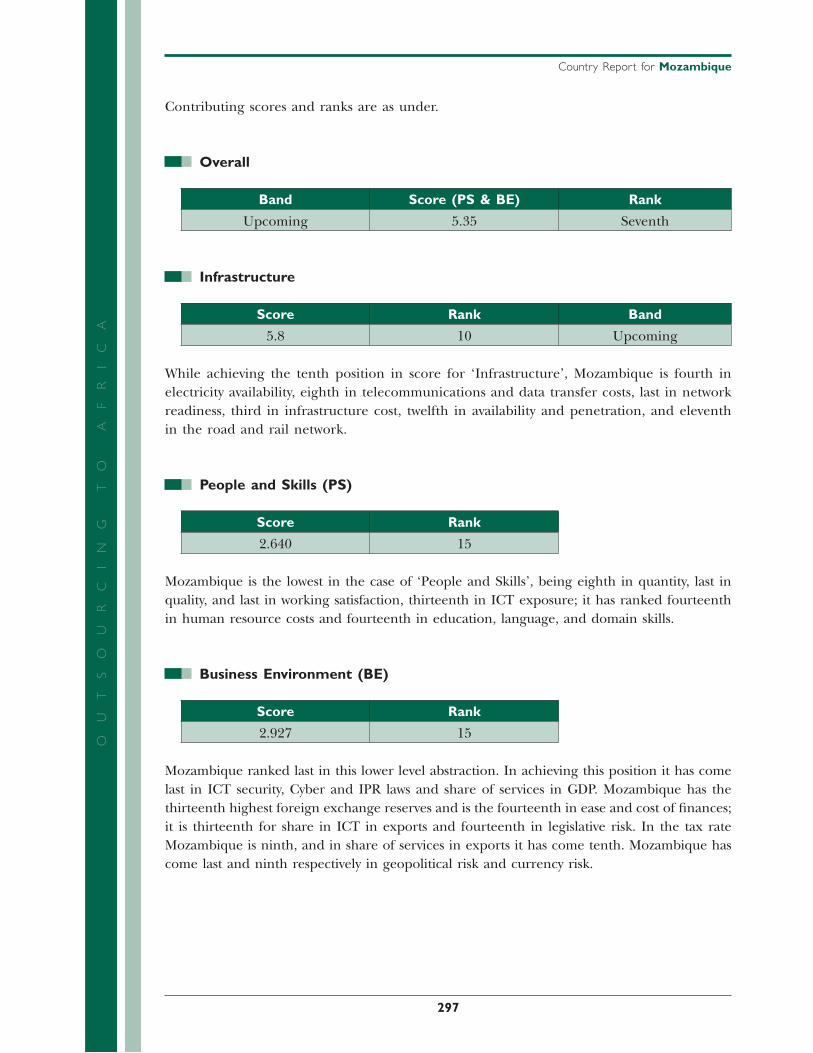
Country Report for Mozambique
297
OU
TS
OU
RC
IN
G
TO
A
FR
IC
AContributing scores and ranks are as under.
Overall
Band Score (PS & BE) Rank
Upcoming 5.35 Seventh
Infrastructure
Score Rank Band
5.8 10 Upcoming
While achieving the tenth position in score for ‘Infrastructure’, Mozambique is fourth in electricity availability, eighth in telecommunications and data transfer costs, last in network readiness, third in infrastructure cost, twelfth in availability and penetration, and eleventh in the road and rail network.
People and Skills (PS)
Score Rank
2.640 15
Mozambique is the lowest in the case of ‘People and Skills’, being eighth in quantity, last in quality, and last in working satisfaction, thirteenth in ICT exposure; it has ranked fourteenth in human resource costs and fourteenth in education, language, and domain skills.
Business Environment (BE)
Score Rank
2.927 15
Mozambique ranked last in this lower level abstraction. In achieving this position it has come last in ICT security, Cyber and IPR laws and share of services in GDP. Mozambique has the thirteenth highest foreign exchange reserves and is the fourteenth in ease and cost of fi nances; it is thirteenth for share in ICT in exports and fourteenth in legislative risk. In the tax rate Mozambique is ninth, and in share of services in exports it has come tenth. Mozambique has come last and ninth respectively in geopolitical risk and currency risk.
14_Africa_Report09_Mozambique.in297 29714_Africa_Report09_Mozambique.in297 297 2/25/09 4:30:36 PM2/25/09 4:30:36 PM
298
Country Report for Mozambique
OU
TS
OU
RC
IN
G
TO
A
FR
IC
A3. Country, Political, and Economic Profi le
Geography
Area: 801,590 sq km; slightly less than twice the size of California.
Major cities: Capital—Maputo (pop. 1.2 million—2005 est.); Beira, Matola, Nampula, Quelimane, Tete, Nacala.
Terrain: Varies from lowlands to high plateau.
Climate: Tropical to subtropical.
People
Nationality: Noun and adjective—Mozambican(s).
Population (2006 est.): 19.7 million; 48.2% male and 51.8% female.
Population annual growth rate (2006): 1.3%.
Ethnic groups: Makua, Tsonga, Makonde, Shangaan, Shona, Sena, Ndau, and other indigenous groups, and approximately 10,000 Europeans, 35,000 Euro-Africans, and 15,000 South Asians.
Religions: Christian 40%, Muslim 20%, indigenous African and other beliefs 40% (1997 census—recent estimates give a higher Muslim percentage).
Languages: Portuguese (offi cial), various indigenous languages.
Education: Mean years of schooling (adults over twenty-fi ve); men 2.1, women 1.2.
Primary net enrolment rate (2003): 61%.
Adult illiteracy rate (2003): 53.6%.
Health infant mortality rate (2006): 129/1,000.
Life expectancy (2006): 40 years.
Work force (9.4 million est. 2006): Agriculture—81%; industry—6%; services—13% (1997 estimate).
Government
Type: Multi-party democracy.
Independence: 25 June 1975.
Constitution: November 1990.
Branches: Executive—President, Council of Ministers. Legislative—National Assembly, municipal assemblies.
Judicial: Supreme Court, provincial, district, and municipal courts.
Administrative subdivisions: Ten provinces, 224 districts, and thirty-three municipalities of which Maputo City is the largest.
Political parties: Front for the Liberation of Mozambique (FRELIMO); Mozambican National Resistance (RENAMO); numerous small parties.
Suffrage: Universal adult, eighteen years and older.
14_Africa_Report09_Mozambique.in298 29814_Africa_Report09_Mozambique.in298 298 2/25/09 4:30:36 PM2/25/09 4:30:36 PM
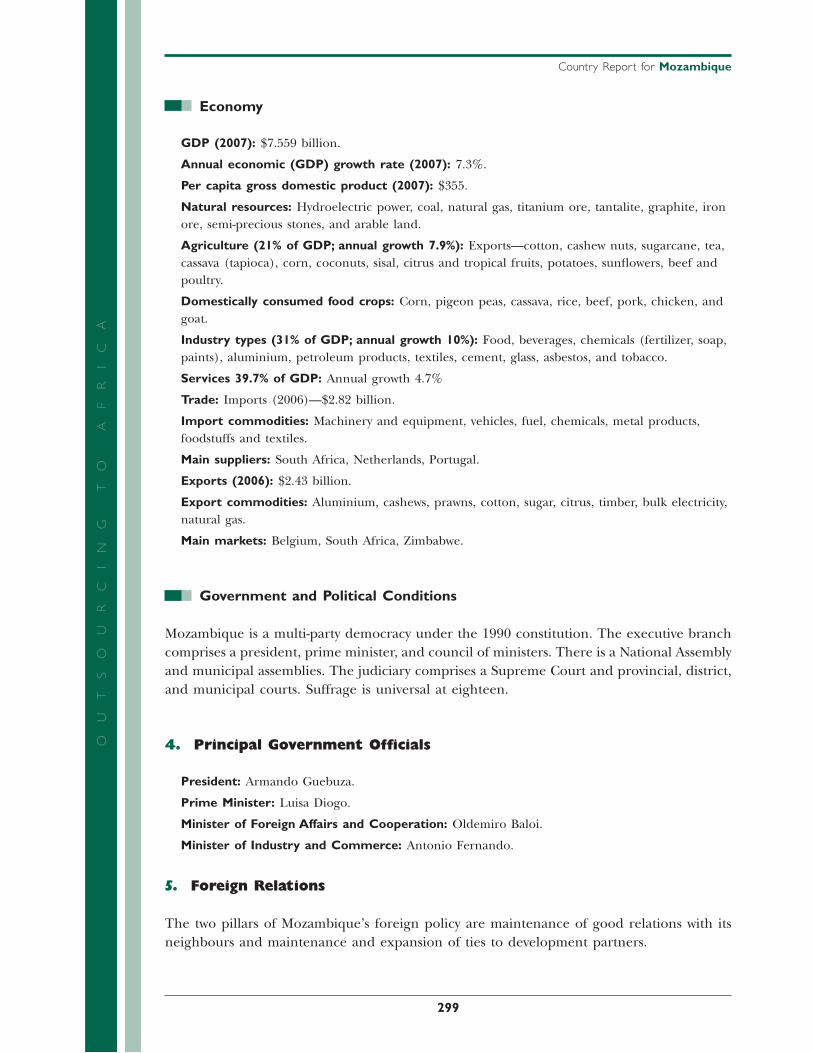
Country Report for Mozambique
299
OU
TS
OU
RC
IN
G
TO
A
FR
IC
AEconomy
GDP (2007): $7.559 billion.
Annual economic (GDP) growth rate (2007): 7.3%.
Per capita gross domestic product (2007): $355.
Natural resources: Hydroelectric power, coal, natural gas, titanium ore, tantalite, graphite, iron ore, semi-precious stones, and arable land.
Agriculture (21% of GDP; annual growth 7.9%): Exports—cotton, cashew nuts, sugarcane, tea, cassava (tapioca), corn, coconuts, sisal, citrus and tropical fruits, potatoes, sunfl owers, beef and poultry.
Domestically consumed food crops: Corn, pigeon peas, cassava, rice, beef, pork, chicken, and goat.
Industry types (31% of GDP; annual growth 10%): Food, beverages, chemicals (fertilizer, soap, paints), aluminium, petroleum products, textiles, cement, glass, asbestos, and tobacco.
Services 39.7% of GDP: Annual growth 4.7%
Trade: Imports (2006)—$2.82 billion.
Import commodities: Machinery and equipment, vehicles, fuel, chemicals, metal products, foodstuffs and textiles.
Main suppliers: South Africa, Netherlands, Portugal.
Exports (2006): $2.43 billion.
Export commodities: Aluminium, cashews, prawns, cotton, sugar, citrus, timber, bulk electricity, natural gas.
Main markets: Belgium, South Africa, Zimbabwe.
Government and Political Conditions
Mozambique is a multi-party democracy under the 1990 constitution. The executive branch comprises a president, prime minister, and council of ministers. There is a National Assembly and municipal assemblies. The judiciary comprises a Supreme Court and provincial, district, and municipal courts. Suffrage is universal at eighteen.
4. Principal Government Offi cials
President: Armando Guebuza.
Prime Minister: Luisa Diogo.
Minister of Foreign Affairs and Cooperation: Oldemiro Baloi.
Minister of Industry and Commerce: Antonio Fernando.
5. Foreign Relations
The two pillars of Mozambique’s foreign policy are maintenance of good relations with its neighbours and maintenance and expansion of ties to development partners.
14_Africa_Report09_Mozambique.in299 29914_Africa_Report09_Mozambique.in299 299 2/25/09 4:30:37 PM2/25/09 4:30:37 PM

300
Country Report for Mozambique
OU
TS
OU
RC
IN
G
TO
A
FR
IC
AIn the years immediately following its independence, Mozambique benefi ted from consid-erable assistance from some Western countries, notably the Scandinavians. Moscow and its allies, however, became Mozambique’s primary economic, military, and political supporters, and its foreign policy refl ected this linkage. In 1984, Mozambique joined the World Bank and International Monetary Fund. Mozambique is a member of the Non-Aligned Move-ment and ranks among the moderate members of the African Bloc in the United Nations and other international organizations. Mozambique also belongs to the Organization of African Unity/African Union and the Southern African Development Community. In early 1996 Mozambique joined its Anglophone neighbours in the Commonwealth. In the same year, Mozambique became a founding member and the fi rst President of the Community of Portuguese Language Countries (CPLP); it maintains close ties with other Lusophone states.
6. Living, Security, and Safety Perceptions
The security situation in Mozambique requires caution. Street crime and carjacking in urban areas occur frequently. Road travel can be hazardous and should not be undertaken after daylight hours. The abundance of weapons remaining from the country’s civil war and police who are poorly trained, equipped, and motivated contributes to a serious crime situation.
Additionally, several hundred thousand mines were planted throughout Mozambique during the last three decades of confl ict. Although mine clearing operations are underway, surface travel off main highways should be approached with caution.
Overland travel after dark is extremely dangerous. Street crimes including mugging and purse snatching is common in cities.
Medical facilities are rudimentary, and most medical providers do not speak fluent English. Medicines are not always consistently available. There are both public and private medical facilities in the city of Maputo and most provincial capitals. All health-care institutions and providers require payment at the time of service and may even require payment before service is given. While some private clinics accept credit cards, many medical facilities do not. Doctors and hospitals outside Maputo generally expect immediate cash payment for health services. Outside of Maputo, available medical care ranges from very basic to non-existent.
7. ICT Policy, Infrastructure, and Service
Mozambique has been involved in the development of an ICT policy since the mid-nineties. The ICT policy, formally tabled in the Cabinet in December 2000, addresses priority areas such as Education, Health (with a priority on HIV/AIDS), Human Resource Development, Infrastructure, Access, and Governance.
14_Africa_Report09_Mozambique.in300 30014_Africa_Report09_Mozambique.in300 300 2/25/09 4:30:37 PM2/25/09 4:30:37 PM

Country Report for Mozambique
301
OU
TS
OU
RC
IN
G
TO
A
FR
IC
AInfrastructure
According to the World Economic Forum Global Information Technology Report, Mozam-bique ranks 101st out of 115 economies using the Networked Readiness Index (NRI) which measures the degree of preparation of a nation or community to participate in and benefi t from ICT developments. Most of Mozambique’s infrastructure is concentrated in the capital city Maputo. The table below provides an overview of Mozambique’s ICT infrastructure.
ICT Infrastructure Indicators
Indicator
Fixed-line subscribers (2004) 69.7 per 1,000 persons
Mobile subscribers 708 per 1,000 persons
Dial-up subscribers (2005) 6,000 (http://www.afridigital.net)
Broadband subscribers (2004) 0.0
Internet users (2004) 7.167
Television broadcast stations 1
Radio stations 41
Telecom service cost according to World Bank has been declining considerably since 2001.
ICT Access Indicators, 2000–2006
Number per 100 people
Fixed + mobile subscribersInternet usersPCs
2000 2001 2002 2003 2004 2005 2006
5
10
15
0
14_Africa_Report09_Mozambique.in301 30114_Africa_Report09_Mozambique.in301 301 2/25/09 4:30:37 PM2/25/09 4:30:37 PM

302
Country Report for Mozambique
OU
TS
OU
RC
IN
G
TO
A
FR
IC
A
Price of Call to the United States, 2000–2005
US$ per 3 minutes
Mozambique
sub-Saharan Africa Region
2000 2001 2002 2003 2004 20050
2
4
6
8
Mozambique is improving as per these World Bank fi gures.
Telecommunications Revenue, 2000–2006
Percentage of GDP
2000 2001 2002 2003 2004 2005 20060
2
4
6
Mozambiquesub-Saharan Africa Region
14_Africa_Report09_Mozambique.in302 30214_Africa_Report09_Mozambique.in302 302 2/25/09 4:30:37 PM2/25/09 4:30:37 PM

Country Report for Mozambique
303
OU
TS
OU
RC
IN
G
TO
A
FR
IC
APhysical Infrastructure
Offi ce market: The majority of Maputo’s offi ce space is in the city itself, with new buildings being erected to accommodate companies in a modern environment. Such buildings rent for around US$ 15 per sq m per month. It is also common for offi ces to be operated from residential properties, with residential rental rates applying.
Retail market: Maputo’s developers are grappling with the shopping mall concept.
The new Maputo Shopping Centre in the downtown area, developed at a cost of US$ 32 million, has recently been inaugurated, joining existing developments such as the Polana Shopping Centre. Retail rents average US$ 10 per sq m per month.
Industrial market: The Maputo industrial market is very mixed, with many properties situated next to residential areas on the outskirts of the city. Industrial space is rented out for about US$ 2 per sq m per month. However, the majority of new space con-structed is for owner occupation.
Residential market: The quality of residential property in Maputo varies enormously depending on geographical location. Rents in Maputo’s best residential location, at the medium to top range of the market, are between US$ 6–12 per sq m per month, depending on the age of the property, the size of the garden, and the existence of a swimming pool.
Prime rents Prime yields
Offi ces US$ 15 per sq m per month 15%
Retail US$ 10 per sq m per month 10–14%
Industrial US$ 2 per sq m per month 7–11%
Residential US$ 2,500 per month* 12%
*4 bedroom executive house--prime location.(Source: Knight Frank LLP)
8. ICT and BPO Industry Environment
It has not been possible to fi nd any signifi cant outsourcing.
9. Human Resource Effi ciency and Cost
Mozambique has ranked last in People and Skills fairing as low as eighth and fi fteenth in quantity and quality respectively. Although primary education is compulsory, the statistics show that this has not been enforced, and school-going fi gures are low. ten per cent of stu-dents from primary education go on to secondary level. A syllabus for the introduction of ICT training into secondary schools has been established.
•
•
•
•
•
14_Africa_Report09_Mozambique.in303 30314_Africa_Report09_Mozambique.in303 303 2/25/09 4:30:38 PM2/25/09 4:30:38 PM

304
Country Report for Mozambique
OU
TS
OU
RC
IN
G
TO
A
FR
IC
A10. Legal and Enforcement Issues
Mozambique has scored very low in legislative risk becoming the fourteenth out of the fi fteen countries studied.
Intellectual Property Rights
Mozambique law guarantees the security and legal protection of property rights, including industrial property. Mozambique is a signatory to the Berne Convention as well as the New York and Paris Conventions, although the deposition of the instruments is still in process. A draft IPR law has been under development for some years, and this is likely to be augmented by the integrated national ICT policy development process that is now taking place.
11. Labour and Expatriate Worker’s Permits
Mozambique is a signatory to the International Core Labour Standards and is currently working on reforming the labour legislation covering issues such as contracts, health and safety of workers.
Out of a total labour force of approximately 8.5 million in Mozambique, only 16.4 per cent are in salaried employed category. Of these, around 500,000 (65 per cent of the workforce) are in the private formal sector. The labour movement in Mozambique is weak, as are the employers’ associations. The judicial system that supports labour regulation in Mozambique is also a constraint. Women are underrepresented in formal sector employment. Technical skill levels are extremely low.
Social Security
Employers are obliged by law to pay a social security tax assessed at 7 per cent of the employ-ee’s wages. A maximum of 3 per cent of this is deductible from the employee’s salary, while the remaining 4 per cent is met by the employer. Foreign resident workers may be exempt if they can demonstrate participation in an alternative social security scheme.
Contracting Foreign Workers
Although the contracting of Mozambican workers is unrestricted, contracting of foreign workers by national or foreign entities, including administrators, directors and representa-tives of foreign companies, is subject to authorisation by the Ministry of Labour. Foreign workers must possess professional qualifi cations and may only be contracted where there are no Mozambicans with such qualifi cations or their number is insuffi cient. All investments must specify in the investment project proposal the number and category of Mozambican and foreign workers to be employed.
14_Africa_Report09_Mozambique.in304 30414_Africa_Report09_Mozambique.in304 304 2/25/09 4:30:38 PM2/25/09 4:30:38 PM

Country Report for Mozambique
305
OU
TS
OU
RC
IN
G
TO
A
FR
IC
AEmployment Regulations
The establishment of wages and other forms of remuneration to be paid to the employee are not subject to control. However, the labour legislation provides for a minimum wage of US$ 50.00 per month for employees in the commercial, industrial, and other sectors.
12. Revenue, Tax, and Repatriation Issues
Conservative fi scal and monetary policies combined with the introduction of sound banking legislation have created a foundation for a strong fi nancial sector and led to major drop in infl ation which is now less than 5 per cent. The local currency, the Metical, is stable, and access to foreign exchange is not generally a problem. There are about ten commer-cial banks operating in Mozambique. Access to fi nance is constrained by the relatively high interest rates, around 15 per cent. Investment laws guarantee foreign remittance of 100 per cent off-shore loan payments, dividends, and profi ts, but these must be defi ned at the time of investment registration for amounts over $5,000. All land is owned by the state and is leased in parcels to individuals and companies for up to fi fty years with an option to renew. The Maputo Stock Exchange was opened in late 1999. Ex-Im Bank and OPIC are active in Mozambique, and it is also a member of MIGA. The IFC and the Commonwealth Develop-ment Corporation provides medium-term loans and equity fi nance.
Customs tariffs average about 10 per cent. Investment laws guarantee foreign remittance of 100 per cent off shore loan payments, dividends, and profi ts, but these must be defi ned at the time of investment registration for amounts over $5000.
13. Investment Policy and Incentives
The 1993 Investment Law deregulated foreign investment, streamlined investment authori-sation procedures, and put in place investment support services with the aim of attracting local and foreign investors. The minimum investment threshold for tax and import incen-tives is US$ 50,000. The realisation of investments and exploration of mineral resources is regulated by the Mining Law.
100 per cent foreign ownership allowed.
Acquisition and use of land by individuals and companies allowed as non-tradable concession.
Import Duties Exemption on capital goods.
Local Partner not a legal requirement.
Corporate Tax Exemptions of fi ve year tax holiday for export-orientated manufacturing companies.
Standard corporate income tax rate is 32 per cent; however, Agriculture (including stock raising) benefi ts from a preferential rate of 10 per cent until 2010.
•
•
•
•
•
•
14_Africa_Report09_Mozambique.in305 30514_Africa_Report09_Mozambique.in305 305 2/25/09 4:30:39 PM2/25/09 4:30:39 PM

306
Country Report for Mozambique
OU
TS
OU
RC
IN
G
TO
A
FR
IC
ATax Incentives: (i) incentives offered for new and non-operational undertakings; cor-porate tax reduced by 50–80 per cent according to sector/geographical location; (ii) 100 per cent deduction of taxable income for new investments in equipment and con-struction of plant and infrastructure; (iii) additional incentives for investments based in less-developed provinces.
No foreign exchange control.
Free to import equity capital or arrange loans to carry out investments.
Free repatriation of profi ts, dividends, and interest.
Expatriate staff allowed.
Protection Investment Guarantees Member of MIGA and coverage by OPIC (insurers against non-commercial risk).
Dispute Resolution Signatory to ICSID and ICC arbitration rules.
Investment Promotion and Protection Agreements
IPPAs are designed to encourage investor confi dence by setting high standards of investor protection applicable in international law. Key elements include provisions for equal and non-discriminatory treatment of investors and their investments, compensation for expro-priation, transfer of capital and returns, and access to independent settlement of disputes.
The minimum value of investment to access the guarantees and fi scal benefi ts are US$ 50,000 for direct foreign investment and US$ 5,000 for national direct investment. The guarantees to investment envisaged in the legislation enforce comprise: legal protection on property and rights, including, industrial property rights; no restriction of borrowing and payment of interest abroad; transfer of dividends abroad; arbitration according to ICSID or ICC rules for the resolutions of disputes on investments.
14. Government Agencies Giving Support to Outsourcing
The Investment Promotion Centre (IPC) is responsible for facilitating investment and has developed a package of services to assist investors obtain permits and licenses from the government.
15. Overall Assessment and Recommendations
As per the scores and ranks Mozambique does make it to the upcoming band. The World Bank fi gures show a steady progress in the ICT infrastructure. Thus Mozambique does have a potential to become an outsourcing destination especially for the Portuguese-speaking market. It is for the Government of Mozambique to decide what to do with this potential. If necessary they could approach the Commonwealth Fund for Technical Cooperation (CFTC) to sponsor a strategy study to help them build an outsourcing industry.
•
•
•
•
•
•
•
14_Africa_Report09_Mozambique.in306 30614_Africa_Report09_Mozambique.in306 306 2/25/09 4:30:39 PM2/25/09 4:30:39 PM

Country Report for Mozambique
307
OU
TS
OU
RC
IN
G
TO
A
FR
IC
A16. Contact Details
Investment Promotion Agency
CPI
Maputo Head Offi ce
P.O. Box 4635
Maputo, Mozambique
Tel: (+258) 21313310/21313375
E-mail: [email protected]
Website: http://www.cpi.co.mz
Embassy of Mozambique in China, France, Germany, India, UK, USA
Mozambican Embassy in Beijing
Embassy of Mozambique
1-71 Tayuan Offi ce Building
San Lui Tun, L, 8th Floor
Beijing 100600
P.R. of China
Beijing
Tel: (+86-10) 65323664, 65236664, 65323578, 65323762; Fax: (+86-10) 65325189
E-mail: [email protected]
Embassy of Mozambique in Paris, France
82, rue Laugier-75017 Paris, France
Paris
Tel: (+33-1) 47649132; Fax: (+33-1) 42673828, 44159013
E-mail: [email protected]
Mozambican Consulate in Munich
Honorary Consulate of Mozambique
Bayerstr. 33
80335 Munich
Germany
Munich
Tel: (+49-89) 59998116; Fax: (+49-89) 59998109
E-mail: [email protected]
Mozambican Embassy in Berlin
Embassy of Mozambique
Stromstr. 47
10551 Berlin
Germany
Berlin
14_Africa_Report09_Mozambique.in307 30714_Africa_Report09_Mozambique.in307 307 2/25/09 4:30:39 PM2/25/09 4:30:39 PM

308
Country Report for Mozambique
OU
TS
OU
RC
IN
G
TO
A
FR
IC
ATel: (+49-30) 39876500/1/2; Fax: (+49-30) 39876503
E-mail: [email protected]
Website: http://www.mosambik-botschaft.de
Mozambican Embassy in New Delhi
Embassy of Mozambique
B-3/24 Vasant Vihar
New Delhi 100057
India
New Delhi
Tel: (+91-11) 22615666; Fax: (+91-11) 22615666
Mozambican Consulate in London
High Commission of Mozambique
21 Fitzroy Square
London W1P 5HJ
United Kingdom
London
Tel: (+44-20) 73833800; Fax: (+44-20) 73833801
E-mail: [email protected]
Website: http://www.mozambiquehc.org.uk
Mozambican Embassy in Washington DC
Embassy of Mozambique in Washington USA
1990 M Street North West
Suite 570
20036, USA
Washington DC
Tel: (202) 293-7146/9; Fax: (202) 835-0245
E-mail: [email protected]
Website: http://www.embamoc-usa.org/
Useful Links
The World Fact book 2007.
https://www.cia.gov/cia/publications/factbook/geos/mz.html
Mozambique.
http://www.eaie.nl/pdf/torino/905.pdf.
‘Introducing the use of ICTs in Education,’ 2004.
Ministry of Education Mozambique.
14_Africa_Report09_Mozambique.in308 30814_Africa_Report09_Mozambique.in308 308 2/25/09 4:30:39 PM2/25/09 4:30:39 PM

Country Report for Mozambique
309
OU
TS
OU
RC
IN
G
TO
A
FR
IC
AUNICEF Mozambique Education.
http://www.unicef.org/mozambique/education.html
Global Information Technology Report, 2003.
South wood, R. “Assessing Consumer Activity in the Telecoms and Internet sectors in Africa.” IDRC.
http://www.afridigital.net/downloads/IDRCconsumerdftV2.doc
“A Country ICT Survey of Mozambique.” 2006. Greenberg ICT Services, SIDA. Stockholm, Sweden.
IDRC Acacia: Mozambique.
http://www.idrc.ca/acacia/mozambique
14_Africa_Report09_Mozambique.in309 30914_Africa_Report09_Mozambique.in309 309 2/25/09 4:30:39 PM2/25/09 4:30:39 PM

14_Africa_Report09_Mozambique.in310 31014_Africa_Report09_Mozambique.in310 310 2/25/09 4:30:40 PM2/25/09 4:30:40 PM

311
OU
TS
OU
RC
IN
G
TO
A
FR
IC
A
Country Report for Nigeria
Disclaimer
This short Country Report, a result of a larger Survey of ICT Outsourcing in Africa, provides a general over-view of the current activities and issues related to ICT Outsourcing in the country. The data presented here should be regarded as illustrative rather than exhaustive. ICT Outsourcing is at a particularly dynamic stage in Africa with new developments and announcements happening on a daily basis somewhere or the other on the continent. Therefore, these reports should be seen as ‘snapshots’ that were current at the time they were taken; it is expected that certain facts and fi gures presented may become outdated very quickly.
The fi ndings, interpretations, and conclusions expressed herein are a faithful representation of the respondents of the interviews and secondary data collected from the countries and published literature. Strict analysis has been carried out with the minimal infl uence of the authors/team members. References to data sources have been made as far as possible. In the case of the detailed data parameters used for scores and ranking, the same data source and timeline has been used for all the fi fteen countries compared. In the descriptive sec-tion of the country reports, all data received from the individual country has been used in order to give as complete an assessment as possible. Thus in this part those countries that have provided more information have a better coverage than those who have not been able to provide data to the research team.
Board of Executive Directors of the CBC or Cyber Media cannot guarantee the accuracy of the data included in this work. The boundaries, colours, denominations, and other information shown on any map in this work do not imply on the part of the CBC and Cyber Media any judgement of the legal status of any territory or the endorsement or acceptance of such boundaries.
It is expected that individual Country Reports from the Survey of ICT Outsourcing in Africa will be updated in an iterative process over time, based on additional research and feedback received through the CBC and Cyber Media website.
NIGER CHAD
ABUJA
CAMEROON
Yola
Maiduguri
LakeChad
Kano
Jos
ZariaKaduna
llorin
OgbomosoOshogbo
lbadan
Lagos
BeninCity
Warri
Enugu
Makurdi
Calabar
PortHarcourt
EQUATORIALGUINEA
Sokoto Katsina
BENIN
MALI
CHAD
ChappalWaddi
BakasiPeninsula
Gulf of Guinea
Bight ofBenin
Niger
Benue
6
12
6
12
6
12
6 12
0 100 200 km
0 100 200 mi
15_Africa_Report09_Nigeria.indd 31115_Africa_Report09_Nigeria.indd 311 2/25/09 4:33:22 PM2/25/09 4:33:22 PM
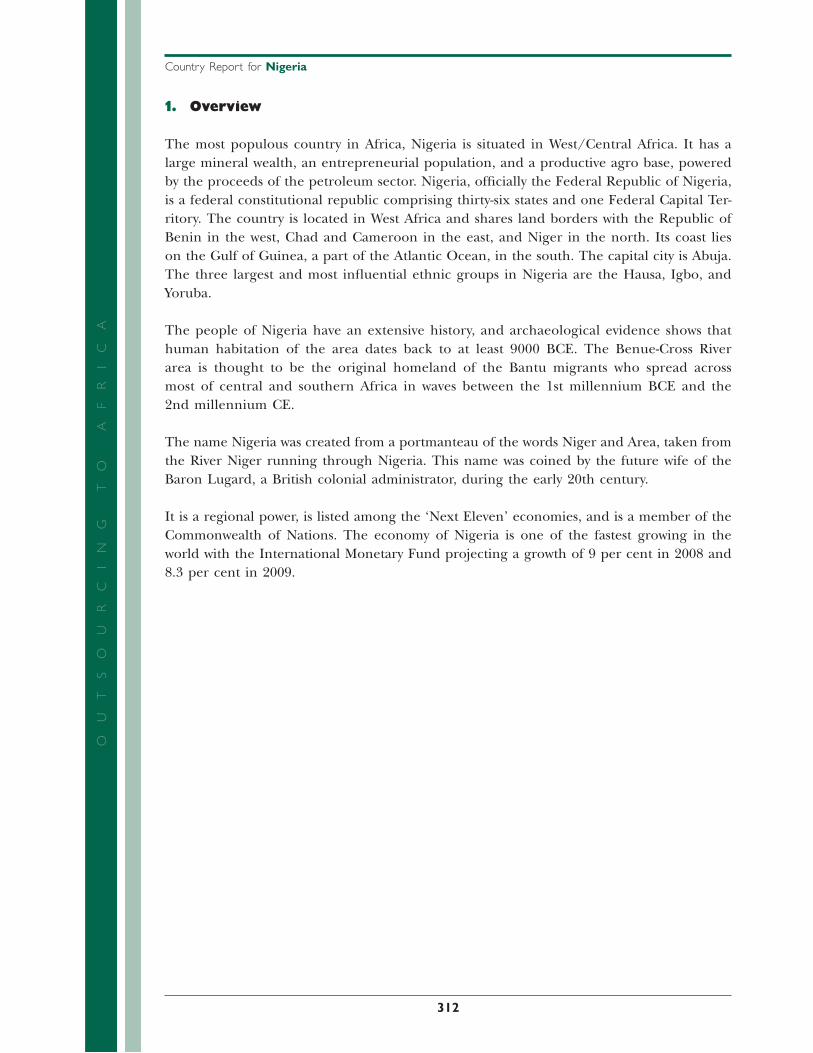
312
Country Report for Nigeria
OU
TS
OU
RC
IN
G
TO
A
FR
IC
A1. Overview
The most populous country in Africa, Nigeria is situated in West/Central Africa. It has a large mineral wealth, an entrepreneurial population, and a productive agro base, powered by the proceeds of the petroleum sector. Nigeria, offi cially the Federal Republic of Nigeria, is a federal constitutional republic comprising thirty-six states and one Federal Capital Ter-ritory. The country is located in West Africa and shares land borders with the Republic of Benin in the west, Chad and Cameroon in the east, and Niger in the north. Its coast lies on the Gulf of Guinea, a part of the Atlantic Ocean, in the south. The capital city is Abuja. The three largest and most infl uential ethnic groups in Nigeria are the Hausa, Igbo, and Yoruba.
The people of Nigeria have an extensive history, and archaeological evidence shows that human habitation of the area dates back to at least 9000 BCE. The Benue-Cross River area is thought to be the original homeland of the Bantu migrants who spread across most of central and southern Africa in waves between the 1st millennium BCE and the 2nd millennium CE.
The name Nigeria was created from a portmanteau of the words Niger and Area, taken from the River Niger running through Nigeria. This name was coined by the future wife of the Baron Lugard, a British colonial administrator, during the early 20th century.
It is a regional power, is listed among the ‘Next Eleven’ economies, and is a member of the Commonwealth of Nations. The economy of Nigeria is one of the fastest growing in the world with the International Monetary Fund projecting a growth of 9 per cent in 2008 and 8.3 per cent in 2009.
15_Africa_Report09_Nigeria.indd 31215_Africa_Report09_Nigeria.indd 312 2/25/09 4:33:25 PM2/25/09 4:33:25 PM

Country Report for Nigeria
313
OU
TS
OU
RC
IN
G
TO
A
FR
IC
A2. Nigeria’s Position in Africa’s Fifteen Countries
Nigeria is in the fi rst position in the yet-to-be-ready band of countries from the outsourcing attractiveness point of view. The following map and table show where Nigeria is positioned among the fi fteen studied countries.
Morocco *
Morocco
Tunisia *
Geographical Coverage and Rank
Tunisia
Egypt *
Egypt
Senegal *
Senegal
GhanaGhana
Nigeria
Nigeria
Uganda
Uganda
Kenya
KenyaTanzania
Tanzania
Zambia
Zambia
Mozambique MozambiqueBotswana
Botswana
Namibia
Namibia
SouthAfrica
South Africa
MauritiusAfrica
*Non-Commonwealth Countries
Mauritius
Contributing scores and ranks are as under.
Overall
Band Score (PS & BE) Rank
Yet to be ready 6.30 First
Infrastructure
Score Rank Band
4.9 13 Yet to be ready
While achieving the thirteenth position in score for ‘Infrastructure’, Nigeria is ninth in elec-tricity availability, fourth in telecommunications and data transfer costs, eleventh in network readiness, twelfth in infrastructure cost, thirteenth in availability and penetration, last in the road/rail network and Air travel, and fourteenth in international Internet bandwidth.
15_Africa_Report09_Nigeria.indd 31315_Africa_Report09_Nigeria.indd 313 2/25/09 4:33:25 PM2/25/09 4:33:25 PM

314
Country Report for Nigeria
OU
TS
OU
RC
IN
G
TO
A
FR
IC
APeople and Skills (PS)
Score Rank
2.879 13
Nigeria is the thirteenth in the case of ‘People and Skills’, being third in quantity, fi fth for quality, twelfth in working satisfaction, and ninth in ICT exposure; it has ranked last in human resource costs and eighth in education, language, and domain skills.
Business Environment (BE)
Score Rank
3.419 4
Nigeria has ranked fourth in this lower level abstraction. In achieving this position it has come ninth in ICT security, Cyber and IPR laws, eighth in share of services in GDP. Nigeria has the highest foreign exchange reserves and is the fi fth in ease and cost of fi nances, fi rst for share in ICT in exports, and eleventh in legislative risk. In the tax rate Nigeria is sixth and in Share of services in exports it has come fourth. Nigeria has come fourteenth and seventh respectively in geo political risk and currency risk.
3. Country, Political, and Economic Profi le
Geography
Area: 923.8 thousand sq km (356,700 sq mi) about the size of California, Nevada, and Arizona.
Cities: Capital—Abuja (pop. estimate 452,000).
Other cities: Kano (9.3 million), Lagos (9.01 million), Ibadan (5 million), and Enugu (500,000).
Terrain: Ranges from southern coastal swamps to tropical forests, open woodlands, grasslands, and semi-desert in the far north. The highest regions are the Jos Plateau 1,200–2,400 metres above sea level and the mountains along the border with Cameroon.
Climate: Annual rainfall ranges from 381 cm along the coast to 64 cm or less in the far north.
People
Nationality: Nigerian(s) (noun and adjective).
Population (2007): 148 million.
Population growth rate (2007): 2.2 per cent.
Total fertility rate (average number of children per woman in 2006): 5.4.
Ethnic groups (250): Hausa-Fulani, Igbo, Yoruba, and Kanuri are the largest.
Religions: Muslim, Christian, and indigenous African.
15_Africa_Report09_Nigeria.indd 31415_Africa_Report09_Nigeria.indd 314 2/25/09 4:33:28 PM2/25/09 4:33:28 PM
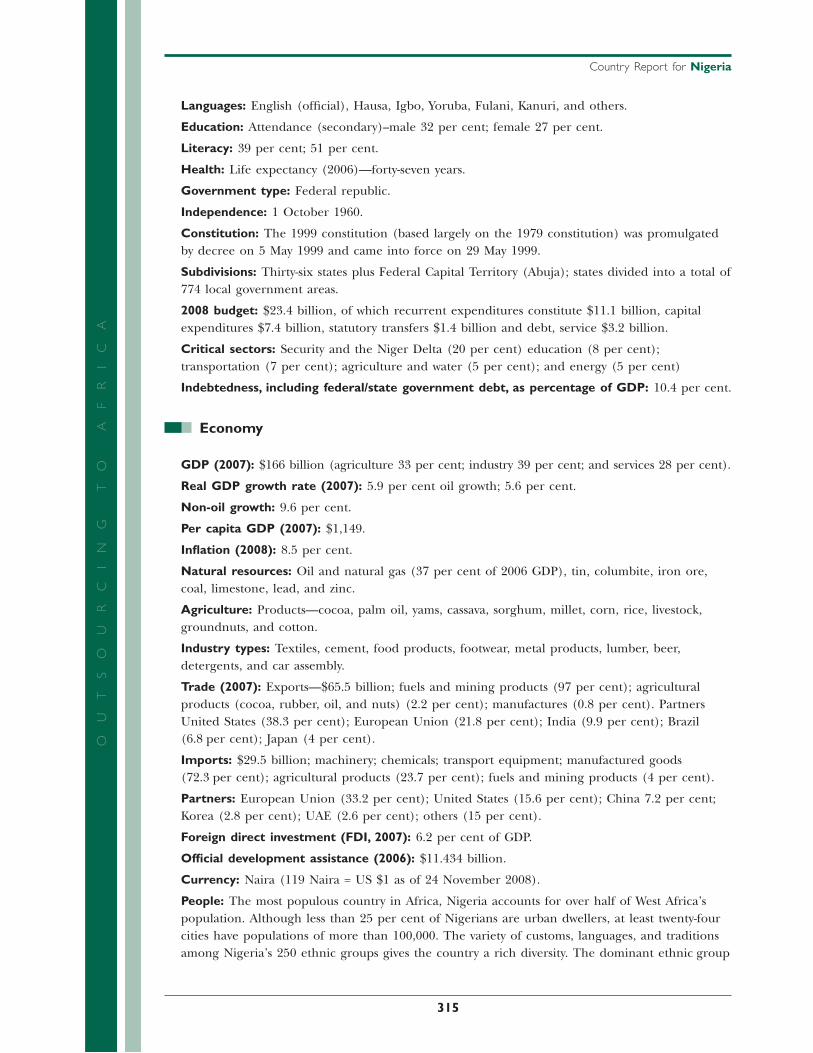
Country Report for Nigeria
315
OU
TS
OU
RC
IN
G
TO
A
FR
IC
ALanguages: English (offi cial), Hausa, Igbo, Yoruba, Fulani, Kanuri, and others.
Education: Attendance (secondary)--male 32 per cent; female 27 per cent.
Literacy: 39 per cent; 51 per cent.
Health: Life expectancy (2006)—forty-seven years.
Government type: Federal republic.
Independence: 1 October 1960.
Constitution: The 1999 constitution (based largely on the 1979 constitution) was promulgated by decree on 5 May 1999 and came into force on 29 May 1999.
Subdivisions: Thirty-six states plus Federal Capital Territory (Abuja); states divided into a total of 774 local government areas.
2008 budget: $23.4 billion, of which recurrent expenditures constitute $11.1 billion, capital expenditures $7.4 billion, statutory transfers $1.4 billion and debt, service $3.2 billion.
Critical sectors: Security and the Niger Delta (20 per cent) education (8 per cent); transportation (7 per cent); agriculture and water (5 per cent); and energy (5 per cent)
Indebtedness, including federal/state government debt, as percentage of GDP: 10.4 per cent.
Economy
GDP (2007): $166 billion (agriculture 33 per cent; industry 39 per cent; and services 28 per cent).
Real GDP growth rate (2007): 5.9 per cent oil growth; 5.6 per cent.
Non-oil growth: 9.6 per cent.
Per capita GDP (2007): $1,149.
Infl ation (2008): 8.5 per cent.
Natural resources: Oil and natural gas (37 per cent of 2006 GDP), tin, columbite, iron ore, coal, limestone, lead, and zinc.
Agriculture: Products—cocoa, palm oil, yams, cassava, sorghum, millet, corn, rice, livestock, groundnuts, and cotton.
Industry types: Textiles, cement, food products, footwear, metal products, lumber, beer, detergents, and car assembly.
Trade (2007): Exports—$65.5 billion; fuels and mining products (97 per cent); agricultural products (cocoa, rubber, oil, and nuts) (2.2 per cent); manufactures (0.8 per cent). Partners United States (38.3 per cent); European Union (21.8 per cent); India (9.9 per cent); Brazil (6.8 per cent); Japan (4 per cent).
Imports: $29.5 billion; machinery; chemicals; transport equipment; manufactured goods (72.3 per cent); agricultural products (23.7 per cent); fuels and mining products (4 per cent).
Partners: European Union (33.2 per cent); United States (15.6 per cent); China 7.2 per cent; Korea (2.8 per cent); UAE (2.6 per cent); others (15 per cent).
Foreign direct investment (FDI, 2007): 6.2 per cent of GDP.
Offi cial development assistance (2006): $11.434 billion.
Currency: Naira (119 Naira = US $1 as of 24 November 2008).
People: The most populous country in Africa, Nigeria accounts for over half of West Africa’s population. Although less than 25 per cent of Nigerians are urban dwellers, at least twenty-four cities have populations of more than 100,000. The variety of customs, languages, and traditions among Nigeria’s 250 ethnic groups gives the country a rich diversity. The dominant ethnic group
15_Africa_Report09_Nigeria.indd 31515_Africa_Report09_Nigeria.indd 315 2/25/09 4:33:28 PM2/25/09 4:33:28 PM
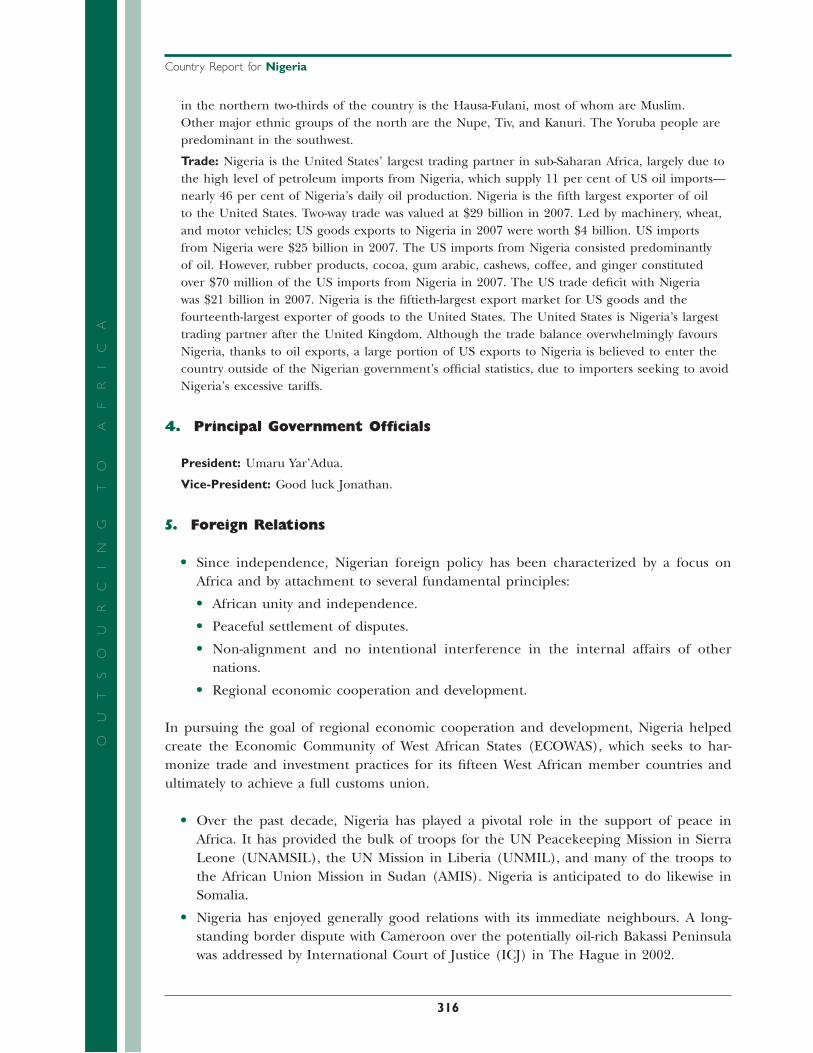
316
Country Report for Nigeria
OU
TS
OU
RC
IN
G
TO
A
FR
IC
Ain the northern two-thirds of the country is the Hausa-Fulani, most of whom are Muslim. Other major ethnic groups of the north are the Nupe, Tiv, and Kanuri. The Yoruba people are predominant in the southwest.
Trade: Nigeria is the United States’ largest trading partner in sub-Saharan Africa, largely due to the high level of petroleum imports from Nigeria, which supply 11 per cent of US oil imports—nearly 46 per cent of Nigeria’s daily oil production. Nigeria is the fi fth largest exporter of oil to the United States. Two-way trade was valued at $29 billion in 2007. Led by machinery, wheat, and motor vehicles; US goods exports to Nigeria in 2007 were worth $4 billion. US imports from Nigeria were $25 billion in 2007. The US imports from Nigeria consisted predominantly of oil. However, rubber products, cocoa, gum arabic, cashews, coffee, and ginger constituted over $70 million of the US imports from Nigeria in 2007. The US trade defi cit with Nigeria was $21 billion in 2007. Nigeria is the fi ftieth-largest export market for US goods and the fourteenth-largest exporter of goods to the United States. The United States is Nigeria’s largest trading partner after the United Kingdom. Although the trade balance overwhelmingly favours Nigeria, thanks to oil exports, a large portion of US exports to Nigeria is believed to enter the country outside of the Nigerian government’s offi cial statistics, due to importers seeking to avoid Nigeria’s excessive tariffs.
4. Principal Government Offi cials
President: Umaru Yar’Adua.
Vice-President: Good luck Jonathan.
5. Foreign Relations
Since independence, Nigerian foreign policy has been characterized by a focus on Africa and by attachment to several fundamental principles:
African unity and independence.
Peaceful settlement of disputes.
Non-alignment and no intentional interference in the internal affairs of other nations.
Regional economic cooperation and development.
In pursuing the goal of regional economic cooperation and development, Nigeria helped create the Economic Community of West African States (ECOWAS), which seeks to har-monize trade and investment practices for its fi fteen West African member countries and ultimately to achieve a full customs union.
Over the past decade, Nigeria has played a pivotal role in the support of peace in Africa. It has provided the bulk of troops for the UN Peacekeeping Mission in Sierra Leone (UNAMSIL), the UN Mission in Liberia (UNMIL), and many of the troops to the African Union Mission in Sudan (AMIS). Nigeria is anticipated to do likewise in Somalia.
Nigeria has enjoyed generally good relations with its immediate neighbours. A long-standing border dispute with Cameroon over the potentially oil-rich Bakassi Peninsula was addressed by International Court of Justice (ICJ) in The Hague in 2002.
•
•
•
•
•
•
•
15_Africa_Report09_Nigeria.indd 31615_Africa_Report09_Nigeria.indd 316 2/25/09 4:33:28 PM2/25/09 4:33:28 PM

Country Report for Nigeria
317
OU
TS
OU
RC
IN
G
TO
A
FR
IC
AThe ICJ awarded most of the disputed Bakassi Peninsula and maritime rights to Cameroon, and the UN established a Mixed Commission on implementing the ICJ ruling. On 12 June 2006 Nigerian President Obasanjo and Cameroonian President Biya signed an agreement in New York on implementing the ICJ decision. Nigeria promptly withdrew its troops within sixty days. On 14 August 2008, Nigeria formally ceded Bakassi to Cameroon.
Nigeria is a member of the following international organizations:
UN and many of its special and related agencies.
World Trade Organization (WTO).
International Monetary Fund (IMF).
World Bank/IBRD.
African Development Bank (AfDB).
INTERPOL.
Organization of Petroleum Exporting Countries (OPEC).
Economic Community of West African States (ECOWAS).
African Union (AU).
Maritime Organization of West and Central Africa (MOWCA) and several other West African bodies.
Commonwealth.
Nonaligned Movement (NAM).
Organization of the Islamic Conference (OIC) among others.
6. Living, Security, and Safety Perceptions
It is reported at many places that safety is a challenge in Nigeria.
Crime committed by individual criminals and gangs, as well as by some persons wearing police and military uniforms, is a problem, especially in Lagos, Abuja, and other large cities, although it can occur anywhere.
Some visitors and residents have experienced armed muggings, assaults, burglary, carjacking, kidnappings, and extortion, often involving violence.
Home invasions are on the rise in Lagos, with armed robbers accessing even guarded compounds by following, or tailgating, residents or visitors arriving by car into the compound, subduing guards, and gaining entry into homes or apartments.
Nigerian-operated fraud scams target foreigners worldwide, posing risks of both fi nan-cial loss and personal danger to their victims.
•
•
•
•
•
•
•
•
•
•
•
•
•
•
•
•
•
•
•
15_Africa_Report09_Nigeria.indd 31715_Africa_Report09_Nigeria.indd 317 2/25/09 4:33:28 PM2/25/09 4:33:28 PM
318
Country Report for Nigeria
OU
TS
OU
RC
IN
G
TO
A
FR
IC
A7. ICT Policy, Infrastructure, and Service
ICT Policies
Nigeria started implementing its ICT policy in April 2001 after the Federal Executive Council approved it by establishing the National Information Technology Development Agency (NITDA), the implementing body. The policy empowers NITDA to enter into strategic alli-ances and joint ventures and to collaborate with the private sector to realise the specifi cs of the country’s vision of making Nigeria an IT-capable country in Africa and a key player in the information society by the year 2005 through using IT as an engine for sustainable development and global competitiveness. This vision is yet to be fulfi lled.
In this light, the government set up the Nigerian National ICT for Development (ICT4D) Strategic Action Plan committee to develop a new ICT policy for development as the ICT action plan/roadmap for the nation.
These are some of the bodies aim at improving IT in Nigeria:
Nigeria Computer Society (NCS).
Computer Professionals Registration Council of Nigeria (CPN).
IT Industry Association of Nigeria (ITAN).
Outlined below are some of the objectives of Nigeria’s ICT policy:
To ensure that ICT resources are readily available to promote effi cient national development.
To guarantee that the country benefi ts maximally and contributes meaningfully by providing the global solutions to the challenges of the Information Age.
To empower Nigerians to participate in software and ICT development.
To encourage local production and manufacture of ICT components in a competitive manner.
To establish and develop ICT infrastructure and maximise its use nationwide.
To empower the youth with ICT skills and prepare them for global competitiveness.
To integrate ICT into the mainstream of education and training.
To create ICT awareness and ensure universal access in promoting ICT diffusion in all sectors of national life.
To create an enabling environment and facilitate private sector (national and multina-tional) investment in the ICT sector.
To encourage government and private sector joint venture collaboration.
To develop human capital with emphasis on creating and supporting a knowledge-based society.
To build a mass pool of ICT literate manpower using the NYSC, NDE, and other platforms as a train-the-trainer scheme for capacity building.
•
•
•
•
•
•
•
•
•
•
•
•
•
•
•
15_Africa_Report09_Nigeria.indd 31815_Africa_Report09_Nigeria.indd 318 2/25/09 4:33:28 PM2/25/09 4:33:28 PM
Country Report for Nigeria
319
OU
TS
OU
RC
IN
G
TO
A
FR
IC
ATelecommunications
Nigeria’s telecommunications policy was briefl y stated by its Minister for Communication, Mr Frank Nweke Jr during his address at the fourth World Telecommunications Develop-ment Conference in Doha on 8 March 2006. Policy implementation which was initiated as part of the current government’s public sector reform agenda was launched in 2000 and focuses on the following:
Deregulating, liberalising, and privatising the telecommunications industry.
Providing incentives to telecom investors and operators to facilitate their entry into the Nigerian telecom market by waiving tax and import duties.
Promoting and providing access to telecommunications facilities and services at reduced cost while increasing penetration Consequently the Nigeria Telecommunications Act was passed by the National Assembly to give autonomy to the Nigeria Communications Commission (NCC) as the telecommunications regulator responsible for the implemen-tation of the policy.
The government has also introduced converged licensing for ISPs for the benefi t of the disadvantaged communities and rural populations. Bulk bandwidth purchasing by the Nigeria ISPs association (NISPA) is currently at 100 naira per hour for broadband Internet access, which is less than USD$ 1 at the going exchange rate.
Infrastructure: Telecommunication
Presently the two national carriers, Nigeria Telecommunications Company (Nitel) and Global com are both private entities. Nitel was publically owned until late 2006 when it was privatised.
There are four digital mobile (GSM) operators, and twenty other operators have been licensed to provide fi xed wireless services at national and regional levels.
All six geopolitical zones have Internet access, and efforts are being pursued to increase penetration. In 2000 the penetration rate was one in 100 persons; by 2006 the ratio improved to 14.5 in 100.5.
Nigeria is a member of the consortium that runs the SAT-3 submarine fi bre optic cable.
The country launched its fi rst communications satellite NlGCOMSAT-1 on 13 May 2007 to provide telecommunications coverage, navigation, television distribution, direct broadcast-ing system (DBS), digital broadband, etc. Nigeria intends to use NIGCOMSAT-1 to create 150,000 jobs, save the country hundreds of millions of dollars a year, provide Internet access to remote rural areas, and to specifi cally help tele-education (educational televi-sion and e-learning) for the distance-learning initiative.
An agreement has also been signed with Patriot Inc (USA) to invest in VSAT manu-facturing within Nigeria as a means to reduce the cost of antenna/VSAT on the local market.
Investment in the telecommunications sector exceeded US$ 8 billion in 2006 from the low of US$ 500 million in 2000. MTN, the leading GSM operator, has nearly completed building a 3,500 kilometre, ultra modern nationwide fi bre optic transmission network
•
•
•
•
•
•
•
•
•
•
•
15_Africa_Report09_Nigeria.indd 31915_Africa_Report09_Nigeria.indd 319 2/25/09 4:33:29 PM2/25/09 4:33:29 PM

320
Country Report for Nigeria
OU
TS
OU
RC
IN
G
TO
A
FR
IC
Awhich will help accelerate ICT projects and values in the economy. MTN’s extensive transmission infrastructure provides access to approximately 60 per cent of Nigerians. Other private operators are engaged in similar initiatives and projects in the country.
Electrifi cation
The nation generates 3,500 megawatts of electricity against a required minimum of 5,500 megawatts. About 40 per cent of Nigerians enjoy electricity from the national grid. However, electric power supply is sporadic and several communities in urban areas lack electric power. To date, 57 of the 774 local government headquarters are yet to be connected to the grid.
The government increased the number and accelerated the development of power generation facilities nationwide after the return to democracy. Rural communities are worse off because of the absence of infrastructure. In pursuit of the vision to improve access to electric power, most especially by rural dwellers, the government signed into law the Nigerian Electric Power Sector Reform Act (EPSRA) which established the Nigerian Electricity Regulatory Commission (NERC) and the Rural Electrifi cation Agency (REA). The REA is responsible for implementing the rural electrifi cation fund, regulating rural electrifi cation functions not covered by the NERC, and promoting rural electrifi cation.
Physical Infrastructure
Offi ce market: The Lagos offi ce market is today mainly centred on Victoria Island and Lekki although historically Lagos Island used to be regarded as the prime location. Very little good accommodation exists, and as a result there is a two tier market where the payers of US dollar rents can demand higher specifi cations and better quality services. The Abuja offi ce market benefi ts from a number of recently completed high-rise build-ings, though due to limited demand there has been little growth in offi ce rents.
Retail market: Retail activity has historically been based around street hawkers utilis-ing traffi c congestion as a means to assist the negotiation process. However, the Palms Shopping Centre located on Lekki Peninsula has now been completed and represents a real step forward in creating a modern leisure and retailing experience. Further developments are planned in Lagos, Abuja, and Port Harcourt.
Industrial market: The manufacturing base of Nigeria is virtually non-existent, and as a consequence there is a high vacancy rate. The growing number of imported items coming into the country, particularly from China and other Asian countries, has created the need for substantial port facilities, but with the ports in constant use there is a bottleneck in distribution which affects virtually the entire country.
Residential market: In locations such as Ikoyi, Victoria Island, and Lekki, demand currently outstrips supply for good quality housing benefi ting from an uninterrupted supply of water and electricity. Access to residential accommodation via a poorly main-tained road network ensures that traffi c congestion and uncertain security issues are problems confronted by residents on a daily basis. Well-maintained units will continue to attract strong demand and good rental growth prospects.
•
•
•
•
•
•
15_Africa_Report09_Nigeria.indd 32015_Africa_Report09_Nigeria.indd 320 2/25/09 4:33:29 PM2/25/09 4:33:29 PM

Country Report for Nigeria
321
OU
TS
OU
RC
IN
G
TO
A
FR
IC
APrime rents Prime yields
Offi ces US$ 27 per sq m per month 9%
Retail US$ 36 per sq m per month 8%
Industrial US$ 2 per sq m per month 14%
Residential US$ 6,000 per month* 6%
*Four bedroom executive house--prime location(Source: Knight Frank LLP)
8. ICT and BPO Industry Environment
The ICT Environment as reported by the World Bank Study.
Number per 100 poeple
ICT Access Indicators, 2000–2006
30
20
10
02000 2001 2002 2003 2004 2005 2006
Fixed + mobile subscribersInternet usersPCs
US$ per 3 minutes
Price of Call to the United States, 2000–2005
6
8
4
2
02000 2001 2002 2003 2004 2005
Nigeria sub-Saharan Africa Region
15_Africa_Report09_Nigeria.indd 32115_Africa_Report09_Nigeria.indd 321 2/25/09 4:33:29 PM2/25/09 4:33:29 PM

322
Country Report for Nigeria
OU
TS
OU
RC
IN
G
TO
A
FR
IC
A
Percentage of GDP
Telecommunications Revenue, 2000–2006
6
4
2
02000 2001 2002 2003 2004 2005 2006
Nigeria sub-Saharan Africa Region
On the state of the outsourcing and BPO industry there are reports of shared services or in-house outsourcing. There have been strong presentations on this at many inter-national workshops in shared services. These presentations show a defi nite capability and capacity.
On the question of Nigeria attracting outsource operations from other countries policy statements, conferences, and announcements have been found. Defi nite fi gures of such operations in Nigeria could not be located easily.
On the other hand the fi gures available from the World Bank's World Development Indicators data base (WDI) show that Nigeria is topping the score for ICT exports as a share of service exports from the country. This could be an important discussion point with our delegates from Nigeria.
9. Human Resource Effi ciency and Cost
Though Nigeria has ranked thirteenth in ‘People and Skills’, it has scored third in quantity and fi fth in quality of human resources. Further Nigeria topping the score in share of ICT in service exports shows a strong human resource base.
10. Legal and Enforcement Issues
Nigeria is in the last fi ve position as far as legislative issues are concerned and ninth in terms of ICT security and enforcement of IPR and Cyber Laws. The Nigerian national Outsourcing Policy of 2007 recognises these limitations and states:
Required legislation: To foster the development of a virile outsourcing sector, appropri-ate legislative framework will be put in place. The proper implementation of this policy is predicated on the enactment of the National Information Technology Development Agency (NITDA) Bill which addresses the development of Business Process Outsourcing in Nigeria amongst other things.
•
•
•
•
•
15_Africa_Report09_Nigeria.indd 32215_Africa_Report09_Nigeria.indd 322 2/25/09 4:33:39 PM2/25/09 4:33:39 PM

Country Report for Nigeria
323
OU
TS
OU
RC
IN
G
TO
A
FR
IC
ASelf-regulation: One method for minimizing dispute is through self-regulation. Government will encourage the establishment of an IT-enabled outsourcing trade asso-ciation such as a National Outsourcing Association and a public private partnership to establish a voluntary quality program, which ITES providers can join in order to demonstrate that they satisfy the level of service expected within the industry.
A brief survey of literature has not been able to show the current position. Perhaps the summit could be a platform to project the progress made by Nigeria.
11. Labour and Expatriate Worker's Permits
The Government of Nigeria has well-defi ned policies for residence and work permits to be issued to investors and expatriate workers. The basic principle is that should a qualifi ed Nigerian citizen be available one need not employ an expatriate.
The application process including payment of fees is now possible on-line http://nigeria.visahq.com.
12. Revenue, Tax, and Repatriation Issues
The GON abolished the dual exchange rate in the 1999 budget. Private companies and individuals now may obtain forex in the autonomous market. They are permitted to keep domiciliary accounts in private banks, and account holders have unrestricted use of their funds. All individuals, organizations, and enterprises must source their foreign exchange needs from the Autonomous Foreign Exchange Market (AFEM). All applications for foreign exchange must be channelled through selected banks to the Central Bank of Nigeria (CBN).
Repatriated non-oil export proceeds and other infl ows except interbank foreign exchange deals (IFEM), must be held in Domiciliary Accounts maintained with author-ized banks in Nigeria. Two types of Domiciliary Accounts exist:
Non-oil Exports.
Ordinary Domiciliary Accounts.
Holders of Domiciliary Accounts are allowed access to them and can withdraw funds at the autonomous exchange rate, with 3 per cent interest paid on the account. Domiciliary account holders receive funds in convertible currencies only if they wish to transfer money abroad.
Import taxes ranging from 5–60 per cent are levied on imported goods. A special duty may be imposed on imported goods if the government feels that such goods are being dumped or unfairly subsidized, thus threatening established or potential domestic industries.
•
•
•
•
•
•
15_Africa_Report09_Nigeria.indd 32315_Africa_Report09_Nigeria.indd 323 2/25/09 4:33:43 PM2/25/09 4:33:43 PM
324
Country Report for Nigeria
OU
TS
OU
RC
IN
G
TO
A
FR
IC
ALocal fi nancing can be obtained through any of the commercial, merchant, industrial banks insurance companies, building and property development companies, and pension.
13. Investment Policy and Incentives
Investment Climate
After fi fteen years of unbroken military dictatorship the current return to democracy is seen as an opportunity to reopen what could be our major market in sub-Saharan Africa.
The new administration is making a strong effort to correct the nation’s infrastructure degradation, diversify the economy, and create a more business friendly environment. The new government of President Obasanjo has taken several steps to improve the economic performance and image of the country.
Following his inauguration on 29 May he has set up panels to investigate the status of government contracts and corruption. The government is receiving major support, both moral and fi nancial, from the world’s democracies. This support is intended to ensure Nigeria has every opportunity to overcome its historical disadvantages.
GDP grew by about 4 per cent in real terms in 1998, compared with a 3.8 per cent rise in 1997.
Offi cial fi gures showed infl ation up from 8.5 per cent in 1997 to 10 per cent for 1998 and an estimated 12–15 per cent through June 1999.
The Nigerian government has put in place a number of investment incentives for the stimulation of private sector investment from within and outside the country. While some of these incentives cover all sectors, other are limited to some specifi c sectors. The nature and application of these incentives have been considerably simplifi ed. The details of what will be applicable to an export-oriented outsourcing operation would have to be worked out from the investment agencies web-site: http://www.nipc.gov.ng
14. Government Agencies Giving Support to Outsourcing
The Presidency
Nigerian Investment Promotion Commission
Plot 1181 Aguiyi Ironsi Street
Maitama District
P.M.B. 381 Garki Abuja
Nigeria.
Tel: (+234) 9-4134317, (+234) 9-4134373, (+234) 9-4134112, (+234) 9-4131403; Fax: (+234) 9-4134112
E-mail: [email protected], [email protected], [email protected], [email protected] (website support)
•
•
•
•
•
•
15_Africa_Report09_Nigeria.indd 32415_Africa_Report09_Nigeria.indd 324 2/25/09 4:33:44 PM2/25/09 4:33:44 PM

Country Report for Nigeria
325
OU
TS
OU
RC
IN
G
TO
A
FR
IC
A
National IT Development Agency (Nigeria)
28 Port-Harcourt Crescent
Off Gimbiya Street Area 11
Garki Abuja, Nigeria
Tel: (+234) 9-3142925; Fax: (+234) 9-3142924
E-mail: [email protected]
15. Overall Assessment and Recommendations
Nigeria is strong in ICT and has an outsourcing policy in place. If not already done, there is a need to review the present state, with the promises made to the world community in the policy, and share it with the potential outsourcing players.
16. Contact Details
The Presidency
Nigerian Investment Promotion Commission
Plot 1181 Aguiyi Ironsi Street
Maitama District
P.M.B. 381 Garki Abuja
Nigeria
Tel: (+234) 9-4134317, (+234) 9-4134373, (+234) 9-4134112, (+234) 9-4131403; Fax: (+234) 9-4134112
E-mail: [email protected], [email protected], [email protected], [email protected] (website support)
National IT Development Agency (Nigeria)
28 Port-Harcourt Crescent
Off Gimbiya Street Area 11
Garki Abuja
Nigeria
Tel: (+234) 9-3142925; Fax: (+234) 9-3142924
E-mail: [email protected]
15_Africa_Report09_Nigeria.indd 32515_Africa_Report09_Nigeria.indd 325 2/25/09 4:33:44 PM2/25/09 4:33:44 PM

326
Country Report for Nigeria
OU
TS
OU
RC
IN
G
TO
A
FR
IC
AEmbassy of Nigeria in China, France, Germany, India, UK, USA
Nigerian Consulate in London
Nigeria High Commission in London United Kingdom
No 9 Northumberland Avenue
London. WC2N 5BX
(Near Trafalgar Square)
London
Tel: 0207-839-1244
E-mail: [email protected]
Website: http://www.nigeriahc.org.uk
Nigerian Embassy in Washington DC
Embassy of the Federal Republic of Nigeria in United States
3519 International Court, NW
Washington DC 20008
Washington DC
Tel: (+202) 986-8400; Fax: (+202) 362-6541
Website: http://www.nigeriaembassyusa.org/
Useful Links
The World Factbook 2007.
https://www.cia.gov/library/publications/the-world-factbook/geos/ni.html
World Development Indicators 2007, April 2007, The World Bank.
http://siteresources.worldbank.org/DATASTATISTICS/Resources/reg_w di.pdf
Census fi gure given by the National Population Census offi ce of Nigeria.
Educational statistics, UNESCO.
http://www.unesco.org.
Policy Statement By Chief Cornelius O. Adebayo Minister of Communication, Federal Republic of Nigeria, 8 March 2006, The International Telecommunications Union.
http://www.itu.int/newsroom/wtdc/2006/policy_statements/nigeria.html
Address By The Honourable Minister Of Power And Steel, Senator Liyel Imoke At The Inauguration Of The Board Of The Rural Electrifi cation Agency (Rea) On Thursday 16 March 2006 At Nicon Hilton Hotel Abuja, Ministry of Power and Steel of Nigeria.
http://www.fmps.gov.ng/news/news_rea.htm
Nigerian National Policy for Information Technology (IT), National Information Technology Development Agency.
http://www.nitda.gov.ng/document/nigeriaitpolicy.pdf
15_Africa_Report09_Nigeria.indd 32615_Africa_Report09_Nigeria.indd 326 2/25/09 4:33:44 PM2/25/09 4:33:44 PM

Country Report for Nigeria
327
OU
TS
OU
RC
IN
G
TO
A
FR
IC
APolicy Statement By Chief Cornelius O. Adebayo Minister of Communication, Federal Republic of Nigeria, 8 March 2006, The International Telecommunications Union.
http://www.itu.int/newsroom/wtdc/2006/policy_statements/nigeria.html
SchoolNet Nigeria, SchoolNet Africa.
http://schoolnetafrica.net/443.0.html
Okhiria, P. The Vanguard. 8 February 2007; Daily Champion. 7 February 2007.
Ibid.
Nom, Terhemba. AMBE-UVA, Interactivity in Distance Education, The NOUN Experience. Turkish Online Journal of Distance Education. July 2006, Vol 7, No. 4, Article 9.
Abayuwana, O. The Guardian. 1 November 2004.
Taiwo, J. This Day. 15 November 2004.
“Spammers Beware: Nigeria and Microsoft team up to fi ght cybercrime.” London, 14 October 2005, EMEA Press Centre.
15_Africa_Report09_Nigeria.indd 32715_Africa_Report09_Nigeria.indd 327 2/25/09 4:33:44 PM2/25/09 4:33:44 PM

15_Africa_Report09_Nigeria.indd 32815_Africa_Report09_Nigeria.indd 328 2/25/09 4:33:44 PM2/25/09 4:33:44 PM

329
OU
TS
OU
RC
IN
G
TO
A
FR
IC
A
Country Report for Tanzania
Disclaimer
This short Country Report, a result of a larger Survey of ICT Outsourcing in Africa, provides a general overview of current activities and issues related to ICT Outsourcing in the country. The data presented here should be regarded as illustrative rather than exhaustive. ICT Outsourcing is at a particularly dynamic stage in Africa with new developments and announcements happening on a daily basis somewhere or the other on the continent. Therefore, these reports should be seen as ‘snapshots’ that were current at the time they were taken; it is expected that certain facts and fi gures presented may become outdated very quickly.
The fi ndings, interpretations, and conclusions expressed herein are a faithful representation of the respond-ents of the interviews and secondary data collected from the countries and published literature. Strict analysis has been carried out with the minimal infl uence of the authors/team members. References to data sources have been made as far as possible. In the case of the detailed data parameters used for scores and ranking, the same data source and timeline has been used for all the fi fteen countries compared. In the descriptive section of the Country Reports, all data received from the individual country has been used in order to give as complete an assessment as possible. Thus those countries that have provided more information have a better coverage than those who have not been able to provide data to the research team.
Board of Executive Directors of CBC or Cyber Media cannot guarantee the accuracy of the data included in this work. The boundaries, colours, denominations, and other information shown on any map in this work do not imply on the part of CBC and Cyber Media any judgement of the legal status of any territory or the endorsement or acceptance of such boundaries.
It is expected that individual Country Reports from the Survey of ICT Outsourcing in Africa will be updated in an iterative process over time, based on additional research and feedback received through CBC and Cyber Media website.
5
0
10
403530
10
5
0 30 35 400 100 200 km
0 100 200 mi
KENYABukoda
Musoma
Mwanza
RWANDA
BURUNDI
DEM. REP. OF THE
CONGO
MALAWI
MafiaIsland
Zanzibar
Pambe
Lake Victoria
Lake Tanganyika
Lake Nyasa
MountKilimanjaro
Kigoma
Iringa
Arusha
Tabora
Dodoma
SumbawangaMbeya
Songea
LindiMtwara
KilwaMasoko
MkoaniZanzibar
DAR ESSALAAM
Wete TangaPangani
UGANDA
ZAMBIA
MOZAMBIQUE
Rufiji
16_Africa_Report09_Tanzania.indd329 32916_Africa_Report09_Tanzania.indd329 329 2/25/09 4:36:26 PM2/25/09 4:36:26 PM

330
Country Report for Tanzania
OU
TS
OU
RC
IN
G
TO
A
FR
IC
A1. Overview
The United republic of Tanzania includes Tanzania (formerly Tanganyika) on the African mainland and the islands of Zanzibar, Pemba, and Mafi a in the Indian Ocean. There are about 120 identifi able ethnic groups; the largest, the Sukuma, are about one-tenth of the population. Although most of Tanzania consists of plains and plateaus, it has some spec-tacular relief features, including Kilimanjaro and Ol Doinyo Lengai, an active volcano. All or portions of Lakes Nyasa, Tanganyika, Victoria, and Rukwa lie within Tanzania, as do the headwaters of the Nile, Congo, and Zambezi rivers. Serengeti National Park is the most famous of its extensive game reserves. Important mineral deposits include gold, diamonds, gemstones, coal, and natural gas. The centrally planned economy is based largely on agri-culture; major crops include corn, rice, coffee, cloves, cotton, sisal, cashews, and tobacco. Industries include food processing, textiles, cement, and brewing. Tanzania is a republic with one legislative house; its head of state and government is the president. Inhabited from fi rst millennium BC, it was occupied by Arab and Indian traders and Bantu-speaking people by tenth century AD. The Portuguese gained control of the coastline in late fi fteenth century, but they were driven out by the Arabs of Oman and Zanzibar in late eighteenth century. German colonists entered the area in the 1880s, and in 1891 the Germans declared the region a protectorate as a part of German East Africa. During World War I, Britain captured the German holdings, which became a British mandate (1920) under the name Tanganyika. Britain retained control of the region after World War II when it became a UN trust ter-ritory. Tanganyika gained independence in 1961 and became a republic in 1962. In 1964 it united with Zanzibar under the name Tanzania and was led by President Julius Nyerere until 1985. The country subsequently experienced both political and economic struggles; it held its fi rst multi-party elections in 1995.
16_Africa_Report09_Tanzania.indd330 33016_Africa_Report09_Tanzania.indd330 330 2/25/09 4:36:27 PM2/25/09 4:36:27 PM

Country Report for Tanzania
331
OU
TS
OU
RC
IN
G
TO
A
FR
IC
A2. Tanzania’s Position in Africa’s Fifteen Countries
Tanzania is the second in the yet to be ready band of countries from the outsourcing attrac-tiveness point of view. The map and table below show where Tanzania is positioned.
Morocco *
Morocco
Tunisia *
Geographical Coverage and Rank
Tunisia
Egypt *
Egypt
Senegal *
Senegal
GhanaGhana
Nigeria
Nigeria
Uganda
Uganda
Kenya
KenyaTanzania
Tanzania
Zambia
Zambia
Mozambique MozambiqueBotswana
Botswana
Namibia
Namibia
SouthAfrica
South Africa
MauritiusAfrica
*Non-Commonwealth Countries
Mauritius
Contributing scores and ranks are as under.
Overall
Band Score (PS & BE) Rank in Band
Yet to be ready 5.68 2
Infrastructure
Score Rank Band
3.7 15 Yet to be ready
While achieving the last position Tanzania has scored in the last fi ve ranks for seven out of nine parameters that go towards this lower level abstraction. In the other two parameters that is the cost of space and facilities and costs of travel and stay, Tanzania ranks tenth and eighth, respectively, out of fi fteen.
16_Africa_Report09_Tanzania.indd331 33116_Africa_Report09_Tanzania.indd331 331 2/25/09 4:36:27 PM2/25/09 4:36:27 PM

332
Country Report for Tanzania
OU
TS
OU
RC
IN
G
TO
A
FR
IC
APeople and Skills (PS)
Score Rank
2.948 10
In the case of ‘People and Skills’, Tanzania comes tenth and has come third in the cost of human resources, but has fallen to eleventh, twelfth, and thirteenth positions, respectively in education, language and domain, skills, cost of living, quality, and working satisfaction.
Business Environment (BE)
Score Rank
2.735 13
In this lower level abstraction, Tanzania is thirteenth. In achieving this position it is last in the share of ICT in exports and in the last fi ve positions for ICT security, share of services in GDP, share of services in exports, and ease and cost of fi nance.
3. Country, Political, and Economic Profi le
Tanzania has an estimated population of 37.5 million, 43.7 per cent of which is under 15 years. The country is ranked 162nd out of 177 countries in the UNDP Human Develop-ment Index. The economy depends heavily on agriculture, which accounts for almost half of GDP, provides 85 per cent of exports, and employs 80 per cent of the workforce.
Salient features are as follows:
Area: mainland—945,000 sq km (378,000 sq mi), slightly smaller than New Mexico and Texas combined; Zanzibar—1,658 sq km (640 sq mi).
Cities: capital—Dar es Salaam (executive), Dodoma (legislative), major metropolises—Arusha, Mwanza, Mbeya, Mtwara, Stonetown in Zanzibar.
Terrain: Varied.
Climate: Varies from tropical to arid to temperate.
Population: Mainland—37.5 million; Zanzibar—1 million (estimate).
Education: Attendance—73.2 per cent mainland (primary); 71.4 per cent Zanzibar.
Literacy: Females 67 per cent mainland; 76.8 per cent Zanzibar.
Literacy: Males 79.9 per cent Mainland; 86 per cent Zanzibar.
16_Africa_Report09_Tanzania.indd332 33216_Africa_Report09_Tanzania.indd332 332 2/25/09 4:36:29 PM2/25/09 4:36:29 PM

Country Report for Tanzania
333
OU
TS
OU
RC
IN
G
TO
A
FR
IC
AGovernment Type: Parliamentary Democracy
Independence: Tanganyika 1961, Zanzibar 1963. Union formed in April 1964.
Branches: President (chief of state and commander in chief), vice president, and prime minister.
Legislative: Unicameral National Assembly (for the Union), House of Representatives (for Zanzibar only).
Economy
On the economic front, Tanzania has experienced sound macroeconomic performance. Infl ation is contained where it is below 5 per cent today and has been this way for the last fi ve years declining from 30 per cent in 1994. The economic growth has been stellar in the recent years as well. In the last decade, the average growth rate of real GDP has been above 5 per cent. It was 6.8 per cent in 2005 and poised to be above 6 per cent in 2006.
Low infl ation rate coupled with healthy pace of economic growth has provided a stable and predictable environment for companies to invest and do business in Tanzania. In addition, the Tanzanian shilling is steadily making it functional to price your cash fl ows in shillings and still be able to convert profi tably to a foreign currency of your choice.
GDP (2007): $12.1 billion. (UNDP BHDR 2008) (shown as $29.25 billion in an INFO Dev report 2006).
Per capita GDP (2007): $316.
Industry: textiles, agro-processing, light manufacturing, construction, steel, aluminium, paints, cement, cooking oil, beer, mineral water and soft drinks.
Trade—$2.22 billion (merchandise exports, 2007): coffee, cotton, tea, sisal, cashew nuts, tobacco, cut fl owers, seaweed, cloves, fi sh and fi sh products, minerals (diamonds, gold, and gemstones), manufactured goods, horticultural products; services (tourism services, communication, construction, insurance, fi nancial, computer, information, government, royalties, personal and other businesses).
Major markets: UK, Germany, India, Japan, Italy, China, Bahrain, Malaysia, South Korea, Thailand, Pakistan, Indonesia.
Imports: petroleum, consumer goods, machinery and transport equipment, used clothing, chemicals, and pharmaceuticals.
Major suppliers: UK, Germany, Japan, India, Italy, United States, United Arab Emirates, Hong Kong, Singapore, South Africa, Kenya.
Natural resources: hydroelectric potential, coal, iron, gemstones, gold, natural gas, nickel, diamonds, crude oil potential, forest products, wildlife, fi sheries.
Agriculture (2007): 42.5 per cent of GDP. Products—coffee, cotton, tea, tobacco, cloves, sisal, cashew nuts, maize, livestock, sugar cane, paddy, wheat, pyrethrum.
Despite Tanzania’s record of political stability, an unattractive investment climate has dis-couraged foreign investments. Government steps to improve the business climate include redrawing tax codes, fl oating the exchange rate, licensing foreign banks, and creating an investment promotion centre to cut red tape.
16_Africa_Report09_Tanzania.indd333 33316_Africa_Report09_Tanzania.indd333 333 2/25/09 4:36:29 PM2/25/09 4:36:29 PM
334
Country Report for Tanzania
OU
TS
OU
RC
IN
G
TO
A
FR
IC
AGovernment and Political Condition
Tanzania has experienced a long record of stability since independence in 1961. Since then, the country has changed presidents four times. Tanzania is free of ideological confrontations, ethnic problems, and labour disputes. From 1995, the country has held elections under a multiparty platform. The current president—fourth in the history of the country—was elected in December 2005 for a fi ve-year term.
Tanzania’s president and National Assembly members are elected concurrently by direct popular vote for fi ve-year terms. The president appoints a prime minister who serves as the government’s leader in the National Assembly.
The president selects his cabinet from among National Assembly members.
The constitution also empowers him to nominate ten non-elected members of parliament, who also are eligible to become cabinet members.
Elections for president and all National Assembly seats were held in December 2005.
Tanzania has a fi ve-level judiciary combining the jurisdictions of tribal, Islamic, and British common law.
President Kikwete, Vice-President Ali Mohamed Shein, Prime Minister Mizengo Kayanza Peter Pinda, and National Assembly members will serve until the next general elections in 2010. Similarly, Zanzibar president Karume and members of the Zanzibar House of Representatives also will complete their terms of offi ce in 2010.
4. Principal Government Offi cials
President: Jakaya Kikwete.
Vice-President: Ali Mohamed Shein.
Prime Minister: Mizengo Kayanza Peter Pinda.
Minister of Foreign Affairs: Bernard Membe.
5. Foreign Relations
During the Cold War era, Tanzania played an important role in regional and interna-tional organisations. Tanzania’s fi rst president, Julius Nyerere, was one of the founding members of the non-aligned movement. Additionally, Tanzania played an active role in the front-line states, the G-77, and the Organization of African Unity (OAU).
Tanzania is the only country in East Africa which also is a member of the Southern Africa Development Community (SADC).
In January 2005, Tanzania became a non-permanent member of the UN Security Council, serving a two-year term that ended on 31 December 2006. In February 2008, President Kikwete was selected to chair the African Union for a one-year term.
Tanzania is a key player in the East African Community (EAC) and hosts the EAC secretariat in Arusha.
•
•
•
•
•
•
•
•
•
•
16_Africa_Report09_Tanzania.indd334 33416_Africa_Report09_Tanzania.indd334 334 2/25/09 4:36:30 PM2/25/09 4:36:30 PM

Country Report for Tanzania
335
OU
TS
OU
RC
IN
G
TO
A
FR
IC
ATanzania has a very healthy relationship with the international donor agencies and has several ICT, technology, and education projects funded by the international agencies.
6. Living: Security and Safety Perceptions
Living conditions in Tanzania are generally safe and comfortable. Like any developing coun-try, adverse incidents do occur and precautions and caution are taken. The following points give an indication of the situation and hints on how to remain safe:
Crime is a problem in Tanzania, and visitors should be alert and cautious.
Street crime in Dar es Salaam cannot be ruled out and includes mugging, vehicle theft, ‘smash and grab’ attacks on vehicles, armed robbery, and burglary.
Crime involving fi rearms is emerging. A series of robberies involving increasing levels of violence has occurred along the coast and in Zanzibar.
In urban areas, it is common to fi nd main arterial roads paved and maintained, while secondary streets are severely rutted and passable only with high-clearance vehicles.
Traffi c lights are often out of order, and care should be exercised at any traffi c intersec-tion, whether controlled or not, as many drivers disregard signals.
Excessive speed, unpredictable driving habits, and the lack of basic safety equipment on many vehicles pose serious traffi c hazards.
There have been incidents of armed, violent robberies.
Carjacking has occurred occasionally in both rural and urban areas. Visitors are advised to drive with doors locked and windows rolled up.
The situation is not alarming as some travel advisory notices show. Restaurants and social places are open till late night and people visit them freely with their partners. Socially it is the most harmonious country with people of all religions, ethnicity mixing freely and in total communal harmony.
7. ICT Policy, Infrastructure, and Service
There is a National ICT Policy developed and passed by the parliament in 2003, but there is no single agency yet to implement the policy. Policy elements fall into the portfolios of many ministries, namely: The Public Service under the President for E governance, Science and Technology, Communication and Transport, and ministries like the Ministry of Justice for Civil Registration and Identity.
The Tanzanian government issued an order to ban the use of computers and television in 1974; this order was lifted in 1984, and since then the country has been playing catch-up in its use and adoption of ICT, fortunately with renewed vigour. The country adopted a National policy in 2003 that identifi es the development of infrastructure as key in the devel-opment and use of ICT in the country. The policy also recognises the strategic input that ICT can have in the education sector.
•
•
•
•
•
•
•
•
•
•
16_Africa_Report09_Tanzania.indd335 33516_Africa_Report09_Tanzania.indd335 335 2/25/09 4:36:30 PM2/25/09 4:36:30 PM
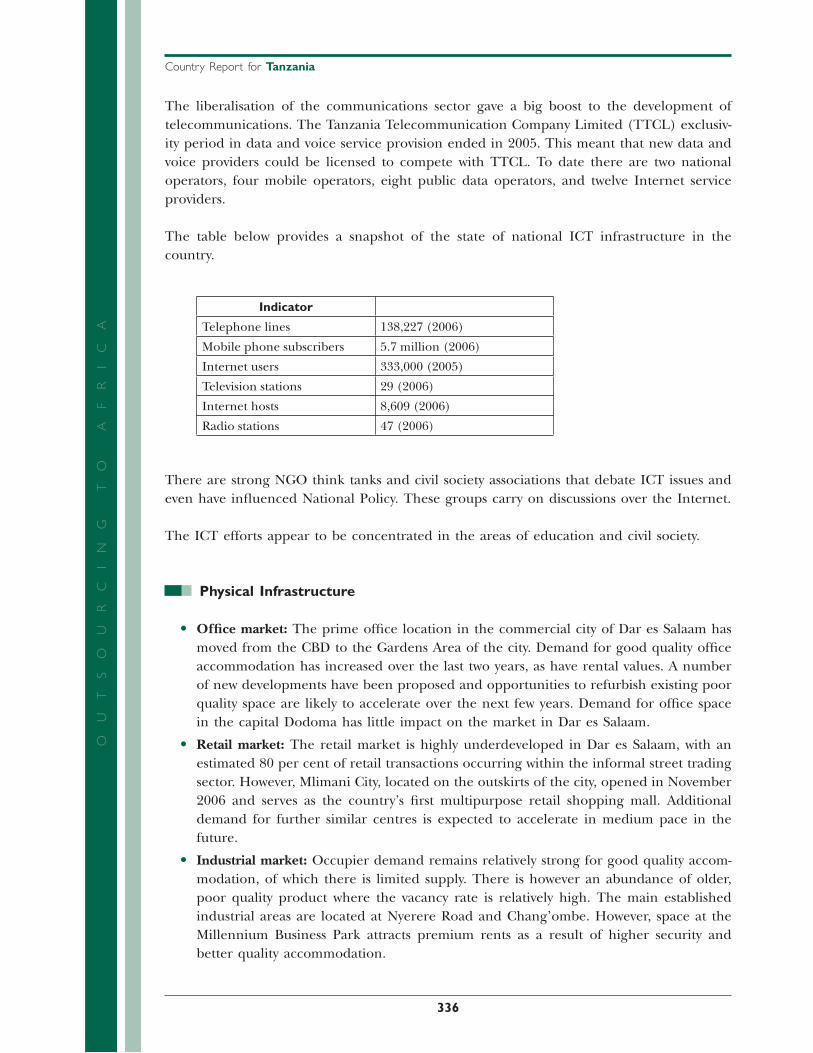
336
Country Report for Tanzania
OU
TS
OU
RC
IN
G
TO
A
FR
IC
AThe liberalisation of the communications sector gave a big boost to the development of telecommunications. The Tanzania Telecommunication Company Limited (TTCL) exclusiv-ity period in data and voice service provision ended in 2005. This meant that new data and voice providers could be licensed to compete with TTCL. To date there are two national operators, four mobile operators, eight public data operators, and twelve Internet service providers.
The table below provides a snapshot of the state of national ICT infrastructure in the country.
Indicator
Telephone lines 138,227 (2006)
Mobile phone subscribers 5.7 million (2006)
Internet users 333,000 (2005)
Television stations 29 (2006)
Internet hosts 8,609 (2006)
Radio stations 47 (2006)
There are strong NGO think tanks and civil society associations that debate ICT issues and even have infl uenced National Policy. These groups carry on discussions over the Internet.
The ICT efforts appear to be concentrated in the areas of education and civil society.
Physical Infrastructure
Offi ce market: The prime offi ce location in the commercial city of Dar es Salaam has moved from the CBD to the Gardens Area of the city. Demand for good quality offi ce accommodation has increased over the last two years, as have rental values. A number of new developments have been proposed and opportunities to refurbish existing poor quality space are likely to accelerate over the next few years. Demand for offi ce space in the capital Dodoma has little impact on the market in Dar es Salaam.
Retail market: The retail market is highly underdeveloped in Dar es Salaam, with an estimated 80 per cent of retail transactions occurring within the informal street trading sector. However, Mlimani City, located on the outskirts of the city, opened in November 2006 and serves as the country’s fi rst multipurpose retail shopping mall. Additional demand for further similar centres is expected to accelerate in medium pace in the future.
Industrial market: Occupier demand remains relatively strong for good quality accom-modation, of which there is limited supply. There is however an abundance of older, poor quality product where the vacancy rate is relatively high. The main established industrial areas are located at Nyerere Road and Chang’ombe. However, space at the Millennium Business Park attracts premium rents as a result of higher security and better quality accommodation.
•
•
•
16_Africa_Report09_Tanzania.indd336 33616_Africa_Report09_Tanzania.indd336 336 2/25/09 4:36:30 PM2/25/09 4:36:30 PM

Country Report for Tanzania
337
OU
TS
OU
RC
IN
G
TO
A
FR
IC
AResidential market: The prime residential areas are found on the roads immediately in front of the sea, with both demand and values declining with greater the commut-ing distance from the CBD. The supply of the best residential properties is relatively limited with tenants generally being responsible for upgrading the accommodation to meet international standards. Rents in this sector have recently been increasing as a result of additional demands.
Prime rents Prime yields
Offi ces US$ 19 per sq m per month 12.50%
Retail US$ 12 per sq m per month 13.50%
Industrial US$ 5 per sq m per month 15.00%
Residential US$ 4,500 per month* 12%
*4 bedroom executive house—prime location.
Thus Tanzania is on the expensive side in cost of space and facilities. Although Tanzania is better than Egypt or Nigeria, it is more expensive than more attractive countries like South Africa, Botswana, and even Tunisia and Mauritius.
8. ICT and BPO Industry Environment
There is no signifi cant business process outsourcing industry present in Tanzania. There is a moderate domestic ICT industry supporting education research and government websites. Even critical government functions like the registration of births and deaths and citizen identifi cation are yet to be computerised. The GDP is not great enough to do this by self-funding and mechanisms for getting these done by public–private partnerships need to be strengthened.
9. Human Resource Effi ciency and Cost
Other than the score on cost of human resources, Tanzania has not scored well. This is surprising as Tanzania has been the seat of learning in Africa with institutions like the University of Dar es Salaam. Tanzanian experts are spread all over Africa and the world. The table below provides a summary of the current stage of ICT development in Tanzania in terms of enabling or constraining features in the education system.
•
16_Africa_Report09_Tanzania.indd337 33716_Africa_Report09_Tanzania.indd337 337 2/25/09 4:36:30 PM2/25/09 4:36:30 PM

338
Country Report for Tanzania
OU
TS
OU
RC
IN
G
TO
A
FR
IC
AFactors Enabling Features Constraining Features
Policy framework and implementation
The new policy, when enacted and implemented, will help guide the development of ICT in education and therefore make the ministry assume leadership.
The lack of a policy framework has hindered the uptake of ICT in education to date which contributed to the limited active promotion of ICTs in education within the Ministry of Education.
Infrastructure and cost of bandwidth
Despite the liberalisation of the telecommunications sector, the cost of bandwidth is still out of reach of many schools. Rural schools that are out of the national telecommunications network need to use expensive satellite technologies.
Language of the Internet There is an increasing interest in developing online content in Kiswahili and some applications now come with Kiswahili dictionaries. The advent of open source software has helped localise ICTs and the Internet and therefore increased access.
Language has been identifi ed as one of the major inhibitors of ICT use in Tanzania. A majority of the population is comfortable in Kiswahili and only learns English in later years in late primary school or early secondary school.
Electricity The national electricity grid is still limited to commercially viable areas missing out most of the schools, which are in the rural areas. This, coupled with major breakdowns and load shedding, has increased the cost of owning ICT infrastructure.
Tutor technicians ICT in education is still a new concept. The teachers’ colleges are now training teachers in ICT. A lot more effort will be required to give in-service training to teachers in ICT.
New technologies There is proliferation of new technologies that are promising to drastically lower the cost of entry and ownership of ICT is schools. These include open source software and Wireless Connectivity solutions using GSM networks, which have a wider coverage in the country.
16_Africa_Report09_Tanzania.indd338 33816_Africa_Report09_Tanzania.indd338 338 2/25/09 4:36:30 PM2/25/09 4:36:30 PM
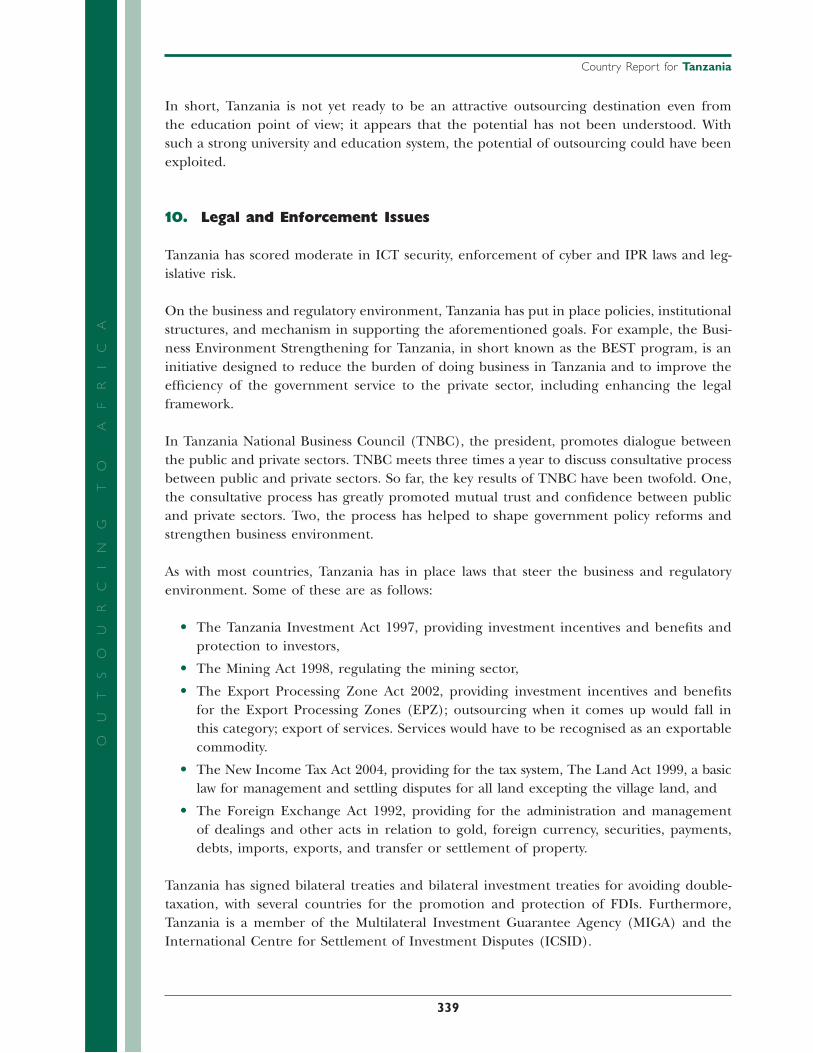
Country Report for Tanzania
339
OU
TS
OU
RC
IN
G
TO
A
FR
IC
AIn short, Tanzania is not yet ready to be an attractive outsourcing destination even from the education point of view; it appears that the potential has not been understood. With such a strong university and education system, the potential of outsourcing could have been exploited.
10. Legal and Enforcement Issues
Tanzania has scored moderate in ICT security, enforcement of cyber and IPR laws and leg-islative risk.
On the business and regulatory environment, Tanzania has put in place policies, institutional structures, and mechanism in supporting the aforementioned goals. For example, the Busi-ness Environment Strengthening for Tanzania, in short known as the BEST program, is an initiative designed to reduce the burden of doing business in Tanzania and to improve the effi ciency of the government service to the private sector, including enhancing the legal framework.
In Tanzania National Business Council (TNBC), the president, promotes dialogue between the public and private sectors. TNBC meets three times a year to discuss consultative process between public and private sectors. So far, the key results of TNBC have been twofold. One, the consultative process has greatly promoted mutual trust and confi dence between public and private sectors. Two, the process has helped to shape government policy reforms and strengthen business environment.
As with most countries, Tanzania has in place laws that steer the business and regulatory environment. Some of these are as follows:
The Tanzania Investment Act 1997, providing investment incentives and benefi ts and protection to investors,
The Mining Act 1998, regulating the mining sector,
The Export Processing Zone Act 2002, providing investment incentives and benefi ts for the Export Processing Zones (EPZ); outsourcing when it comes up would fall in this category; export of services. Services would have to be recognised as an exportable commodity.
The New Income Tax Act 2004, providing for the tax system, The Land Act 1999, a basic law for management and settling disputes for all land excepting the village land, and
The Foreign Exchange Act 1992, providing for the administration and management of dealings and other acts in relation to gold, foreign currency, securities, payments, debts, imports, exports, and transfer or settlement of property.
Tanzania has signed bilateral treaties and bilateral investment treaties for avoiding double-taxation, with several countries for the promotion and protection of FDIs. Furthermore, Tanzania is a member of the Multilateral Investment Guarantee Agency (MIGA) and the International Centre for Settlement of Investment Disputes (ICSID).
•
•
•
•
•
16_Africa_Report09_Tanzania.indd339 33916_Africa_Report09_Tanzania.indd339 339 2/25/09 4:36:31 PM2/25/09 4:36:31 PM

340
Country Report for Tanzania
OU
TS
OU
RC
IN
G
TO
A
FR
IC
A11. Labour and Expatriate Workers Permits
There is no problem in these aspects. Consultants and business visitors get visitors or busi-ness/work permits for up to three to six months on arrival upon payment of applicable fees. Pursuant to the Tanzania Investment Act 1999, the Tanzania Investment Centre (TIC) is a one-stop shop providing investment incentives and benefi ts to domestic and foreign investors. TIC has two key roles: facilitation and promotion. TIC has under its roof staff to facilitate investors and for streamlining business set-up processes—immigration permits, labour issues, tax authority, land, and business licenses and permits.
12. Revenue, Tax, and Repatriation Issues
FOREIGN EXCHANGE CONTROLS
There are no foreign exchange controls on trade.
Administration of exchange control is under the authority of Bank of Tanzania, whereby the Bank of Tanzania Act of 1995 empowers the bank to control exchange operations in Tanzania.
Authority for making payments abroad is delegated by the Bank of Tanzania to all licensed banks.
In 1993, Tanzania harmonised the Central Bank’s offi cial local currency rates with those offered by commercial banks. The single exchange rate applies to all foreign exchange transactions, including government and private sector imports.
The release of foreign exchange above US$ 5,000 requires an import declaration form.
In July 1996, Tanzania accepted the obligation of Article VIII, Sections 2 and 3 and of the International Monetary Fund (IMF) to refrain from imposing restrictions on the making of payments and transfer for current international transactions or from engaging in discriminatory currency arrangements or multiple currency practices without IMF’s approval.
In tax rates and ease and cost of fi nance, Tanzania is in the mid-range among the fi fteen African countries studied.
13. Investment Policy and Incentives
The ICT Outsourcing industry in Tanzania has not been identifi ed as a priority area for investment. However, the standard investment incentives would apply. The Investment Act also provides for certain tax incentives and benefi ts in addition to providing guarantee to all investments against nationalisation and expropriation. However, the incentives and benefi ts for investments in the mining sector are provided in the Mining Act 1998.
•
•
•
•
•
•
•
•
16_Africa_Report09_Tanzania.indd340 34016_Africa_Report09_Tanzania.indd340 340 2/25/09 4:36:31 PM2/25/09 4:36:31 PM
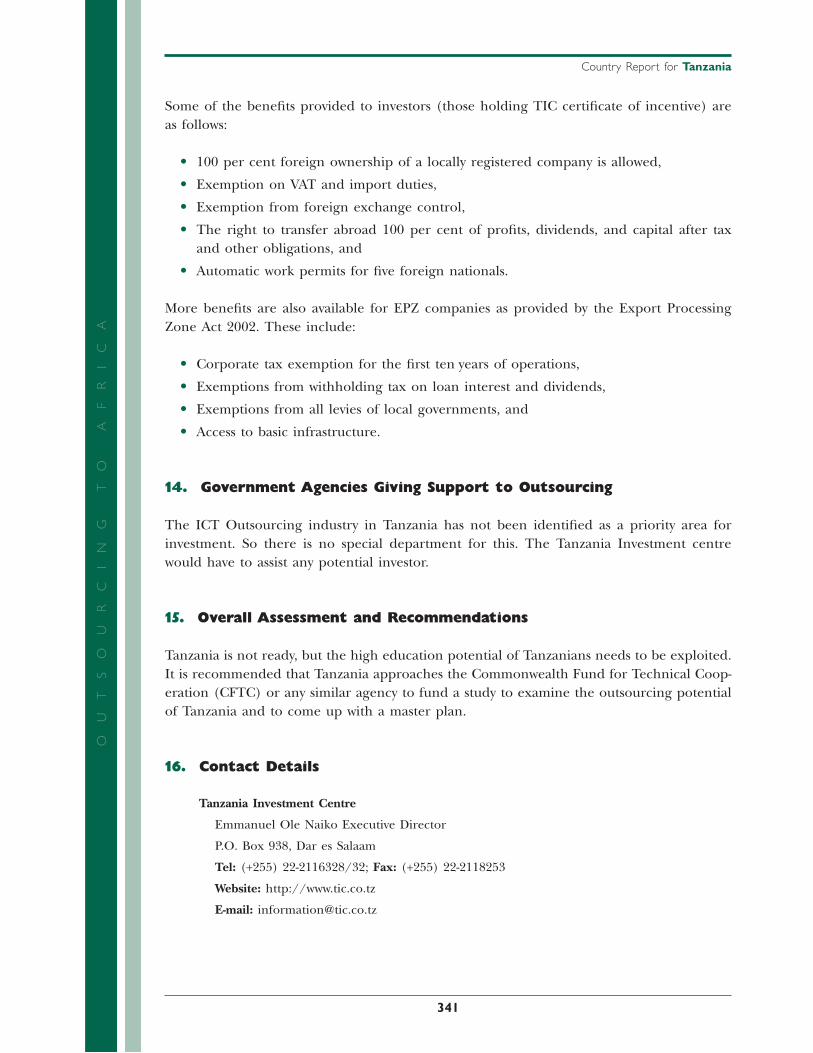
Country Report for Tanzania
341
OU
TS
OU
RC
IN
G
TO
A
FR
IC
ASome of the benefi ts provided to investors (those holding TIC certifi cate of incentive) are as follows:
100 per cent foreign ownership of a locally registered company is allowed,
Exemption on VAT and import duties,
Exemption from foreign exchange control,
The right to transfer abroad 100 per cent of profi ts, dividends, and capital after tax and other obligations, and
Automatic work permits for fi ve foreign nationals.
More benefi ts are also available for EPZ companies as provided by the Export Processing Zone Act 2002. These include:
Corporate tax exemption for the fi rst ten years of operations,
Exemptions from withholding tax on loan interest and dividends,
Exemptions from all levies of local governments, and
Access to basic infrastructure.
14. Government Agencies Giving Support to Outsourcing
The ICT Outsourcing industry in Tanzania has not been identifi ed as a priority area for investment. So there is no special department for this. The Tanzania Investment centre would have to assist any potential investor.
15. Overall Assessment and Recommendations
Tanzania is not ready, but the high education potential of Tanzanians needs to be exploited. It is recommended that Tanzania approaches the Commonwealth Fund for Technical Coop-eration (CFTC) or any similar agency to fund a study to examine the outsourcing potential of Tanzania and to come up with a master plan.
16. Contact Details
Tanzania Investment Centre
Emmanuel Ole Naiko Executive Director
P.O. Box 938, Dar es Salaam
Tel: (+255) 22-2116328/32; Fax: (+255) 22-2118253
Website: http://www.tic.co.tz
E-mail: [email protected]
•
•
•
•
•
•
•
•
•
16_Africa_Report09_Tanzania.indd341 34116_Africa_Report09_Tanzania.indd341 341 2/25/09 4:36:31 PM2/25/09 4:36:31 PM

342
Country Report for Tanzania
OU
TS
OU
RC
IN
G
TO
A
FR
IC
AInvestment Promotion Centre (IPC)
CRDB Building
P.O. Box 938, Dar es Salaam, Tanzania
Tel: (+255) 51-113-365; Fax: (+255) 51-112761
Ministry of Industries and Trade
Cooperative Building, Lumumba Street
P.O. Box 9503, Dar es Salaam
Tel: (+255) 51-181-397; Fax: (+255) 51-325624
The Director General
Tanzania Communications Regulatory Authority (TCRA)
Mawasiliano House
Plot 304 All Hassan Mwinyi/Nkomo Road
P.O. Box 474, Dar es Salaam
Tel: 2118947/52; 0744720411; Fax: 2116664
E-mail: [email protected]
Tanzania Revenue Authority
TRA Headquarters Ground Floor,
Room No. G.15
Sokoine Drive
P.O. Box 11491, Dar es Salaam, Tanzania
Tel: (+255) 22-2119591/4; Fax: (+255) 22-2119595/22; 2128594
E-mail: [email protected], [email protected]
Commissioner General
Tanzania Revenue Authority
P.O. Box 11491, Dar es Salaam, Tanzania
Commissioner Income Tax Department
Tanzania Revenue Authority East Africa Community Building
P.O. Box 9131, Dar es Salaam, Tanzania
Tel: (+255) 22-29533 or 38811
Registrar of Companies
Co-operative Buildings
10th Floor, Lumumba Street
P.O. Box 9393, Dar es Salaam, Tanzania
Tel: (+255) 55-180385, 180113, 180371, 188344
16_Africa_Report09_Tanzania.indd342 34216_Africa_Report09_Tanzania.indd342 342 2/25/09 4:36:31 PM2/25/09 4:36:31 PM

Country Report for Tanzania
343
OU
TS
OU
RC
IN
G
TO
A
FR
IC
ALabour and Immigration Departments
Director of Immigration Services
P.O. Box 512, Dar es Salaam, Tanzania
Labour Commissioner
P.O. Box 9014, Dar es Salaam, Tanzania
High Commissions and embassies in UK, United States, Germany, France, China, and India
High Commission of the United Republic of Tanzania in London, United Kingdom
3 Stratford Place London W1C 1AS, London
Tel: 004420 7569-1470; Fax: 004420 7495-8817
Website: http://www.tanzania-online.gov.uk
E-mail: [email protected]
Embassy of the United Republic of Tanzania in United States of America
2139 R Street, NW Washington, DC 20008 United States
Tel: +1 (202) 939-6125/7 +1 (202) 884-1080; Fax: +1 (202) 797-7408
Website: http://www.tanzaniaembassy-us.org
E-mail: [email protected]
Embassy of Tanzania in China
No. 53 Dong Liu Jie
Beijing, China
Tel: (+86-1) 532-1419 532-1491, 532-1719
Embassy of Tanzania in France
13 Avenue Raymond, Pointcare
75116, Paris, France
Tel: (+33) 1-53-70-63-66; Fax: (+33) 1-47-55-05-46
E-mail: [email protected]
Embassy of the United Republic of Tanzania in Berlin, Germany
11 14050 Berlin (Charlottenburg, Westend), Germany
P.O. Box 191226 14002, Berlin, Germany
Tel: (+49) 0228-358051
Website: http://www.tanzania-gov.de/
Embassy of Tanzania in India
10/1 Sarv Priya Vihar, New Delhi 110016, India
Tel: (+91-11) 6853046-7, 6968409, 6968406-7; Fax: (+91-11) 6968410
E-mail: [email protected]
16_Africa_Report09_Tanzania.indd343 34316_Africa_Report09_Tanzania.indd343 343 2/25/09 4:36:32 PM2/25/09 4:36:32 PM

344
Country Report for Tanzania
OU
TS
OU
RC
IN
G
TO
A
FR
IC
AUseful Links
World Fact book 2007.
https://cia.gov/cia/publications/factbook/geos/tz.html
“Tanzania Fact Sheet.” Human Development Report 2006.
http://hdr.undp.org/hdr2006/statistics/countries/country_fact_sheets/cty_fs_TZA.html
Ministry of Education and Vocational Training.
http://www.moe.go.tz/
Ministry of Education, Statistics, National. 2006.
http://www.moe.go.tz/statistics.html.
Education and Training Policy.
http://www.tanedu.org/edupolicy.pdf
Primary Education and Development Plan.
http://www.moe.go.tz/pdf/PEDP.pdf
Secondary Education and Development Plan.
http://www.moe.go.tz/pdf/SEDP%20FINAL.pdf
Draft Policy on ICT for Education 2006. Ministry of Education and Vocational Training.
“Tanzanian education roundtable generates 11 project proposals.” IICD.
http://www.iicd.org/articles/IICDnews.import1803
Nills Jensen. “ICT Integration in Tanzania’s Secondary Education Policy.”
http://www.digitallearning.in/octmag06/Action.asp
National ICT Policy. 2003.
http://www.tcra.go.tz/Publications/Nationa%20ICT%20Policy%20of%202003.pdf
Tanzania Communications Regulatory Authority, Market Information.
http://www.tcra.go.tz/Market%20information.htm
16_Africa_Report09_Tanzania.indd344 34416_Africa_Report09_Tanzania.indd344 344 2/25/09 4:36:32 PM2/25/09 4:36:32 PM

345
OU
TS
OU
RC
IN
G
TO
A
FR
IC
A
Country Report for Uganda
Disclaimer
This short Country Report, a result of a larger Survey of ICT Outsourcing in Africa, provides a general overview of the current activities and issues related to ICT Outsourcing in the country. The data presented here should be regarded as illustrative rather than exhaustive. ICT Outsourcing is at a particularly dynamic stage in Africa with new developments and announcements happening on a daily basis somewhere or the other on the continent. Therefore, these reports should be seen as ‘snapshots’ that were current at the time they were taken; it is expected that certain facts and fi gures presented may become outdated very quickly.
The fi ndings, interpretations and conclusions expressed herein are a faithful representation of the respondents of the interviews and secondary data collected from the countries and published literature. Strict analytical analysis has been carried out with the minimal infl uence of the authors/team members. References to data sources have been made as far as possible. In the case of the detailed data parameters used for scores and ranking, the same data source and timeline has been used for all the fi fteen countries compared. In the descrip-tive section of the country reports all data received from the individual country has been used in order to give as complete an assessment as possible. Thus those countries that have provided more information have a better coverage than those who have not been able to provide data to the research team.
Board of Executive Directors of the CBC or Cyber Media cannot guarantee the accuracy of the data included in this work. The boundaries, colours, denominations, and other information shown on any map in this work do not imply on the part of the CBC and Cyber Media any judgement of the legal status of any territory or the endorsement or acceptance of such boundaries.
It is expected that individual Country Reports from the Survey of ICT Outsourcing in Africa will be updated in an iterative process over time based on additional research and feedback received through the CBC and Cyber Media website.
AruaGulu
LiraMoroto
Soroti
Mbale
Fort Portal
Marghenta Peak
KAMPALAEntebbe
Masaka
Mbarara
RWANDA
KENYA
TANZANIA
SUDAN
DEM. REP. OF THE CONGO
LakeVictoria
LakeGeorge
LakeAlbert
LakeKwania
Lake Kyoga
LakeEdward
Victoria Nile
Albe
rt N
ile
Victoria N
ile JinjaPortBell
Equator
0 50 100km
0 50 100mi
3
30 33
0
33
0
3
17_Africa_Report09_Uganda.indd 34517_Africa_Report09_Uganda.indd 345 2/25/09 4:36:55 PM2/25/09 4:36:55 PM
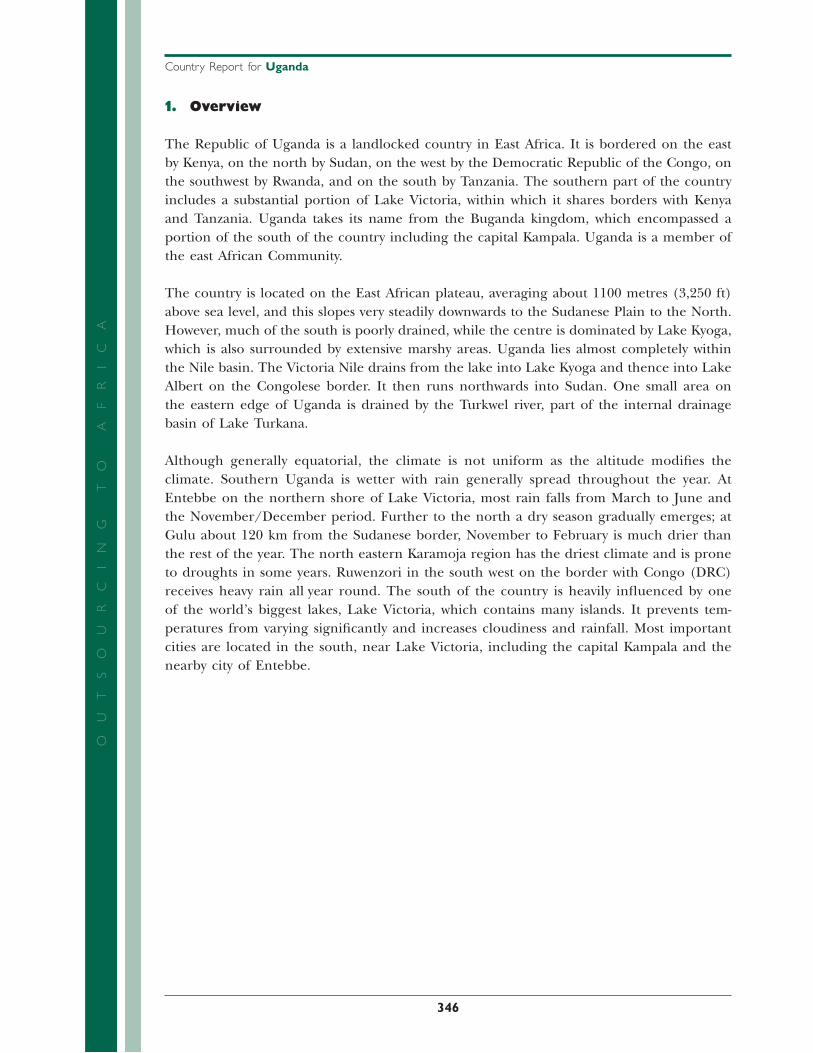
346
Country Report for Uganda
OU
TS
OU
RC
IN
G
TO
A
FR
IC
A1. Overview
The Republic of Uganda is a landlocked country in East Africa. It is bordered on the east by Kenya, on the north by Sudan, on the west by the Democratic Republic of the Congo, on the southwest by Rwanda, and on the south by Tanzania. The southern part of the country includes a substantial portion of Lake Victoria, within which it shares borders with Kenya and Tanzania. Uganda takes its name from the Buganda kingdom, which encompassed a portion of the south of the country including the capital Kampala. Uganda is a member of the east African Community.
The country is located on the East African plateau, averaging about 1100 metres (3,250 ft) above sea level, and this slopes very steadily downwards to the Sudanese Plain to the North. However, much of the south is poorly drained, while the centre is dominated by Lake Kyoga, which is also surrounded by extensive marshy areas. Uganda lies almost completely within the Nile basin. The Victoria Nile drains from the lake into Lake Kyoga and thence into Lake Albert on the Congolese border. It then runs northwards into Sudan. One small area on the eastern edge of Uganda is drained by the Turkwel river, part of the internal drainage basin of Lake Turkana.
Although generally equatorial, the climate is not uniform as the altitude modifi es the climate. Southern Uganda is wetter with rain generally spread throughout the year. At Entebbe on the northern shore of Lake Victoria, most rain falls from March to June and the November/December period. Further to the north a dry season gradually emerges; at Gulu about 120 km from the Sudanese border, November to February is much drier than the rest of the year. The north eastern Karamoja region has the driest climate and is prone to droughts in some years. Ruwenzori in the south west on the border with Congo (DRC) receives heavy rain all year round. The south of the country is heavily infl uenced by one of the world’s biggest lakes, Lake Victoria, which contains many islands. It prevents tem-peratures from varying signifi cantly and increases cloudiness and rainfall. Most important cities are located in the south, near Lake Victoria, including the capital Kampala and the nearby city of Entebbe.
17_Africa_Report09_Uganda.indd 34617_Africa_Report09_Uganda.indd 346 2/25/09 4:36:56 PM2/25/09 4:36:56 PM

Country Report for Uganda
347
OU
TS
OU
RC
IN
G
TO
A
FR
IC
A2. Uganda’s Position in Africa’s Fifteen Countries
Uganda is in the last position in the yet to be ready band of countries from the outsourc-ing attractiveness point of view. The map and table below show where Uganda is positioned among the fi fteen studied countries.
Morocco *
Morocco
Tunisia *
Geographical Coverage and Rank
Tunisia
Egypt *
Egypt
Senegal *
Senegal
GhanaGhana
Nigeria
Nigeria
Uganda
Uganda
Kenya
KenyaTanzania
Tanzania
Zambia
Zambia
Mozambique MozambiqueBotswana
Botswana
Namibia
Namibia
SouthAfrica
South Africa
MauritiusAfrica
*Non-Commonwealth Countries
Mauritius
Contributing scores and ranks are as under.
Overall
Band Score (PS & BE) Rank
Yet to be ready 5.68 Last
Infrastructure
Score Rank Band
4.3 14 Yet to be ready
While achieving the thirteenth position in score for ‘Infrastructure’, Uganda is last in elec-tricity availability, fourteenth in telecommunications and data transfer costs, thirteenth in network readiness, last in infrastructure cost, fourteenth in availability and penetration, and fourteenth in the road and rail network.
17_Africa_Report09_Uganda.indd 34717_Africa_Report09_Uganda.indd 347 2/25/09 4:36:56 PM2/25/09 4:36:56 PM

348
Country Report for Uganda
OU
TS
OU
RC
IN
G
TO
A
FR
IC
APeople and Skills (PS)
Score Rank
2.964 9
Uganda is the ninth in the case of ‘People and Skills’, being thirteenth in quantity, thirteenth in quality, tenth in working satisfaction, and twelfth in ICT exposure; it has ranked second in human resource costs and ninth in education, language, and domain skills.
Business Environment (BE)
Score Rank
2.713 14
Uganda has ranked fourteenth in this lower level abstraction. In achieving this position it has come thirteenth in ICT security, Cyber and IPR laws, last in Share of services in GDP. Uganda has the tenth lowest foreign exchange reserves and is the twelfth in ease and cost of fi nances, fourteenth for share in ICT in exports, and twelfth in legislative risk. In the tax rate Uganda is seventh and in share of services in exports it has come fourteenth. Uganda is thirteenth and tenth, respectively, in geopolitical risk and currency risk.
3. Country, Political and Economic Profi le
Area: 241,040 sq. km. (93,070 sq. mi.); about the size of Oregon.
Cities: Capital--(2002 pop. 1.2 million).
Other cities: Jinja, Gulu, Mbale, Mbarara.
Terrain: 18 per cent inland water and swamp; 12 per cent national parks, forest, and game reserves; 70 per cent forest, woodland, grassland.
Climate: In the north-east, semi-arid rainfall less than 50 cm (20 in); in southwest, rainfall 130 cm (50 in) or more.
Two dry seasons: December–February and June–July.
Population (2007): 28.90 million.
Education: Attendance (2000; primary school enrolment, public and private)--89 per cent.
Literacy (2003): 70 per cent.
GDP (nominal, 2006/2007): $8.7 billion.
Per capita GDP: $303
GDP Growth Rate: 0.3 per cent.
Industry: Processing of agricultural products (cotton ginning, coffee curing), cement production, light consumer goods, textiles.
Trade Exports (2006/2007): $1.5 billion; coffee, fi sh and fi sh products, tea, electricity, horticultural products, vanilla, cut fl owers, remittances from abroad.
Major markets: EU, Kenya, South Africa, UK, US.
17_Africa_Report09_Uganda.indd 34817_Africa_Report09_Uganda.indd 348 2/25/09 4:36:56 PM2/25/09 4:36:56 PM

Country Report for Uganda
349
OU
TS
OU
RC
IN
G
TO
A
FR
IC
AImports (2006/2007): $2.5 billion; capital equipment, vehicles, petroleum, medical supplies, chemicals and cereals.
Major suppliers: OPEC countries, Kenya, EU, India, South Africa, China, US.
Natural resources: Copper, cobalt, limestone, phosphate, oil.
Agriculture: Cash crops—coffee, tea, cotton, tobacco, sugar cane, cut fl owers, vanilla; Food crops—bananas, corn, cassava, potatoes, millet, pulses; Livestock and fi sheries—beef, goat meat, milk, Nile perch, and tilapia.
Uganda’s economy has great potential. Endowed with signifi cant natural resources, includ-ing ample fertile land, regular rainfall, and mineral deposits, it appeared poised for rapid economic growth and development at independence.
However, chronic political instability and erratic economic management produced a record of persistent economic decline that left Uganda among the world’s poorest and least- developed countries.
Government
Type: Republic.
Independence: 9 October, 1962.
Branches: President, Vice-president, Prime Minister, Cabinet; Magistrate’s Court, High Court, Court of Appeals, Supreme Court.
Legislative: Parliament.
The president of Uganda, currently Yoweri Museveni, is both head of state and head of gov-ernment. The president appoints a prime minister, currently Apolo Nsibambi, who aids him in governing. The parliament is formed by the National Assembly, which has 332 members. 104 of these members are nominated by interest groups, including women and the army. The remaining members are elected for two-year terms during general elections.
In a measure ostensibly designed to reduce sectarian violence, political parties were restricted in their activities from 1986. In the non-party Movement system instituted by Museveni, polit-ical parties continued to exist, but they could only operate a headquarter offi ce. They could not open branches, hold rallies, or fi eld candidates directly (although electoral candidates could belong to political parties). A constitutional referendum canceled this nineteen-year ban on multi-party politics in July 2005.
The presidential elections were held in February 2006. Yoweri Museveni ran against several candidates, the most prominent of whom was exiled Dr Kizza Besigye.
17_Africa_Report09_Uganda.indd 34917_Africa_Report09_Uganda.indd 349 2/25/09 4:36:56 PM2/25/09 4:36:56 PM

350
Country Report for Uganda
OU
TS
OU
RC
IN
G
TO
A
FR
IC
A4. Principal Government Offi cials
President: Yoweri Kaguta Musevei.
Vice-President: Dr. Gilbert Bukenya.
Prime Minister: Apollo Nsibambi.
Minister of Foreign Affairs: Sam Kutesa.
5. Foreign Relations
The Ugandan government generally seeks good relations with other nations without reference to ideological orientation.
Relations with Rwanda, Congo, and Sudan have sometimes been strained because of security concerns.
President Museveni has been active in attempts to implement a peace agreement in Burundi and has supported peace initiatives in Sudan and Somalia.
6. Living, Security, and Safety Perceptions
Travel guides issued by maoist nations and public reports available indicate a situation where one has to live with due care and caution.
Negative elements of society have engaged in murder, armed attacks, kidnapping, and the placement of land mines.
Isolated incidents occur with little or no warning.
Armed banditry and attacks on vehicles are not uncommon in the Karamoja region of northeastern Uganda.
Crimes such as pickpocketing, purse snatching, and thefts from hotels and parked vehicles or vehicles stalled in traffi c jams do occur and care is essential.
Women travelling alone are particularly susceptible to becoming crime victims. In early 2008, there was an increase in reports of sexual assaults against expatriate females.
Visitors and residents in Uganda are advised not to accept food or drink offered from a stranger, even a child, because such food may contain narcotics used to incapacitate a victim and facilitate a robbery or sexual assault.
•
•
•
•
•
•
•
•
•
17_Africa_Report09_Uganda.indd 35017_Africa_Report09_Uganda.indd 350 2/25/09 4:36:57 PM2/25/09 4:36:57 PM

Country Report for Uganda
351
OU
TS
OU
RC
IN
G
TO
A
FR
IC
A7. ICT Policy, Infrastructure and Service
Uganda has the National ICT Policy since 2002. The following areas are being focussed:
Universal access (for all sectors of society).
Human resource development.
Support for good governance.
Promotion of cultural heritage.
Appropriate infrastructure development.
Support for business development.
Uganda’s Information and Communications Technology (ICT) sector is dynamic and vibrant. The sector has registered double digit growth since 2000 and grew by 33 per cent in 2006/2007. Investment infl ows have been very strong, and in 2006, the sector attracted in excess of US$ 73 million. Direct employment stands at 6000 while over 350,000 people are indirectly employed. Sector dynamism is a result of Uganda’s good ICT legal and regulatory framework, a stable micro economic environment, and economic reforms pursued since the early 1990s. The telecommunications sub sector, formerly dominated by a single national operator, has been progressively liberalised over the last ten years. Infrastructure capacity is rapidly improving. Most national and regional transmission links are digital. Optical fi bre links connect major economic centres, with expansion in progress. There is extensive use of microwave in the backbone infrastructure and Vsat Services.
ICT sector growth averages 38 per cent over the last four years. Over 3.5 million users con-nected to mobile phone networks. International gateways are satellite based but connection to the world optic fi ber network is eminent. This dynamism is a result of a good legal and regulatory framework, a stable micro economic environment, and economic reforms pur-sued since the early 1990s. Although still small, export of ICT services has started generating foreign exchange infl ows. With virtually no earnings in 2001, the sector now earns over US$ 10 million per annum. Improving tele density as given by percentage of population owning a fi xed and or a mobile phone increased from 8 per cent in June 2005 to 13.3 per cent in July 2006. Over the last year (July 2006 to June 2007), Uganda’s subscriber base grew by more than 1.5 million new contracts, reaching a total of over 3.5 million, representing a 68 per cent annual growth rate. Whereas only 13.3 per cent of the population own phones, more than 40 per cent of the population access telephony using public pay phones. Addi-tional 10,393 public payphones were installed during the 2006/2007 fi nancial year; this number represents the phones installed by the three operators and excludes phone kiosks set up by private businesses. Expanding the national infrastructure backbone Uganda has launched a US$ 30 million National Data Transmission Backbone Infrastructure (NBI) and Electronic Government Infrastructure (EGI) project. The NBI is intended to ensure that affordable high bandwidth data connection is available in all major towns of the country by 2010. The EGI is designed to overhaul government communication infrastructure and to reduce the cost of doing business in government.
•
•
•
•
•
•
17_Africa_Report09_Uganda.indd 35117_Africa_Report09_Uganda.indd 351 2/25/09 4:36:57 PM2/25/09 4:36:57 PM

352
Country Report for Uganda
OU
TS
OU
RC
IN
G
TO
A
FR
IC
ALooking at some of the World Bank data on important parameters, Uganda is seen to be doing fairly well.
Telecommunications Revenue, 2000–2006
Percentage of GDP
2000 2001 2002 2003 2004 2005 2006
4
3
2
1
0
Uganda Sub-Saharan Africa Region
Price of Call to the United States, 2000–2005
US$ per 3 minutes
2000 2001 2002 2003 2004 2005
4
2
0
6
8
Uganda Sub-Saharan Africa Region
17_Africa_Report09_Uganda.indd 35217_Africa_Report09_Uganda.indd 352 2/25/09 4:36:57 PM2/25/09 4:36:57 PM

Country Report for Uganda
353
OU
TS
OU
RC
IN
G
TO
A
FR
IC
A
ICT Access Indicators, 2000–2006
Number per 100 people
Fixed + mobile subscribersInternet usersPCs
0
2
4
6
8
2000 2001 2002 2003 2004 2005 2006
Fixed 60995
Mobile 621082
Teledensity 2.8 4.3 5.5 7.8 13.3
987456 1315300 2008818 3575263
71272 87513 108140 154383
4000000
3000000
2000000
1000000
02002/03 2003/04 2004/05 2005/06 2006/07
14.0
12.0
10.0
8.0
6.0
4.0
2.0
0.0
Number of telephony Customers and Teledensity
Num
ber
of C
usto
mer
s
Tel
eden
sity
17_Africa_Report09_Uganda.indd 35317_Africa_Report09_Uganda.indd 353 2/25/09 4:36:58 PM2/25/09 4:36:58 PM

354
Country Report for Uganda
OU
TS
OU
RC
IN
G
TO
A
FR
IC
ATelecommunication Industry Operators—2007
National Telecom Operator (NTC) – 2•Cellular Telecom Operator (CTC) – 1•Public Infrastructure Providers (PIP) – 4•Public Service Providers (PSP)
Capacity Resale only – 4
••PSP-Voice and Data only – 10•PSP-Voice and Data plus Capacity resale – 2•
NB: All PIP lincensees also hold PSP licenses(Source: Uganda Communications Commission)
Physical Infrastructure
Offi ce market: Offi ce development activity in the capital Kampala seems to have gained momentum since 2006. Although developers are still cautious about building specu-latively, a bolder attitude from the less risk-averse developers is beginning to manifest itself in a number of relatively small offi ce developments (2,000-4,000 sq m) that are in the development pipeline. Demand for grade A/AB offi ce space has also increased, particularly from telecom companies and other related services, though there is little space available on the market to satisfy current demand.
Retail market: The retail market continues to perform steadily, and Kampala’s third shopping mall is due to be completed in 2008. Nakumatt will be the third major food retailer to enter the Kampala supermarket sector, after Shoprite and Uchumi. There is at least 6,000 sq m of retail space currently being built in downtown Kampala, and this space will be fi lled immediately upon completion by retailers trading and paying rent in shillings.
Industrial market: Speculative industrial development in Kampala still remains an excep-tion and not a norm. Most industrial construction is carried out by the end users for owner occupation with small amounts of excess accommodation being sublet. There is, however, a shortage of warehousing space in Kampala. However, with increased trade within the East African Community region, it is only a matter of time before demand increases.
•
•
•
17_Africa_Report09_Uganda.indd 35417_Africa_Report09_Uganda.indd 354 2/25/09 4:36:58 PM2/25/09 4:36:58 PM
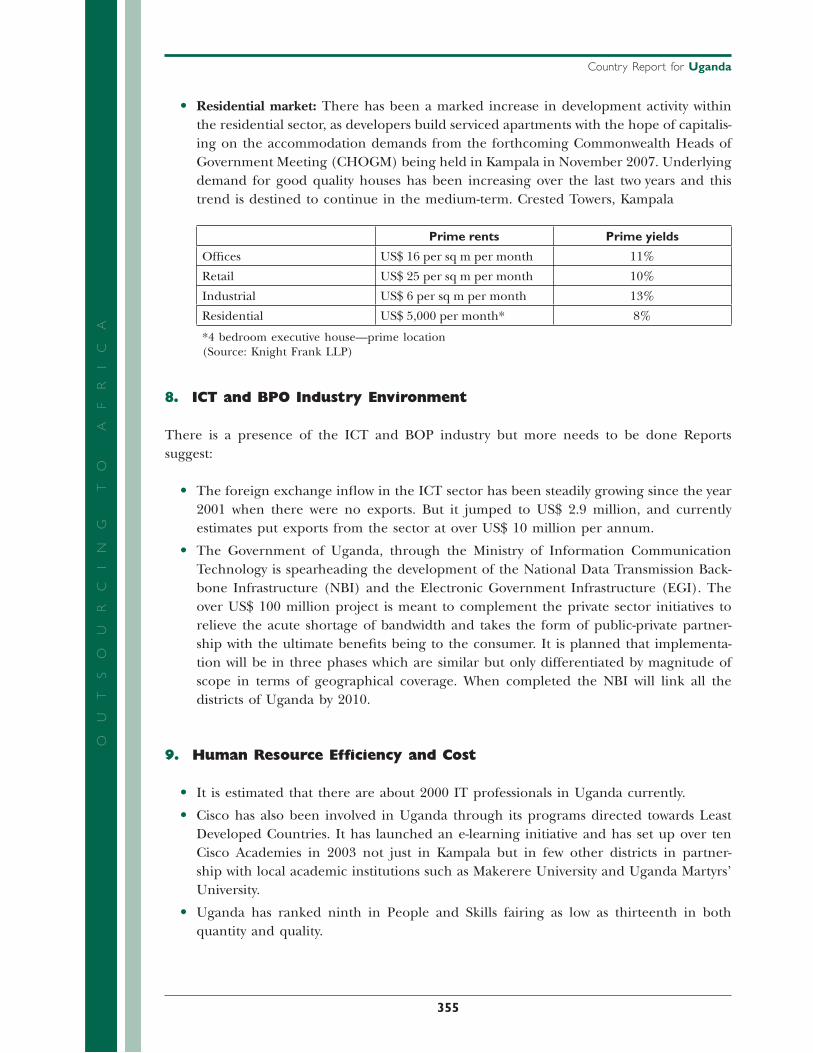
Country Report for Uganda
355
OU
TS
OU
RC
IN
G
TO
A
FR
IC
AResidential market: There has been a marked increase in development activity within the residential sector, as developers build serviced apartments with the hope of capitalis-ing on the accommodation demands from the forthcoming Commonwealth Heads of Government Meeting (CHOGM) being held in Kampala in November 2007. Underlying demand for good quality houses has been increasing over the last two years and this trend is destined to continue in the medium-term. Crested Towers, Kampala
Prime rents Prime yields
Offi ces US$ 16 per sq m per month 11%
Retail US$ 25 per sq m per month 10%
Industrial US$ 6 per sq m per month 13%
Residential US$ 5,000 per month* 8%
*4 bedroom executive house—prime location(Source: Knight Frank LLP)
8. ICT and BPO Industry Environment
There is a presence of the ICT and BOP industry but more needs to be done Reports suggest:
The foreign exchange infl ow in the ICT sector has been steadily growing since the year 2001 when there were no exports. But it jumped to US$ 2.9 million, and currently estimates put exports from the sector at over US$ 10 million per annum.
The Government of Uganda, through the Ministry of Information Communication Technology is spearheading the development of the National Data Transmission Back-bone Infrastructure (NBI) and the Electronic Government Infrastructure (EGI). The over US$ 100 million project is meant to complement the private sector initiatives to relieve the acute shortage of bandwidth and takes the form of public-private partner-ship with the ultimate benefi ts being to the consumer. It is planned that implementa-tion will be in three phases which are similar but only differentiated by magnitude of scope in terms of geographical coverage. When completed the NBI will link all the districts of Uganda by 2010.
9. Human Resource Effi ciency and Cost
It is estimated that there are about 2000 IT professionals in Uganda currently.
Cisco has also been involved in Uganda through its programs directed towards Least Developed Countries. It has launched an e-learning initiative and has set up over ten Cisco Academies in 2003 not just in Kampala but in few other districts in partner-ship with local academic institutions such as Makerere University and Uganda Martyrs’ University.
Uganda has ranked ninth in People and Skills fairing as low as thirteenth in both quantity and quality.
•
•
•
•
•
•
17_Africa_Report09_Uganda.indd 35517_Africa_Report09_Uganda.indd 355 2/25/09 4:36:59 PM2/25/09 4:36:59 PM

356
Country Report for Uganda
OU
TS
OU
RC
IN
G
TO
A
FR
IC
A10. Legal and Enforcement Issues
The Registrar of Patents awards patents for an initial period of fi fteen years, with a pos-sible fi ve-year extension if a request is made one month before expiry of the original term.
In terms of overall legislative risk Uganda is twelve out of fi fteen.
In terms of ICT security and enforcement of IPR and Cyber Laws it is thirteen out of fi fteen.
11. Labour & Expatriate Workers Permits
All applicants for work permits should be submitted to Immigration Department Headquar-ters. The applicant should obtain a fi le number within a period not exceeding fourteen working days. Thereafter the applicant checks to ascertain whether the application has been considered. Consideration of the permit does not exceed thirty working days.
12. Revenue, Tax & Repatriation Issues
Foreign Exchange Controls
Uganda has a fully liberalized foreign exchange regime with no restrictions on the move-ment of capital in and out of the country:
The 30 per cent import duties were recently reduced to 15 per cent and excise sur-charges have been unifi ed at 10 per cent. Further reductions are planned during the next two years. There is a VAT turnover of USH 50 million (roughly equivalent to $35,000) or more. The withholding taxes on dividends, interest, royalties, and other payments ranges from 4 per cent to 15 per cent for residents and 15 per cent to 20 per cent at 30 per cent for resident companies and 35 per cent for non-resident companies. Foreign investments also have accelerated depreciation incentives.
Foreign exchange based on a market-determined exchange rate can be freely pur-chased. The Investment Code guarantees that investors who have invested $500,000 can repatriate their investment exchange to pay debts incurred in the business. Uganda is a member of the Multilateral Investment Guaranty Agency (MIGA) and the International Centre for the Settlement of Investment Disputes available through commercial banks and credit institutions; the interest rate spread over deposit rate is high. Time periods for loan repayment are extremely short.
In terms of taxes and ease and cost of fi nance Uganda stands seventh and twelfth respectively.
•
•
•
•
•
•
17_Africa_Report09_Uganda.indd 35617_Africa_Report09_Uganda.indd 356 2/25/09 4:36:59 PM2/25/09 4:36:59 PM
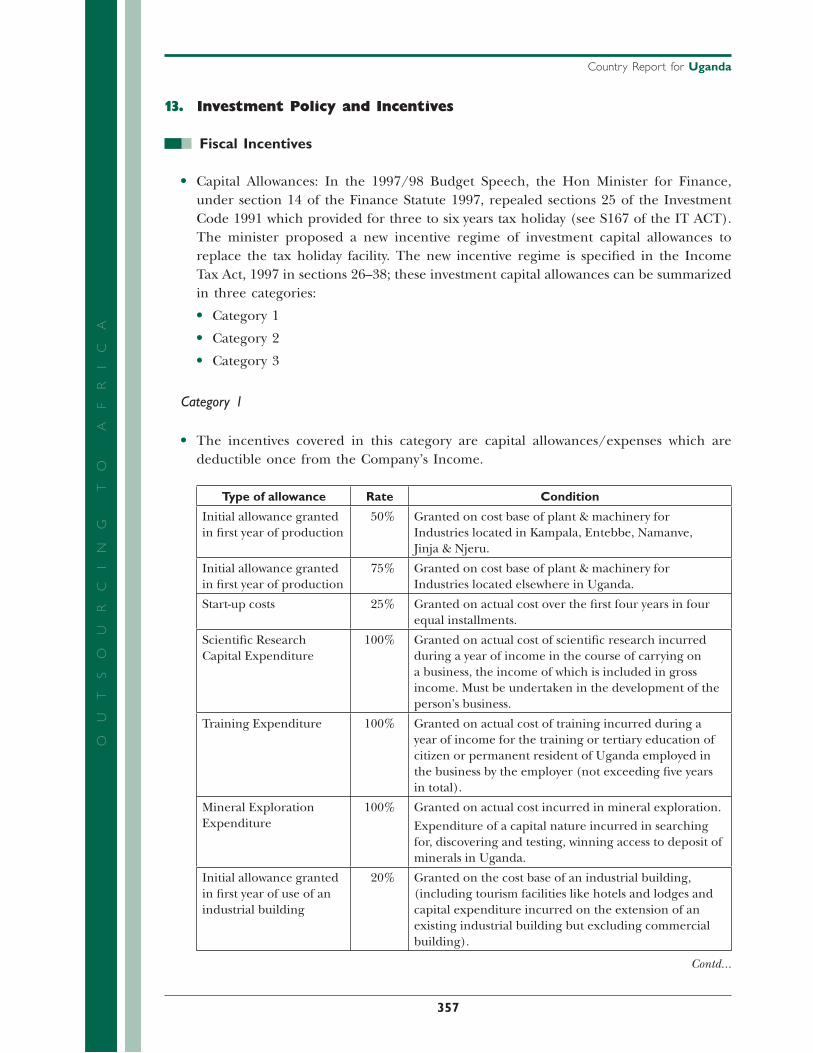
Country Report for Uganda
357
OU
TS
OU
RC
IN
G
TO
A
FR
IC
A13. Investment Policy and Incentives
Fiscal Incentives
Capital Allowances: In the 1997/98 Budget Speech, the Hon Minister for Finance, under section 14 of the Finance Statute 1997, repealed sections 25 of the Investment Code 1991 which provided for three to six years tax holiday (see S167 of the IT ACT). The minister proposed a new incentive regime of investment capital allowances to replace the tax holiday facility. The new incentive regime is specifi ed in the Income Tax Act, 1997 in sections 26–38; these investment capital allowances can be summarized in three categories:
Category 1
Category 2
Category 3
Category 1
The incentives covered in this category are capital allowances/expenses which are deductible once from the Company’s Income.
Type of allowance Rate Condition
Initial allowance granted in fi rst year of production
50% Granted on cost base of plant & machinery for Industries located in Kampala, Entebbe, Namanve, Jinja & Njeru.
Initial allowance granted in fi rst year of production
75% Granted on cost base of plant & machinery for Industries located elsewhere in Uganda.
Start-up costs 25% Granted on actual cost over the fi rst four years in four equal installments.
Scientifi c Research Capital Expenditure
100% Granted on actual cost of scientifi c research incurred during a year of income in the course of carrying on a business, the income of which is included in gross income. Must be undertaken in the development of the person's business.
Training Expenditure 100% Granted on actual cost of training incurred during a year of income for the training or tertiary education of citizen or permanent resident of Uganda employed in the business by the employer (not exceeding fi ve years in total).
Mineral Exploration Expenditure
100% Granted on actual cost incurred in mineral exploration.
Expenditure of a capital nature incurred in searching for, discovering and testing, winning access to deposit of minerals in Uganda.
Initial allowance granted in fi rst year of use of an industrial building
20% Granted on the cost base of an industrial building, (including tourism facilities like hotels and lodges and capital expenditure incurred on the extension of an existing industrial building but excluding commercial building).
Contd...
•
•
•
•
•
17_Africa_Report09_Uganda.indd 35717_Africa_Report09_Uganda.indd 357 2/25/09 4:36:59 PM2/25/09 4:36:59 PM

358
Country Report for Uganda
OU
TS
OU
RC
IN
G
TO
A
FR
IC
AType of allowance Rate Condition
Repairs and minor capital equipment
100% Granted on actual cost incurred in a year.
Expenditure on repair of property occupied or used for the business.
Cost of minor capital equipment (a depreciable asset costing less than fi fty currency points and functioning in its own right.)
•
•
Category 2
Deductible annual allowances: Depreciable Assets only (classes nine to four & farm works) (sixth schedule) under declining balance method per annum.
Class 1 40% Computers and data-handling equipment.
Class 2 35% Light automobiles (buses with less than thirty seater, of goods vehicles with a load capacity of less than seven tons).
Construction and earth-moving equipment.
Class 3 30% Heavy automobiles (buses with thirty or more seater, or goods vehicles designed to carry or pull seven or more tons).
Specialized trucks, trailers, tractors, plant & machinery used in farming, manufacturing & mining operations.
Class 4 20% All other depreciable assets (railroad cars, locomotives and equipment, vessels, tugs, and similar water transportation equipment, aircraft, specialized public utility plant, equipment and machinery, offi ce furniture, fi xtures & equipment, etc).
Farming Costs 20% Farm works, i.e., labour quarters, immovable building, other works necessary for the farm.
Category 3
Other annual depreciation allowances:
Industrial building allowance
5% Cost base net of initial allowance/deduction on a straight-line basis per annum on qualifying industrial building (includes approved commercial building, hotels, and hospitals).
Intangible assets
Varies Granted on cost of assets in equal annual installments over its useful life on condition that it has ascertainable useful life and value, e.g., leasehold, patents, royalties.
Horticulture 20% Granted on actual cost in four equal annual installments. Cost must be incurred on acquisition of horticultural plant and/or on construction of green-house.
The deductions covered under category 1 enable the investor to recover most of his costs in the fi rst year of operation. After applying the initial allowances, the cost base of an asset to which the initial allowance applies is reduced by the amount of the initial deduction allowed to get the written value of the asset at the end of the year of income, upon which, and in the subsequent years, deductions as shown in Categories 2 and 3 are
•
17_Africa_Report09_Uganda.indd 35817_Africa_Report09_Uganda.indd 358 2/25/09 4:36:59 PM2/25/09 4:36:59 PM
Country Report for Uganda
359
OU
TS
OU
RC
IN
G
TO
A
FR
IC
Aapplied until the plant/machinery, building, or equipment is completely written off. Each year, after allowing the deductions, the resulting Net Income is taxed at an appropriate rate of corporation tax.
1.2 Withholding Tax Exemptions
The following are exempt from withholding tax.
(a) a supply or importation of petroleum or petroleum products, including furnace oil, lubricants, other than cosmetics, and fabrics or yarn manufactured out of petroleum products;
(b) a supply or importation of plant and machinery;
(c) a supply or importation of human or animal drugs;
(d) a supply or importation of scholastic materials;
(e) importations by organizations within the defi nition of “exempt organization” in section 2 (bb)(i)(B);
(f) a supplier or importer–
(i) who is exempt from tax under this Act; or
(ii) who the Commissioner is satisfi ed has regularly complied with the obligations imposed on the supplier or importer under this Act; or
(g) the supply or important of raw materials
VAT registration: This is for those businesses, which qualify, that is, businesses going to supply taxable goods and services. VAT registration is either compulsory or volun-tary depending on your circumstances and the annual registration threshold is Ushs 50 million per annum. Voluntary registration is permissible under the law for those whose turnover is below the threshold but granted at the discretion of the Commis-sioner General. Where a person qualifi es for registration, a registration certifi cate is to be issued effective from the beginning of the period in which the duty to register arose (in case of compulsory registration) and/or effective from the beginning of the month immediately following the month in which the person applied S9 (3) (in case of voluntary registration).
Registration as an investment trader: An Investment Trader is a person approved by Uganda Investment Authority as an investor—local or foreign. For the purpose of VAT, the investor must have plans to make taxable supplies in due course in order to qualify for refund of input tax incurred during the investment period for a renewable period of four years. The Commissioner General will only register such an enterprise provided satisfactory evidence is produced supporting the intention to make taxable supplies. Registration as an Investment Trader allows one to claim a refund of input tax suffered in the period prior to making taxable supplies provided the period does not exceed two years. An Investment Trader shall abide by all the duties and obligations of a registered person, including the keeping of proper books of accounts and the fi ling of regular returns. A person shall cease to be an Investment Trader immediately after making a taxable supply in the course of business (see VAT Regulation 6).
•
•
17_Africa_Report09_Uganda.indd 35917_Africa_Report09_Uganda.indd 359 2/25/09 4:37:00 PM2/25/09 4:37:00 PM

360
Country Report for Uganda
OU
TS
OU
RC
IN
G
TO
A
FR
IC
ABenefi ts of VAT registration:
Able to recover the whole or part of the tax charged by your suppliers (input tax). This will lead to i. Reduced cost of input, ii. Improved profi ts, and iii. Competitive pricing.
A registered person can issue tax invoices to his customers who can then claim the tax charged.
Section 2a(3) & (4)
Upon registration, a person who has paid tax on taxable supplies or imports of goods, including capital assets, prior to registration, may claim the input tax paid or payable thereof. However, such a claim is only acceptable for goods acquired not more than six months prior to the date of registration. In addition such goods must be still in stock, hence the need of a detailed stock take on registration. This credit arises on the date of registration. NOTE that the input tax credit is claimed on a separate application form and not the fi rst VAT returns.
14. Government Agencies Giving Support to Outsourcing
Uganda Investment Authority for promoting and facilitating investment opportunities in the sector as well as being the focal point for the ICT exports Strategic Intervention Program, i.e., Promotion and Facilitation.
P.O. Box 7418 Kampala, Uganda
Tel: (+256) 414-301000; Fax: (+256) 414-342903
E-mail: [email protected]
Website: http://www.ugandainvest.com
Overall Assessment and Recommendations
Uganda is improving its ICT Infrastructure rapidly, yet it needs to look at the following to become an attractive outsourcing destination:
Improve enforcement of IPR and Cyber Laws.
Improve electricity and road and rail infrastructure.
Improve the ICT human resources in terms of suitability and quality.
Uganda may approach the Commonwealth Fund for technical cooperation or the Indian Technical Cooperation Fund ITEC for Africa or other donor agencies to seek assistance in getting a team to work out a strategy to become an attractive outsourcing destination.
•
•
•
•
•
•
•
•
17_Africa_Report09_Uganda.indd 36017_Africa_Report09_Uganda.indd 360 2/25/09 4:37:00 PM2/25/09 4:37:00 PM
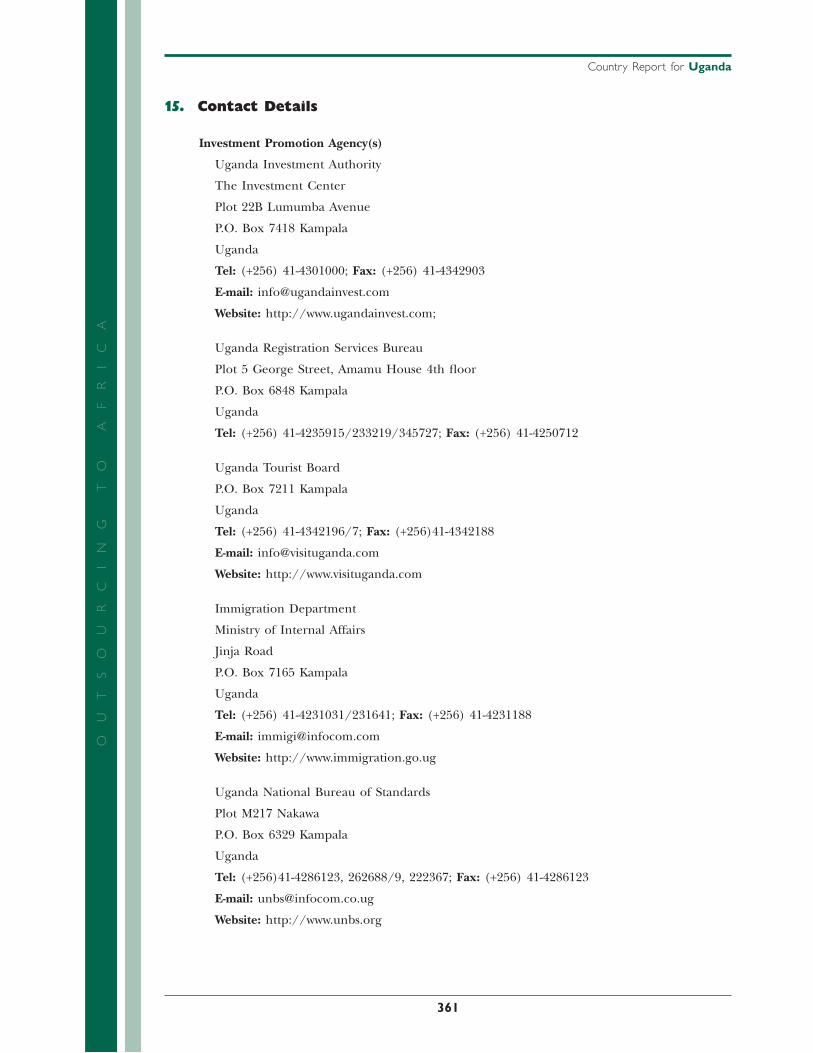
Country Report for Uganda
361
OU
TS
OU
RC
IN
G
TO
A
FR
IC
A15. Contact Details
Investment Promotion Agency(s)
Uganda Investment Authority
The Investment Center
Plot 22B Lumumba Avenue
P.O. Box 7418 Kampala
Uganda
Tel: (+256) 41-4301000; Fax: (+256) 41-4342903
E-mail: [email protected]
Website: http://www.ugandainvest.com;
Uganda Registration Services Bureau
Plot 5 George Street, Amamu House 4th fl oor
P.O. Box 6848 Kampala
Uganda
Tel: (+256) 41-4235915/233219/345727; Fax: (+256) 41-4250712
Uganda Tourist Board
P.O. Box 7211 Kampala
Uganda
Tel: (+256) 41-4342196/7; Fax: (+256)41-4342188
E-mail: [email protected]
Website: http://www.visituganda.com
Immigration Department
Ministry of Internal Affairs
Jinja Road
P.O. Box 7165 Kampala
Uganda
Tel: (+256) 41-4231031/231641; Fax: (+256) 41-4231188
E-mail: [email protected]
Website: http://www.immigration.go.ug
Uganda National Bureau of Standards
Plot M217 Nakawa
P.O. Box 6329 Kampala
Uganda
Tel: (+256)41-4286123, 262688/9, 222367; Fax: (+256) 41-4286123
E-mail: [email protected]
Website: http://www.unbs.org
17_Africa_Report09_Uganda.indd 36117_Africa_Report09_Uganda.indd 361 2/25/09 4:37:00 PM2/25/09 4:37:00 PM

362
Country Report for Uganda
OU
TS
OU
RC
IN
G
TO
A
FR
IC
ABank of Uganda
37/43 Kampala Road
P.O. Box 7120 Kampala
Uganda
Tel: (+256) 41-4258441/6, 341223; Fax: (+256) 41-4231549
Website: http://www.bou.or.ug
Uganda Manufacturers Association
Lugogo Show Grounds
P.O. Box 6966 Kampala
Uganda
Tel: (+256) 41-4221034/220831; Fax: (+256) 41-4220285
E-mail: [email protected]
Uganda Export Promotion Board
Conrad Plaza, 5th Floor
P.O. Box 5045 Kampala
Uganda
Tel/Fax: (+256) 41-4259779
E-mail: [email protected]
National Environment Management Authority
NEMA House, 3rd Floor
Plot 17/19/21 Jinja Road
P.O. Box 22255 Kampala
Uganda
Tel: (+256) 41-4251064/5/8; Fax: (+256) 41-4257521
Website: http://www.nemaug.org
Embassy of Uganda in China, France, Germany, India, UK, USA
Embassy of Uganda in China
5, San li tun Dong Jie
Beijing
Tel: (+86-10) 65321708/65321645/65322370; Fax: (+86-10) 65322242
Email: [email protected],[email protected]
Website: http://www.ugandaembassycn.org
Ugandan Embassy in Paris
Embassy of Uganda in France
13 Avenue Raymond Poincare
Paris
Tel: (+33) 1-56-90-12-20; Fax: (+33) 1-45-05-21-22
Email: [email protected]
17_Africa_Report09_Uganda.indd 36217_Africa_Report09_Uganda.indd 362 2/25/09 4:37:00 PM2/25/09 4:37:00 PM

Country Report for Uganda
363
OU
TS
OU
RC
IN
G
TO
A
FR
IC
AEmbassy of Uganda in Germany
Flat no. 0391, Heinrich - Heine Str. 18
Berlin
Tel: (+49-30) 24047556, 2060990; Fax: (+49-30) 24047557
Email: [email protected]
Website: http://www.uganda.de
Embassy of Uganda in India
B 3/26 Vasant Vihar
New Delhi
Tel: (+91-11) 26144413, 26145817; Fax: (+91-11) 26144405
Email: [email protected]
Ugandan Consulate in London
High Commission of Uganda
Uganda House
58/59 Trafalgar Square
London WC2N 5DX
United Kingdom
London
Tel: (+44-20) 78395783; Fax: (+44-20) 78398925
Email: [email protected]
Ugandan Embassy in Washington
Embassy of Uganda in Washington, United States of America
5911 16th Street, NW
Washington DC 20011
United States
Washington
Tel: (202) 726-7100; Fax: (202) 726-1727
Email: [email protected]
Website: http://www.ugandaembassy.com/
(offi ce hours: Monday through Friday, from 9:00 a.m. to 5:00 p.m. It closes for lunch, 1:00 p.m. to 2:00 p.m., Eastern Time)
Ugandan Consulate in Chicago
Consulate of Uganda in United States
Park Street P.O. Box 607
Chicago
Tel: (+1-708) 4815501; Fax: (+1-708) 4814519
17_Africa_Report09_Uganda.indd 36317_Africa_Report09_Uganda.indd 363 2/25/09 4:37:00 PM2/25/09 4:37:00 PM

364
Country Report for Uganda
OU
TS
OU
RC
IN
G
TO
A
FR
IC
AUgandan Consulate in New York
Permanent Mission of Uganda to the United Nations
336 East 45th Street
New York, NY 10017
USA
Tel: (+1-212) 949-0110/1/2/3; Fax: (+1-212) 687-4517
Email: [email protected]
Useful Links
The World Factbook 2007.
https://cia.gov/cia//publications/factbook/geos/us.html
‘Uganda National Report.’
Republic of Uganda: Ministry of Finance, Planning and Economic Development.
http://www.un.org/special-rep/ohrlls/ldc/MTR/Uganda.pdf
Country Profi les: Uganda. 2006.
DFID. http://www.dfi d.gov.uk/countries/africa/uganda.asp
Data & Statistics: Uganda. 2006. World Bank.
http://web.worldbank.org/WBSITE/EXTERNAL/COUNTRIES/AFRICAEXT/UGANDAEXTN/0,,me NuPK: 374963~pagePK: 141132~piPK: 141109~theSitePK: 374864, 00.html
Country Fact Sheets: Uganda. “Human Development Report.” 2006. UNDP.
http://hdr.undp.org/hdr2006/statistics/countries/country_fact_sheets/cty_fs_UGA.html
Ward, M., A. Penny, and T. Read. “Education Reform in Uganda – 1997 to 2004: Refl ections on Policy, Partnership, Strategy and Implementation.” 2006. DIFD.
http://www.dfi d.gov.uk/pubs/fi les/education-reform-uganda-60.pdf
“The Education Sector Annual Performance Report 2005–2006.” Education Planning Department, Ministry of Education and Sports.
http://www.education.go.ug/Final%20ESAPR%202006.htm
Ayoo, P.O. “A National Distance Education Solution for Uganda.” 2003. Inter-University Council for East Africa.
https://host110.jolis.net:8443/sitepreview/http/iucea.org/downloads/DE_Solution_%20Uganda.doc
17_Africa_Report09_Uganda.indd 36417_Africa_Report09_Uganda.indd 364 2/25/09 4:37:01 PM2/25/09 4:37:01 PM
Country Report for Uganda
365
OU
TS
OU
RC
IN
G
TO
A
FR
IC
ANational Council for Higher Education.
http://www.unche.or.ug/content/view/50/80/
“National Information and Communication Technology Policy.” 2003. Ministry of Works, Housing and Communications.
http://www.ucc.co.ug/nationalIctPolicyFramework.doc
The National ICT Master Plan and E-Government Network Feasibility Study was submitted by MEGA-TECH, Inc., in August 2006. In addition to outlining a master plan, it provides a
Comprehensive summary of the process of ICT policy development in the country.
http://www.wougnet.org/ICTpolicy/ug/docs/NationalICTMasterPlan_FinalReport9.1.2006.pdf
These comments are based on an interview with staff from the National Planning Authority as well as the Ministry of Education and Sports in connection with an evaluation of the NEPAD e-Schools Demonstration project. October 2006.
Tusubira, F.F., I. Kaggwa, and J. Ongora. “Uganda,” Towards an African e-Index: ICT: Access and Usage 2005. 2005. reserachICTafrica.net.
http://www.researchictafrica.net/modules.php?op=modload&name=News&fi le=article&sid=504&CAMSSID=e6501939a722422e76cfe7915ff21cdc
Uganda Communications Commission.
http://www.ucc.co.ug/rcdf/default.php
The sources of these data are the World Bank ICT at a Glance.
(http://devdata.worldbank.org/ict/uga_ict.pdf) and the Uganda Communications Commission.
http://www.internetworldstats.com/stats1.htm
Eremu, J. “ICT Connectivity in Schools in Uganda.” 2005. I-Connect Online.
http://www.iconnectonline.org/Articles/iconnectarticles.2005-05-3
Aguti, J.N. and W.J. Fraser. “Integration of Information Communication Technologies (ICTs) in The Distance Education Bachelor of Education Programme, Makerere University, Uganda.” July 2006. Turkish Online Journal of Distance.
Obot, D., F. Kintu, and L. Elder. “The Uganda Knowledge and Information Society: Early Lessons from ICT Projects,” in At The Crossroads: ICT Policymaking in East Africa. 2005. IDRC.
http://www.idrc.ca/en/ev-93065-201-1-DO_TOPIC.html
Farrell, G.M. and C. Wachholz, eds. 2003. ICT in Education: Meta-Survey on the Use of Technologies in Asia and the Pacifi c. UNESCO.
http://www.unescobkk.org/index.php?id=1225
17_Africa_Report09_Uganda.indd 36517_Africa_Report09_Uganda.indd 365 2/25/09 4:37:01 PM2/25/09 4:37:01 PM

366
Country Report for Uganda
OU
TS
OU
RC
IN
G
TO
A
FR
IC
AEtta, F.E. and L. Elder, eds. 2005. At The Crossroads: ICT Policy Making In East Africa. IDRC.
http://www.idrc.ca/openebooks/219-8/
Nyaki Adeya, C. and B. Oyelaran-Oyeyinka. 2002. The Internet in African Universities: Case Studies from Kenya and Nigeria. United Nations University, Institute for New Technologies
Murray, Lize. “AVU Gap Analysis Report: August 2005.” 2005. Prepared for the Hewlett Foundation OdeL Initiative.
http://www.avu.org/acep.asp
17_Africa_Report09_Uganda.indd 36617_Africa_Report09_Uganda.indd 366 2/25/09 4:37:01 PM2/25/09 4:37:01 PM

A R e l a t i v e R a n k i n g o f 1 5 C o u n t r y L o c a t i o n sOUTSOURCING TO AFRICA
OU
TS
OU
RC
ING
TO
AF
RIC
A A
Re
lative R
ankin
g of 1
5 C
ou
ntry L
ocatio
ns


![ABSTRACT H arXiv:2002.01053v3 [cs.CV] 7 Jun 2020 · Chirag Agarwal, Shahin Khobahi, Arindam Bose, Mojtaba Soltanalian, Dan Schonfeld Department of Electrical & Computer Engineering,](https://img.dokumen.tips/doc/110x75/5f0c6a0a7e708231d4354849/abstract-h-arxiv200201053v3-cscv-7-jun-2020-chirag-agarwal-shahin-khobahi.jpg)