Embed Size (px)
Citation preview

1
Metrics That Your CEO Cares About
© Dr John Sullivan
Go to www.drjohnsullivan.com for a copy of these slides

3 goals for today’s presentation
2
¾My primary goal is to get you to re-think and to challenge your current metrics approach
¾Another goal is… to clearly demonstrate the difference between… a “so what” metric approach & a Omg actionable business impact metric (Where a CEO Omg metric is… 1) attention getting because of its rev. impact, 2) it drives action & 3) that action measurably improves corp. revenue!
¾A third goal is… to show you the high revenue impact HR areas that most CEO’s would want to know about (through metrics) Please interrupt and ask questions at any time

Let’s begin with a CO quote
3

I was happy with our HR approach…
But now… “I want that one”
CEO of General Mills

Let’s look at an illustrative example
Showing the difference between “so what”
and “Omg … I must take action” metrics
5

6
Which metric would a CEO want to know about?
Hiring costs (CPH) are a one-time .001% cost item
CPH $ returns & rev. impacts of a new-hire last for years
LeBron vs. Homer Simpson
“So what” Omg
But the revenue impact of a great or a weak hire… lasts for years! (VW or Wells Fargo)

7
CEO’s would want to know about…
the performance differential between new-hires What is the % of increased output added by top performers? ¾ The top 1% of your workforce produce what % of
your total output? ¾ The top 5% produce An innovator produces what “multiple” more? (i.e. How many times more than the average new-hire in the same job? - 10 times the average - 25 times more than average employee - 300 times more than the average
GE, Netflix & Yahoo
10% (or 10 times their expected output)
Apple Google
26% (over 5X their expected output) (U of Indiana study by O’Boyle and Aguinis)
Conclusion: there may be an 80/20 rule when it comes to employee performance… so you should prioritize your employees

Also focus your hiring on high priority jobs… to maximize your visible revenue impacts
Jobs with the highest revenue impact (not costs) 1. Hire the top sales managers 2. Hire top people in revenue generating positions 3. Hire top people that are innovators 4. Hire the best in product development positions 5. Hire great executives & managers 6. Hire the top recruiters of salespeople Also 7. Hire into already measured jobs ($ or quantified) 8. Hire the best away from your competitors 9. Hire those that also have leadership capabilities 10.Hire top people that stay longer 11.Hire those with a high career trajectory

9
CEO’s would want to know… the tremendous cost of weak hires and employees ¾ A weak employee causes errors and disruptions
each year up to ___ times their annual salary (Source: O’Boyle and Aguinis, U of Indiana)
¾ Weak employees take up a manager’s time, so a manager must… spend what % of their time dealing with them
¾ Toxic employees make their teammates what % more likely to quit (Source: Cornerstone Selection survey)
¾ Replacing a weak manager equals the impact of adding 1… to an 8 person team Source: National Bureau of Economic Research
¾ Bad ones stay forever… weak hires may stay 20 years, multiplying their negative impacts
2 ¼
1 day a week (17%) (Source: Robert Half) 54

So the #1 fault in metric selection has been…
Selecting metrics that are not on the top
of list of HR problems/opportunities…
with the highest $ of revenue impact
10

The Omg approach also changes how you report metrics…
For example…
just changing the way turnover is reported… changes it from a “so what”
metric… into a Omg! metric
11

Here is a standard turnover report 1. Last year we had a 18% turnover rate
2. Among that 18%... 98 salespeople left
3. But we aren’t concerned… because it seems like
every firm in our industry is having sales turnover problems
Th a t’s i nteres ting… but “s o wh a t?” 12
CEO’s care about metrics that… show them that they must act immediately

This 10 point quantified reporting approach is guaranteed… to get a CEO’s attention
With the CFO, we calculated actual turnover costs 1. The sales job is #1 in revenue impact (the metric selection criteria)
2. Of the 98 that quit… 26% were top-ranked performers 3.At 3X salary for average and 4X for top performers,
the initial revenue loss was $30.3 mil. 4. In vacant sales territories, we lost 4… $10 mil customers 5.Also the turnover resulted in 303 sales vacancy
days @ $4000 per day (a loss of $1.2 mil.) 6.And new-hires performed 8% below those they
replaced ($80k (8% of $1 mil.) X 98 = $79 mil. a yr.) 7. 50% was preventable & 26% went to competitors 2x 8.Total cost $166 mil or 6.2 % of corporate rev. 9.The projected turn for next year is up 10% 10. BTW the stay interview tool cut’s turnover in ½
13

As a foundation… let’s understand HR’s potential
Jack Welch, former CEO of GE and Fortune’s “Manager of the Century” has made HR’s potential crystal clear…
“When it is used appropriately”, HR… “is the most
important department of a company” Source : https://blog.kissmetrics.com/winning-and-profitability/
14

But are we using HR appropriately?
15

16
Almost everyone agrees that HR must… become more strategic
When CEO’s and board-level executives rank strategic business functions… Which one is listed as the most strategic?
Sales
Where was HR ranked on the list?
“The least strategic function”
Source: DDI survey

17
Almost everyone agrees that HR must… increase its business impacts
Of the 18 business factors that contributed the most to business outcomes… #1 - With the highest impact was… Reducing operational cost structures And talent was ranked… “Talent was dead last” (#18 out of 18) (Source: KPMG / HfS research)

18
What percent of CEO’s have faith in HR metrics?
Unfortunately, “Only 12% of CEO’s are confident with the quality of Human Capital metrics”
AICPA survey
BTW… C- Level execs. rated “new hire quality” as the most important performance metric (Source: Survey by staffing.org)

19
Where does HR rank among functional metric users?
1.R&D 13.2% 11.4% 2.Executive team 12.4% 8.8% 3.Finance 12.2% 5.7% 4.Operations 10% 8.3% 5.Marketing 9.1% 9.4% 6.Sales 5.3% 11.4% 7.HR 4.4% 16.7% Learning: compared to the executive team, HR has only 1/3 of the experts and double the number of poor users
Source: AMA/i4cp 2013 Conquering Big Data
Rank in analytical ability Experts Poor

20
Where do executives rate our effectiveness in… “making a business case” and predictive metrics?
(13 out of 13) (12th out of 13)

21
CEO’s care about… the strategic challenges that they face
What are the top global business challenges according to CEO’s?
• Operational Excellence • Customer Relationships • Regulation and Risk • Corporate Brand and Reputation • Innovation and Digitalization • Human Capital • Sustainability
Source: The Conference Board survey of CEO’s 2016

22
HR is #1 in the challenges they care about
CEO’s are watching us (The top CEO challenges) 1.Human Capital 2.Customer Relationships (tied)
2.Corporate Brand and Reputation (tied) 4.Operational Excellence 5.Innovation and Digitalization 6.Regulation and Risk 7.Sustainability
Would you agree it’s time for bold changes… when we are still the top challenge after 4 years? Source: The Conference Board survey of CEO’s 2016
4 of the 5 top challenges require outstanding employees
For the fourth year in a row

The 3 basic categories of HR metrics
(and 2 of them stink)
23
Part I

So what metrics
They generate no action or interest on the part of a CEO
The first category of HR metrics are…
25
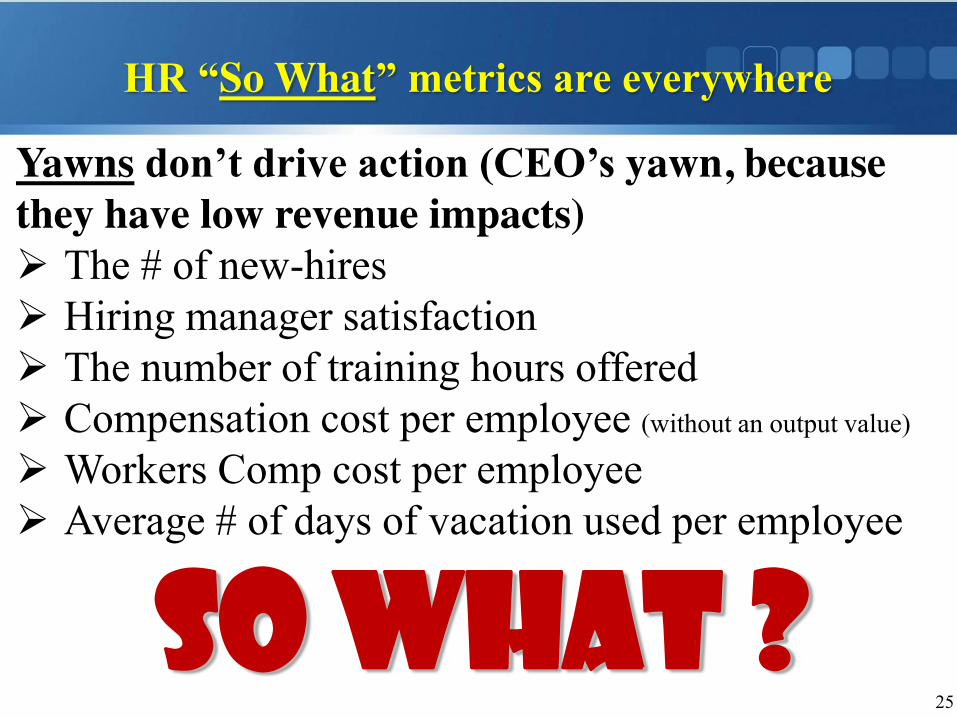
HR “So What” metrics are everywhere
Yawns don’t drive action (CEO’s yawn, because they have low revenue impacts) ¾ The # of new-hires ¾ Hiring manager satisfaction ¾ The number of training hours offered ¾ Compensation cost per employee (without an output value)
¾ Workers Comp cost per employee ¾ Average # of days of vacation used per employee So what ?

“is a high or low number
better” metric?
They confuse a CEO
Now shifting to the 2nd kind of bad metric

27
“Is a high or a low number better”?
1.Cost Per Hire – cheap may mean low quality hires
2.Time to Fill – fast hiring might be careless hiring
3. Benefit Costs – do lower benefits hurt rec. / retention?
4.Absence Rate – coming to work sick is expensive
5.Tenure – don’t costs go up with tenure? (performance)
6.Turnover – what could a low turnover # mean Source: Unicorn HRO

Lets shift to…
OMg metrics
Report a metric in the HR areas that have the highest rev. impact (productivity / innovation)
The best category of metrics

Let’s compare the workforce productivity in high-tech – Rev. per ee # Average in this industry $211,000 IBM $212,000 (Average) HP-E $212,000 (Average) Amazon $555,000 (Nearly 2 ½ times the average) Microsoft $745,000 (Nearly 3 ½ times the average) Google $1,380,000 (Nearly 6.5 times the average) Apple Facebook Key learning – Facebook can produce the same revenue
as IBM with nearly 8X fewer workers 29 Source: MarketWatch.com 11/5/16
$1,850,000 (Nearly 8 ¾ times the average) $1,940,000 (Nearly 9 ¼ times the average))
CEO’s care about… the returns from their labor investments

What are the HR programs that cause
this huge productivity differential?
But in case your firm hasn’t already done those calculations…
The Boston Consulting Group has provided us with some ranked benchmark data
30

31
HR leaders must know and focus on… the highest impact HR programs
Pick the top & bottom 3 HR programs based on their impact on revenue and profit 1. Managing flexibility and labor costs 2. Restructuring the organization 3. Managing work/life balance 4. Managing an aging workforce 5. Employee engagement 6. Managing change and cultural transformation 7. Recruiting 8. Retention 9. Managing talent for productivity and innovation 10.Employer branding

Focus on the HR sub-functions that have
the highest business impacts
32 Source: BCG/WFPMA - From Capability to Profitability: Realizing the Value of People Management
Which HR area normally has the highest impact on rev. & profit?

Other Omg high revenue impact areas
that CEO’s want metrics on…
34
OMG

35
Firms made Fortune list 3 out of 10 yrs. (109%) vs. S&P (10%) Source: BCG
S&P
“People companies” outperform by 10 times
CEO’s would want to know that… People companies outperform the S&P

36
CEO’s care about… only the factors that increase business results
Workforce analytics is a major contributor to results The Harvard Business Review concluded that… advanced users of workforce analytics produced much higher business performance:
¾ Profitability - a 65% increase in performance ¾ Growth - a 65% increase in performance ¾ Productivity - a 64% increase in performance ¾ Customer satisfaction – a 71% performance increase
(* when compared to the performance of competitor firms that were less effective in the use of analytics)

The new approach to metrics is called…
“Business Impact Data-driven” HR
37
Part III

Google is the benchmark firm to follow
“All people decisions are based on data & analytics” ¾ “We apply the same level of rigor, analysis and
experimentation on people as we do the tech side”
Source: Google 38

What is business impact data-driven HR?
¾A strategic forward-looking approach to HR (vs. the current historical metrics)
¾It replaces HR’s all too common reliance on… opinions, intuition, hunches, trial & error learning & automatically continuing on with past practices
¾It instead relies on… data, facts, analysis, charts, metrics, algorithms, statistics, & predicted trends… to improve the accuracy, speed and the business impacts of key HR decisions
¾It shifts to real-time and predictive metrics 39

40
Improvement tips
Tips for improving your metrics 1. Build a compelling business case for your effort 2. Reject metrics in an area w/ a low revenue impact 3. Report metrics inside standard financial reports 4. Only report strategic metrics and limit the number
(between 3 and 7) 5. Develop a process for “just-in-time alerts” to give
managers a heads up 6. Calculate the cost of a delay or doing nothing 7. Pretest your metrics to ensure that they cause
alarm and drive action

41
10 metric components that drive CEO’s to act 1. Only report metrics with the highest bus. impacts 2. Add a stoplight icon to show urgency 3. The corporate strategic goal that is impacted 4. The problem is converted into dollars 5. Provide predictive and forward-looking metrics 6. Add a visual trend line revealing a neg. trajectory 7. Provide comparison numbers for each metric 8. Executive want to know “why” (the root causes of problems)
9. Provide a list of the prescribed solutions… and their costs, time required and likely success rate
10.Identify the accountable individual 11.Distribute ranked metrics widely to get noticed
CEO’s care about metrics that… drive them to act immediately

An example… of an actionable predictive analytic display
42

Source: Workday Insights Retention Analytics
An example - Distribute ranked/quantified metrics (retention flight risk)
43

The top 7 strategic HR metrics to report to your CEO
44
Part IV

45
Strategic HR metrics – Revenue per employee
1. Revenue per employee - for measuring the productivity & innovation of your workforce
• Accepted by the CFO – this is the standard workforce productivity metric
• Output focus – it focuses is on the value of the output of a firm’s workforce (revenue dollars)
• The most productive firms – produce a higher # • The formula – the total yearly corporate revenue
divided by the average number of FTE employees • It is easily comparable – it utilizes publicly
available information to compare firms in the same industry (found at MarketWatch.com)

47
Strategic HR metrics – Quality of hire
2. The improvement in the performance of new hires (quality of hire improvement)
• Hiring better performers increases team productivity - if you hire a volume of new employees, if each one performs a % better than those they replace, the productivity of the team improves
• Focus on already measured jobs – don’t measure all jobs, instead focus on those jobs that are already measured in dollars or quantified with numbers
• Use performance appraisal scores as an alternative – the percentage improvement in performance appraisal scores can also be utilized

48
Strategic HR metrics – Quality of hire
Report the quality of hire (continued) • Q of H is a delayed measure – where after 6/12
months on the job… you compare the performance of the new hire to the performance of the employee they replaced… you report the % of improvement
• Add new hire retention – as a companion measure you can calculate the voluntary turnover rate of new hires during their first six months
• Add diversity hires – a companion measure is to calculate the % of diversity hires in key positions
• $ impact – calculate the total $ impact from the improved performance of all new hires during the year

49
Strategic HR metrics – Performance turnover
3. Performance turnover in key jobs • Losing top performers in key jobs is expensive –
double-digit turnover is not rare so it’s important to measure the % of employees that voluntarily quit each month and over the whole year
• Focus on key jobs – it’s important to focus only on key jobs with high business / revenue impacts
• Weight the turnover by performance – because losing top performers is more expensive, put a weight (the % that the departed individual performed above the average) so that top performer turnover counts more then low performer turnover

50
Strategic HR metrics – Performance turnover
Performance turnover in key jobs (continued) • Also report the dollar impact – calculate and
report the total dollar impact from top performer turnover in key jobs

51
Strategic HR metrics – Performance turnover
4. $’s of revenue lost due to position vacancy days • No revenue is generated when a position is
vacant – when an employee quits, there is a loss of productivity & revenue until the position is filled… With slow hiring those “vacancy days” increase
• Focus on revenue-generating positions – the highest impact from vacancy days occurs in revenue jobs… so focus your measure on them
• Calculate the $ loss per day – determine the amount by dividing the average total yearly revenue in the job by the number of working days
• Report – the decrease in vacancy days and the $ reduction in the amount of lost revenue
52
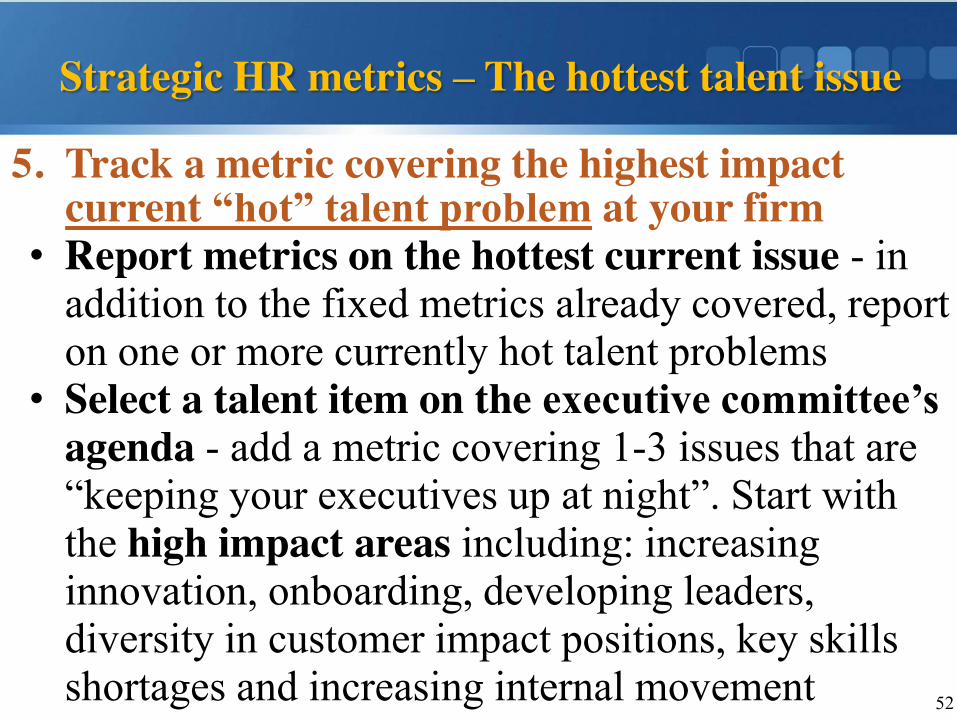
Strategic HR metrics – The hottest talent issue
5. Track a metric covering the highest impact current “hot” talent problem at your firm
• Report metrics on the hottest current issue - in addition to the fixed metrics already covered, report on one or more currently hot talent problems
• Select a talent item on the executive committee’s agenda - add a metric covering 1-3 issues that are “keeping your executives up at night”. Start with the high impact areas including: increasing innovation, onboarding, developing leaders, diversity in customer impact positions, key skills shortages and increasing internal movement

53
Strategic HR metrics – Contribution to productivity
6. Survey to identify “Which HR programs helped me to increase my productivity?”
• A survey is cheap and effective – you can best determine the impact of individual HR programs through a survey of managers and employees
• Rate their impact – survey a sample of managers and employees… and ask each how much each HR program contributed to their reaching their productivity goals. Utilize a 1 to 10 scale with a 10 indicating that the function exceeded their expected contribution
• Areas to cover –cover recruiting, retention, innovation, training, compensation, leadership development, internal movement, performance management, onboarding, benefits, and diversity

54
Strategic HR metrics – Contribution to productivity
Survey “Which HR programs helped me to increase my productivity?” (continued) • Also ask for $ impact - for any rating of eight or
lower, ask the surveyed person to estimate the $ amount of their reduced productivity
• Survey every 6 / 12 months – conduct a survey at least once a year… and every six months if the results of the last survey were negative

55
Strategic HR metrics – HR strategic goals met
7. The % of HR strategic goals that were met • Report the % of goals met – it’s important for all
strategic functions meet their goals. So the HR function should report to executives the percentage of its strategic goals that were met or exceeded
• List the percentage of target met – HR should also list the percentage of the target that was reached for each of its top five goals
• Report at 6 / 12 months – halfway through and also at the end of every fiscal year report on HR’s goal attainment

Hot areas that CEO’s would want metrics in…
If they knew their cost or their impact on
productivity/ innovation
So consider metrics in each of these areas
56
Part V
57
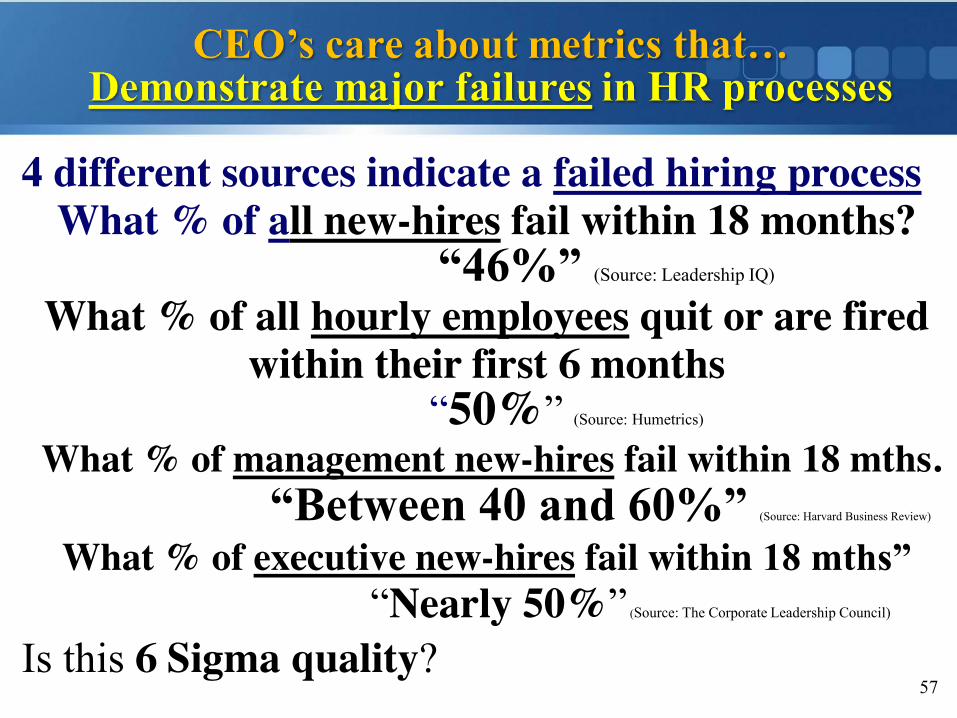
4 different sources indicate a failed hiring process What % of all new-hires fail within 18 months?
“46%” (Source: Leadership IQ)
What % of all hourly employees quit or are fired within their first 6 months
“50%” (Source: Humetrics)
What % of management new-hires fail within 18 mths. “Between 40 and 60%” (Source: Harvard Business Review)
What % of executive new-hires fail within 18 mths”
“Nearly 50%” (Source: The Corporate Leadership Council)
Is this 6 Sigma quality?

59
CEO’s would want to know… how HR improved new-hire performance
Footlocker improved new hire performance
¾ Used applicant data from an on-line assessment to more accurately select interview slates
¾ To increase commitment, HR, sales and finance were also involved to support the bus. case
Results from the pilot ¾ Double digit increase in sales-per-hour ¾ Double-digit reduction in staff turnover ¾ Managers also reviewed fewer applicants, (From
as many as 300 to as few as 3 per opening) Source: Talent Management 12/4/15

CEO’s would want to know… slow hiring loses performers and innovators
60
¾ "If you have complex online job applications, you're going to lose top talent
¾The typical fortune 500 company loses 9 out of 10 qualified applicants to these unwieldy processes
¾Netflix’s process takes only 1 minute, Salesforce (3 minutes), Intel (4 minutes) and Apple (5 minutes)”
Source: Officevibe.com
Source: Indeed 2016 survey

61
CEO’s would want to know… the actual impact on applications from your EB
Employer Brand metric – applications per employee ¾ EB goal – the purpose of an employer brand is to
increase the # of applications for your jobs
¾ The top benchmark target – Google receives nearly 3 million applications for 61,000 employees (the ratio of 52 to 1)
¾ The average target – the # of applications each week should equal your number of employees

What is the #1 predictive strategy for global
financial performance? “Building an inclusive culture”
Does gender or racial diversity impact sales revenue?
Source: Bersin by Deloitte
CEO’s care about metrics that… Demonstrate future business success factors
62

CEO’s would want to know… the elements that increase innovation
Google has an algorithm for increasing innovation
(i.e. a formula)
63
Innovation = Discovery + Collaboration +Fun!
Source: K M World Magazine Webinar 2008
(i.e. learning)
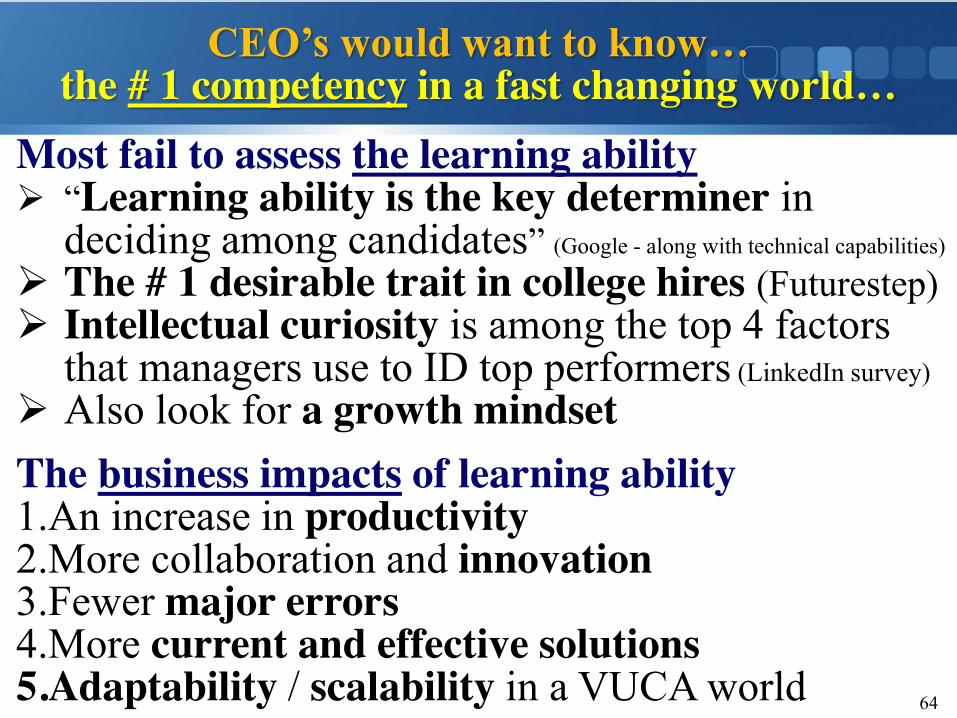
CEO’s would want to know… the # 1 competency in a fast changing world…
Most fail to assess the learning ability ¾ “Learning ability is the key determiner in
deciding among candidates” (Google - along with technical capabilities)
¾ The # 1 desirable trait in college hires (Futurestep) ¾ Intellectual curiosity is among the top 4 factors
that managers use to ID top performers (LinkedIn survey) ¾ Also look for a growth mindset The business impacts of learning ability 1.An increase in productivity 2.More collaboration and innovation 3.Fewer major errors 4.More current and effective solutions 5.Adaptability / scalability in a VUCA world
64

CEO’s would want to know… that you can improve the performance of 75% of your worst managers
Google’s “project oxygen" showed it was possible “to improve 75% of our worst-performing managers” with these 8 actions Source: L. Bock 8. Have key technical skills to advise the team (not #1) 7. Have a clear vision and strategy for the team 6. Help your employees with career development 5. Be a good communicator & listen to your team 4. Don’t be a sissy; Be productive / results-oriented 3. Show interest in their success & personal well-being 2. Empower your team and don’t micromanage 1. Be a good coach – hold regular one-on-one’s and
provide personalized constructive feedback 65

CEO’s would want to know… which key employees are soon to quit
Google uses predictive metrics to ID who might quit ¾Employee reviews ¾ Promotion history ¾ Pay history ¾Employee surveys ¾ Peer reviews (360 degree) ¾Employee training ¾Leadership meetings
They look for employees who “feel underused” 66

CEO’s would want to know… the hidden cost-cutting costs in other departments
Most miss the costs of unintended consequences… That occur later in the budgets of other departments Froze safety training (Saved $50,000… in the training department’s budget) But track “other department’s added costs” after 1 yr. (i.e. other pocket costs) Safety dept. – Accident rates doubled -$400,000 Insurance – Insurance rates up 23% -$187,000 Operations – Turnover of employees +15 - $89,000 Other not-tracked dept. budget costs - $676,000
67

68
CEO’s would want to know… if HR improved new-hire time to productivity
½ of the managers of new hires were sent a JIT on-boarding email… The email reminded the managers to do 5 things 1.Have a discussion on their role and responsibilities 2.Match your new hire with a peer buddy 3.Help your new-hire build a social network 4.Set check-ins once a month for their first 6 months 5.Encourage an open dialogue Bus impact $ – new hires of the “reminded managers” had a 25% increase in speed (weeks to min. new-hire productivity)… compared to the control group Source: Laszlo Bock Google
a control group got no reminders

69
www.drjohnsullivan.com or [email protected]
Did I make you think?
Please connect with me on LinkedIn