Embed Size (px)
Citation preview

UNITED STATESSECURITIES AND EXCHANGE COMMISSION
Washington, D.C. 20549
FORM 10-K
[X] Annual Report Pursuant to Section 13 or 15(d) of the Securities Exchange Act of 1934For the fiscal year December 31, 2001.
[ ] Transition Report Pursuant to Section 13 or 15(d) of the Securities Exchange Act of 1934For the transition period from to .
Commission file number 0-19969
ARKANSAS BEST CORPORATION(Exact name of registrant as specified in its charter)
Delaware(State or other jurisdiction ofincorporation or organization)
71-0673405(I.R.S. Employer
Identification No.)
3801 Old Greenwood Road, Fort Smith, Arkansas(Address of principal executive offices)
72903(Zip Code)
Registrant’s telephone number, including area code 479-785-6000
Securities registered pursuant to Section 12(b) of the Act:
None(Title of Class)
Securities registered pursuant to Section 12(g) of the Act:
Name of each exchange Title of each class on which registered
Common Stock, $.01 Par Value ....................................................................... Nasdaq Stock Market/NMS
Indicate by check mark whether the registrant (1) has filed all reports required to be filed by Section 13 or 15 (d) of the Securities Exchange Act of 1934 during the preceding 12 months (or for shorter period that the Registrant was required to file such reports) and (2) has been subject to such filing requirements for the past 90 days. Yes [X] No [ ]
Indicate by check mark if disclosure of delinquent filers pursuant to Item 405 of Regulation S-K is not contained herein, and will not be contained, to the best of registrant’s knowledge, in definitive proxy or information statements incorporated by reference in Part III of this Form 10-K or any amendment to this Form 10-K [ X].
The aggregate market value of the voting stock held by non-affiliates of the Registrant as of February 25, 2002, was $579,133,549.
The number of shares of Common Stock, $.01 par value, outstanding as of February 25, 2002, was 24,594,115.
Documents incorporated by reference into the Form 10-K:
1) The following sections of the 2001 Annual Report to Stockholders:
- Market and Dividend Information- Selected Financial Data- Management’s Discussion and Analysis of Financial Condition and Results of Operations- Quantitative and Qualitative Disclosures About Market Risk- Financial Statements and Supplementary Data
2) Proxy Statement for the Annual Stockholders’ meeting to be held April 24, 2002. INTERNET:www.arkbest.com
1

ARKANSAS BEST CORPORATION
FORM 10-K
TABLE OF CONTENTS
ITEM PAGENUMBER NUMBER
PART I
Item 1. Business .................................................................................................................... 3Item 2. Properties ................................................................................................................... 9Item 3. Legal Proceedings ...................................................................................................... 10Item 4. Submission of Matters to a Vote of Security Holders .................................................. 10
PART II
Item 5. Market for Registrant’s Common Equity and Related Stockholder Matters ................. 11Item 6. Selected Financial Data .............................................................................................. 11Item 7. Management’s Discussion and Analysis of Financial Condition
and Results of Operations ......................................................................................... 11Item 7A. Quantitative and Qualitative Disclosures About Market Risk....................................... 11Item 8. Financial Statements and Supplementary Data ........................................................... 11Item 9. Changes in and Disagreements with Accountants on
Accounting and Financial Disclosure ........................................................................ 11
PART III
Item 10. Directors and Executive Officers of the Registrant ...................................................... 12Item 11. Executive Compensation ............................................................................................ 12Item 12. Security Ownership of Certain Beneficial Owners and Management ........................... 12Item 13. Certain Relationships and Related Transactions .......................................................... 12
PART IV
Item 14. Exhibits, Financial Statement Schedules, and Reports on Form 8-K ........................... 13
2

PART I
Except for historical information contained herein, the following discussion contains forward-looking statements that involve risks and uncertainties. Arkansas Best Corporation’s (the “Company”) actual results could differ materially from those discussed herein. Factors that could cause or contribute to such differences include, but are not limited to, those discussed in Item 1, “Business.”
ITEM 1. BUSINESS
(a) General Development of Business
Corporate ProfileArkansas Best Corporation (the “Company”) is a diversified holding company engaged through its subsidiaries primarily in motor carrier transportation operations and intermodal transportation operations. Principal subsidiaries are ABF Freight System, Inc. (“ABF”); Clipper Exxpress Company and related companies (“Clipper”); FleetNet America, LLC; and until August 1, 2001, G.I. Trucking Company (“G.I. Trucking”) (see Note S appearing on page 49 of the registrant’s Annual Report). The Company’s operations included the truck tire retreading and new tire sales operations of Treadco, Inc. (“Treadco”) until October 31, 2000 (see Note R appearing on page 48 of the registrant’s Annual Report).
Historical BackgroundThe Company was publicly owned from 1966 until 1988, when it was acquired in a leveraged buyout by a corporation organized by Kelso & Company, L.P. (“Kelso”).
In 1992, the Company completed a public offering of Common Stock, par value $.01 (the “Common Stock”). The Company also repurchased substantially all the remaining shares of Common Stock beneficially owned by Kelso, thus ending Kelso’s investment in the Company.
In 1993, the Company completed a public offering of 1,495,000 shares of $2.875 Series A Cumulative Convertible Exchangable Preferred Stock (“Preferred Stock”). The Company’s Preferred Stock traded on The Nasdaq National Market (“Nasdaq”) under the symbol “ABFSP”.
On July 10, 2000, the Company purchased 105,000 shares of its Preferred Stock at $37.375 per share, for a total cost of $3.9 million. All of the shares purchased were retired. As of December 31, 2000, the Company had outstanding 1,390,000 shares of Preferred Stock.
On August 13, 2001, the Company announced the call for redemption of its Preferred Stock. As of August 10, 2001, 1,390,000 shares of Preferred Stock were outstanding. At the end of the extended redemption period on September 14, 2001, 1,382,650 shares of the Preferred Stock were converted to 3,511,439 shares of Common Stock. A total of 7,350 shares of Preferred Stock were redeemed at the redemption price of $50.58 per share. The Company paid $0.4 million to the holders of these shares in redemption of their Preferred Stock. The Company delisted its preferred stock trading on Nasdaq under the symbol “ABFSP” on September 12, 2001, eliminating the Company’s annual dividend requirement.
In August 1995, pursuant to a tender offer, a wholly owned subsidiary of the Company purchased the outstanding shares of common stock of WorldWay Corporation (“WorldWay”), at a price of $11 per share (the “Acquisition”). WorldWay was a publicly held company engaged through its subsidiaries in motor carrier operations. The total purchase price of WorldWay amounted to approximately $76.0 million.
3

ITEM 1. BUSINESS – continued
During the first half of 1999, the Company acquired 2,457,000 shares of Treadco common stock for $23.7 million via a cash tender offer pursuant to a definitive merger agreement. As a result of the transaction, Treadco became a wholly owned subsidiary of the Company (see Note Q appearing on page 48 of the registrant’s Annual Report). On September 13, 2000, Treadco entered into an agreement with The Goodyear Tire & Rubber Company (“Goodyear”) to contribute its business to a new limited liability company called Wingfoot Commercial Tire Systems, LLC (“Wingfoot”) (see Note R appearing on page 48 of the registrant’s Annual Report). The transaction closed on October 31, 2000.
On August 1, 2001, the Company sold the stock of G.I. Trucking for $40.5 million in cash to a company formed by the senior executives of G.I. Trucking and Estes Express Lines (“Estes”) (see Note S appearing on page 49 of the registrant’s Annual Report).
(b) Financial Information about Industry Segments
The response to this portion of Item 1 is included in “Note M – Operating Segment Data” appearing on pages 42 through 44 of the registrant’s Annual Report to Stockholders for the year ended December 31, 2001, and is incorporated herein by reference under Item 14.
(c) Narrative Description of Business
GeneralDuring the periods being reported on, the Company operated in four defined reportable operating segments: (1) ABF; (2) G.I. Trucking (which was sold on August 1, 2001) (see Note S appearing on page 49 of the registrant’s Annual Report); (3) Clipper; and (4) Treadco (which was contributed to Wingfoot on October 31, 2000) (see Note R appearing on page 48 of the registrant’s Annual Report). Note M to the Consolidated Financial Statements contains additional information regarding the Company’s operating segments and appears on pages 42 through 44 of the registrant’s Annual Report to Stockholders for the year ended December 31, 2001, and is incorporated herein by reference under Item 14.
Discontinued OperationsAt December 31, 1998, the Company was engaged in international ocean freight services through its subsidiary, CaroTrans International, Inc. (“Clipper International”), a non-vessel operating common carrier (N.V.O.C.C.). On February 28, 1999, the Company completed a formal plan to exit its international ocean freight N.V.O.C.C. services by disposing of the business and assets of Clipper International. On April 17, 1999, the Company closed the sale of the business and certain assets of Clipper International, including the trade name “CaroTrans International, Inc.” All of the assets have been liquidated by the Company.
EmployeesAt December 31, 2001, the Company and its subsidiaries had a total of 11,865 employees of which approximately 73% are members of a labor union.
4

ITEM 1. BUSINESS – continued
Motor Carrier Operations
Less-Than-Truckload Motor Carrier Operations
GeneralThe Company’s less-than-truckload (“LTL”) motor carrier operations are conducted through ABF, ABF Freight System (B.C.), Ltd. (“ABF-BC”), ABF Freight System Canada, Ltd. (“ABF-Canada”), ABF Cartage, Inc. (“Cartage”), and Land-Marine Cargo, Inc. (“Land-Marine”) (collectively “ABF”) and until August 1, 2001, G.I. Trucking Company (see Note S appearing on page 49 of the registrant’s Annual Report).
LTL carriers offer services to shippers transporting a wide variety of large and small shipments to geographically dispersed destinations. LTL carriers pick up small shipments throughout the vicinity of a local terminal and consolidate them at the terminal. Shipments are consolidated by destination for transportation by intercity units to their destination cities or to distribution centers. Shipments from various locations can be reconsolidated for transportation to distant destinations, other distribution centers or local terminals. Once delivered to a local terminal, a shipment is delivered to the customer by local trucks operating from the terminal. In some cases, when a sufficient number of different shipments at one origin terminal are going to a common destination, they can be combined to make a full trailer load. A trailer is then dispatched to that destination without the freight having to be rehandled.
Competition, Pricing and Industry FactorsThe trucking industry is highly competitive. The Company’s LTL motor carrier subsidiaries actively compete for freight business with other national, regional and local motor carriers and, to a lesser extent, with private carriage, freight forwarders, railroads and airlines. Competition is based primarily on personal relationships, price and service. In general, most of the principal motor carriers use similar tariffs to rate interstate shipments. Competition for freight revenue, however, has resulted in discounting which effectively reduces prices paid by shippers. In an effort to maintain and improve its market share, the Company’s LTL motor carrier subsidiaries offer and negotiate various discounts.
The trucking industry, including the Company’s LTL motor carrier subsidiaries, is directly affected by the state of the overall economy. The trucking industry faces rising costs including government regulations on safety, maintenance and fuel economy. In addition, seasonal fluctuations also affect tonnage to be transported. Freight shipments, operating costs and earnings also are affected adversely by inclement weather conditions.
Insurance and SafetyGenerally, claims exposure in the motor carrier industry consists of cargo loss and damage, auto liability, property damage and bodily injury and workers’ compensation. The Company’s motor carrier subsidiaries are effectively self-insured for the first $100,000 of each cargo loss, $1,000,000 of each workers’ compensation loss and $200,000 of each general and auto liability loss, plus an aggregate of $1,870,000 of auto liability losses between $200,000 and $500,000. The Company maintains insurance adequate to cover losses in excess of such amounts. However, the Company has experienced situations where excess insurance carriers have become insolvent (see Note T appearing on page 49 of the registrant’s Annual Report). The Company pays premiums to state guaranty funds, in states where it has workers’compensation self-insurance authority. In some of these self-insured states, depending on each states rules, the guaranty funds will pay excess claims if the insurer can’t, due to insolvency. However, there can be no certainty of the solvency of individual state guaranty funds. The Company has been able to obtain adequate coverage for 2002 and is not aware of problems in the foreseeable future which would significantly impair its ability to obtain adequate coverage at market rates for its motor carrier operations.
5

ITEM 1. BUSINESS – continued
ABF Freight System, Inc.Headquartered in Fort Smith, Arkansas, ABF is the largest subsidiary of the Company. ABF accounted for more than 84.0% of the Company’s consolidated revenues for 2001. ABF is one of North America’s largest national LTL motor carriers based on revenues for 2001 as reported to the U.S. Department of Transportation (“D.O.T.”). ABF provides direct service to over 98.6% of the cities in the United States having a population of 25,000 or more. ABF provides interstate and intrastate direct service to more than 40,000 points through 309 terminals in all 50 states, Canada and Puerto Rico. Through an alliance and relationships with trucking companies in Mexico, ABF provides motor carrier services to customers in that country as well. ABF was incorporated in Delaware in 1982 and is the successor to Arkansas Motor Freight, a business originally organized in 1935.
ABF offers long-haul, interstate, regional and intrastate transportation of general commodities through LTL, assured services and expedited shipments. General commodities include all freight except hazardous waste, dangerous explosives, commodities of exceptionally high value, commodities in bulk and those requiring special equipment. ABF’s general commodities shipments differ from shipments of bulk raw materials which are commonly transported by railroad, pipeline and water carrier.
General commodities transported by ABF include, among other things, food, textiles, apparel, furniture, appliances, chemicals, non-bulk petroleum products, rubber, plastics, metal and metal products, wood, glass, automotive parts, machinery and miscellaneous manufactured products. During the year ended December 31, 2001, no single customer accounted for more than 3.0% of ABF’s revenues, and the ten largest customers accounted for less than 9.0% of ABF’s revenues.
EmployeesAt December 31, 2001, ABF employed 11,267 persons. Employee compensation and related costs are the largest components of ABF’s operating expenses. In 2001, such costs amounted to 65.6% of ABF’s revenues. Approximately 77% of ABF’s employees are covered under a collective bargaining agreement with the International Brotherhood of Teamsters (“IBT”). The IBT voted in favor of a new labor contract on April 9, 1998. The contract was effective April 1, 1998, and is for a five-year term. The contract provides for an average annual wage and benefit increase of approximately 2.3% during its term, including a lump-sum payment of $750 for the first contract year for all active employees who are IBT members. Under the terms of the National Agreement, ABF is required to contribute to various multiemployer pension plans maintained for the benefit of its employees who are members of the IBT. Amendments to the Employee Retirement Income Security Act of 1974 (“ERISA”) pursuant to the Multiemployer Pension Plan Amendments Act of 1980 (the “MPPA Act”) substantially expanded the potential liabilities of employers who participate in such plans. Under ERISA, as amended by the MPPA Act, an employer who contributes to a multiemployer pension plan and the members of such employer’s controlled group are jointly and severally liable for their proportionate share of the plan’s unfunded liabilities in the event the employer ceases to have an obligation to contribute to the plan or substantially reduces its contributions to the plan (i.e., in the event of plan termination or withdrawal by the Company from the multiemployer plans). Although the Company has no current information regarding its potential liability under ERISA in the event it wholly or partially ceases to have an obligation to contribute or substantially reduces its contributions to the multiemployer plans to which it currently contributes, management believes that such liability would be material. The Company has no intention of ceasing to contribute or of substantially reducing its contributions to such multiemployer plans.
Four of the five largest LTL carriers are unionized and generally pay comparable amounts for wages and benefits. Non-union companies typically pay employees less than union companies. Due to its national reputation and its high pay scale, ABF has not historically experienced any significant difficulty in attracting or retaining qualified drivers.
6

ITEM 1. BUSINESS – continued
G.I. Trucking CompanyOn August 1, 2001, the Company sold the stock of G.I. Trucking for $40.5 million in cash to a company formed by the senior executives of G.I. Trucking and Estes (see Note S appearing on page 49 of the registrant’s Annual Report).
Intermodal Operations
GeneralThe Company’s intermodal transportation operations are conducted through Clipper, headquartered in Lemont, Illinois. Clipper operates through two business units: Clipper Freight Management (“CFM”) and Clipper LTL, and offers domestic intermodal freight services, utilizing a variety of transportation modes including rail and over-the-road.
Competition, Pricing and Industry FactorsClipper operates in highly competitive environments. Competition is based on the most consistent transit times, freight rates, damage-free shipments and on-time delivery of freight. Clipper competes with other intermodal transportation operations, freight forwarders and railroads, as well as with other national and regional LTL and truckload motor carrier operations. Intermodal transportation operations are akin to motor carrier operations in terms of market conditions, with revenues being weaker in the first quarter and stronger in the months of September and October. Freight shipments, operating costs and earnings are also affected by the state of the overall economy and inclement weather. The reliability of rail service is also a critical component of Clipper’s ability to provide service to its customers.
ClipperClipper’s revenues accounted for approximately 8.0% of consolidated revenues for 2001. During the year ended December 31, 2001, Clipper’s largest customer accounted for approximately 10.0% of Clipper’s revenues. CFMCFM provides services through Clipper Express Company and Agricultural Express of America, Inc. (d/b/a/ Clipper Controlled Logistics). CFM accounted for approximately 71.0% of Clipper’s revenues during 2001.
CFM provides an extensive list of transportation services such as intermodal and truck brokerage, warehousing, consolidation, transloading, repacking, and other ancillary services. As an intermodal marketing operation, CFM arranges for loads to be picked up by a drayage company, tenders them to a railroad, and then arranges for a drayage company to deliver the shipment on the other end of the move. CFM’s role in this process is to select the most cost-effective means to provide quality service and to expedite movement of the loads at various interface points to ensure seamless door-to-door transportation.
Clipper Controlled Logistics provides high quality, temperature-controlled intermodal transportation service to fruit and produce brokers, growers, shippers and receivers and supermarket chains, primarily from the West to the Midwest, Canada, and the eastern United States. As of December 31, 2001, Clipper Controlled Logistics owns or leases 594 temperature-controlled trailers that it deploys in the seasonal fruit and vegetable markets. These markets are carefully selected in order to take advantage of various seasonally high rates, which peak at different times of the year. By focusing on the spot market for produce transport, Clipper Controlled Logistics is able to generate, on average, a higher revenue per load compared to standard temperature-controlled carriers that pursue more stable year-round temperature-controlled freight. Clipper Controlled Logistics’ services also include transportation of non-produce loads requiring protective services and leasing trailers during non-peak produce seasons.
7

ITEM 1. BUSINESS – continued
Clipper LTLClipper LTL operates primarily through Clipper Exxpress Company (“Clipper Exxpress”). Management believes Clipper Exxpress is one of the largest intermodal consolidators and forwarders of LTL shipments in the United States. Clipper LTL accounts for approximately 29.0% of Clipper’s 2001 revenues.
Clipper LTL’s collection and distribution network consists of 21 service centers geographically dispersed throughout the United States. Clipper LTL’s selection of markets depends on size (lane density), availability of quality rail service and truck line-haul service, length of haul and competitor profile. Traffic moving between its ten most significant market pairs generates approximately 42.0% of Clipper’s LTL revenue. A majority of Clipper’s LTL revenue is derived from long-haul, metro area-to-metro area transportation.
Although pickup and delivery and terminal handling is performed by independent agents, Clipper LTL has an operations and customer service staff located at or near many of its principal agents’ terminals to monitor service levels and provide an interface between customers and agents.
Treadco, Inc.On September 13, 2000, Treadco entered into an agreement with Goodyear to form a new limited liability company called Wingfoot Commercial Tire Systems, LLC (see Note R appearing on page 48 of the registrant’s Annual Report). The transaction closed on October 31, 2000.
Environmental and Other Government RegulationsThe Company is subject to federal, state and local environmental laws and regulations relating to, among other things, contingency planning for spills of petroleum products and its disposal of waste oil. In addition, the Company is subject to significant regulations dealing with underground fuel storage tanks. The Company’s subsidiaries, or lessees, store fuel for use in tractors and trucks in approximately 76 underground tanks located in 25 states. Maintenance of such tanks is regulated at the federal and, in some cases, state levels. The Company believes that it is in substantial compliance with all such regulations. The Company is not aware of any leaks from such tanks that could reasonably be expected to have a material adverse effect on the Company.
The Company has received notices from the EPA and others that it has been identified as a potentially responsible party (“PRP”) under the Comprehensive Environmental Response Compensation and Liability Act or other federal or state environmental statutes at several hazardous waste sites. After investigating the Company’s or its subsidiaries’ involvement in waste disposal or waste generation at such sites, the Company has either agreed to de minimis settlements (aggregating approximately $340,000 over the last 12 years), or believes its obligations with respect to such sites would involve immaterial monetary liability, although there can be no assurances in this regard.
As of December 31, 2001, the Company has accrued approximately $2.4 million to provide for environmental-related liabilities. The Company’s environmental accrual is based on management’s best estimate of the actual liability. The Company’s estimate is founded on management’s experience in dealing with similar environmental matters and on actual testing performed at some sites. Management believes that the accrual is adequate to cover environmental liabilities based on the present environmental regulations. Accruals for environmental liability are included in the balance sheet as accrued expenses.
8

ITEM 2. PROPERTIES
The Company owns its executive office building in Fort Smith, Arkansas, which contains approximately 196,000 square feet.
ABF
ABF currently operates out of 309 terminal facilities of which it owns 81, leases 48 from an affiliate and leases the remainder from non-affiliates. ABF’s principal terminal facilities are as follows:
No. of Doors Square Footage (1)
Owned:Dayton, Ohio 330 259,765Ellenwood, Georgia 227 153,209South Chicago, Illinois 274 149,610Carlisle, Pennsylvania (East) 260 156,468Dallas, Texas 106 95,110
Leased from affiliate, Transport Realty:North Little Rock, Arkansas 196 148,712Albuquerque, New Mexico 85 70,980Carlisle, Pennsylvania (West) 140 66,484Pico Rivera, California 99 57,460
Leased from non-affiliate:Winston-Salem, North Carolina 150 160,700Salt Lake City, Utah 91 42,310
(1) Includes shop and driver room square footage.
Clipper
Clipper operates from 21 service centers, geographically dispersed throughout the United States. Nine of the service centers are facilities leased by Clipper and 12 of the service centers are agent locations.
9

ITEM 3. LEGAL PROCEEDINGS
Various legal actions, the majority of which arise in the normal course of business, are pending. None of these legal actions are expected to have a material adverse effect on the Company’s financial condition, cash flows or results of operations. The Company maintains insurance against certain risks arising out of the normal course of its business, subject to certain self-insured retention limits.
ITEM 4. SUBMISSION OF MATTERS TO A VOTE OF SECURITY HOLDERS
No matters were submitted to a vote of stockholders during the fourth quarter ended December 31, 2001.
10

PART II
ITEM 5. MARKET FOR REGISTRANT’S COMMON EQUITY AND RELATED STOCKHOLDER MATTERS
The information set forth under the caption “Market and Dividend Information” on page 7 of the registrant’s Annual Report to Stockholders for the year ended December 31, 2001, is incorporated by reference under Item 14 herein.
ITEM 6. SELECTED FINANCIAL DATA
The information set forth under the caption “Selected Financial Data” on page 6 of the registrant’s Annual Report to Stockholders for the year ended December 31, 2001, is incorporated by reference under Item 14 herein.
ITEM 7. MANAGEMENT’S DISCUSSION AND ANALYSIS OF FINANCIAL CONDITION AND RESULTS OF OPERATIONS
“Management’s Discussion and Analysis of Financial Condition and Results of Operations,” appearing on pages 8 through 19 of the registrant’s Annual Report to Stockholders for the year ended December 31, 2001, is incorporated by reference under Item 14 herein.
ITEM 7A.QUANTITATIVE AND QUALITATIVE DISCLOSURES ABOUT MARKET RISK
“Quantitative and Qualitative Disclosures About Market Risk,” appearing on page 20 of the registrant’s Annual Report to Stockholders for the year ended December 31, 2001, is incorporated by reference under Item 14 herein.
ITEM 8. FINANCIAL STATEMENTS AND SUPPLEMENTARY DATA
The report of independent auditors, consolidated financial statements and supplementary information, appearing on pages 21 through 51 of the registrant’s Annual Report to Stockholders for the year ended December 31, 2001, are incorporated by reference under Item 14 herein.
ITEM 9. CHANGES IN AND DISAGREEMENTS WITH ACCOUNTANTS ON ACCOUNTING AND FINANCIAL DISCLOSURE.
None.
11

PART III
ITEM 10. DIRECTORS AND EXECUTIVE OFFICERS OF THE REGISTRANT
The sections entitled “Election of Directors,” “Directors of the Company,” “Board of Directors and Committees,” “Executive Officers of the Company” and “Section 16(a) Beneficial Ownership Reporting Compliance” in the Company’s Proxy Statement for the Annual Meeting of Stockholders to be filed by the Company with the Securities and Exchange Commission (“Definitive Proxy Statement”) set forth certain information with respect to the directors, nominees for election as directors and executive officers of the Company and are incorporated herein by reference.
ITEM 11. EXECUTIVE COMPENSATION
The sections entitled “Executive Compensation,” “Aggregated Options/SAR Exercises in Last Fiscal Year and Fiscal Year-End Options/SAR Values,” “Options/SAR Grants Table,” “Executive Compensation and Development Committee Interlocks and Insider Participation,” “Retirement and Savings Plans,” “Employment Contracts and Termination of Employment and Change in Control Arrangements” and the paragraph concerning directors’ compensation in the section entitled “Board of Directors and Committees” in the Company’s Definitive Proxy Statement set forth certain information with respect to compensation of management of the Company and are incorporated herein by reference, provided, however, the information contained in the sections entitled “Report on Executive Compensation by the Executive Compensation and Development Committee and Stock Option Committee” and “Stock Performance Graph” are not incorporated herein by reference.
ITEM 12. SECURITY OWNERSHIP OF CERTAIN BENEFICIAL OWNERS AND MANAGEMENT
The section entitled “Principal Stockholders and Management Ownership” in the Company’s Definitive Proxy Statement sets forth certain information with respect to the ownership of the Company’s voting securities and is incorporated herein by reference.
ITEM 13. CERTAIN RELATIONSHIPS AND RELATED TRANSACTIONS
The section entitled “Certain Transactions and Relationships” in the Company’s Definitive Proxy Statement sets forth certain information with respect to relations of and transactions by management of the Company and is incorporated herein by reference.
12

PART IV
ITEM 14. EXHIBITS, FINANCIAL STATEMENT SCHEDULES AND REPORTS ON FORM 8-K.
(a)(1) Financial StatementsThe following information appearing in the 2001 Annual Report to Stockholders is incorporated by reference in this Form 10-K Annual Report as Exhibit (13):
Page
Market and Dividend Information 7Selected Financial Data 6Management’s Discussion and Analysis of Financial Condition and Results of Operations 8 – 19Quantitative and Qualitative Disclosures About Market Risk 20Report of Independent Auditors 21Consolidated Financial Statements 22 – 49Quarterly Results of Operations 47
With the exception of the aforementioned information, the 2001 Annual Report to Stockholders is not deemed filed as part of this report. Financial statements other than those listed are omitted for the reason that they are not required or are not applicable. The following additional financial data should be read in conjunction with the consolidated financial statements in such 2001 Annual Report to Stockholders.
(a)(2) Financial Statement SchedulesFor the years ended December 31, 2001, 2000, and 1999. Schedule II – Valuation and Qualifying Accounts and Reserves Page 15
Schedules other than those listed are omitted for the reason that they are not required or are not applicable, or the required information is shown in the financial statements or notes thereto.
(a)(3) ExhibitsThe exhibits filed with this report are listed in the Exhibit Index, which is submitted as a separate section of this report.
(b) Reports on Form 8-KThe Company filed Form 8-K dated September 24, 2001, for Item No. 5 – Other Events. The filing announced the results of its call for redemption of all outstanding shares of its $2.875 Series A Cumulative Convertible Exchangeable Preferred Stock.
The Company filed Form 8-K dated August 20, 2001, for Item No. 5 – Other Events. The filing announced of its call for redemption of all outstanding shares of its $2.875 Series A Cumulative Convertible Exchangeable Preferred Stock.
(c) ExhibitsSee Item 14(a)(3) above.
(d) Financial Statement SchedulesThe response to this portion of Item 14 is submitted as a separate section of this report.
13

SIGNATURES
Pursuant to the requirements of Section 13 or 15(d) of the Securities Exchange Act of 1934, the Registrant has duly caused this report to be signed on its behalf by the undersigned, thereunto duly authorized.
ARKANSAS BEST CORPORATION
By: /s/David E. LoefflerDavid E. LoefflerVice President - Chief Financial Officer and Treasurer
Pursuant to the requirements of the Securities Exchange Act of 1934, this report has been signed below by the following persons on behalf of the registrant and in the capacities and on the dates indicated.
Signature Title Date
/s/William A. Marquard Chairman of the Board, Director March 8, 2002William A. Marquard
/s/Robert A. Young, III Director, Chief Executive Officer March 8, 2002Robert A. Young, III and President (Principal
Executive Officer)
/s/David E. Loeffler Vice President - Chief Financial Officer March 8, 2002David E. Loeffler and Treasurer
/s/Frank Edelstein Director March 8, 2002Frank Edelstein
/s/Arthur J. Fritz Director March 8, 2002Arthur J. Fritz
/s/John H. Morris Director March 8, 2002John H. Morris
/s/Alan. J. Zakon Director March 8, 2002Alan J. Zakon
14

SCHEDULE IIVALUATION AND QUALIFYING ACCOUNTS AND RESERVES
ARKANSAS BEST CORPORATION
Column A Column B Column C Column D Column E Column F Additions
Balance at Charged to charged tobeginning costs and other accounts Deductions - Balance at
Description of period expenses describe describe end of period ($ thousands)
Year Ended December 31, 2001:Deducted from asset accounts:
Allowance for doubtful $ 274(D) accounts receivable....................... $ 4,595 $ 2,966 $ 1,104(A) 4,908(B) $ 3,483
Year Ended December 31, 2000:Deducted from asset accounts:
Allowance for doubtful $ 6,381(B) accounts receivable....................... $ 5,775 $ 3,797 $ 2,598(A) 1,194(C) $ 4,595
Year Ended December 31, 1999:Deducted from asset accounts:
Allowance for doubtful accounts receivable....................... $ 7,051 $ 2,967 $ 2,664(A) $ 6,907(B) $ 5,775
Note A - Recoveries of amounts previously written off.Note B - Uncollectible accounts written off.Note C - The allowance for doubtful accounts for Treadco, Inc., as of the date of the contribution of substantially all of Treadco’s
assets and liabilities to Wingfoot (see Note R appearing on page 48 of the registrant’s Annual Report).Note D - The allowance for doubtful accounts for G.I. Trucking., as of the date of the sale (see Note S appearing on page 49 of the
registrant’s Annual Report).
NOTE: All information reflected in the above table has been restated to exclude valuation allowances of discontinued operations.
15

FORM 10-K -- ITEM 14(c)EXHIBIT INDEX
ARKANSAS BEST CORPORATION
The following exhibits are filed with this report or are incorporated by reference to previously filed material.
ExhibitNo.
3.1* Restated Certificate of Incorporation of the Company (previously filed as Exhibit 3.1 to the Company’s Registration Statement on Form S-1 under the Securities Act of 1933 filed with the Commission on March 17, 1992, Commission File No. 33-46483, and incorporated herein by reference).
3.2* Amended and Restated Bylaws of the Company (previously filed as Exhibit 3.2 to the Company’s Registration Statement on Form S-1 under the Securities Act of 1933 filed with the Commission on March 17, 1992, Commission File No. 33-46483, and incorporated herein by reference).
4.1* Form of Indenture, between the Company and Harris Trust and Savings Bank, with respect to $2.875 Series A Cumulative Convertible Exchangeable Preferred Stock (previously filed as Exhibit 4.4 to Amendment No. 2 to the Company’s Registration Statement on Form S-1 under the Securities Act of 1933 filed with the Commission on January 26, 1993, Commission File No. 33-56184, and incorporated herein by reference).
4.2* Indenture between Carolina Freight Corporation and First Union National Bank, Trustee with respect to 6 1/4% Convertible Subordinated Debentures Due 2011 (previously filed as Exhibit 4-A to the Carolina Freight Corporation’s Registration Statement on Form S-3 filed with the Commission on April 11, 1986, Commission File No. 33-4742, and incorporated herein by reference).
10.1*# Stock Option Plan (previously filed as Exhibit 10.3 to the Company’s Registration Statement on Form S-1 under the Securities Act of 1933 filed with the Commission on March 17, 1992, Commission File No. 33-46483, and incorporated herein by reference).
10.2* First Amendment dated as of January 31, 1997 to the $346,971,321 Amended and Restated Credit Agreement dated as of February 21, 1996, among the Company as Borrower, Societe Generale as Managing Agent and Administrative Agent, NationsBank of Texas, N.A. as Documentation Agent and the Banks named herein as the Banks (previously filed as Exhibit 10.1 to the Company’s Current Report on Form 8-K, filed with the Commission on February 27, 1997, Commission File No. 0-19969, and incorporated herein by reference).
10.3* First Amendment dated as of January 31, 1997, to the $30,000,000 Credit Agreement dated as of February 21, 1996, among the Company as Borrower, Societe Generale as Agent, and the Banks named herein as the Banks (previously filed as Exhibit 10.3 to the Company’s Current Report on Form 8-K, filed with the Commission on February 27, 1997, Commission File No. 0-19969, and incorporated herein by reference).
16

FORM 10-K -- ITEM 14(c)EXHIBIT INDEX
ARKANSAS BEST CORPORATION(Continued)
ExhibitNo.
10.4*# Arkansas Best Corporation Performance Award Unit Program effective January 1, 1996 (previously filed as Exhibit 10.6 to the Company’s Annual Report on Form 10-K for the fiscal year ended December 31, 1995, Commission File No. 0-19969, and incorporated herein by reference).
10.5* Second Amendment, dated July 15, 1997, to the $346,971,312 Amended and Restated Credit Agreement among the Company as Borrower, Societe Generale as Managing Agent and Administrative Agent, NationsBank of Texas, N.A., as Documentation Agent, and the Banks named herein as the Banks (previously filed as Exhibit 10.3 to the Company’s Current Report on Form 8-K, filed with the Commission on August 1, 1997, Commission File No. 0-19969, and incorporated herein by reference).
10.6* Interest-Rate Swap Agreement effective April 1, 1998 on a notional amount of $110,000,000 with Societe Generale (previously filed as Exhibit 10.1 to the Company’s Form 10-Q filed with the Commission on May 13, 1998, Commission File No. 0-19969, and incorporated herein by reference).
10.7* $250,000,000 Credit Agreement dated as of June 12, 1998 with Societe Generale as Administrative Agent and Bank of America National Trust Savings Association and Wells Fargo Bank (Texas), N.A., as Co-Documentation Agents (previously filed as Exhibit 10.2 to the Company’s Form 10-Q filed with the Commission on August 6, 1998, Commission File No. 0-19969, and incorporated herein by reference).
10.8*# The Company’s Supplemental Benefit Plan (previously filed as Exhibit 4.1 to the Company’s Registration Statement on Form S-8 filed with the Commission on December 22, 1999, Commission File No. 333-93381, and incorporated herein by reference).
10.9* The Company’s National Master Freight Agreement covering over-the-road and local cartage employees of private, common, contract and local cartage carriers for the period of April 1, 1998 through March 31, 2003.
10.10* First amendment dated as of February 12, 1999, to the $250,000,000 Credit Agreement dated as of June 12, 1998, among the Company as Borrower; Societe Generale, Southwest Agency, as Administrative Agent; and Bank of America National Trust and Savings Association and Wells Fargo Bank (Texas), N.A., as Co-Documentation Agents.
10.11* Amendment dated March 15, 1999, to Amendment No. 1 dated as of February 12, 1999, to the $250,000,000 Credit Agreement dated as of June 12, 1998, among the Company as Borrower; Societe Generale, Southwest Agency, as Administrative Agent; and Bank of America National Trust and Savings Association and Wells Fargo Bank (Texas), N.A., as Co-Documentation Agents.
10.12* Second amendment dated as of August 2, 2000, to the $250,000,000 Credit Agreement dated as of June 12, 1998, among the Company as Borrower; Wells Fargo Bank (Texas), N.A., as Administrative Agent; and Bank of America National Trust and Savings Association and Wells Fargo Bank (Texas), N.A., as Co-Documentation Agents, as amended by Amendment No. 1 and Consent and Waiver dated as of February 12, 1999 and Amendment to Amendment No. 1 and Consent and Waiver dated as of March 15, 1999.
17

FORM 10-K -- ITEM 14(c)EXHIBIT INDEX
ARKANSAS BEST CORPORATION(Continued)
ExhibitNo.
10.13* Third amendment dated as of September 30, 2000, to the $250,000,000 Credit Agreement dated as of June 12, 1998, among the Company as Borrower; Wells Fargo Bank (Texas), N.A., as Administrative Agent; and Bank of America National Trust and Savings Association and Wells Fargo Bank (Texas), N.A., as Co-Documentation Agents, as amended by Amendment No. 1 and Consent and Waiver dated as of February 12, 1999, Amendment to Amendment No. 1 and Consent and Waiver dated as of March 15, 1999, and Amendment No. 2 dated as of August 2, 2000 (as amended, the “Credit Agreement”).
10.14* Agreement dated September 13, 2000, by and among The Goodyear Tire & Rubber Company and Treadco, Inc., a wholly owned subsidiary of Arkansas Best Corporation.
10.15* Stock Purchase Agreement by and between Arkansas Best Corporation and Estes Express Lines dated as of August 1, 2001.
10.16# Letter re: Proposal to adopt the Company’s 2002 Stock Option Plan
13 2001 Annual Report to Stockholders
21 List of Subsidiary Corporations
23 Consent of Ernst & Young LLP, Independent Auditors
* Previously filed with the Securities and Exchange Commission and incorporated herein by reference.# Designates a compensation plan for Directors or Executive Officers.
18

EXHIBIT 13
Market and Dividend Information
Selected Financial Data
Management’s Discussion and Analysis of Financial Condition and Results of Operations
Quantitative and Qualitative Disclosures About Market Risk
Financial Statements and Supplementary Data

Market and Dividend Information
The Common Stock of Arkansas Best Corporation (“the Company”) trades on The Nasdaq National Market under the symbol “ABFS.” The following table sets forth the high and low recorded last sale prices of the Common Stock during the periods indicated as reported by Nasdaq and the cash dividends declared:
CashHigh Low Dividend
2001First quarter ........................................................................... $ 24.688 $ 15.625 $ -Second quarter........................................................................ 23.050 15.000 -Third quarter........................................................................... 27.860 19.140 -Fourth quarter......................................................................... 30.230 18.950 -
2000First quarter ........................................................................... $ 13.625 $ 9.313 $ -Second quarter........................................................................ 14.063 9.938 -Third quarter........................................................................... 16.375 10.688 -Fourth quarter......................................................................... 20.125 13.266 -
At February 25, 2002, there were 24,594,115 shares of the Company’s Common Stock outstanding, which were held by 495 stockholders of record.
The Company’s Board of Directors suspended payment of dividends on the Company’s Common Stock during the second quarter of 1996. The declaration and payment of and the timing, amount and form of future dividends on the Common Stock will be determined based on the Company’s results of operations, financial condition, cash requirements, certain corporate law requirements and other factors deemed relevant by the Board of Directors.
The Company’s Credit Agreement limits the total amount of “restricted payments” that the Company may make, excluding dividends on the Company’s Preferred Stock, to $25.0 million in any one calendar year. Restricted payments include payments for the redemption of subordinated debentures, dividends on Common Stock, and other distributions that are in payment for the purchase or redemption of any shares of capital stock. The annual dividend requirements on the Company’s Preferred Stock totaled approximately $2.5 million, $4.1 million, and $4.3 million during 2001, 2000, and 1999, respectively.
On August 13, 2001, the Company announced the call for redemption of its $2.875 Series A Cumulative Convertible Exchangeable Preferred Stock (“ABFSP”). As of August 10, 2001, 1,390,000 shares of Preferred Stock were outstanding. At the end of the extended redemption period on September 14, 2001, 1,382,650 shares of the Preferred Stock were converted to 3,511,439 shares of Common Stock. A total of 7,350 shares of Preferred Stock were redeemed at the redemption price of $50.58 per share. The Company paid $0.4 million to the holders of these shares in redemption of their Preferred Stock. The Company delisted its preferred stock trading on The Nasdaq National Market under the symbol “ABFSP” on September 12, 2001, eliminating the Company’s annual dividend requirement.

Selected Financial Data
Year Ended December 31 2001 (1) 2000 (1) 1999 1998 1997 (1)
($ thousands, except per share data)Statement of Operations Data:
Operating revenues.......................................... $ 1,526,206 $ 1,839,567 $ 1,721,586 $ 1,607,403 $ 1,593,218Operating income............................................ 75,934 140,152 109,707 69,977 64,503Minority interest income (expense) in Treadco, Inc................................................... - - 245 (3,257) 1,359Other (income) expenses, net........................... 1,221 (647) 3,920 3,255 8,814Gain on sale of Cardinal Freight Carriers, Inc. - - - - 8,985Fair value net gain – Wingfoot Commercial Tire Systems, LLC (2)............... - 5,011 - - -Gain on sale of G.I. Trucking Company (7)..... 4,642 - - - -Settlement of litigation (3)............................... - - - 9,124 -Interest expense, net........................................ 12,636 16,687 18,395 18,146 23,765Income from continuing operations before income taxes...................... 66,719 129,123 87,637 54,443 42,268Provision for income taxes............................... 25,315 52,968 36,455 23,192 20,086Income from continuing operations ................. 41,404 76,155 51,182 31,251 22,182Loss from discontinued operations, net of tax ...................................................... - - (786) (2,576) (6,835)Net income ..................................................... 41,404 76,155 50,396 28,675 15,347Income per common share from continuing operations (diluted) ............. 1.66 3.17 2.14 1.32 0.91Net income per common share (diluted) ............................................... 1.66 3.17 2.11 1.21 0.56Cash dividends paid per common share (4) ......................................... - - - - -
Balance Sheet Data:Total assets ..................................................... 723,153 797,124 731,929 707,330 693,649Current portion of long-term debt ................... 14,834 23,948 20,452 17,504 16,484Long-term debt (including capital leases and excluding current portion) ...................... 115,003 152,997 173,702 196,079 202,604
Other Data:Gross capital expenditures (5) ......................... 74,670 93,585 76,209 86,446 14,135Net capital expenditures (6)............................. 64,538 83,801 61,253 70,243 (23,775)Depreciation and amortization ........................ 50,315 52,186 45,242 40,674 44,316Goodwill amortization .................................... 4,053 4,051 4,195 4,515 4,629Other amortization (8)..................................... 180 217 324 2,420 4,139
(1) Selected financial data is not comparable to the prior years’ information due to the sale of Cardinal Freight Carriers, Inc. on July 15, 1997, the contribution of Treadco’s assets and liabilities to Wingfoot Commercial Tire Systems, LLC (“Wingfoot”) on October 31, 2000, (see Note R to the Consolidated Financial Statements) and the sale of G.I. Trucking Company (“G.I. Trucking”) on August 1, 2001 (see Note S).
(2) Fair value net gain on the contribution of Treadco’s assets and liabilities to Wingfoot.
(3) Income results from the settlement of Treadco litigation.
(4) Cash dividends on its Common Stock were indefinitely suspended by Arkansas Best Corporation as of the second quarter of 1996.
(5) Does not include revenue equipment placed in service under operating leases, which amounted to $21.9 million in 1997. There were no operating leases for revenue equipment entered into for 2001, 2000, 1999 and 1998.
(6) Capital expenditures, net of proceeds from the sale of property, plant and equipment.
(7) Gain on the sale of G.I. Trucking on August 1, 2001.
(8) Deferred financing cost amortization.

MANAGEMENT’S DISCUSSION AND ANALYSIS OF FINANCIAL CONDITION AND RESULTS OF OPERATIONS
Arkansas Best Corporation (the “Company”) is a diversified holding company engaged through its subsidiaries primarily in motor carrier transportation operations and intermodal transportation operations. Principal subsidiaries are ABF Freight System, Inc. (“ABF”); Clipper Exxpress Company and related companies (“Clipper”); FleetNet America, LLC; and until August 1, 2001, G.I. Trucking Company (“G.I. Trucking”) (see Note S). The Company’s operations included the truck tire retreading and new tire sales operations of Treadco, Inc. (“Treadco”) until October 31, 2000 (see Note R).
See Note Q to the Consolidated Financial Statements regarding the acquisition of non-ABC-owned Treadco shares and subsequent merger resulting in Treadco becoming a wholly owned subsidiary of the Company in 1999. See Note R regarding the contribution of substantially all of Treadco’s assets and liabilities to Wingfoot Commercial Tire Systems, LLC (“Wingfoot”). See Note A regarding the consolidation of Treadco in the Company’s Consolidated Financial Statements for 1999. See Note C regarding the Company’s discontinuation of Clipper International. See Note S regarding the sale of G.I. Trucking.
The Company utilizes tractors and trailers primarily in its motor carrier transportation operations. Tractors and trailers are commonly referred to as “revenue equipment” in the transportation business.
Critical Accounting Policies
The preparation of financial statements in conformity with accounting principles generally accepted in the United States requires management to make estimates and assumptions that affect the amounts reported in the financial statements and accompanying notes. Actual results could differ from those estimates.
The Company’s accounting policies (see Note B) that are “critical,” or the most important, to understand the Company’s financial condition and results of operations and that require management of the Company to make the most difficult judgments are described as follows:
The Company’s accounting policy for revenue recognition is a method prescribed by the Emerging Issues Task Force (“EITF”) 91-9 for motor carrier transportation companies, where revenue is recognized based on relative transit times in each reporting period with expenses being recognized as incurred. Management of the Company utilizes a bill-by-bill analysis to establish the associated revenue to recognize in each reporting period.
The Company’s accounting policy for its allowance for doubtful accounts is based on the Company’s historical write-offs, as well as trends and factors surrounding the credit risk of specific customers. In order to gather information regarding these trends and factors, the Company performs ongoing credit evaluations of its customers. The Company’s allowance for revenue adjustments is based on the Company’s historical revenue adjustments. Actual write-offs or adjustments could differ from the allowance estimates the Company makes as a result of a number of factors. These factors include unanticipated changes in the overall economic environment or factors and risks surrounding a particular customer. The Company continually updates the history it uses to make these estimates to reflect the most recent trends, factors and other information available. Actual write-offs and adjustments are charged against the allowances for doubtful accounts and revenue adjustments.
MANAGEMENT’S DISCUSSION AND ANALYSIS OF FINANCIAL CONDITION AND RESULTS OF OPERATIONS - continued
Under its accounting policy for property, plant and equipment, management establishes appropriate depreciable lives and salvage values for the Company’s revenue equipment (tractors and trailers) based on their estimated useful lives and estimated fair values to be received when the equipment is sold or traded in. Management has a policy of purchasing its revenue equipment or entering into capital leases rather than utilizing off-balance sheet financing.
The Company has elected to follow Accounting Principles Board (“APB”) No. 25, Accounting for Stock Issued to Employees and related interpretations in accounting for stock options because the alternative fair value accounting provided for under FASB Statement No. 123, Accounting for Stock-Based Compensation (“Statement 123”) requires the use of option valuation models that were not developed for use in valuing employee stock options. Under APB 25, because the exercise price of the Company’s employee and director options equals the market price of the underlying stock on the date of grant, no compensation expense is recognized.
The Company is self-insured up to certain limits for workers’ compensation and certain property damage and liability claims. These claims liabilities recorded in the financial statements totaled $46.3 million at December 31, 2001. The Company does not discount its claims liabilities. Under the Company’s accounting policy for claims, management annually estimates the development of the claims based upon the Company’s historical development factors over a number of years. The Company utilizes a third party to calculate the development factors and analyze historical trends. Actual payments may differ from management’s estimates as a result of a number of factors. These factors include increases in medical costs and the overall economic environment, as well as many other factors. The actual claims payments are charged against the Company’s accrued claims liabilities.
The Company hedged its interest rate risk by entering into a fixed rate interest rate swap on $110.0 million of revolving Credit Agreement borrowings. The Company’s accounting policy for derivative financial instruments is as prescribed by FAS 133, Accounting for Derivative Financial Instruments and Hedging Activities. The Company’s fixed rate interest rate swap is an effective hedge on $110.0 million of revolving Credit Agreement borrowings in accordance with its accounting policy. As a result, the fair value of the swap ($5.4) million is recorded on the Company’s balance sheet through other comprehensive income rather than through the income statement. If the swap terminated at December 31, 2001, the Company would have had to pay $5.4 million. Future changes in the fair value of the swap will also be reflected in other comprehensive income as long as the swap remains in place and is effectively hedged.
The Company’s accounting policy for its 19% investment in Wingfoot Commercial Tire Systems, LLC (“Wingfoot”) is the equity method of accounting, similar to a partnership investment. Under the terms of the LLC operating agreement, the Company does not share in the profits or losses of Wingfoot during the term of the Company’s “Put” option. Therefore, the Company’s investment balance of $59.3 million at December 31, 2001 should not change during the “Put” period. If the Company “puts” its interest to The Goodyear Tire & Rubber Company (“Goodyear”), the Company will record a pre-tax gain in the amount of $14.1 million in the quarter its interest is “put.” If Goodyear “calls” the Company’s interest in Wingfoot, the Company will record a pre-tax gain of $19.1 million during the quarter the “call” is made by Goodyear (see Note R).

MANAGEMENT’S DISCUSSION AND ANALYSIS OF FINANCIAL CONDITION AND RESULTS OF OPERATIONS - continued
Recent Accounting Pronouncements
On July 20, 2001, the Financial Accounting Standards Board (“FASB”) issued Statement No. 142, Goodwill and Other Intangible Assets (“Statement 142”). Under Statement 142, goodwill and indefinite lived intangible assets are no longer amortized but are reviewed annually for impairment. Statement 142 was effective for the Company on January 1, 2002, and as of that date, the Company no longer amortizes its goodwill, but reviews it annually for impairment. At December 31, 2001, the Company’s assets included goodwill of $101.3 million of which $63.8 million is from a 1988 leveraged buyout transaction and $37.5 million was from the 1994 acquisition of Clipper. The Company’s annual goodwill amortization expense for 2001 was $4.1 million. Statement 142 requires that the Company perform transitional impairment testing on its goodwill during the first six months of 2002 based on January 1, 2002 values. The Company has performed the first phase of impairment testing on its leveraged buyout goodwill, which is based on ABF’s operations and fair value. There is no indication of impairment with respect to this goodwill. The Company has performed both the first and second phases of the transitional impairment testing on its Clipper goodwill and will recognize a non-cash impairment loss of $23.9 million, net of taxes, as a change in accounting principle as provided in Statement 142, in the first quarter of 2002. This will eliminate all of the $37.5 million of Clipper goodwill from the Company’s balance sheet. The impairment loss results from the change in the method of determining recoverable goodwill from using undiscounted cash flows, as prescribed by FAS 121, Accounting for Impairment of Long-Lived Assets and for Long-Lived Assets to be Disposed of, to the fair value method determined by using quoted market prices or other valuation techniques, including the present value of discounted cash flows, as prescribed by Statement 142.
On August 15, 2001, the FASB issued Statement 143, Accounting for Asset Retirement Obligations. Statement 143 addresses financial accounting and reporting for obligations associated with the retirement of tangible long-lived assets and the associated retirement costs. This Statement applies to legal obligations associated with the retirement of long-lived assets that result from the acquisition, construction, development and/or the normal operation of a long-lived asset, except for certain obligations of lessees. The Statement is effective for the Company in 2003. The Company is evaluating the impact, if any, the Statement will have on its financial statements and related disclosures.
On October 3, 2001, the FASB issued Statement 144, Accounting for the Impairment or Disposal of Long-Lived Assets. Statement 144 supersedes Statement 121 and the accounting and reporting provisions of APB Opinion No. 30, Reporting the Results of Operations - Reporting the Effects of Disposal of a Segment of a Business, and Extraordinary, Unusual and Infrequently Occurring Events and Transactions , for the disposal of a segment of a business. The Statement is effective for the Company January 1, 2002. The impact on the Company’s financial statements and related disclosures of the adoption of Statement 144 is expected to be immaterial.

MANAGEMENT’S DISCUSSION AND ANALYSIS OF FINANCIAL CONDITION AND RESULTS OF OPERATIONS - continued
Liquidity and Capital Resources
Cash provided by operations of $64.8 million, proceeds from asset sales of $10.1 million, gross proceeds from the sale of G.I. Trucking of $40.5 million and available cash were used primarily to purchase revenue equipment and other property and equipment totaling $74.7 million, reduce outstanding debt, including the retirement of $24.9 million in face value of the Company’s WorldWay 6¼% Convertible Subordinated Debentures (see Note G), and pay approximately $33.0 million in tax and interest payments to the IRS, related to a tax pension issue (see Note F). Cash provided by operations of $127.7 million and proceeds from asset sales of $9.8 million were used primarily to purchase revenue equipment and other property and equipment totaling $93.6 million, reduce outstanding debt and purchase preferred stock of $3.9 million during 2000. Revenue equipment includes tractors and trailers used primarily in the Company’s motor carrier transportation operations.
On August 13, 2001, the Company announced the call for redemption of its $2.875 Series A Cumulative Convertible Exchangeable Preferred Stock (“ABFSP”). As of August 10, 2001, 1,390,000 shares of Preferred Stock were outstanding. At the end of the extended redemption period on September 14, 2001, 1,382,650 shares of Preferred Stock were converted to 3,511,439 shares of Common Stock. A total of 7,350 shares of Preferred Stock were redeemed at the redemption price of $50.58 per share. The Company paid $0.4 million to the holders of these shares in redemption of their Preferred Stock. As a result of this transaction, the Company no longer has an obligation to pay Preferred Stock dividends, which approximated $4.0 million per year. Outstanding shares of Preferred Stock had historically been included in the Company’s diluted earnings per share on an as-converted basis. Therefore, the conversion of preferred shares into common did not result in an increase in the Company’s diluted common shares.
The Company is party to a $250 million credit agreement (the “Credit Agreement”) with Wells Fargo Bank (“Texas”), N.A., as Administrative Agent and with Bank of America National Trust and Savings Association and Wells Fargo Bank (“Texas”), N.A., as Co-Documentation Agents. The Credit Agreement provides for up to $250 million of revolving credit loans (including letters of credit) and extends into 2003.
At December 31, 2001, there were $110.0 million of Revolver Advances and approximately $23.6 million of letters of credit outstanding. At December 31, 2001, the Company had approximately $116.4 million of borrowing availability under the Credit Agreement. The Credit Agreement contains various covenants, which limit, among other things, indebtedness, distributions and dispositions of assets and require the Company to meet certain quarterly financial ratio tests. As of December 31, 2001, the Company was in compliance with the covenants.
The Company’s Credit Agreement contains two pricing grids. One of the grids is based on a leverage ratio and the other grid is based on the Company’s senior debt rating agency ratings. The Company may choose whichever pricing grid to use at any time. The effect of a senior debt rating increase or decrease could potentially impact the Company’s Credit Agreement pricing. In addition, if the Company achieves certain senior debt ratings, which it has, the Company’s Credit Agreement provides for no collateral filings, an increase in restricted payments allowed and no capital expenditure covenant. In January 2002, Standard & Poor’s upgraded the Company’s senior debt rating to BBB from BBB-. This upgrade represents a higher investment grade rating. The Company has no downward rating triggers that would accelerate the maturity of its debt.
The Company is in the process of negotiating a new credit facility that will replace its existing Credit Agreement, which expires in June 2003. The Company expects to have its new credit facility in place by the end of June 2002.

MANAGEMENT’S DISCUSSION AND ANALYSIS OF FINANCIAL CONDITION AND RESULTS OF OPERATIONS - continued
The Company is party to an interest rate swap on a notional amount of $110.0 million. The purpose of the swap is to limit the Company’s exposure to increases in interest rates on $110.0 million of bank borrowings over the seven-year term of the swap. The interest rate under the swap is fixed at 5.845% plus the Credit Agreement margin, which is currently 0.575%. The fair value of the Company’s interest rate swap was ($5.4) million and ($0.1) million at December 31, 2001 and December 31, 2000, respectively. The fair value of the swap is impacted by changes in rates of similarly termed Treasury instruments. The Company recognized this liability on its balance sheet in accordance with Statement No. 133, at December 31, 2001, through other comprehensive income, net of income tax benefits. The Company’s primary subsidiary, ABF, maintains ownership of most all of its larger terminals or distribution centers. Both ABF and Clipper lease certain terminal facilities. At December 31, 2001, the Company has future minimum rental commitments, net of noncancellable subleases totaling $44.5 million for terminal facilities, and $1.6 million primarily for revenue equipment.
The following is a table providing the aggregate annual obligations of the Company including debt, capital lease maturities and future minimum rental commitments:
Payments Due by Period ($ thousands)
Less than 1-3 4-5 AfterContractual Obligations Total 1 Year Years Years 5 Years
Long-term debt (1) $ 114,940 $ 24 $ 110,054 $ 51 $ 4,811 (2)Capital lease obligations 14,896 14,810 86 - -Minimum rental commitments under operating leases, net of subleases 46,124 11,214 15,233 10,011 9,666Unconditional purchase obligations - - - - -Other long-term debt obligations - - - - - Total contractual cash obligations $ 175,960 $ 26,048 $ 125,373 $ 10,062 $14,477
(1) The Company is negotiating a new revolving credit facility that it expects to have in place by June 2002, which would extend the maturity of the $110.0 million due in years 1-3.
(2) Subsequent to year end, the Company called for redemption, the remaining WorldWay Corporation 6¼% Convertible Subordinated Debentures (see Note U).
The Company has guaranteed $0.5 million of payments related to a former subsidiary of the Company. The Company’s exposure to this guarantee should decline by $60,000 per year.

MANAGEMENT’S DISCUSSION AND ANALYSIS OF FINANCIAL CONDITION AND RESULTS OF OPERATIONS - continued
The following table sets forth the Company’s historical capital expenditures for the periods indicated below. Proceeds from the sale of property and equipment have not been netted against the capital expenditures:
Year Ended December 312001 2000 1999
($ thousands)
CAPITAL EXPENDITURES (GROSS)ABF Freight System, Inc........................................................ $ 62,332 $ 71,337 $ 49,342G.I. Trucking Company (see Note S)...................................... 4,537 11,693 7,946Clipper................................................................................... 3,582 4,346 5,309Treadco, Inc. (see Note R)...................................................... - 3,916 9,801Other...................................................................................... 4,219 2,293 3,811
Total consolidated capital expenditures (gross).................. $ 74,670 $ 93,585 $ 76,209
The amounts presented in the table include equipment purchases financed with capital leases of $26.1 million in 1999. No capital lease obligations were incurred in the years ended December 31, 2001 or 2000.
In 2002, the Company forecasts total spending of approximately $45.0 million for capital expenditures, net of proceeds from equipment and real estate sales. Of the $45.0 million, ABF is budgeted for approximately $40.0 million primarily for revenue equipment and facilities.
The Company has two principal sources of available liquidity, which are its operating cash and the $116.4 million it has available under its revolving Credit Agreement at December 31, 2001. The Company has generated between $60.0 million and $130.0 million of operating cash for the years 1999 through 2001, and it expects cash from operations and its available revolver to continue to be principal sources of cash to finance its annual debt maturities and lease commitments; fund its 2002 capital expenditures, which includes a commitment to purchase $25.6 million of revenue equipment; and pay income taxes. The Company has not historically entered into financial instruments for trading purposes, nor has the Company historically engaged in hedging fuel prices. No such instruments were outstanding during 2001 or 2000. The Company has no relationships with special-purpose entities or financial partnerships.
MANAGEMENT’S DISCUSSION AND ANALYSIS OF FINANCIAL CONDITION AND RESULTS OF OPERATIONS - continued
Operating Segment Data
The following table sets forth, for the periods indicated, a summary of the Company’s operating expenses by segment as a percentage of revenue for the applicable segment. Note M to the Consolidated Financial Statements contains additional information regarding the Company’s operating segments:
Year Ended December 31 2001 2000 1999
Operating Expenses and Costs
ABF Freight System, Inc.Salaries and wages..................................................................... 65.6% 62.4% 64.1%Supplies and expenses................................................................ 13.0 12.6 11.0Operating taxes and licenses...................................................... 3.2 3.0 3.0Insurance................................................................................... 1.4 1.6 1.6Communications and utilities..................................................... 1.2 1.1 1.2Depreciation and amortization................................................... 3.1 2.6 2.4Rents and purchased transportation............................................ 6.1 6.8 8.0Other......................................................................................... 0.2 0.2 0.4(Gain) on sale of equipment ...................................................... – – (0.1)
93.8% 90.3% 91.6%
G.I. Trucking Company (see Note S)Salaries and wages..................................................................... 51.8% 47.0% 46.8%Supplies and expenses................................................................ 9.7 9.4 8.0Operating taxes and licenses...................................................... 2.4 2.1 2.4Insurance................................................................................... 2.4 2.5 2.7Communications and utilities..................................................... 1.4 1.3 1.3Depreciation and amortization................................................... 3.4 3.0 2.6Rents and purchased transportation............................................ 26.4 30.0 32.3Other......................................................................................... 2.5 2.3 2.5(Gain) on sale of equipment ...................................................... (0.1) – (0.1)
99.9% 97.6% 98.5%
ClipperCost of services.......................................................................... 87.3% 85.5% 85.9%Selling, administrative and general............................................ 12.3 13.3 12.8
99.6% 98.8% 98.7%
Treadco, Inc. (see Note R)Cost of sales.............................................................................. – 66.6% 68.8%Selling, administrative and general............................................ – 30.4 29.3
– 97.0% 98.1%
Operating Income
ABF Freight System, Inc................................................................. 6.2% 9.7% 8.4%G.I. Trucking Company (see Note S).............................................. 0.1 2.4 1.5Clipper............................................................................................ 0.4 1.2 1.3Treadco, Inc. (see Note R).............................................................. – 3.0 1.9

MANAGEMENT’S DISCUSSION AND ANALYSIS OF FINANCIAL CONDITION AND RESULTS OF OPERATIONS - continued
Results of Operations
2001 Compared to 2000
Consolidated revenues from continuing operations of the Company in 2001 were $1,526.2 million compared to $1,839.6 million in 2000, representing a decrease of 17.0%, due primarily to decreases in revenues for Treadco and G.I. Trucking. On October 31, 2000, substantially all of the assets and liabilities of Treadco were contributed to Wingfoot (see Note R) and on August 1, 2001, the Company sold the stock of G.I. Trucking (see Note S). In addition, there were declines in revenues for ABF and Clipper for 2001 compared to 2000, as a result of a decline in the U.S. economy beginning in mid-2000. This economic decline was further accelerated by the September 11 terrorist attacks on the World Trade Center and on the Pentagon. Operating income decreased 45.8% to $75.9 million in 2001 from $140.2 million in 2000. The decrease in operating income is due primarily to a decline in operating income for ABF, which relates primarily to the previously discussed revenue declines. Income from continuing operations for 2001 was $41.4 million, or $1.66 per diluted common share, compared to $76.2 million, or $3.17 per diluted common share, for 2000. The decrease in income from continuing operations reflects primarily the decrease in operating income offset, in part, by a pre-tax gain of $4.6 million from the sale of G.I. Trucking, lower interest expense from lower average debt levels and a tax benefit of $1.9 million resulting from the resolution of certain tax contingencies arising in prior years. Income from continuing operations for 2000 includes a fair value net gain on the Treadco/Wingfoot transaction (see Note R) of $5.0 million.
Tonnage levels for 2001 at ABF, the Company’s primary subsidiary, continued to be impacted by the decline in the U.S. economy, as discussed above. The declines in tonnage increased by approximately 2.0% to 3.0% following the September 11 terrorist attacks. Tonnage levels in early 2002 continue to be impacted by the decline in the U. S. economy. The Company expects this impact to continue through the first quarter of 2002 and potentially further into 2002.
The Company’s 2001 results included seven months of operations for G.I. Trucking (see Note S). The Company’s 2000 results included ten months of operations for Treadco (see Note R) and a full twelve months of operations for G.I. Trucking.
Reliance Insurance Company (“Reliance”) insured the Company’s workers’ compensation claims in excess of $300,000 (“excess claims”) for the period from 1993 through 1999. According to an Official Statement by the Pennsylvania Insurance Department on October 3, 2001, Reliance was determined to be insolvent, with total admitted assets of $8.8 billion and liabilities of $9.9 billion, or a negative surplus position of $1.1 billion, as of March 31, 2001. As of December 31, 2001, the Company estimates its workers’ compensation claims insured by Reliance to be approximately $5.8 million. The Company has been in contact with and has received either written or verbal confirmation from a number of state guaranty funds that they will accept excess claims, representing a total of approximately $2.5 million of the $5.8 million. Based upon the limited available Reliance financial information, the Company estimates its current exposure to Reliance to be $0.5 million, for which it established reserves in the third quarter of 2001. In evaluating that same financial information, the Company anticipates receiving, from guaranty funds or through orderly liquidation, partial reimbursement for future claims payments, a process that could take several years.
The Company’s defined benefit pension plans experienced returns on assets that were below the 9.0% to 10.0% return on assets assumed for calculating its pension expense under FASB Statement No. 87, Employers’ Accounting for Pensions. As a result of this and other factors relating to normal plan cost fluctuations, the Company’s net periodic pension cost increased to an expense of $3.8 million from a credit of $2.5 million in

MANAGEMENT’S DISCUSSION AND ANALYSIS OF FINANCIAL CONDITION AND RESULTS OF OPERATIONS - continued
2000. If the same stock market trends continue into 2002, the Company could experience additional increases in its pension expense.
ABF Freight System, Inc.
Effective August 1, 2001 and August 14, 2000, ABF implemented general rate increases of 4.9% and 5.7%, respectively, in part, to cover known and expected cost increases.
Revenues for 2001 declined 7.0% to $1,282.3 million from $1,379.3 million in 2000. ABF generated operating income for 2001 of $79.4 million compared to $133.8 million in 2000.
ABF’s decline in revenue is due to a decrease in LTL tonnage and fuel surcharges, which was partially offset by an increase in revenue per hundredweight. ABF’s LTL tonnage decreased 9.3% in 2001, compared to 2000. ABF’s performance for 2001 was affected by less available freight, due to decreased business levels at customer facilities, primarily as a result of a decline in the U.S. economy. The decrease in tonnage was offset, in part, by an LTL revenue per hundredweight increase of 2.3% to $21.62 in 2001 compared to $21.13 in 2000, as the pricing environment remained relatively firm.
ABF implemented a fuel surcharge on July 7, 1999, based on the increase in diesel fuel prices compared to an index price. The fuel surcharge in effect during 2001 averaged 3.3% of revenue. The fuel surcharge in effect during 2000 averaged 4.1% of revenue.
ABF’s operating ratio increased to 93.8% for 2001 from 90.3% in 2000, primarily as a result of tonnage declines and changes in certain operating expense categories as follows:
Salaries and wages expense for 2001 increased 3.2% as a percent of revenue compared to 2000. The increase results from the annual general International Brotherhood of Teamsters (“IBT”) contractual wage and benefit rate increase on April 1, 2001 of approximately 3.0%, as well as an increase in wages and benefits costs for road drivers, resulting from ABF’s decision to utilize additional road drivers and company-owned equipment to move freight in certain poor service rail lanes rather than rail. In addition, portions of such costs are primarily fixed in nature and increase as a percent of revenue with decreases in revenue levels.
Supplies and expenses increased 0.4% as a percent of revenue for 2001, compared to 2000. Equipment repair costs have increased due to ABF’s older trailer fleet. This increase was offset by a decline in fuel costs, excluding taxes that on a price-per-gallon basis declined to $0.87 for 2001 from $0.95 in 2000.
Operating taxes and licenses increased 0.2% as a percent of revenue for 2001, compared to 2000, due primarily to an increase of approximately 200 road trailers owned by the Company. In addition, portions of such costs are primarily fixed in nature and increase as a percent of revenue with decreases in revenue levels.
Insurance expense decreased 0.2% as a percent of revenue for 2001, compared to 2000. This improvement was due primarily to favorable claims experience for property damage and liability claims and cargo claims.
Depreciation and amortization expense increased 0.5% as a percent of revenue for 2001, compared to 2000, due primarily to the purchase of 500 road tractors during 2001. The road tractors purchased were to replace older tractors in the fleet that have been transferred to city use, including some that were under operating leases in the first quarter of 2000. In addition, portions of such costs are primarily fixed in nature and increase as a percent of revenue with decreases in revenue levels.

MANAGEMENT’S DISCUSSION AND ANALYSIS OF FINANCIAL CONDITION AND RESULTS OF OPERATIONS - continued
Rents and purchased transportation expense decreased 0.7% as a percent of revenue for 2001, compared to 2000. This is due primarily to a decline in rail utilization to 13.5% of total miles for 2001, compared to 15.6% in 2000, as the Company is utilizing more company-owned equipment and road drivers for certain linehaul moves, as previously discussed. In addition, rents and purchased transportation costs decreased due to the disposal of some tractors under operating leases, as previously mentioned.
As previously mentioned, ABF’s general rate increase of 4.9% on August 1, 2001 was put in place to cover known and expected cost increases for the next twelve months. ABF’s ability to retain this rate increase is dependent on the pricing environment, which, in 2001, remained relatively firm. The pricing environment could potentially worsen in 2002, if the U.S. economy continues to decline, and it could become firmer if the U.S. economy improves. ABF will experience an effective annual general contractual wage and benefit increase for 2002, of an estimated 3.0% under its agreement with the IBT. The base wage and pension cost portion of the increase will occur on April 1, 2002 and the health and welfare cost portion of the increase will occur on August 1, 2002. In addition, ABF could be impacted by fluctuating fuel prices during 2002. Although fuel prices stabilized during the latter part of 2001, there can be no assurances that they will remain stable. ABF’s fuel surcharges on revenue are intended to offset any fuel cost increases. ABF’s insurance premium costs for 2002 will increase, in part, because of the terrorist acts of September 11. The increase is approximately 180.0% or $7.0 million, from its 2001 premiums. In 2001, insurance premiums represented only 10% of ABF’s total insurance costs. In 2002, it is anticipated that insurance premiums will represent approximately 29.0% of total insurance costs. During 2001, ABF experienced increases in its nonunion benefit costs of 41.0%, representing increased medical, prescription drug and pension costs. These costs represented approximately 2.0% of ABF’s revenue in 2001. Based on recent trends, these costs could continue to increase during 2002 as well, although there can be no certainty of this.
G.I. Trucking Company
On August 1, 2001, the Company sold the stock of G.I. Trucking for $40.5 million in cash to a company formed by the senior executives of G.I. Trucking and Estes Express Lines (“Estes”) (see Note S). The Company recognized a pre-tax gain on the sale of $4.6 million in the third quarter of 2001. Cash proceeds from the sale, net of costs and income taxes, of approximately $33.0 million were used to pay down the Company’s outstanding debt. The Company retained ownership of three California terminal facilities and has agreed to lease them for an aggregate amount of $1.6 million per year to G.I. Trucking for a period of up to four years. G.I. Trucking has an option at any time during the four-year lease term to purchase these terminals for $19.5 million. The facilities have a net book value of approximately $6.0 million. If the terminal facilities are sold to G.I. Trucking, the Company will recognize a pre-tax gain of approximately $14.0 million in the period they are sold.
The Company’s revenue and operating income includes seven months of operations for G.I. Trucking for 2001. Revenues for G.I. Trucking for 2001 were $95.5 million, compared to $161.9 million in 2000. Operating income was $0.1 million for 2001, compared to $3.9 million in 2000 (see Note M).

MANAGEMENT’S DISCUSSION AND ANALYSIS OF FINANCIAL CONDITION AND RESULTS OF OPERATIONS - continued
Clipper
Effective August 13, 2001 and August 1, 2000, Clipper implemented general rate increases of 4.9% and 5.9%, respectively, for LTL shipments. Revenues for Clipper decreased 2.3% to $127.3 million in 2001 from $130.2 million in 2000.
LTL revenue per shipment increased 5.5% for 2001, compared to 2000. LTL shipments declined 18.5% for 2001, compared to 2000. LTL shipment declines reflect Clipper’s movement away from unprofitable LTL business and lower business levels, resulting from the decline in the U.S. economy, including the impact of the September 11, 2001 terrorist attacks. In addition, the LTL division suffered from changes in the shipping pattern of a large customer, which reduced the LTL shipments handled by Clipper.
Intermodal revenue per shipment increased only 0.8% for 2001, when compared to 2000, due to increased competition for business, resulting from unused capacity in the over-the-road truckload industry, which impacted the intermodal pricing environment. The number of intermodal shipments increased 14.8% for 2001, compared to 2000, due primarily to increased shipment volumes from existing customers.
Clipper’s operating ratio increased to 99.6% for 2001, from 98.8% in 2000. Clipper’s operating ratio increased as a result of several factors. Clipper’s LTL division experienced steep shipment declines during 2001, as discussed above. In addition, a change in the mix of shipments handled by the LTL division contributed to a decline in rail utilization, which increased linehaul costs. Clipper’s rail utilization was 57.1% of total miles for 2001, compared to 63.8% in 2000. For Clipper, rail costs per mile are generally less expensive than over-the-road costs per mile. Finally, Clipper’s Controlled Logistics division experienced increased trailer maintenance costs on its older 45-foot refrigerated trailers. Clipper plans to either dispose of or move these trailers out of its rail operations during 2002.
Treadco, Inc.
On September 13, 2000, Treadco entered into an agreement with Goodyear to form a new limited liability company called Wingfoot Commercial Tire Systems, LLC (see Note R). The transaction closed on October 31, 2000. Effective October 31, 2000, Treadco contributed substantially all of its assets and liabilities to Wingfoot in a non-taxable transaction in exchange for a 19% ownership in Wingfoot. For the year ended December 31, 2000, tire operations included the operations of Treadco for the ten months ended October 31, 2000 only. Revenue and operating income for Treadco for the ten months ended October 31, 2000 were $158.3 million and $4.7 million, respectively (see Note M). There were no operations for Treadco during 2001.
In the last half of the 1990’s, changes were occurring in the traditional relationship between tire retreaders and raw materials franchisors and new tire suppliers in Treadco’s truck tire retreading and new tire sales business. As a result of these changes, in the first quarter of 1998, the Company began evaluating its then 46% investment in Treadco. This evaluation resulted in the Company’s January 1999 proposal to Treadco’s Board of Directors for the Company to acquire all outstanding Treadco common stock. The Company believed this would lower costs associated with Treadco being a small public company, lower state income tax costs and other tax benefits available to the Company if Treadco were a wholly owned subsidiary, and maximize its flexibility in managing Treadco in this changing environment. As these changes continued to evolve throughout 1999 and 2000, the Company concluded that an alliance of Treadco with one of the major new tire manufacturers, who were expanding their presence in the retread industry, provided Treadco the best opportunity at long-term survival and maximized its current value to the Company. In September 2000, the Company entered into its agreement with Goodyear, which created Wingfoot and gave the Company the right to “put” its interest to Goodyear for $73.4 million, as described below.

MANAGEMENT’S DISCUSSION AND ANALYSIS OF FINANCIAL CONDITION AND RESULTS OF OPERATIONS - continued
Under the agreement with Goodyear, the Company has the right, at any time after April 30, 2003 and before April 30, 2004, to sell its interest in Wingfoot to Goodyear for a cash “Put Price” equal to approximately $73.4 million. Goodyear has the right, at any time after April 30, 2003 until October 31, 2004, to purchase the Company’s entire interest, for cash, at a “Call Price” equal to the “Put Price” plus $5.0 million. As provided in the agreement between Goodyear and Treadco, the Company will not share in the profits or losses of Wingfoot during the term of the “Put.” If the Company does not exercise its right to sell its 19% interest in Wingfoot, the Company will account for its share of Wingfoot’s profits or losses beginning May 1, 2004, as provided in the Wingfoot Operating Agreement. If the Company “puts” its interest to Goodyear, the Company will record a pre-tax gain in the amount of $14.1 million in the quarter its interest is “Put.” If Goodyear “calls” the Company’s interest in Wingfoot, the Company will record a pre-tax gain of $19.1 million during the quarter the “call” is made by Goodyear (see Note R).
Interest
Interest expense was $12.6 million for 2001 compared to $16.7 million for 2000. The decline resulted from lower average debt levels when 2001 is compared to 2000.
Income Taxes
The difference between the effective tax rate for 2001 and the federal statutory rate resulted from state income taxes, amortization of nondeductible goodwill and other nondeductible expenses, as well as the impact of the $1.9 million tax benefit resulting from the resolution of certain tax contingencies arising in prior years (see Note F).
At December 31, 2001, the Company had deferred tax assets of $45.0 million, net of a valuation allowance of $3.4 million, and deferred tax liabilities of $54.5 million. The Company believes that the benefits of the deferred tax assets of $45.0 million will be realized through the reduction of future taxable income. Management has considered appropriate factors in assessing the probability of realizing these deferred tax assets. These factors include deferred tax liabilities of $54.5 million and the presence of significant taxable income in 2001 and 2000. The valuation allowance has been provided for the benefit of net operating loss carryovers in certain states with relatively short carryover periods and other limitations and for the excess tax basis in the investment in Wingfoot.
Management intends to evaluate the realizability of deferred tax assets on a quarterly basis by assessing the need for any additional valuation allowance.
Accounts Receivable
Accounts receivable decreased $57.1 million from December 31, 2000 to December 31, 2001, due primarily to a decrease in revenue levels and the sale of G.I. Trucking on August 1, 2001 (see Note S).
Investment in Wingfoot
The investment in Wingfoot relates to the contribution of substantially all of the assets and liabilities of Treadco to Wingfoot on October 31, 2000 (see Note R).

MANAGEMENT’S DISCUSSION AND ANALYSIS OF FINANCIAL CONDITION AND RESULTS OF OPERATIONS - continued
Other Noncurrent Assets
Other assets increased $8.2 million from December 31, 2000 to December 31, 2001, due to incentive pay deferrals and matching contributions made to the Company’s Voluntary Savings Plan assets, which are held in a trust account, and as a result of the Company paying off $13.2 million of life insurance loans which were netted against the cash surrender value on the policies included in other assets. These increases were offset by a decline in the Company’s pension asset of $6.4 million, which was due to the sale of G.I. Trucking on August 1, 2001 (see Note S) and $3.8 million in net periodic pension cost recorded in 2001 (see Note L).
Goodwill
The Company’s assets include goodwill, net of amortization, of $101.3 million, representing 14.0% of total assets and 30.0% of total stockholder’s equity. Goodwill includes $63.8 million resulting from a 1988 leveraged buyout transaction and $37.5 million resulting from the 1994 acquisition of Clipper. The Company’s accounting policy for reviewing the carrying amount of its goodwill for impairment is reflected in Note B to the Consolidated Financial Statements. No indications of impairment existed at December 31, 2001. However, the Company is required to test its goodwill for impairment under the new goodwill accounting rules prescribed by Statement 142. These rules were effective for the Company on January 1, 2002.
Accrued Expenses
Accrued expenses decreased $47.2 million from December 31, 2000 to December 31, 2001, due primarily to a decrease in incentive pay accruals as a result of a decline in profits, a decrease in the required reserves for loss, injury, damage and workers’ compensation claims, which resulted from better claims experience and a reduction in the required reserves related to a company acquired in 1995, a decrease in accrued interest due to the payment of interest to the IRS (see Note F) and due to the sale of G.I. Trucking on August 1, 2001 (see Note S).
Other Liabilities
Other liabilities increased $9.0 million from December 31, 2000 to December 31, 2001, due to incentive pay deferrals and matching contributions made to the Company’s Voluntary Savings Plan assets, which are held in a trust account. In addition, other liabilities increased due to an increase in the accruals for supplemental pension benefits.
2000 Compared to 1999
Consolidated revenues from continuing operations of the Company for 2000 were $1,839.6 million compared to $1,721.6 million for 1999, representing an increase of 6.9%, due primarily to increases in revenue for ABF, G.I. Trucking and Clipper, offset by a decline in revenues for Treadco as a result of the contribution of substantially all of the Treadco assets and liabilities to Wingfoot on October 31, 2000 (see Note R). The Company’s operating income from continuing operations for 2000 increased 27.8% to $140.2 million from $109.7 million in 1999. Increases in operating income from continuing operations for 2000 were attributable to improved operating income for ABF, G.I. Trucking, Clipper and Treadco. Income from continuing operations for 2000 was $76.2 million, or $3.17 per diluted common share, compared to $51.2 million, or $2.14 per diluted common share, for 1999. The improvements in income from continuing operations reflect improvements in operating income, lower interest costs and a fair value net gain on the Treadco/Wingfoot transaction (see Note R) of $5.0 million, or $0.12 per diluted common share.

MANAGEMENT’S DISCUSSION AND ANALYSIS OF FINANCIAL CONDITION AND RESULTS OF OPERATIONS - continued
The Company experienced a slowdown in business levels, resulting from a decline in the economy, beginning in mid-2000. As a result, LTL tonnage levels for ABF, the Company’s largest subsidiary, declined 4.3% on a per-day basis in the fourth quarter of 2000 from the fourth quarter 1999. G.I. Trucking’s fourth quarter 2000 tonnage increased at a slower pace than previous quarters of 2000 and Clipper’s fourth quarter 2000 LTL and intermodal shipment levels declined relative to the same period in 1999, where previous quarters of 2000 showed primarily increases.
ABF Freight System, Inc.
Effective August 14, 2000, ABF implemented a general rate increase of 5.7%. Previous overall rate increases effective January 1, 1999 and September 13, 1999 were 5.5% and 5.1%, respectively. Revenues for 2000 increased 8.0% to $1,379.3 million from $1,277.1 million for 1999. ABF generated operating income for 2000 of $133.8 million compared to $107.0 million for 1999.
ABF’s increase in revenue is due primarily to an increase in LTL revenue per hundredweight of 8.0% to $21.13 for 2000 compared to $19.57 in 1999, reflecting a favorable pricing environment. ABF’s revenue increase also results from a slight increase in LTL tonnage of 0.6% for 2000 compared to 1999. However, total tonnage for ABF declined from 1999 by 0.5%. LTL tonnage per day for the fourth quarter of 2000 declined 4.3% when compared to the fourth quarter of 1999. ABF’s fourth quarter 2000 performance was affected by less available freight due to decreased business levels at customer facilities. In addition, tonnage declines reflect declining density in ABF’s freight mix and the fact that customers were shipping more heavily in the fourth quarter of 1999 to prepare for the “Year 2000.”
ABF implemented a fuel surcharge on July 7, 1999, based on the increase in diesel fuel prices compared to an index price. The fuel surcharge in effect during 2000 ranged from 1.5% to 6.0% of revenue. The fuel surcharge in effect during the third and fourth quarters of 1999 ranged from 0.5% to 2.0% of revenue.
ABF’s operating ratio improved to 90.3% for 2000 from 91.6% in 1999. The improvements are the result of the revenue yield improvements previously described and as a result of changes in certain operating expense categories as follows:
Salaries and wages expense for 2000 declined 1.7% as a percent of revenue compared to 1999. The decline results primarily from the revenue yield improvements previously discussed. These improvements were offset, in part, by the annual general union wage and benefit rate increase on April 1, 2000 of approximately 3.0%, and an increase in incentive pay amounts.
Supplies and expenses increased 1.6% as a percent of revenue for 2000 compared to 1999. This change is due primarily to higher diesel fuel prices, which increased 61.2% on an average price-per-gallon basis, net of fuel taxes, when the year 2000 is compared to 1999. The previously mentioned fuel surcharge on revenue is intended to offset the fuel cost increase.
Depreciation and amortization expense increased 0.2% as a percent of revenue for the year 2000 compared to 1999, due primarily to the purchase of 608 road tractors during 2000. The road tractors purchased include approximately 101 additions with the remaining units replacing older tractors in the fleet, including many which were under operating leases in the same periods of 1999.
Rents and purchased transportation expense decreased 1.2% as a percent of revenue for 2000 compared to 1999, due to the disposal of tractors under operating leases, as previously mentioned. In addition, total rail
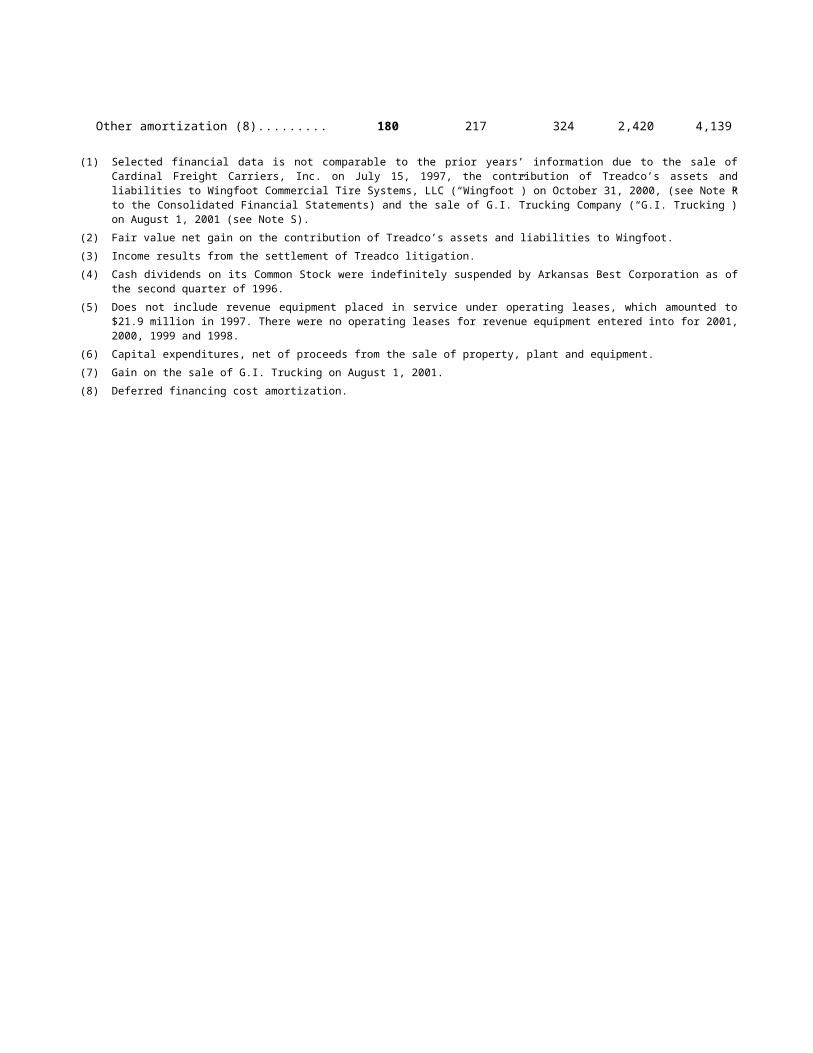
MANAGEMENT’S DISCUSSION AND ANALYSIS OF FINANCIAL CONDITION AND RESULTS OF OPERATIONS - continued
costs decreased as a percent of revenue, as a result of a decline in the utilization of rail for 2000. Rail utilization was 15.6% of total miles compared to 18.3% during 1999.
G.I. Trucking Company
Effective September 1, 2000 and October 1, 1999, G.I. Trucking implemented a general rate increase of 5.9% and 5.5%, respectively. G.I. Trucking revenues for 2000 increased 17.8% to $161.9 million from $137.4 million in 1999. The revenue increase resulted from an increase in G.I. Trucking’s tonnage of 13.2% for 2000 from 1999. In addition, revenue per hundredweight increased 4.1% from the same period in 1999. During the early part of first quarter 2000, G.I. Trucking expanded its operational capabilities in the states of Texas, New Mexico, Oklahoma, Kansas and parts of Missouri, in preparation for adding new business from an existing carrier partner. In addition, G.I. Trucking increased its sales management and sales staff throughout its system by nearly 50% over 1999 levels.
G.I. Trucking implemented a fuel surcharge during the last week of August 1999, based upon a West Coast average fuel index. The fuel surcharge in effect during 2000 ranged from 2.6% to 7.3% of revenue, while the fuel surcharge in effect for the last four months of 1999 ranged from 1.6% to 2.4% of revenue.
G.I. Trucking’s operating ratio improved to 97.6% for 2000 from 98.5% in 1999, as a result of the increases in tonnage and revenue yield improvements previously described. In addition, the change in the operating ratio results from changes in certain operating expenses as follows:
Salaries and wages expense increased 0.2% as a percent of revenue during 2000 compared to 1999. This increase is due primarily to increased salaries and benefits related to the addition of sales staff described above and unfavorable workers’ compensation claims experience offset, in part, by lower pension costs.
Supplies and expenses increased 1.4% as a percent of revenue for 2000 compared to 1999. The increase is due primarily to higher fuel costs, which increased in total dollars by 73.7% in 2000 compared to 1999 and as a result of more miles run on company-owned equipment rather than by third-party purchased transportation providers. G.I. Trucking’s fuel surcharge on revenue is intended to offset the fuel cost increase.
Operating taxes and licenses expense decreased 0.3% as a percent of revenue for 2000 compared to 1999, due primarily to the fact that a portion of such costs is primarily fixed in nature and declines as a percent of revenue with increases in revenue levels.
Insurance expense decreased 0.2% as a percent of revenue for 2000 compared to 1999. This decrease is due to favorable claims experience for property damage and liability claims during 2000 as compared to 1999.
Depreciation and amortization increased 0.4% as a percent of revenue for 2000 compared to 1999, due primarily to G.I. Trucking adding 307 trailers and 29 tractors to their fleet during 2000 as a result of revenue growth and an effort to utilize company-owned equipment rather than purchased transportation for certain linehaul moves.
Rents and purchased transportation expenses decreased 2.3% as a percent of revenue for 2000 compared to 1999. G.I. Trucking has decreased its purchased transportation costs by utilizing company-owned equipment for specific linehaul moves during 2000 compared to 1999, as previously discussed.

MANAGEMENT’S DISCUSSION AND ANALYSIS OF FINANCIAL CONDITION AND RESULTS OF OPERATIONS - continued
Clipper
Clipper implemented a general rate increase of 5.9% for LTL shipments as of August 1, 2000. Revenues for Clipper increased 16.0% to $130.2 million for 2000 from $112.2 million in 1999. Intermodal revenue per shipment increased 26.7% during 2000 compared to 1999. However, intermodal shipments declined 5.8% during 2000 compared to 1999. LTL revenue per shipment increased 3.9% during 2000 compared to 1999 while LTL shipments declined 2.1% in 2000 compared to 1999. LTL and intermodal shipment declines reflect Clipper’s movement away from unprofitable business and lower business levels.
Revenues for Clipper in the fourth quarter 2000 increased only 1.9% on a per-day basis from the same period in 1999. Intermodal revenue per shipment increased 41.5% during the fourth quarter 2000 compared to fourth quarter 1999. However, intermodal shipments declined 18.9% during the fourth quarter 2000 compared to fourth quarter 1999. LTL revenue per shipment decreased 3.1% and LTL shipments declined 16.1% in the fourth quarter 2000 compared to fourth quarter 1999. Both the intermodal and LTL divisions continued to move away from some unprofitable business during the fourth quarter of 2000. The intermodal division was able to add some new business with improved profit margins. The LTL division was not able to readily replace its lost revenue. In addition, the LTL division suffered from changes in the shipping pattern of a large customer, which reduced the LTL shipments handled by Clipper.
Clipper’s operating ratio increased slightly to 98.8% for 2000 from 98.7% in 1999, due primarily to an increase in selling, administrative and general costs of 0.5% as a percent of revenue for the year 2000. Clipper experienced a higher-than-normal increase in bad debt expense, resulting from bankruptcies during 2000. Additional costs were also incurred for information technology improvements and lease termination charges. These increases were offset, in part, by gross margin improvements on its intermodal and produce shipments. Clipper’s gross margins improved, in part, as a result of a higher level of rail utilization for the year 2000. Clipper’s rail utilization was 63.8% of total miles for 2000 compared to 59.3% during 1999. For Clipper, rail costs per mile are less expensive than over-the-road costs per mile.
Treadco, Inc.
Effective October 31, 2000, Treadco contributed substantially all of its assets and liabilities to Wingfoot in a non-taxable transaction in exchange for a 19% ownership in Wingfoot (see Note R). For the year ended December 31, 2000, tire operations included the operations of Treadco for the ten months ended October 31, 2000 only. Revenue and operating income for Treadco for the ten months ended October 31, 2000 were $158.3 million and $4.7 million, respectively. Revenue and operating income for Treadco for 1999 were $186.6 million and $3.6 million, respectively (see Note M).
Interest
Interest expense was $16.7 million for 2000 compared to $18.4 million for 1999. The decline resulted from lower average debt levels when 2000 is compared to 1999.
Income Taxes
The difference between the effective tax rate for the year ended December 31, 2000 and the federal statutory rate resulted from state income taxes, amortization of nondeductible goodwill and other nondeductible expenses (see Note F).

MANAGEMENT’S DISCUSSION AND ANALYSIS OF FINANCIAL CONDITION AND RESULTS OF OPERATIONS - continued
Seasonality
ABF is affected by seasonal fluctuations which affects its tonnage to be transported. Freight shipments, operating costs and earnings are also affected adversely by inclement weather conditions. The third calendar quarter of each year usually has the highest tonnage levels while the first quarter has the lowest. Clipper’s operations are similar to operations at ABF with revenues being weaker in the first quarter and stronger during the months of September and October.
Environmental Matters
The Company’s subsidiaries, or lessees, store fuel for use in tractors and trucks in approximately 76 underground tanks located in 25 states. Maintenance of such tanks is regulated at the federal and, in some cases, state levels. The Company believes that it is in substantial compliance with all such regulations. The Company is not aware of any leaks from such tanks that could reasonably be expected to have a material adverse effect on the Company.
The Company has received notices from the EPA and others that it has been identified as a potentially responsible party (“PRP”) under the Comprehensive Environmental Response Compensation and Liability Act or other federal or state environmental statutes at several hazardous waste sites. After investigating the Company’s or its subsidiaries’ involvement in waste disposal or waste generation at such sites, the Company has either agreed to de minimis settlements (aggregating approximately $340,000 over the last 12 years), or believes its obligations with respect to such sites would involve immaterial monetary liability, although there can be no assurances in this regard.
As of December 31, 2001, the Company has accrued approximately $2.4 million to provide for environmental-related liabilities. The Company’s environmental accrual is based on management’s best estimate of the actual liability. The Company’s estimate is founded on management’s experience in dealing with similar environmental matters and on actual testing performed at some sites. Management believes that the accrual is adequate to cover environmental liabilities based on the present environmental regulations. Accruals for environmental liability are included in the balance sheet as accrued expenses.
Forward-Looking Statements
Statements contained in the Management’s Discussion and Analysis section of this report that are not based on historical facts are “forward-looking statements.” Terms such as “estimate,” “forecast,” “expect,” “predict,” “plan,” “anticipate,” “believe,” “intend,” “should,” “would,” “scheduled,” and similar expressions and the negatives of such terms are intended to identify forward-looking statements. Such statements are by their nature subject to uncertainties and risks, including, but not limited to, union relations; availability and cost of capital; shifts in market demand; weather conditions; the performance and needs of industries served by Arkansas Best’s subsidiaries; actual future costs of operating expenses such as fuel and related taxes; self-insurance claims and employee wages and benefits; actual costs of continuing investments in technology; the timing and amount of capital expenditures; competitive initiatives and pricing pressures; general economic conditions; and other financial, operational and legal risks and uncertainties detailed from time to time in the Company’s Securities and Exchange Commission (“SEC”) public filings.

QUANTITATIVE AND QUALITATIVE DISCLOSURES ABOUT MARKET RISK
Interest Rate Instruments
The Company has historically been subject to market risk on all or a part of its borrowings under bank credit lines, which have variable interest rates.
In February 1998, the Company entered into an interest rate swap effective April 1, 1998. The swap agreement is a contract to exchange variable interest rate payments for fixed rate payments over the life of the instrument. The notional amount is used to measure interest to be paid or received and does not represent the exposure to credit loss. The purpose of the swap is to limit the Company’s exposure to increases in interest rates on the notional amount of bank borrowings over the term of the swap. The fixed interest rate under the swap is 5.845% plus the Credit Agreement margin (currently 0.575%). On January 1, 2001, this instrument was recorded on the balance sheet of the Company. Details regarding the swap, as of December 31, 2001, are as follows:
Notional Rate Rate FairAmount Maturity Paid Received Value (2)(3)
$110.0 million April 1, 2005 5.845% Plus Credit Agreement LIBOR rate (1) ($5.4) millionMargin (currently 0.575%) Plus Credit Agreement
Margin (currently 0.575%)
(1) LIBOR rate is determined two London Banking Days prior to the first day of every month and continues up to and including the maturity date.
(2) The fair value is an amount estimated by Societe Generale (“process agent”) that the Company would have paid at December 31, 2001 to terminate the agreement.
(3) The swap value declined from ($0.1) million at December 31, 2000. The fair value is impacted by changes in rates of similarly termed Treasury instruments.
Fair Value of Financial Instruments
The following methods and assumptions were used by the Company in estimating its fair value disclosures for all financial instruments, except for the interest-rate swap agreement disclosed above and capitalized leases:
Cash and Cash Equivalents. The carrying amount reported in the balance sheets for cash and cash equivalents approximates its fair value.
Long- and Short-Term Debt. The carrying amounts of the Company’s borrowings under its Revolving Credit Agreements approximate their fair values, since the interest rate under these agreements is variable. Also, the carrying amount of long-term debt was estimated to approximate their fair values, with the exception of the Subordinated Debentures, which are estimated using current market rates.
The carrying amounts and fair value of the Company’s financial instruments at December 31 are as follows:
2001 2000Carrying Fair Carrying FairAmount Value Amount Value
($ thousands)
Cash and cash equivalents................................ $ 14,860 $ 14,860 $ 36,742 $ 36,742Short-term debt................................................ $ 24 $ 24 $ 21 $ 21Long-term debt................................................. $ 114,917 $ 114,498 $ 138,814 $ 137,831

QUANTITATIVE AND QUALITATIVE DISCLOSURES ABOUT MARKET RISK - continued
Borrowings under the Company’s Credit Agreement in excess of $110.0 million are subject to market risk. During 2001, outstanding debt obligations under the Credit Agreement periodically exceeded $110.0 million. The Company’s highest borrowings during 2001 reached $134.0 million, and the average borrowings during the year were $111.7 million. A 100-basis-point change in interest rates on Credit Agreement borrowings above $110.0 million would change annual interest cost by $100,000 per $10.0 million of borrowings.
The Company is subject to market risk for increases in diesel fuel prices; however, this risk is mitigated by fuel surcharges which are included in the revenues of ABF and Clipper based on increases in diesel fuel prices compared to relevant indexes.
The Company does not have a formal foreign currency risk management policy. The Company’s foreign operations are not significant to the Company’s total revenues or assets. Revenue from non-U.S. operations amounted to less than 1.0% of total revenues for 2001. Accordingly, foreign currency exchange rate fluctuations have never had a significant impact on the Company, and they are not expected to in the foreseeable future.
The Company has not historically entered into financial instruments for trading purposes, nor has the Company historically engaged in hedging fuel prices. No such instruments were outstanding during 2001 or 2000.

REPORT OF ERNST & YOUNG LLP, INDEPENDENT AUDITORS
Stockholders and Board of DirectorsArkansas Best Corporation
We have audited the accompanying consolidated balance sheets of Arkansas Best Corporation and subsidiaries as of December 31, 2001 and 2000, and the related consolidated statements of operations, stockholders’ equity, and cash flows for each of the three years in the period ended December 31, 2001. These financial statements are the responsibility of the Company’s management. Our responsibility is to express an opinion on these financial statements based on our audits.
We conducted our audits in accordance with auditing standards generally accepted in the United States. Those standards require that we plan and perform the audit to obtain reasonable assurance about whether the financial statements are free of material misstatement. An audit includes examining, on a test basis, evidence supporting the amounts and disclosures in the financial statements. An audit also includes assessing the accounting principles used and significant estimates made by management, as well as evaluating the overall financial statement presentation. We believe that our audits provide a reasonable basis for our opinion.
In our opinion, the consolidated financial statements referred to above present fairly, in all material respects, the consolidated financial position of Arkansas Best Corporation and subsidiaries at December 31, 2001 and 2000, and the consolidated results of their operations and their cash flows for each of the three years in the period ended December 31, 2001, in conformity with accounting principles generally accepted in the United States.
Ernst & Young LLP
Little Rock, ArkansasJanuary 18, 2002,except for Note D and Note U, as to which the date is February 25, 2002

ARKANSAS BEST CORPORATIONCONSOLIDATED BALANCE SHEETS
December 312001 2000
($ thousands)
ASSETS
CURRENT ASSETS
Cash and cash equivalents............................................................................. $ 14,860 $ 36,742
Accounts receivable, less allowances
(2001 – $3,483; 2000 – $4,595)................................................................... 116,430 173,485
Prepaid expenses .......................................................................................... 6,803 8,325
Deferred income taxes ................................................................................. 22,193 11,442
Federal and state income taxes prepaid ........................................................ 2,647 –
Other ............................................................................................................ 4,027 4,459
TOTAL CURRENT ASSETS ................................................................ 166,960 234,453
PROPERTY, PLANT AND EQUIPMENT
Land and structures ...................................................................................... 214,856 208,220
Revenue equipment ...................................................................................... 334,622 347,388
Service, office and other equipment ............................................................. 79,268 74,397
Leasehold improvements .............................................................................. 12,359 12,693
641,105 642,698
Less allowances for depreciation and amortization ....................................... 306,928 296,679
334,177 346,019
INVESTMENT IN WINGFOOT.................................................................... 59,341 59,341
OTHER ASSETS............................................................................................. 58,949 50,792
ASSETS HELD FOR SALE............................................................................ 2,402 1,101
GOODWILL, less amortization (2001 – $44,469; 2000 – $40,416).................. 101,324 105,418
$ 723,153 $ 797,124

ARKANSAS BEST CORPORATIONCONSOLIDATED BALANCE SHEETS
December 312001 2000
($ thousands)
LIABILITIES AND STOCKHOLDERS’ EQUITY
CURRENT LIABILITIES
Bank overdraft and drafts payable................................................................. $ 6,515 $ 24,667
Accounts payable ......................................................................................... 50,366 59,999
Accrued expenses.......................................................................................... 121,423 168,625
Federal and state income taxes...................................................................... – 4,127
Current portion of long-term debt ................................................................. 14,834 23,948
TOTAL CURRENT LIABILITIES ...................................................... 193,138 281,366
LONG-TERM DEBT, less current portion ...................................................... 115,003 152,997
FAIR VALUE OF INTEREST RATE SWAP ............................................... 5,383 –
OTHER LIABILITIES ................................................................................... 40,097 31,052
DEFERRED INCOME TAXES ..................................................................... 31,736 39,519
FUTURE MINIMUM RENTAL COMMITMENTS, NET (NOTE J)
(2001 - $46,124; 2000 - $49,769) ................................................................. – –
OTHER COMMITMENTS AND CONTINGENCIES.................................. – –
STOCKHOLDERS’ EQUITY
Preferred stock, $.01 par value, authorized 10,000,000 shares;
issued and outstanding 2000: 1,390,000 shares ......................................... – 14
Common stock, $.01 par value, authorized 70,000,000 shares;
issued 2001: 24,542,163 shares; 2000: 20,219,137 shares......................... 245 202
Additional paid-in capital ............................................................................. 204,463 194,211
Retained earnings ......................................................................................... 137,635 98,718
Treasury stock, at cost, 2001 and 2000: 59,782 shares................................... (955) (955)
Accumulated other comprehensive loss......................................................... (3,592) –
TOTAL STOCKHOLDERS’ EQUITY ................................................ 337,796 292,190
$ 723,153 $ 797,124
The accompanying notes are an integral part of the consolidated financial statements.

ARKANSAS BEST CORPORATIONCONSOLIDATED STATEMENTS OF OPERATIONS
Year Ended December 312001 2000 1999
($ thousands, except per share data)OPERATING REVENUES
Transportation operations................................................................. $ 1,526,206 $ 1,683,212 $ 1,537,271Tire operations................................................................................. – 156,355 184,315
1,526,206 1,839,567 1,721,586
OPERATING EXPENSES AND COSTSTransportation operations................................................................. 1,450,272 1,546,847 1,430,294Tire operations................................................................................. – 152,568 181,585
1,450,272 1,699,415 1,611,879OPERATING INCOME...................................................................... 75,934 140,152 109,707
OTHER INCOME (EXPENSE)Net gains on sales of property and other .......................................... 918 2,608 871Gain on sale of G.I. Trucking Company .......................................... 4,642 – –Fair value net gain – Wingfoot ........................................................ – 5,011 –Interest expense ............................................................................... (12,636) (16,687) (18,395)Minority interest in Treadco, Inc. .................................................... – – 245Other, net ........................................................................................ (2,139) (1,961) (4,791)
(9,215) (11,029) (22,070)
INCOME FROM CONTINUING OPERATIONS BEFORE INCOME TAXES ......................................................... 66,719 129,123 87,637
FEDERAL AND STATE INCOME TAXES Current ............................................................................................ 25,367 42,851 33,327Deferred .......................................................................................... (52) 10,117 3,128
25,315 52,968 36,455
INCOME FROM CONTINUING OPERATIONS ............................ 41,404 76,155 51,182
DISCONTINUED OPERATIONSLoss from discontinued operations (net of tax benefits of $472) ..... – – (786)
LOSS FROM DISCONTINUED OPERATIONS .............................. – – (786)
NET INCOME .................................................................................... 41,404 76,155 50,396Preferred stock dividends ................................................................ 2,487 4,122 4,298
NET INCOME FOR COMMON STOCKHOLDERS ...................... $ 38,917 $ 72,033 $ 46,098
NET INCOME (LOSS) PER COMMON SHARE Basic: Continuing operations ........................................................................ $ 1.79 $ 3.62 $ 2.38 Discontinued operations ..................................................................... – – (0.04)NET INCOME PER SHARE (BASIC) ................................................. $ 1.79 $ 3.62 $ 2.34
Diluted: Continuing operations ........................................................................ $ 1.66 $ 3.17 $ 2.14
Discontinued operations ..................................................................... – – (0.03)NET INCOME PER SHARE (DILUTED) ........................................... $ 1.66 $ 3.17 $ 2.11
CASH DIVIDENDS PAID PER COMMON SHARE .......................... $ – $ – $ –
The accompanying notes are an integral part of the consolidated financial statements.

ARKANSAS BEST CORPORATIONCONSOLIDATED STATEMENTS OF STOCKHOLDERS’ EQUITY
AccumulatedAdditional Retained Other
Preferred Stock Common Stock Paid-In Earnings Comprehensive Treasury TotalShares Amount Shares Amount Capital (Deficit) Loss Stock Equity
(thousands)
Balances at January 1, 1999.............................. 1,495 $ 15 19,610 $ 196 $ 193,117 $ (19,413) – – $ $ 173,915
Net income...................................................... – –- –-
– 50,396 – – 50,396
Comprehensive income................................ 50,396Tax effect of stock options exercised............ – – 7 – – – 7Issuance of common stock............................. – 142 1 1,031 – – – 1,032Dividends paid on preferred stock................ – – – (4,298) – – (4,298)
Balances at December 31, 1999 ....................... 1,495 15 19,752 197 194,155 26,685 –– – –
– 221,052
Net income...................................................... – – – 76,155 – – 76,155 Comprehensive income................................ 76,155
Issuance of common stock............................. – 467 5 3,829 – – – 3,834Tax effect of stock options exercised............ – – 150 – – – 150Purchase of preferred stock............................ (105) (1) – (3,923) – – – (3,924)Purchase of treasury stock............................. – – – – – (955) (955)Dividends paid on preferred stock................ – – – (4,122) – – (4,122)
Balances at December 31, 2000........................ 1,390 14 20,219 202 194,211 98,718 – (955) 292,190
Net income...................................................... – – – 41,404 – – 41,404Fair value of interest rate swap (a)............... – – – – (3,289) – (3,289)Foreign currency translation (a)................... – – – – (303) – (303)
Comprehensive income ............................... 37,812Issuance of common stock............................. – 811 8 7,638 – – – 7,646Tax effect of stock options exercised............ – – 1,510 – – – 1,510Purchase of preferred stock............................ (7) – – (414) – – – (414)Conversion of preferred stock to common................................................... (1,383) (14) 3,512 35 (21) – – – –Dividends paid on preferred stock................ – – – (2,487) – – (2,487)Fair value of G.I. Trucking and Treadco
officer stock options and other .................. – – 1,539 – – – 1,539
Balances at December 31, 2001........................ – $ – 24,542 $ 245 $ 204,463 $ 137,635 $ (3,592) $ (955) $ 337,796
The accompanying notes are an integral part of the consolidated financial statements.
(a) Net of tax benefits of $2.1 million relating to the fair value of the interest rate swap and $0.2 million relating to the foreign currency translation.
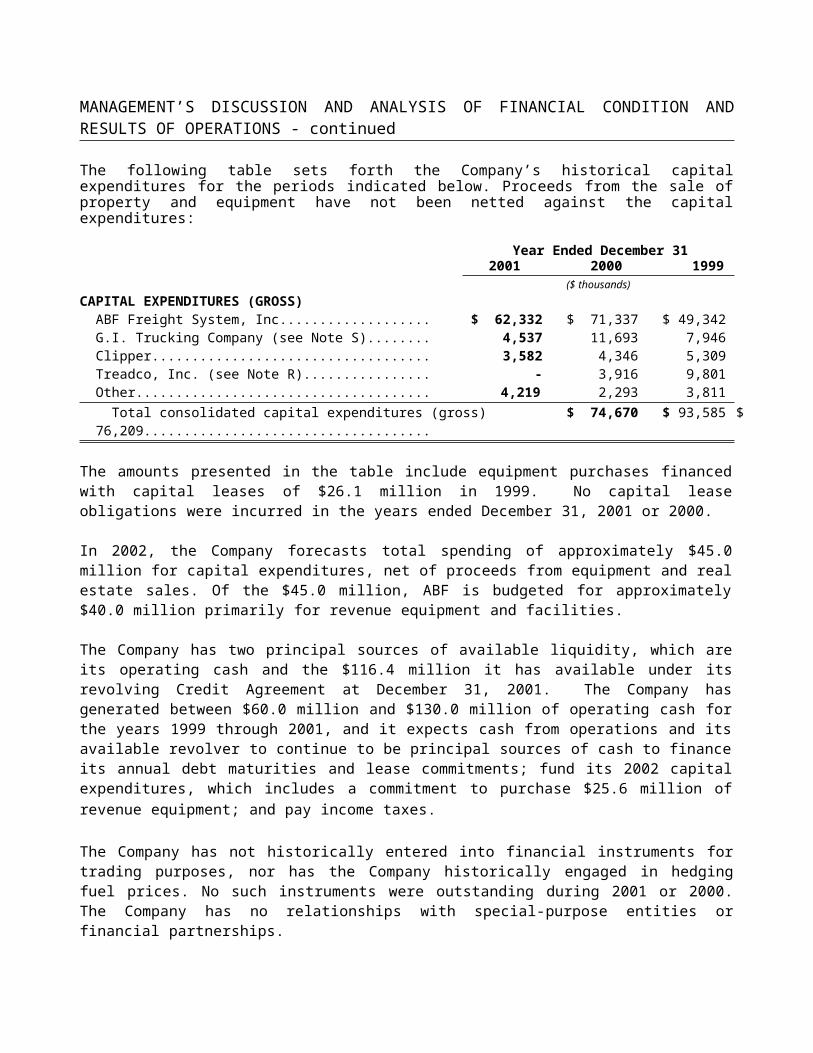
ARKANSAS BEST CORPORATIONCONSOLIDATED STATEMENTS OF CASH FLOWS
Year Ended December 312001 2000 1999
($ thousands)
OPERATING ACTIVITIES Net income................................................................................................... $ 41,404 $ 76,155 $ 50,396
Adjustments to reconcile net income to net cash provided by operating activities: Depreciation and amortization ................................................................. 50,315 52,186 45,242
Amortization of intangibles ..................................................................... 4,053 4,051 4,195Other amortization ................................................................................... 180 217 324Provision for losses on accounts receivable .............................................. 2,966 3,797 2,967Provision for deferred income taxes ......................................................... (52) 10,117 3,128Gain on sales of assets and other .............................................................. (2,322) (3,250) (1,786)Gain on sale of G.I. Trucking Company .................................................. (4,642) – –Fair value net gain - Wingfoot ................................................................. – (5,011) –Minority interest in Treadco, Inc. ............................................................ – – (245)Changes in operating assets and liabilities, net of acquisitions and exchange:
Receivables ......................................................................................... 35,236 (12,568) (24,284)Prepaid expenses ................................................................................. (136) (929) 5,406Other assets ......................................................................................... (10,892) (8,023) (2,912)Accounts payable, bank drafts payable, taxes payable,
accrued expenses and other liabilities ................................................ (51,263) 10,996 31,969NET CASH PROVIDED BY OPERATING ACTIVITIES ........................... 64,847 127,738 114,400
INVESTING ACTIVITIESPurchases of property, plant and equipment, less capitalized leases .............. (74,670) (93,585) (50,085)Capitalization of internally developed software ............................................ (4,672) (3,660) (2,505)Proceeds from asset sales.............................................................................. 10,132 9,784 14,956Proceeds from the sale of G.I. Trucking Company ....................................... 40,455 – –Purchase of Treadco, Inc. stock .................................................................... – – (23,673)Other............................................................................................................ 1,855 161 (486)
NET CASH USED BY INVESTING ACTIVITIES ....................................... (26,900) (87,300) (61,793)
FINANCING ACTIVITIESDeferred financing costs and expenses ......................................................... – – (137)Borrowings under revolving credit facilities ................................................. 92,800 110,000 428,750Payments under revolving credit facilities .................................................... (92,800) (101,300) (448,300)Payments on long-term debt ......................................................................... (23,234) (16,359) (21,348)Retirement of bonds ..................................................................................... (23,174) (4,781) (4,768)Purchase of preferred stock .......................................................................... (414) (3,924) –Dividends paid on preferred stock ................................................................ (2,487) (4,122) (4,298)Net (decrease) increase in bank overdraft ..................................................... (18,165) 9,441 (3,769)Other, net ..................................................................................................... 7,645 3,030 1,039
NET CASH USED BY FINANCING ACTIVITIES ...................................... (59,829) (8,015) (52,831)
NET (DECREASE) INCREASE IN CASH AND CASH EQUIVALENTS ............................................................................... (21,882) 32,423 (224)
Cash and cash equivalents at beginning of period ......................................... 36,742 4,319 4,543CASH AND CASH EQUIVALENTS AT END OF PERIOD ........................ $ 14,860 $ 36,742 $ 4,319
The accompanying notes are an integral part of the consolidated financial statements.

ARKANSAS BEST CORPORATIONNOTES TO CONSOLIDATED FINANCIAL STATEMENTS - continued
NOTE A - ORGANIZATION AND DESCRIPTION OF BUSINESS
Arkansas Best Corporation (the “Company”) is a diversified holding company engaged through its subsidiaries primarily in motor carrier transportation operations and intermodal transportation operations. Principal subsidiaries are ABF Freight System, Inc. (“ABF”); Clipper Exxpress Company and related companies (“Clipper”); FleetNet America, LLC; and until August 1, 2001, G.I. Trucking Company (“G.I. Trucking”) (see Note S). The Company’s operations included the truck tire retreading and new tire sales operations of Treadco, Inc. (“Treadco”) until October 31, 2000 (see Note R).
Approximately 77% of ABF’s employees are covered under a five-year collective bargaining agreement that began on April 1, 1998 with the International Brotherhood of Teamsters (“IBT”).
During the first half of 1999, the Company acquired 2,457,000 shares of Treadco for $23.7 million via a cash tender offer pursuant to a definitive merger agreement. As a result of the transaction, Treadco became a wholly owned subsidiary of the Company (see Note Q). Prior to Treadco becoming a wholly owned subsidiary, the Company’s Consolidated Financial Statements reflected full consolidation of the accounts of Treadco, with the ownership interests of the other stockholders of Treadco reflected as minority interest because the Company controlled Treadco through stock ownership, board representation and management services, provided under a transition services agreement. On September 13, 2000, Treadco entered into an agreement with The Goodyear Tire & Rubber Company (“Goodyear”) to contribute its business to a new limited liability company called Wingfoot Commercial Tire Systems, LLC (“Wingfoot”) (see Note R). The transaction closed on October 31, 2000.
On August 1, 2001, the Company sold the stock of G.I. Trucking for $40.5 million in cash to a company formed by the senior executives of G.I. Trucking and Estes Express Lines (“Estes”) (see Note S).
The Company utilizes tractors and trailers primarily in its motor carrier transportation operations. Tractors and trailers are commonly referred to as “revenue equipment” in the transportation business.
NOTE B - ACCOUNTING POLICIES
Consolidation: The consolidated financial statements include the accounts of the Company and its subsidiaries. All significant intercompany accounts and transactions are eliminated in consolidation.
Cash and Cash Equivalents: Short-term investments that have a maturity of ninety days or less when purchased are considered cash equivalents.
Concentration of Credit Risk: The Company’s services are provided primarily to customers throughout the United States and Canada. ABF, the Company’s largest subsidiary, which represented more than 84.0% of the Company’s annual revenues for 2001, had no single customer representing more than 3.0% of its revenues during 2001 and no single customer representing more than 1.0% of its accounts receivable balance during 2001. The Company performs ongoing credit evaluations of its customers and generally does not require collateral. The Company provides an allowance for doubtful accounts based upon historical trends and factors surrounding the credit risk of specific customers. Historically, credit losses have been within management’s expectations.
Allowances: The Company maintains allowances for doubtful accounts, revenue adjustments and deferred tax assets. The Company’s allowance for doubtful accounts represents an estimate of potential accounts receivable write-offs associated with recognized revenue based on historical trends and factors surrounding the credit risk of specific customers. The Company's allowance for revenue adjustments represents an estimate of potential

ARKANSAS BEST CORPORATIONNOTES TO CONSOLIDATED FINANCIAL STATEMENTS - continued
revenue adjustments associated with recognized revenue based upon historical trends. The Company's valuation allowance against deferred tax assets is established by evaluating whether the benefits of its deferred tax assets will be realized through the reduction of future taxable income.
Impairment Assessment of Long-Lived Assets: The Company reviews its long-lived assets, including property, plant, equipment, capitalized software and goodwill, that are held and used in its motor carrier operations and intermodal operations businesses for impairment whenever events or changes in circumstances indicate that the carrying amount of the asset may not be recoverable as is required by FAS 121, Accounting for the Impairment of Long-Lived Assets and for Long-Lived Assets to Be Disposed Of (“FAS 121”). If such an event or change in circumstances is present, the Company will estimate the undiscounted future cash flows, less the future cash outflows necessary to obtain those inflows, expected to result from the use of the asset and its eventual disposition. If the sum of the undiscounted future cash flows is less than the carrying amount of the related assets, the Company will recognize an impairment loss or review its depreciation policies as may be appropriate. No such events or circumstances were present, indicating the Company's long-lived assets, including goodwill, would not be recoverable at December 31, 2001. Assets to be disposed of are reclassified as assets held for sale at the lower of their carrying amount or fair value less cost to sell.
Property, Plant and Equipment Including Repairs and Maintenance: Purchases of property, plant and equipment are recorded at cost. For financial reporting purposes, such property is depreciated principally by the straight-line method, using the following lives: structures -- 15 to 20 years; revenue equipment -- 3 to 10 years; other equipment -- 3 to 10 years; and leasehold improvements -- 4 to 20 years. For tax reporting purposes, accelerated depreciation or cost recovery methods are used. Gains and losses on asset sales are reflected in the year of disposal. Unless fair value can be determined, trade-in allowances in excess of the book value of revenue equipment traded are accounted for by adjusting the cost of assets acquired. Tires purchased with revenue equipment are capitalized as a part of the cost of such equipment, with replacement tires being expensed when placed in service. Repair and maintenance costs associated with property, plant and equipment are expensed as incurred if the costs do not extend the useful life of the asset. If such costs do extend the useful life of the asset, the costs are capitalized and depreciated over the appropriate useful life.
Assets Held for Sale: Assets held for sale represent primarily non-operating freight terminals and other properties held by ABF, and the Company’s Other operating segment, which are carried at the lower of their carrying value or fair value, less cost to sell, as prescribed by FAS 121. Write-downs to fair value, less cost to sell, are included in gains or losses on sales of property. Assets held for sale are expected to be disposed of by selling the properties to a third party within the next 12 to 24 months.
Computer Software Developed or Obtained for Internal Use, Including Website Development Costs: The Company adopted Statement of Position (“SOP”) 98-1, Accounting for Costs of Computer Software Developed for or Obtained for Internal Use, January 1, 1999. As a result, the Company capitalizes qualifying computer software costs incurred during the “application development stage.” For financial reporting purposes, capitalized software costs are amortized by the straight-line method over 24 to 60 months. The amount of costs capitalized within any period is dependent on the nature of software development activities and projects in each period. In March 2000, the Emerging Issues Task Force (“EITF”) issued EITF No. 00-2, Accounting for Website Development Costs. EITF 00-2 did not change the Company’s practices, described above, with respect to website development costs.
Goodwill: The excess cost over fair value of net assets acquired (goodwill) is amortized on a straight-line basis over 30 to 40 years. As prescribed by FAS 121 and Accounting Principles Board (“APB”) Opinion 17, Intangible Assets, the carrying value of goodwill is reviewed for impairment whenever changes or circumstances indicate that the carrying amount may not be recoverable, such as a significant adverse change in legal factors or the business climate or an adverse assessment by a regulator or a current period operating or

ARKANSAS BEST CORPORATIONNOTES TO CONSOLIDATED FINANCIAL STATEMENTS - continued
cash flow loss combined with a history of operating or cash flow losses or a projection or forecast that demonstrates continuing losses. If this review indicates that goodwill will not be recoverable, as determined based on the undiscounted cash flows over the remaining amortization period, the Company’s carrying value of the goodwill will be reduced. No changes or circumstances indicated that the Company’s goodwill was impaired, and, therefore, no reduction in goodwill has been recorded as of December 31, 2001 (see Note D).
Income Taxes: Deferred income taxes are accounted for under the liability method. Deferred income taxes relate principally to asset and liability basis differences arising from a 1988 purchase transaction and from a 1995 acquisition, as well as to the timing of the depreciation and cost recovery deductions previously described and to temporary differences in the recognition of certain revenues and expenses of carrier operations.
Revenue Recognition: Motor carrier revenue is recognized based on relative transit time in each reporting period with expenses recognized as incurred. In accordance with the Securities and Exchange Commission’s (“SEC’s”) Staff Accounting Bulletin (“SAB”) 101, in the fourth quarter of 2000, the Company changed Clipper’s revenue recognition method from a method of recognizing revenue when freight was received from the shipper with the accrual of the estimated direct costs to complete the delivery of freight in transit, to a method where Clipper’s revenue is recognized based on relative transit time in each reporting period with expenses recognized as incurred. This method conforms Clipper’s revenue recognition method to the Company’s motor carrier revenue recognition method prescribed by EITF 91-9. The change was a change in accounting principle under Accounting Principles Board (“APB”) Opinion No. 20. The impact of the change was immaterial. Tire operations revenue has been recognized generally at the point when goods or services are provided to the customers (see Note R).
Earnings (Loss) Per Share: The calculation of earnings (loss) per share is based on the weighted-average number of common (basic earnings per share) or common equivalent shares outstanding (diluted earnings per share) during the applicable period. The dilutive effect of Common Stock equivalents is excluded from basic earnings per share and included in the calculation of diluted earnings per share. The calculation of basic earnings per share reduces income available to common stockholders by Preferred Stock dividends paid or accrued during the period (see Note I).
Stock-Based Compensation: Stock-based compensation to employees is accounted for based on the intrinsic value method under Accounting Principles Board Opinion No. 25, Accounting for Stock Issued to Employees (“APB 25”) and related interpretations, including Financial Accounting Standards Board (“FASB”) Interpretation No. 44 (“FIN 44”), Accounting for Certain Transactions involving Stock Compensation.
Accounting for Sales of Stock by Subsidiaries: The Company recognizes gains and losses on sales of subsidiary stock when incurred.
Claims Liabilities: The Company is self-insured up to certain limits for workers’ compensation, certain property damage and liability claims and cargo loss and damage claims. Above these limits, the Company has purchased insurance coverage, which management considers to be adequate. The Company records an estimate of its liability for self-insured workers’ compensation and property damage and liability claims which includes the incurred claim amount plus an estimate of future claim development calculated by applying the Company’s historical claims development factors to its incurred claims amounts. The Company’s liability also includes an estimate of incurred, but not reported, claims. Netted against this liability are amounts the Company expects to recover from insurance carriers. The Company records an estimate of its potential self-insured cargo loss and damage claims by estimating the amount of potential claims based on the Company’s historical trends and certain event-specific information. The Company’s claims liabilities have not been discounted.

ARKANSAS BEST CORPORATIONNOTES TO CONSOLIDATED FINANCIAL STATEMENTS - continued
Insurance-Related Assessments: The Company adopted SOP 97-3, Accounting by Insurance and Other Enterprises for Insurance-Related Assessments, January 1, 1999. At December 31, 2001 and 2000, the Company has recorded estimated liabilities of $0.6 million incurred for state guaranty fund assessments and other insurance-related assessments. Management has estimated the amounts incurred, using the best available information about premiums and guaranty assessments by state. These amounts are expected to be paid within a period not to exceed one year. The liabilities recorded have not been discounted.
Environmental Matters: The Company expenses environmental expenditures related to existing conditions resulting from past or current operations and from which no current or future benefit is discernible. Expenditures which extend the life of the related property or mitigate or prevent future environmental contamination are capitalized. The Company determines its liability on a site-by-site basis with actual testing at some sites, and records a liability at the time when it is probable and can be reasonably estimated. The estimated liability is not discounted or reduced for possible recoveries from insurance carriers or other third parties (see Note K).
Derivative Financial Instruments: In June 1998, the Financial Accounting Standards Board (“FASB”) issued Statement No. 133, Accounting for Derivative Instruments and Hedging Activities. The Statement addresses the accounting for derivative instruments, including certain derivative instruments embedded in other contracts and hedging activities. In June 1999, the FASB issued Statement No. 137, which deferred for one year the implementation date of FASB Statement No. 133. The Company adopted Statement No. 133 on January 1, 2001 (see Note E).
The Company has, from time to time, entered into interest-rate swap agreements (see Notes G and N) and interest-rate cap agreements designated to modify the interest characteristic of outstanding debt or limit exposure to increasing interest rates in accordance with its interest rate risk management policy. The differential to be paid or received as interest rates change is accrued and recognized as an adjustment of interest expense related to the debt (the accrual method of accounting). The related amount payable or receivable from counter-parties is included in other current liabilities or current assets. In connection with the Company’s adoption of Statement No. 133, the Company is required to recognize all derivatives on its balance sheet at fair value. Derivatives that are not hedges will be adjusted to fair value through income. If a derivative is a hedge, depending on the nature of the hedge, changes in the fair value of the derivative will either be offset against the change in fair value of the hedged asset, liability or firm commitment through earnings, or recognized in other comprehensive income until the hedged item is recognized in earnings. Hedge ineffectiveness associated with interest-rate swap agreements will be reported by the Company in interest expense.
Costs of Start-Up Activities: The Company expenses certain costs associated with start-up activities as they are incurred.
Comprehensive Income: The Company reports the classification components of other comprehensive income by their nature in the financial statements and displays the accumulated balance of other comprehensive income separately from retained earnings and additional paid-in capital in the consolidated statement of stockholders’ equity. Comprehensive income refers to revenues, expenses, gains and losses that are included in comprehensive income but excluded from net income. At December 31, 2001, other comprehensive income consists of changes in the fair value of the Company’s interest rate swap, net of taxes (see Note N) and foreign currency translation adjustments, net of taxes.
Segment Information: The Company uses the “management approach” for determining appropriate segment information to disclose. The management approach is based on the way management organizes the segments within the Company for making operating decisions and assessing performance.

ARKANSAS BEST CORPORATIONNOTES TO CONSOLIDATED FINANCIAL STATEMENTS - continued
Investment in Wingfoot: The Company’s investment in Wingfoot represents a 19% interest in Wingfoot Commercial Tire Systems, LLC (see Note R). The transaction, which created Wingfoot, was accounted for at fair value, as prescribed by the Emerging Issues Task Force (“EITF”) Issue 00-5, Determining Whether a Nonmonetary Transaction is an Exchange of Similar Productive Assets. The Company’s investment is accounted for under the equity method, similar to a partnership investment. However, the Company does not share in the profits or losses of Wingfoot during the term of the Company’s “Put” option, based upon the terms of the operating agreement.
Use of Estimates: The preparation of financial statements in conformity with accounting principles generally accepted in the United States requires management to make estimates and assumptions that affect the amounts reported in the financial statements and accompanying notes. Actual results could differ from those estimates.
Reclassifications: Certain reclassifications have been made to the prior year financial statements to conform to the current year’s presentation.
NOTE C - DISCONTINUED OPERATIONS
At December 31, 1998, the Company was engaged in international ocean freight services through its subsidiary, CaroTrans International, Inc. (“Clipper International”), a non-vessel operating common carrier (N.V.O.C.C.). On February 28, 1999, the Company completed a formal plan to exit its international ocean freight N.V.O.C.C. services by disposing of the business and assets of Clipper International. On April 17, 1999, the Company closed the sale of the business and certain assets of Clipper International, including the trade name “CaroTrans International, Inc.” All of the remaining assets have been liquidated. The aggregate of the selling price of these assets and the estimated liquidation value of the retained Clipper International assets was approximately $5.0 million, which was approximately equal to the Company’s net investment in the related assets.
Results of operations of Clipper International have been reported as discontinued operations and the statements of operations for all prior periods have been restated to remove the revenue and expenses of this segment. Results of Clipper International included in discontinued operations are summarized as follows:
Year Ended December 312001 2000 1999
($ thousands)
Clipper International:Revenues .......................................................................... $ - $ - $ 6,777Operating loss ................................................................... $ - $ - $ (1,314)Pre-tax loss ....................................................................... $ - $ - $ (1,258)
NOTE D - RECENT ACCOUNTING PRONOUNCEMENTS
On July 20, 2001, the Financial Accounting Standards Board (“FASB”) issued Statement No. 142, Goodwill and Other Intangible Assets (“Statement No. 142”). Under Statement No. 142, goodwill and indefinite lived intangible assets are no longer amortized but are reviewed annually for impairment. Statement No. 142 was effective for the Company on January 1, 2002, and as of that date, the Company no longer amortizes its goodwill, but reviews it annually for impairment. At December 31, 2001, the Company’s assets include goodwill of $101.3 million of which $63.8 million is from a 1988 leveraged buyout transaction and $37.5 million is from the 1994 acquisition of Clipper. The Company’s annual goodwill amortization expense for 2001 was $4.1 million. Statement No. 142 requires that the Company perform transitional impairment testing on its goodwill during the first six months of 2002 based on January 1, 2002 values. The Company has performed the first phase of impairment testing on its leveraged buyout goodwill, which is based on ABF’s operations and fair value. There is no indication of impairment with respect to this goodwill. The Company has

ARKANSAS BEST CORPORATIONNOTES TO CONSOLIDATED FINANCIAL STATEMENTS - continued
performed both the first and second phases of the transitional impairment testing on its Clipper goodwill and will recognize a non-cash impairment loss of $23.9 million, net of taxes, as a change in accounting principle as provided in Statement No. 142, in the first quarter of 2002. This will eliminate all of the $37.5 million of Clipper goodwill from the Company’s balance sheet. The impairment loss results from the change in the method of determining recoverable goodwill from using undiscounted cash flows, as prescribed by FAS No. 121, Accounting for Impairment of Long-Lived Assets and for Long-Lived Assets to be Disposed of, to the fair value method determined by using quoted market prices or other valuation techniques including the present value of discounted cash flows, as prescribed by Statement No. 142.
On August 15, 2001, the FASB issued Statement No. 143, Accounting for Asset Retirement Obligations. Statement No. 143 addresses financial accounting and reporting for obligations associated with the retirement of tangible long-lived assets and the associated retirement costs. This Statement applies to legal obligations associated with the retirement of long-lived assets that result from the acquisition, construction, development and/or the normal operation of a long-lived asset, except for certain obligations of lessees. The Statement is effective for the Company in 2003. The Company is evaluating the impact, if any, the Statement will have on its financial statements and related disclosures.
On October 3, 2001, the FASB issued Statement No. 144, Accounting for the Impairment or Disposal of Long-Lived Assets. Statement No. 144 supersedes Statement No. 121 and the accounting and reporting provisions of APB Opinion No. 30, Reporting the Results of Operations - Reporting the Effects of Disposal of a Segment of a Business, and Extraordinary, Unusual and Infrequently Occurring Events and Transactions, for the disposal of a segment of a business. The Statement is effective for the Company January 1, 2002. The impact on the Company’s financial statements and related disclosures of the adoption of Statement No. 144 is expected to be immaterial.
NOTE E – DERIVATIVE FINANCIAL INSTRUMENTS
In June 1998, the FASB issued Statement No. 133, Accounting for Derivative Instruments and Hedging Activities. The Statement addresses the accounting for derivative instruments, including certain derivative instruments embedded in other contracts and hedging activities. In June 1999, the FASB issued Statement No. 137, which deferred for one year the implementation date of FASB Statement No. 133. The Company adopted Statement No. 133 on January 1, 2001. The adoption did not materially affect the Company’s financial statements.
The Company has, from time to time, entered into interest-rate swap agreements (see Notes G and N) and interest-rate cap agreements designated to modify the interest characteristic of outstanding debt or limit exposure to increasing interest rates in accordance with its interest rate risk management policy. The differential to be paid or received as interest rates change is accrued and recognized as an adjustment of interest expense related to the debt (the accrual method of accounting). The related amount payable or receivable from counter-parties is included in other current liabilities or current assets. In connection with the Company’s adoption of Statement No. 133, the Company is required to recognize all derivatives on its balance sheet at fair value. Derivatives that are not hedges will be adjusted to fair value through income. If a derivative is a hedge, depending on the nature of the hedge, changes in the fair value of the derivative will either be offset against the change in fair value of the hedged asset, liability or firm commitment through earnings, or recognized in other comprehensive income until the hedged item is recognized in earnings. Hedge ineffectiveness associated with interest-rate swap agreements will be reported by the Company in interest expense.
The Company entered into an interest-rate swap agreement on February 23, 1998 with an effective date of April 1, 1998 and a termination date of April 1, 2005 on a notional amount of $110.0 million. The Company’s interest rate strategy is to hedge its variable 30-day LIBOR-based interest rate for a fixed interest rate of

ARKANSAS BEST CORPORATIONNOTES TO CONSOLIDATED FINANCIAL STATEMENTS - continued
5.845% (plus the current Credit Agreement margin of 0.575%) on $110.0 million of Credit Agreement borrowings for the term of the interest rate swap to protect the Company from potential interest rate increases. The Company has designated its benchmark variable 30-day LIBOR-based interest rate on $110.0 million of borrowings under the Company’s Credit Agreement as a hedged item under a cash flow hedge. If the Company had terminated the interest rate swap on December 31, 2001, it would have had to pay an estimated $5.4 million. The Company recognized this liability on its balance sheet in accordance with Statement No. 133, at December 31, 2001, through other comprehensive income, net of income tax benefits.
The Company reported no gain or loss during the year ended December 31, 2001 as a result of hedge ineffectiveness, other derivative instruments’ gain or loss or the discontinuance of a cash flow hedge. Future changes in the swap arrangement (including termination of the swap agreement), swap notional amount, hedged portion or forecasted Credit Agreement borrowings below $110.0 million may result in a reclassification of any gain or loss reported in other comprehensive income, into earnings.
NOTE F- FEDERAL AND STATE INCOME TAXES
Deferred income taxes reflect the net tax effects of temporary differences between the carrying amounts of assets and liabilities for financial reporting purposes and the amounts used for income tax purposes. Significant components of the Company’s deferred tax liabilities and assets are as follows:
December 312001 2000
($ thousands)
Deferred tax liabilities:Amortization, depreciation and basis differences for property, plant and equipment and other long-lived assets......................... $ 39,434 $ 40,807Revenue recognition.......................................................................................... 4,453 5,960Prepaid expenses............................................................................................... 4,489 4,454Other ................................................................................................................ 6,146 7,625 Total deferred tax liabilities............................................................................. 54,522 58,846
Deferred tax assets:Accrued expenses.............................................................................................. 35,952 24,087Fair value of interest rate swap ......................................................................... 2,093 -Postretirement benefits other than pensions....................................................... 1,439 1,223State net operating loss carryovers..................................................................... 2,175 2,579Basis difference in investment in Wingfoot....................................................... 1,112 1,112Other................................................................................................................. 5,600 3,983 Total deferred tax assets.................................................................................. 48,371 32,984 Valuation allowance for deferred tax assets..................................................... (3,392) (2,215) Net deferred tax assets.................................................................................... 44,979 30,769
Net deferred tax liabilities...................................................................................... $ 9,543 $ 28,077

ARKANSAS BEST CORPORATIONNOTES TO CONSOLIDATED FINANCIAL STATEMENTS - continued
Significant components of the provision for income taxes are as follows:
Year Ended December 312001 2000 1999
($ thousands)
Current:Federal................................................................................... $ 23,297 $ 37,439 $ 28,797State....................................................................................... 2,070 5,412 4,530
Total current ..................................................................... 25,367 42,851 33,327
Deferred:Federal................................................................................... (2,274) 7,302 2,023State....................................................................................... 2,222 2,815 1,105
Total deferred ................................................................... (52) 10,117 3,128Total income tax expense ........................................................... $ 25,315 $ 52,968 $ 36,455
A reconciliation between the effective income tax rate, as computed on income from continuing operations, and the statutory federal income tax rate is presented in the following table:
Year Ended December 312001 2000 1999
($ thousands)
Income tax at the statutory federal rate of 35%...................................................... $ 23,352 $ 45,193 $ 30,673Federal income tax effects of:
State income taxes ................................................................. (1,502) (2,879) (1,972)Nondeductible goodwill ........................................................ 841 841 963Other nondeductible expenses................................................ 623 1,704 1,364Minority interest .................................................................... - - (85)
Resolution of tax contingencies.............................................. (1,943) - -Other...................................................................................... (348) (118) (123)
Federal income taxes.................................................................. 21,023 44,741 30,820State income taxes...................................................................... 4,292 8,227 5,635Total income tax expense............................................................ $ 25,315 $ 52,968 $ 36,455
Effective tax rate......................................................................... 37.9% 41.0% 41.6%
Income taxes of $39.9 million were paid in 2001, $48.7 million were paid in 2000 and $29.9 million were paid in 1999. Income tax refunds amounted to $7.6 million in 2001, $2.9 million in 2000 and $1.4 million in 1999.
As of December 31, 2001, the Company had state net operating loss carryovers of approximately $41.4 million. State net operating loss carryovers expire generally in five to fifteen years.
For financial reporting purposes, the Company had a valuation allowance of approximately $2.3 million for certain state net operating loss carryovers and federal tax credits for which realization is uncertain. In addition, the Company had a valuation allowance of approximately $1.1 million related to the excess tax basis in its investment in Wingfoot (see Note R). During 2001, the net change in the valuation allowance was a $1.2 million increase, all of which related to changes in the valuation allowance for state net operating loss carryovers and federal tax credits.
During 2001, certain issues relating to the utilization of net operating losses and credits arising in prior years were resolved, resulting in a non-recurring tax benefit of approximately $1.9 million.

ARKANSAS BEST CORPORATIONNOTES TO CONSOLIDATED FINANCIAL STATEMENTS - continued
In March 1999, the Tenth Circuit Court of Appeals ruled against an appealing taxpayer regarding the timing of the deductibility of contributions to multiemployer pension plans. The Internal Revenue Service (“IRS”) has raised the same issue with respect to the Company. There are certain factual differences between those present in the Tenth Circuit case and those relating specifically to the Company. The Company has been involved in the administrative appeals process with the IRS regarding those factual differences. Based on the most recent information available, it is likely that the Company will receive an unfavorable decision from the IRS on the issues involved. During 2001, the Company paid approximately $33.0 million, which represents a substantial portion of the tax and interest that would be due if all the issues involved were decided adversely to the Company and which was accounted for in prior years as a part of the Company’s net deferred tax liability and accrued expenses. The Company continues to contest the issues and will pursue judicial remedies if appropriate. Because of the complex issues and the fact that multiple tax years and IRS examinations of the Company and an acquired company are involved, management believes the final resolution of this matter will occur over an extended future period. In the opinion of management, any additional liability that may arise has been accrued for and will not have a material adverse effect on the Company’s results of operations, financial position and cash flows in any future period.
NOTE G - LONG-TERM DEBT AND CREDIT AGREEMENTSDecember 31
2001 2000($ thousands)
Revolving credit agreement (1) .................................................................................. $ 110,000 $ 110,000Subordinated debentures (2)....................................................................................... 4,811 28,685Capitalized lease obligations (3) ................................................................................ 14,896 38,109Other ......................................................................................................................... 130 151
129,837 176,945Less current portion ................................................................................................... 14,834 23,948
$ 115,003 $ 152,997
(1) On June 12, 1998, the Company entered into a senior five-year Revolving Credit Agreement (“Credit Agreement”) in the amount of $250.0 million, which includes a $75.0 million sublimit for the issuance of letters of credit. The parties to the Credit Agreement are the Company, Wells Fargo Bank (Texas), N.A. as Administrative Agent, and Bank of America National Trust and Savings Association and Wells Fargo Bank (Texas), N.A. as Co-Documentation Agents, as well as six other participating banks. The Credit Agreement contains covenants limiting, among other things, indebtedness, distributions and dispositions of assets, and requires the Company to meet certain quarterly financial ratio tests. As of December 31, 2001, the Company was in compliance with all covenants. Interest rates under the agreement are at variable rates as defined by the Credit Agreement. At December 31, 2001, the effective average interest rate, after considering the Company’s fixed interest rate swap (see Note N), on Credit Agreement borrowings was 6.4%.
At December 31, 2001, there were $110.0 million of Revolver Advances and approximately $23.6 million in outstanding letters of credit. At December 31, 2000, there were $110.0 million of Revolver Advances and approximately $22.8 million of outstanding letters of credit. Outstanding revolving credit advances may not exceed a borrowing base calculated using the Company’s equipment, real estate and eligible receivables. The borrowing base was $325.1 million at December 31, 2001, which would allow borrowings up to the $250.0 million limit specified by the Credit Agreement. The amount available for borrowing under the Credit Agreement at December 31, 2001 was $116.4 million. The Company pays a commitment fee for unborrowed funds. This commitment fee was 0.25% at December 31, 2001.

ARKANSAS BEST CORPORATIONNOTES TO CONSOLIDATED FINANCIAL STATEMENTS - continued
(2) The Subordinated Debentures were issued in April 1986 by an acquired company. The debentures bear interest at 6.25% per annum, payable semi-annually, on a par value of $5.0 million at December 31, 2001. The debentures are payable April 15, 2011. The Company may redeem all outstanding debentures at 100% of par at any time and is required to redeem, through a mandatory sinking fund in each year through 2010, $2.5 million of the aggregate principal amount of the debentures issued. The Company has met its sinking fund obligations through 2010 by making market purchases and deposits of debentures with the Bond Trustee. Bonds with a par value of $24.9 million were purchased in 2001 for approximately $23.2 million. Bonds with a par value of $5.0 million were purchased for approximately $4.5 million in 2000. Bonds with a par value of $5.0 million were purchased in 1999 for approximately $4.3 million. The bond retirements resulted in gains of $0.8 million in 2001, $0.4 million in 2000 and $0.5 million in 1999 (included in other income).
(3) Capitalized lease obligations include approximately $14.7 million relative to leases of carrier revenue equipment with an aggregate net book value of approximately $14.4 million at December 31, 2001. These leases have a weighted-average interest rate of approximately 7.1%. Also included is approximately $0.2 million relative to leases of computer equipment with a weighted-average interest rate of approximately 4.0%. The net book value of the related assets was approximately $0.2 million at December 31, 2001.
Annual maturities on long-term debt, excluding capitalized lease obligations, in 2002 through 2006 aggregate approximately $24,000; $110.0 million; $28,000; $31,000; and $20,000, respectively.
Interest paid, including interest capitalized and payments of IRS interest (see Note F), was $32.3 million in 2001, $13.8 million in 2000, and $16.5 million in 1999. Interest capitalized totaled $0.3 million in 2001, $0.2 million in 2000, and $0.2 million in 1999.
In February 1998, the Company entered into an interest rate swap effective April 1, 1998, on a notional amount of $110.0 million. The purpose of the swap was to limit the Company’s exposure to increases in interest rates on $110.0 million of bank borrowings over the seven-year term of the swap. The fixed interest rate under the swap is 5.845% plus the Credit Agreement margin (0.575% currently and 0.55% at December 31, 2001) (see Note N).
The Company has guaranteed $0.5 million of payments related to a former subsidiary. The Company’s exposure to the guarantee should be reduced by $60,000 per year.
NOTE H - ACCRUED EXPENSESDecember 31
2001 2000($ thousands)
Accrued salaries, wages and incentive plans ............................................................ $ 19,719 $ 39,142Accrued vacation pay .............................................................................................. 31,933 33,293Accrued interest ...................................................................................................... 1,584 11,351Taxes other than income .......................................................................................... 7,006 6,943Loss, injury, damage and workers’ compensation claims reserves ........................... 56,804 70,194Other ....................................................................................................................... 4,377 7,702
$ 121,423 $ 168,625
NOTE I - STOCKHOLDERS’ EQUITY
Preferred Stock. In February 1993, the Company completed a public offering of 1,495,000 shares of Preferred Stock at $50 per share. The Preferred Stock was convertible at the option of the holder into Common Stock at

ARKANSAS BEST CORPORATIONNOTES TO CONSOLIDATED FINANCIAL STATEMENTS - continued
the rate of 2.5397 shares of Common Stock for each share of Preferred Stock. Annual dividends were $2.875 and were cumulative. The Preferred Stock was exchangeable, in whole or in part, at the option of the Company on any dividend payment date beginning February 15, 1995, for the Company’s 5¾% Convertible Subordinated Debentures due February 15, 2018, at a rate of $50 principal amount of debentures for each share of Preferred Stock. The Preferred Stock was redeemable at any time, in whole or in part, at the Company’s option, initially at a redemption price of $52.0125 per share and thereafter at redemption prices declining to $50 per share on or after February 15, 2003, plus unpaid dividends to the redemption date. Holders of Preferred Stock had no voting rights unless dividends were in arrears six quarters or more, at which time they had the right to elect two directors of the Company until all dividends had been paid. Dividends of $2.5 million, $4.1 million and $4.3 million were paid during 2001, 2000 and 1999, respectively.
On July 10, 2000, the Company purchased 105,000 shares of its Preferred Stock at $37.375 per share, for a total cost of $3.9 million. All of the shares purchased were retired. On August 13, 2001, the Company announced the call for redemption of its $2.875 Series A Cumulative Convertible Exchangeable Preferred Stock (“ABFSP”). As of August 10, 2001, 1,390,000 shares of Preferred Stock were outstanding. At the end of the extended redemption period on September 14, 2001, 1,382,650 shares of the Preferred Stock were converted to 3,511,439 shares of Common Stock. A total of 7,350 shares of Preferred Stock were redeemed at the redemption price of $50.58 per share. The Company paid $0.4 million to the holders of these shares in redemption of their Preferred Stock. Treasury Stock. At December 31, 2001 and 2000, the Company had 59,782 shares of treasury stock with a cost basis of $1.0 million. The shares were purchased at various times throughout the year as employees tendered shares they had held for six months or more as payments for the exercise price of stock options, as allowed by the Company’s stock option plans.
Stock Options. The Company has elected to follow APB 25 and related interpretations in accounting for its employee stock options because, as discussed below, the alternative fair value accounting provided for under FASB Statement No. 123, Accounting for Stock-Based Compensation (“Statement No. 123”), requires use of option valuation models that were not developed for use in valuing employee stock options. Under APB 25, because the exercise price of the Company’s employee and director stock options equals the market price of the underlying stock on the date of grant, no compensation expense is recognized.
At December 31, 2001, the Company had two stock option plans, which provided 3,900,000 shares of Common Stock for the granting of options to directors and key employees of the Company. One of the stock option plans, the 1992 Arkansas Best Corporation Stock Option Plan, expired on December 31, 2001. All options granted are exercisable starting 12 months after the grant date, with 20% of the shares covered, thereby becoming exercisable at that time and with an additional 20% of the option shares becoming exercisable on each successive anniversary date, with full vesting occurring on the fifth anniversary date. The options were granted for a term of 10 years.
Pro forma information regarding net income and earnings per share is required by Statement No. 123, and has been determined as if the Company had accounted for its employee stock options under the fair value method of that Statement. The fair value for these options was estimated at the date of grant, using a Black-Scholes option pricing model with the following weighted-average assumptions for 2001, 2000 and 1999, respectively: risk-free interest rates of 5.4%, 5.2% and 6.7%; dividend yields of .01%, .01% and .01%; volatility factors of the expected market price of the Company’s Common Stock of .57, .46 and .45; and a weighted-average expected life of the option of 9.5 years.
The Black-Scholes option valuation model was developed for use in estimating the fair value of traded options that have no vesting restrictions and are fully transferable. In addition, option valuation models require the input of highly subjective assumptions including the expected stock price volatility. Because the Company’s

ARKANSAS BEST CORPORATIONNOTES TO CONSOLIDATED FINANCIAL STATEMENTS - continued
employee stock options have characteristics significantly different from those of traded options, and because changes in the subjective input assumptions can materially affect the fair value estimate, in management’s opinion, the existing models do not necessarily provide a reliable single measure of the fair value of employee stock options.
For purposes of pro forma disclosures, the estimated fair value of the options is amortized to expense over the options’ vesting period. The Company’s pro forma information follows (in thousands except for earnings-per-share information):
December 312001 2000 1999
Net income - as reported ............................................................ $ 41,404 $ 76,155 $ 50,396
Net income - pro forma .............................................................. $ 39,573 $ 75,330 $ 49,696
Net income per share - as reported (basic) .................................. $ 1.79 $ 3.62 $ 2.34
Net income per share - as reported (diluted) ............................... $ 1.66 $ 3.17 $ 2.11
Net income per share - pro forma (basic) ................................... $ 1.70 $ 3.58 $ 2.31
Net income per share - pro forma (diluted) ................................. $ 1.59 $ 3.13 $ 2.08
A summary of the Company’s stock option activity and related information for the years ended December 31 follows:
2001 2000 1999Weighted- Weighted- Weighted-Average Average Average
Options Exercise Price Options Exercise Price Options Exercise Price
Outstanding - beginning of year ...... 2,235,731 $ 9.84 2,054,700 $ 8.28 1,839,500 $ 8.11Granted ............................................ 819,201 25.71 691,398 13.62 429,000 8.85Exercised ........................................ (826,718) 9.66 (466,804) 8.91 (142,120) 7.26Forfeited .......................................... (27,000) 17.48 (43,563) 6.50 (71,680) 7.77Outstanding - end of year................. 2,201,214 $ 15.78 2,235,731 $ 9.84 2,054,700 $ 8.28
Exercisable - end of year.................. 690,856 $ 8.55 1,052,554 $ 8.34 1,154,680 $ 8.87
Estimated weighted-average fair value per share of options granted to employees during the year......... $ 10.31 $ 8.67 $ 5.82

ARKANSAS BEST CORPORATIONNOTES TO CONSOLIDATED FINANCIAL STATEMENTS - continued
The following table summarizes information concerning currently outstanding and exercisable options:
Weighted-Average Weighted- Weighted-
Remaining Average AverageRange of Number Contractual Exercise Number Exercise
Exercise Prices Outstanding Life Price Exercisable Price
$4 - $6 171,629 5.2 $ 5.07 124,029 $ 5.07$6 - $8 433,400 5.6 7.06 293,900 6.80$8 - $10 57,000 3.6 8.72 49,800 8.77
$10 - $12 57,256 3.7 10.66 42,256 10.70$12 - $14 668,061 7.7 13.45 176,071 13.16$14 - $16 24,000 8.3 14.99 4,800 14.99$24 - $26 485,832 9.0 24.38 - -$26 - $28 20,000 9.0 26.81 - -$28 - $30 284,036 10.0 28.05 - -
2,201,214 690,856
Stockholders’ Rights Plan. Each issued and outstanding share of Common Stock has associated with it one Common Stock right to purchase a share of Common Stock from the Company at an exercise price of $80.00 per right. The rights are not currently exercisable, but could become exercisable if certain events occur, including the acquisition of 15% or more of the outstanding Common Stock of the Company. Under certain conditions, the rights will entitle holders, other than an acquirer in a non-permitted transaction, to purchase shares of Common Stock with a market value of two times the exercise price of the right. The rights will expire in 2011 unless extended.
NOTE J - LEASES AND COMMITMENTS
Rental expense amounted to approximately $13.8 million in 2001, $17.3 million in 2000 and $20.5 million in 1999.
The future minimum rental commitments, net of future minimum rentals to be received under noncancellable subleases, as of December 31, 2001 for all noncancellable operating leases are as follows:
Equipmentand
Period Total Terminals Other($ thousands)
2002.............................................................................. $ 11,214 $ 10,001 $ 1,2132003.............................................................................. 8,688 8,421 2672004.............................................................................. 6,545 6,504 412005.............................................................................. 5,384 5,343 412006.............................................................................. 4,627 4,612 15Thereafter...................................................................... 9,666 9,666 -
$ 46,124 $ 44,547 $ 1,577
Certain of the leases are renewable for substantially the same rentals for varying periods. Future minimum rentals to be received under noncancellable subleases totaled approximately $2.6 million at December 31, 2001.

ARKANSAS BEST CORPORATIONNOTES TO CONSOLIDATED FINANCIAL STATEMENTS - continued
The future minimum payments under capitalized leases at December 31, 2001 consisted of the following ($ thousands):
2002.................................................................................................................. $ 15,2902003.................................................................................................................. 812004.................................................................................................................. 6Total minimum lease payments ........................................................................ 15,377Amounts representing interest ........................................................................... 481Present value of net minimum leases included in long-term debt (see Note G).......................................................... $ 14,896
Assets held under capitalized leases are included in property, plant and equipment as follows:
December 312001 2000
($ thousands)
Revenue equipment ............................................................................................ $ 34,587 $ 76,978Other equipment ................................................................................................. 583 742
35,170 77,720Less accumulated amortization ........................................................................... 20,573 39,278
$ 14,597 $ 38,442
The revenue equipment leases have remaining terms of one year and contain renewal or fixed price purchase options. The lease agreements require the lessee to pay property taxes, maintenance and operating expenses. Lease amortization is included in depreciation expense.
Capital lease obligations of $26.1 million were incurred for the year ended December 31, 1999. No capital lease obligations were incurred in the years ended December 31, 2001 and 2000.
Commitments to purchase revenue equipment, which are cancellable by the Company if certain conditions are met, aggregated approximately $25.6 million at December 31, 2001.
NOTE K - LEGAL PROCEEDINGS AND ENVIRONMENTAL MATTERS AND OTHER EVENTS
Various legal actions, the majority of which arise in the normal course of business, are pending. None of these legal actions are expected to have a material adverse effect on the Company’s financial condition, cash flows or results of operations. The Company maintains liability insurance against certain risks arising out of the normal course of its business, subject to certain self-insured retention limits.
The Company’s subsidiaries, or lessees, store fuel for use in tractors and trucks in approximately 76 underground tanks located in 25 states. Maintenance of such tanks is regulated at the federal and, in some cases, state levels. The Company believes that it is in substantial compliance with all such regulations. The Company is not aware of any leaks from such tanks that could reasonably be expected to have a material adverse effect on the Company.
The Company has received notices from the EPA and others that it has been identified as a potentially responsible party (“PRP”) under the Comprehensive Environmental Response Compensation and Liability Act or other federal or state environmental statutes at several hazardous waste sites. After investigating the Company’s or its subsidiaries’ involvement in waste disposal or waste generation at such sites, the Company has either agreed to de minimis settlements (aggregating approximately $340,000 over the last 12 years), or

ARKANSAS BEST CORPORATIONNOTES TO CONSOLIDATED FINANCIAL STATEMENTS - continued
believes its obligations with respect to such sites would involve immaterial monetary liability, although there can be no assurances in this regard.
As of December 31, 2001, the Company has accrued approximately $2.4 million to provide for environmental-related liabilities. The Company’s environmental accrual is based on management’s best estimate of the actual liability. The Company’s estimate is founded on management’s experience in dealing with similar environmental matters and on actual testing performed at some sites. Management believes that the accrual is adequate to cover environmental liabilities based on the present environmental regulations. Accruals for environmental liability are included in the balance sheet as accrued expenses.
NOTE L - PENSION AND OTHER POSTRETIREMENT BENEFIT PLANS
The Company and its subsidiaries have noncontributory defined benefit pension plans covering substantially all noncontractual employees. Benefits are generally based on years of service and employee compensation. Contributions are made based upon at least the minimum amounts required to be funded under provisions of the Employee Retirement Income Security Act of 1974, with the maximum amounts not to exceed the maximum amount deductible under the Internal Revenue Code. The plans’ assets are held in trust funds and are primarily invested in equity and fixed income securities. Additionally, the Company participates in several multiemployer plans that provide defined benefits to the Company’s union employees. In the event of insolvency or reorganization, plan terminations or withdrawal by the Company from the multiemployer plans, the Company may be liable for a portion of the multiemployer plans’ unfunded vested benefits, the amount of which, if any, has not been determined, but which would be material.
During 1999, the Company’s and certain subsidiaries’ defined benefit pension plans were amended to reduce early retirement incentives and to change the benefit formula from an annuity formula to a lump-sum formula.
The Company also sponsors other postretirement benefit plans that provide supplemental medical benefits, life insurance, accident and vision care to certain full-time officers of the Company and certain subsidiaries. The plans are noncontributory, with the Company generally paying 80% of covered charges incurred by plan participants.

ARKANSAS BEST CORPORATIONNOTES TO CONSOLIDATED FINANCIAL STATEMENTS - continued
The following is a summary of the changes in benefit obligations and plan assets for the defined benefit plans and other postretirement benefit plans:
Year Ended December 31Postretirement
Pension Benefits Health Benefits2001 2000 2001 2000
($ thousands)
Change in benefit obligationBenefit obligation at beginning of year........................ $ 158,349 $ 158,401 $ 6,703 $ 5,188Service cost................................................................. 7,448 7,729 86 56Interest cost................................................................. 11,217 11,998 622 489Sale of G.I. Trucking Company (see Note S) .............. (46,214) - - -Actuarial loss and other .............................................. 14,013 3,453 2,228 1,532Benefits and expenses paid.......................................... (13,462) (23,232) (623) (562)Benefit obligation at end of year................................. 131,351 158,349 9,016 6,703
Change in plan assetsFair value of plan assets at beginning of year ............. 192,287 213,986 - -Actual return on plan assets and other......................... (1,476) 427 - -Employer contribution................................................ 225 1,106 623 562Sale of G.I. Trucking Company (see Note S) .............. (45,158) - - -Benefits and expenses paid ......................................... (13,462) (23,232) (623) (562)Fair value of plan assets at end of year........................ 132,416 192,287 - -
Funded status.............................................................. 1,065 33,938 (9,016) (6,703)Unrecognized net actuarial (gain) loss......................... 28,050 (1,425) 3,396 1,377Unrecognized prior service cost (credit)...................... (7,009) (7,892) 432 563Sale of G.I. Trucking Company (see Note S) .............. (3,956) - - -Unrecognized net transition obligation (asset) and other (34) (43) 1,473 1,623Prepaid (accrued) benefit cost..................................... $ 18,116 $ 24,578 $ (3,715) $ (3,140)
At December 31, 2001, the net pension asset is reflected in the accompanying financial statements as a noncurrent asset of $18.4 million, included in other assets, and a current liability of $0.3 million, included in accrued expenses. At December 31, 2000, the net pension asset is reflected in the accompanying financial statements as a noncurrent asset of $24.8 million, included in other assets, and a current liability of $0.2 million, included in accrued expenses.
At December 31, 2001, the Arkansas Best Corporation Retirement Plan had pension benefit obligations of $23.5 million and plan assets with a fair value of $23.0 million.
At December 31, 2000, the Treadco pension plan had pension benefit obligations of $5.5 million and plan assets with a fair value of $4.8 million.
At December 31, 2001, the pension plans’ assets included 433,374 shares of the Company’s Common Stock, which had a fair market value of $12.5 million. There were no dividends paid on the Company’s Common Stock during 2001 or 2000.

ARKANSAS BEST CORPORATIONNOTES TO CONSOLIDATED FINANCIAL STATEMENTS - continued
Assumptions used in determining net periodic benefit cost for the defined benefit plans and other postretirement benefit plans were:
Year Ended December 31Pension Benefits Postretirement Health Benefits
2001 2000 1999 2001 2000 1999
Weighted-average assumptions Discount rate.......................................... 7.55% 7.65% 7.90% 7.55% 7.65% 7.90%Expected return on plan assets................ 9.0% - 10.0% 9.0% - 10.0% 9.0% - 10.0% - - -Rate of compensation increase............... 3.0% - 4.0% 3.0% - 4.0% 3.0% - 4.0% - - -
The weighted-average annual assumed rate of increase in the per capita cost of covered benefits (in health care cost trend) ranges from 5.0% to 6.0% for 2001 and is assumed to decrease gradually to 4.5% in 2007.
A summary of the components of net periodic benefit cost for the defined benefit plans and other postretirement plans follows:
Year Ended December 31Pension Benefits Postretirement Health Benefits
2001 2000 1999 2001 2000 1999($ thousands)
Components of net periodic benefit costService cost..................................................... $ 7,448 $ 7,729 $ 6,025 $ 86 $ 56 $ 64Interest cost..................................................... 11,217 11,998 11,508 622 489 389Expected return on plan assets......................... (15,232) (19,217) (17,591) - - -Transition (asset) obligation recognition.......... (8) (6) (4) 135 135 135Special termination benefit ............................. 100 - - - - -Amortization of prior service cost (credit)....... (884) (895) (895) 131 131 131Recognized net actuarial loss (gain) and other. 1,150 (2,079) 361 209 (23) (2)Net periodic benefit cost.................................. 3,791 (2,470) (596) 1,183 788 717Multiemployer plans........................................ 74,131 75,821 68,211 - - -
......................................................... $ 77,922 $ 73,351 $ 67,615 $ 1,183 $ 788 $ 717
The health care cost trend rates have a significant effect on the amounts reported for the health care plans. A one-percentage-point change in assumed health care cost trend rates would have the following effects for the year ended December 31, 2001:
1% 1%Increase Decrease
($ thousands)
Effect on total of service and interest cost components............................................. 98 (81)Effect on postretirement benefit obligation............................................................... 1,145 (959)
The Company has deferred compensation agreements with certain executives for which liabilities aggregating $4.0 million and $3.5 million as of December 31, 2001 and 2000, respectively, have been recorded. The deferred compensation agreements include a provision that immediately vests all benefits and, at the executive’s election, provides for a lump-sum payment upon a change-in-control of the Company.
The Company also has a supplemental benefit plan for the purpose of supplementing benefits under the Company’s defined benefit plans. The plan will pay sums in addition to amounts payable under the retirement plans to eligible participants. Participation in the plan is limited to employees of the Company who are participants in the Company’s retirement plans and who are designated as participants in the plan by the Company’s Board of Directors. As of December 31, 2001 and 2000, the Company has liabilities of $10.2 million and $5.7 million, respectively, for future costs under this plan reflected in the accompanying consolidated financial statements in other liabilities. The supplemental benefit plan includes a provision that

ARKANSAS BEST CORPORATIONNOTES TO CONSOLIDATED FINANCIAL STATEMENTS - continued
benefits accrued under the plan will be paid in the form of a lump sum following a change-in-control of the Company.
An additional benefit plan provides certain death and retirement benefits for certain officers and directors of an acquired company and its former subsidiaries. The Company has liabilities of $2.3 million and $2.7 million at December 31, 2001 and 2000, respectively, for future costs under this plan reflected as other liabilities in the accompanying consolidated financial statements. The Company has insurance policies on the participants, which are included in other assets, in amounts that are sufficient to fund the benefits under the plan.
The Company has various defined contribution plans that cover substantially all of its employees. The plans permit participants to defer a portion of their salary up to a maximum of 15% as provided in Section 401(k) of the Internal Revenue Code. The Company matches a portion of participant contributions up to a specified compensation limit ranging from 0% to 6% in 2001. The plans also allow for discretionary Company contributions determined annually. The Company’s expense for the defined contribution plans totaled $5.0 million for 2001, $4.0 million for 2000 and $2.7 million for 1999.
In addition, the Company’s union employees and union retirees are provided health care and other benefits through defined benefit multiemployer plans administered and funded based on the applicable labor agreement. The Company’s obligation is determined based on the applicable labor agreement and does not extend directly to employees or retirees. The cost of such benefits cannot be readily separated between retirees and active employees. The aggregate contribution to the multiemployer health and welfare benefit plans totaled approximately $78.8 million, $73.6 million and $69.8 million for the years ended December 31, 2001, 2000 and 1999, respectively.
The Company has a performance award program available to the officers of ABC. Units awarded will be initially valued at the closing price per share of the Company’s Common Stock on the date awarded. The vesting provisions and the return-on-equity target will be set upon award. No awards have been granted under this program.
The Company maintains a Voluntary Savings Plan (“VSP”). The VSP is a nonqualified deferred compensation plan for certain executives of the Company. Eligible employees are allowed to defer receipt of a portion of their regular compensation, incentive compensation or supplemental retirement payments and other bonuses by making an election before the compensation is payable. In addition, the Company credits participants’ accounts with matching contributions and rates of return based on investment indexes selected by the participants. Salary deferrals, Company match and investment earnings are considered part of the general assets of the Company until paid. As of December 31, 2001, the Company has recorded liabilities of $16.5 million in other liabilities and assets of $16.5 million in other assets associated with the plan. As of December 31, 2000, the Company had recorded liabilities of $12.2 million in other liabilities and assets of $12.2 million in other assets.

ARKANSAS BEST CORPORATIONNOTES TO CONSOLIDATED FINANCIAL STATEMENTS - continued
NOTE M - OPERATING SEGMENT DATA
The Company used the “management approach” to determine its reportable operating segments as well as to determine the basis of reporting the operating segment information. The management approach focuses on financial information that the Company’s management uses to make decisions about operating matters. Management uses operating revenues, operating expense categories, operating ratios, operating income and key operating statistics to evaluate performance and allocate resources to the Company’s operating segments.
During the periods being reported on, the Company operated in four defined reportable operating segments: (1) ABF; (2) G.I. Trucking (which was sold on August 1, 2001) (see Note S); (3) Clipper; and (4) Treadco (which was contributed to Wingfoot on October 31, 2000) (see Note R). A discussion of the services from which each reportable segment derives its revenues is as follows:
ABF is headquartered in Fort Smith, Arkansas, and is one of North America’s largest national less-than-truckload (“LTL”) motor carriers, providing direct service to over 98.6% of the cities in the United States having a population of 25,000 or more. ABF offers long-haul, intrastate and regional transportation of general commodities through LTL, assured services and expedited shipments.
Clipper is headquartered in Lemont, Illinois. Clipper offers domestic intermodal freight services, utilizing transportation movement over the road and on the rail.
The Company’s other business activities and operating segments that are not reportable include FleetNet America, LLC, a third-party, vehicle maintenance company; Arkansas Best Corporation, the parent holding company; and Transport Realty, Inc., a real estate subsidiary of the Company, as well as other subsidiaries.
The Company eliminates intercompany transactions in consolidation. However, the information used by the Company’s management with respect to its reportable segments is before intersegment eliminations of revenues and expenses. Intersegment revenues and expenses are not significant.
Further classifications of operations or revenues by geographic location beyond the descriptions provided above is impractical and is, therefore, not provided. The Company’s foreign operations are not significant.

ARKANSAS BEST CORPORATIONNOTES TO CONSOLIDATED FINANCIAL STATEMENTS - continued
The following tables reflect reportable operating segment information for the Company, as well as a reconciliation of reportable segment information to the Company’s consolidated operating revenues, operating expenses and operating income:
Year Ended December 312001 2000 1999
($ thousands)OPERATING REVENUES
ABF Freight System, Inc. ...................................................... $ 1,282,315 $ 1,379,280 $ 1,277,093G.I. Trucking Company (see Note S)...................................... 95,477 161,897 137,409Clipper .................................................................................. 127,278 130,242 112,237Treadco, Inc. (see Note R) ..................................................... – 158,269 186,602Other revenues and eliminations ............................................ 21,136 9,879 8,245
Total consolidated operating revenues .............................. $ 1,526,206 $ 1,839,567 $ 1,721,586
OPERATING EXPENSES AND COSTS
ABF Freight System, Inc.Salaries and wages ................................................................ $ 841,106 $ 860,447 $ 818,928Supplies and expenses ........................................................... 167,072 173,749 140,257Operating taxes and licenses .................................................. 40,426 41,004 37,962Insurance ............................................................................... 17,342 22,515 20,811Communications and utilities ................................................ 15,081 14,950 15,808Depreciation and amortization ............................................... 39,848 35,947 30,409Rents and purchased transportation ........................................ 77,690 93,856 101,849Other ..................................................................................... 5,036 3,538 4,887(Gain) on sale of equipment .................................................. (641) (568) (787)
1,202,960 1,245,438 1,170,124
G.I. Trucking Company (see Note S)Salaries and wages ................................................................ 49,496 76,024 64,288Supplies and expenses ........................................................... 9,252 15,154 11,061Operating taxes and licenses .................................................. 2,255 3,419 3,251Insurance ............................................................................... 2,312 3,982 3,736Communications and utilities ................................................ 1,348 2,091 1,773Depreciation and amortization ............................................... 3,275 4,833 3,601Rents and purchased transportation ........................................ 25,212 48,627 44,362Other ..................................................................................... 2,302 3,907 3,419(Gain) on sale of equipment .................................................. (48) (55) (117)
95,404 157,982 135,374
ClipperCost of services ..................................................................... 111,131 111,302 96,433Selling, administrative and general ........................................ 15,651 17,322 14,381Loss (gain) on sale of equipment ........................................... 43 (3) (33)
126,825 128,621 110,781

ARKANSAS BEST CORPORATIONNOTES TO CONSOLIDATED FINANCIAL STATEMENTS - continued
Year Ended December 312001 2000 1999
($ thousands)OPERATING EXPENSES AND COSTS (continued)
Treadco, Inc. (see Note R)Cost of sales ............................................................................ $ – $ 105,379 128,390Selling, administrative and general .......................................... – 48,219 54,622
– 153,598 183,012
Other expenses and eliminations .................................................. 25,083 13,776 12,588
Total consolidated operating expenses and costs ...................... $ 1,450,272 $ 1,699,415 $ 1,611,879
OPERATING INCOMEABF Freight System, Inc. ........................................................ $ 79,355 $ 133,842 $ 106,969G.I. Trucking Company (see Note S) ....................................... 73 3,915 2,035Clipper .................................................................................... 453 1,621 1,456Treadco, Inc. (see Note R) ....................................................... – 4,671 3,590Other income (loss) and eliminations ....................................... (3,947) (3,897) (4,343)
Total consolidated operating income ................................... $ 75,934 $ 140,152 $ 109,707
The following tables provide asset, capital expenditure and depreciation and amortization information by reportable operating segment:
Year Ended December 312001 2000 1999
($ thousands)
IDENTIFIABLE ASSETSABF Freight System, Inc. ........................................................ $ 441,644 $ 505,147 $ 469,282G.I. Trucking Company (see Note S) ....................................... – 57,845 51,049Clipper .................................................................................... 46,618 47,863 41,371Treadco, Inc. (see Note R) ....................................................... – – 90,472Investment in Wingfoot (see Note R) ....................................... 59,341 59,341 –Other and eliminations ............................................................. 175,550 126,928 79,755
Total consolidated identifiable assets .................................. $ 723,153 $ 797,124 $ 731,929
CAPITAL EXPENDITURES (GROSS)ABF Freight System, Inc. ........................................................ $ 62,332 $ 71,337 $ 49,342G.I. Trucking Company (see Note S) ....................................... 4,537 11,693 7,946Clipper .................................................................................... 3,582 4,346 5,309Treadco, Inc. (see Note R) ....................................................... – 3,916 9,801Other and eliminations ............................................................. 4,219 2,293 3,811
Total consolidated capital expenditures (gross).................... $ 74,670 $ 93,585 $ 76,209
DEPRECIATION AND AMORTIZATION EXPENSEABF Freight System, Inc. ........................................................ $ 41,334 $ 37,746 $ 31,655G.I. Trucking Company (see Note S) ....................................... 3,185 4,781 3,552Clipper .................................................................................... 2,451 1,995 1,473Treadco, Inc. (see Note R) ....................................................... – 5,255 6,522Other and eliminations ............................................................. 7,578 6,677 6,559
Total consolidated depreciation and amortization expense . . $ 54,548 $ 56,454 $ 49,761

ARKANSAS BEST CORPORATIONNOTES TO CONSOLIDATED FINANCIAL STATEMENTS - continued
NOTE N - FINANCIAL INSTRUMENTS
Interest Rate Instruments
In February 1998, the Company entered into an interest rate swap effective April 1, 1998. The swap agreement is a contract to exchange variable interest rate payments for fixed rate payments over the life of the instrument. The notional amount is used to measure interest to be paid or received and does not represent the exposure to credit loss. The purpose of the swap is to limit the Company’s exposure to increases in interest rates on the notional amount of bank borrowings over the term of the swap. The fixed interest rate under the swap is 5.845% plus the Credit Agreement margin (currently 0.575%). On January 1, 2001, this instrument was recorded on the balance sheet of the Company. Details regarding the swap, as of December 31, 2001, are as follows:
Notional Rate Rate FairAmount Maturity Paid Received Value (2)(3)
$110.0 million April 1, 2005 5.845% Plus Credit Agreement LIBOR rate (1) ($5.4) millionMargin (currently 0.575%) Plus Credit Agreement
Margin (currently 0.575%)
(1) LIBOR rate is determined two London Banking Days prior to the first day of every month and continues up to and including the maturity date.
(2) The fair value is an amount estimated by Societe Generale (“process agent”) that the Company would have paid at December 31, 2001 to terminate the agreement.
(3) The swap value declined from ($0.1) million at December 31, 2000. The fair value is impacted by changes in rates of similarly termed Treasury instruments.
Fair Value of Financial Instruments
The following methods and assumptions were used by the Company in estimating its fair value disclosures for all financial instruments, except for the interest-rate swap agreement disclosed above and capitalized leases:
Cash and Cash Equivalents. The carrying amount reported in the balance sheets for cash and cash equivalents approximates its fair value.
Long- and Short-Term Debt. The carrying amounts of the Company’s borrowings under its Revolving Credit Agreements approximate their fair values, since the interest rate under these agreements is variable. Also, the carrying amount of long-term debt was estimated to approximate their fair values, with the exception of the Subordinated Debentures, which are estimated using current market rates.
The carrying amounts and fair value of the Company’s financial instruments at December 31 are as follows:
2001 2000Carrying Fair Carrying FairAmount Value Amount Value
($ thousands)
Cash and cash equivalents........................................... $ 14,860 $ 14,860 $ 36,742 $ 36,742Short-term debt........................................................... $ 24 $ 24 $ 21 $ 21Long-term debt........................................................... $ 114,917 $ 114,498 $ 138,814 $ 137,831

ARKANSAS BEST CORPORATIONNOTES TO CONSOLIDATED FINANCIAL STATEMENTS - continued
NOTE O - EARNINGS PER SHARE
The following table sets forth the computation of basic and diluted earnings per share:
Year Ended December 312001 2000 1999
($ thousands, except per share data)
Numerator:Numerator for basic earnings per share – Net income.......................................................................... $ 41,404 $ 76,155 $ 50,396 Preferred stock dividends ................................................... (2,487) (4,122) (4,298)Numerator for basic earnings per share – Net income available to common stockholders ......................................................... 38,917 72,033 46,098
Effect of dilutive securities .................................................... 2,487 4,122 4,298
Numerator for diluted earnings per share – Net income available to common stockholders ......................................................... $ 41,404 $ 76,155 $ 50,396
Denominator:Denominator for basic earnings per share – weighted-average shares ...................................................... 21,802,258 19,881,875 19,671,130
Effect of dilutive securities: Preferred stock .................................................................... 2,354,157 3,530,183 3,796,852 Employee stock options........................................................ 805,464 625,162 464,839
Denominator for diluted earnings per share – adjusted weighted-average shares and assumed conversions........................................... 24,961,879 24,037,220 23,932,821
NET INCOME (LOSS) PER COMMON SHARE Basic:
Continuing operations .......................................................... $ 1.79 $ 3.62 $ 2.38Discontinued operations ........................................................ – – (0.04)
NET INCOME PER SHARE ................................................... $ 1.79 $ 3.62 $ 2.34
AVERAGE COMMON SHARES OUTSTANDING (BASIC) ................................................... 21,802,258 19,881,875 19,671,130
Diluted:Continuing operations .......................................................... $ 1.66 $ 3.17 $ 2.14Discontinued operations......................................................... – – (0.03)
NET INCOME PER SHARE ................................................... $ 1.66 $ 3.17 $ 2.11
AVERAGE COMMON SHARES OUTSTANDING (DILUTED) .............................................. 24,961,879 24,037,220 23,932,821
CASH DIVIDENDS PAID PER COMMON SHARE ............. $ – $ – $ –

ARKANSAS BEST CORPORATIONNOTES TO CONSOLIDATED FINANCIAL STATEMENTS - continued
NOTE P - QUARTERLY RESULTS OF OPERATIONS (UNAUDITED)
The tables below present unaudited quarterly financial information for 2001 and 2000:
2001Three Months Ended
March 31 June 30 September 30 December 31($ thousands, except per share data)
Operating revenues....................................................... $ 400,576 $ 406,577 $ 381,554 $ 337,499Operating expenses and costs....................................... 380,512 386,680 360,347 322,733Operating income ....................................................... 20,064 19,897 21,207 14,766Other income (expense) - net ....................................... (4,564) (3,125) 812 (2,338)Income taxes................................................................ 6,421 6,939 8,999 2,956Income from continuing operations.............................. 9,079 9,833 13,020 9,472Loss from discontinued operations............................... – – – –Net income................................................................... $ 9,079 $ 9,833 $ 13,020 $ 9,472
Net income per common share, basic: (1)Continuing operations............................................. $ 0.40 $ 0.43 $ 0.57 $ 0.39Discontinued operations.......................................... – – – –
Net income per share (basic)........................................ $ 0.40 $ 0.43 $ 0.57 $ 0.39Average shares outstanding.......................................... 20,349,674 20,454,699 21,947,611 24,457,048
Net income per common share, diluted: (2)Continuing operations............................................. $ 0.37 $ 0.40 $ 0.52 $ 0.38Discontinued operations.......................................... – – – –
Net income per share (diluted)..................................... $ 0.37 $ 0.40 $ 0.52 $ 0.38Average shares outstanding ......................................... 24,693,788 24,834,232 25,141,502 25,178,175
2000Three Months Ended
March 31 June 30 September 30 December 31($ thousands, except per share data)
Operating revenues ...................................................... $ 443,015 $ 471,987 $ 488,468 $ 436,097Operating expenses and costs ...................................... 416,734 436,896 444,073 401,712Operating income ....................................................... 26,281 35,091 44,395 34,385Other expense - net ...................................................... (3,726) (4,699) (4,928) 2,324Income taxes .............................................................. 9,383 12,643 16,142 14,800Income from continuing operations.............................. 13,172 17,749 23,325 21,909Loss from discontinued operations............................... – – – –Net income................................................................... $ 13,172 $ 17,749 $ 23,325 $ 21,909
Net income per common share, basic: (1)Continuing operations............................................. $ 0.61 $ 0.84 $ 1.12 $ 1.04Discontinued operations.......................................... – – – –
Net income per share (basic)........................................ $ 0.61 $ 0.84 $ 1.12 $ 1.04Average shares outstanding.......................................... 19,763,133 19,785,000 19,882,056 20,097,309
Net income per common share, diluted: (2)Continuing operations............................................. $ 0.55 $ 0.74 $ 0.97 $ 0.90Discontinued operations.......................................... – – – –
Net income per share (diluted)..................................... $ 0.55 $ 0.74 $ 0.97 $ 0.90Average shares outstanding.......................................... 24,088,802 24,081,375 24,081,674 24,445,404
(1) Gives consideration to Preferred Stock dividends of $1.0 million per quarter for the first and second quarters of 2001, $0.5 million for the third quarter of 2001, $1.1 million per quarter for the first and second quarters of 2000 and $1.0 million per quarter for the third and fourth quarters of 2000.
(2) For the first and second quarters of 2001, and all quarters in 2000, conversion of Preferred Stock into Common is assumed. For the third quarter of 2001, conversion of Preferred Stock into Common is assumed for the period prior to the September 14 Preferred Stock redemption date.

ARKANSAS BEST CORPORATIONNOTES TO CONSOLIDATED FINANCIAL STATEMENTS - continued
NOTE Q – ACQUISITION OF MINORITY INTEREST IN TREADCO, INC.
On January 22, 1999, the Company announced that it had submitted a formal proposal to Treadco’s Board of Directors under which the outstanding shares of Treadco’s common stock not owned by the Company would be acquired for $9.00 per share in cash. The announcement stated that the proposal had the support of Shapiro Capital Management Company, Inc., Treadco’s largest independent stockholder, which beneficially owned 1,132,775 shares (or approximately 22%) of the common stock of Treadco. On March 15, 1999, the Company and Treadco signed a definitive merger agreement for the acquisition of all shares of Treadco’s stock not owned by the Company for $9.00 per share in cash via a tender offer. The tender offer commenced on March 23, 1999 and closed on April 20, 1999. A total of approximately 2,457,000 shares were tendered to the Company. Including the tendered shares, the Company owned approximately 98% of Treadco at the closing of the tender. At a June 10, 1999 special meeting, the stockholders of Treadco, Inc. approved the merger of Treadco Acquisition Corporation, a wholly owned subsidiary of the Company, into Treadco, Inc. This transaction resulted in Treadco, Inc. becoming a wholly owned subsidiary of the Company. Subject to the terms of the merger agreement, shares of common stock not tendered were converted into the right to receive $9.00 per share. As a result of the merger, the Company voluntarily delisted Treadco, Inc.’s common stock from trading on The Nasdaq National Market on June 10, 1999. The cost of the Treadco shares and related expenses of $23.7 million was funded with the Company’s Revolving Credit Facility. The acquisition of the Treadco stock was accounted for as a purchase. The application of purchase accounting to the acquired assets and liabilities of Treadco resulted in the elimination of Treadco’s goodwill of approximately $12.0 million and a reduction of Treadco’s fixed assets of approximately $4.0 million.
Pro forma information (as if the acquisition and related transactions were completed at the beginning of their respective periods) for the year ended December 31, 1999 is as follows:
Year Ended December 311999
($ thousands, except per share data)
Operating revenues ............................................................... $ 1,721,586Net income............................................................................ $ 50,217Net income per share (diluted).............................................. $ 2.10
NOTE R – CONTRIBUTION OF TREADCO’S ASSETS AND LIABILITIES TO WINGFOOT
On September 13, 2000, Treadco entered into an agreement with Goodyear to form a new limited liability company called Wingfoot Commercial Tire Systems, LLC. The transaction closed on October 31, 2000. Effective October 31, 2000, Treadco contributed substantially all of its assets and liabilities to Wingfoot in a non-taxable transaction in exchange for a 19% ownership in Wingfoot. Goodyear contributed substantially all of the assets and liabilities of its Commercial Tire and Service Centers and Brad Ragan Tire Centers to Wingfoot in exchange for an 81% interest in Wingfoot. The final ownership percentages for Treadco and Goodyear were based upon the terms of the agreement. The assets and liabilities contributed by Treadco to Wingfoot were $86.8 million and $37.9 million, respectively.
The Company has the right, at any time after April 30, 2003 and before April 30, 2004, to sell its interest in Wingfoot to Goodyear for a cash “Put Price” equal to approximately $73.4 million. Goodyear has the right, at any time after April 30, 2003 until October 31, 2004, to purchase the Company’s entire interest, for cash, at a “Call Price” equal to the “Put Price” plus $5.0 million. The Company accounts for its investment in Wingfoot under the equity method and the provisions of the Wingfoot Operating Agreement. As provided in the agreement, during the term of the “Put,” the Company does not share in the profits or losses of Wingfoot. In the event the Company does not elect to sell its interest in Wingfoot to Goodyear nor Goodyear elects to purchase the Company’s interest, then the parties’ respective rights and obligations relating to Wingfoot will continue to

ARKANSAS BEST CORPORATIONNOTES TO CONSOLIDATED FINANCIAL STATEMENTS - continued
be governed by the Wingfoot Operating Agreement, including accounting for Wingfoot profit and loss allocations at the respective 19% and 81% ownership percentages beginning May 1, 2004.
The transaction was accounted for using fair value accounting, as prescribed by the EITF Issue 00-5, which resulted in 81% of the fair value gain being recognized in the fourth quarter of 2000. The fair value of 19% of Wingfoot is $62.0 million determined by using the discounted “Put Price,” which represents the fair value of Treadco’s net assets at the October 31, 2000 closing date. The Company’s carrying value of Treadco’s net assets at the closing date was $49.0 million. The gain on the transaction was $13.0 million of which 81% was recognized in the fourth quarter of 2000, or $10.5 million. This gain was reduced by costs of the transaction of $5.5 million, which included investment banking fees, legal and accounting fees, transaction bonuses and the acceleration of certain benefits for the former Treadco officers, for a fair value net gain recognized of $5.0 million. The Company’s investment in Wingfoot at December 31, 2001 and 2000 was $59.3 million.
NOTE S – SALE OF G.I. TRUCKING COMPANY
On August 1, 2001, the Company sold the stock of G.I. Trucking for $40.5 million in cash to a company formed by the senior executives of G.I. Trucking and Estes Express Lines (“Estes”). G.I. Trucking and Estes have been partners in ExpressLINK®, a North American transportation partnership since 1996. The Company recognized a pre-tax gain on the sale of $4.6 million in the third quarter of 2001.
The Company retained ownership of three California terminal facilities and has agreed to lease them for an aggregate amount of $1.6 million per year to G.I. Trucking for a period of up to four years. G.I. Trucking has an option at any time during the four-year lease term to purchase these terminals for $19.5 million. The facilities have a net book value of approximately $6.0 million. If the terminal facilities are sold to G.I. Trucking, the Company will recognize a pre-tax gain of approximately $14.0 million in the period they are sold.
Cash proceeds from the sale of G.I. Trucking, net of costs and income taxes, of approximately $33.0 million were used to pay down the Company’s outstanding debt.
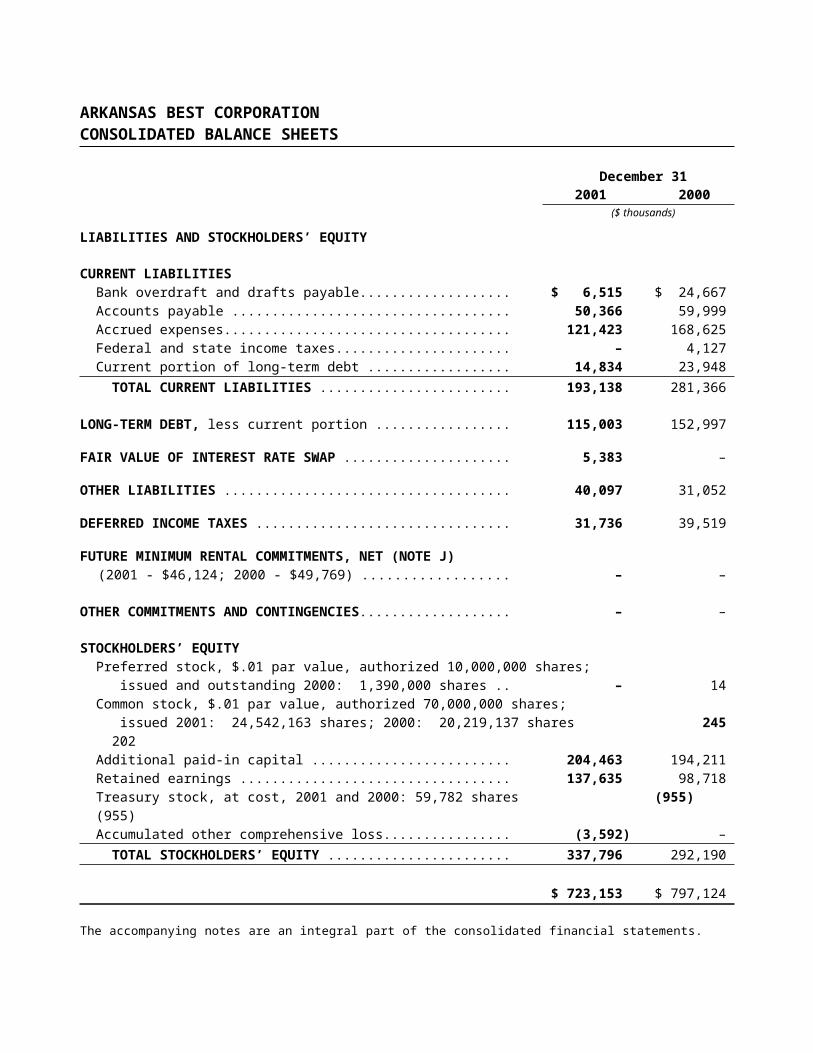
ARKANSAS BEST CORPORATIONNOTES TO CONSOLIDATED FINANCIAL STATEMENTS - continued
NOTE T – RELIANCE INSURANCE COMPANY INSOLVENCY
Reliance Insurance Company (“Reliance”) insured the Company’s workers’ compensation claims in excess of $300,000 (“excess claims”) for the period from 1993 through 1999. According to an Official Statement by the Pennsylvania Insurance Department on October 3, 2001, Reliance was determined to be insolvent, with total admitted assets of $8.8 billion and liabilities of $9.9 billion, or a negative surplus position of $1.1 billion, as of March 31, 2001. As of December 31, 2001, the Company estimates its workers’ compensation claims insured by Reliance to be approximately $5.8 million. The Company has been in contact with and has received either written or verbal confirmation from a number of state guaranty funds that they will accept excess claims, representing a total of approximately $2.5 million of the $5.8 million. Based upon the limited available Reliance financial information, the Company estimates its current exposure to Reliance to be $0.5 million, for which it established reserves during the third quarter of 2001. In evaluating that same financial information, the Company anticipates receiving, from guaranty funds or through orderly liquidation, partial reimbursement for future claims payments, a process that could take several years.
NOTE U – SUBSEQUENT EVENT
On January 24, 2002, the Company called for redemption, the remaining $5.0 million of WorldWay Corporation 6¼% Convertible Subordinated Debentures. The redemption date of the debentures was February 25, 2002 and the redemption price was the par value of each debenture plus accrued and unpaid interest to, but not including, the redemption date. The redemption resulted in a loss to the Company of $0.2 million.

EXHIBIT 21
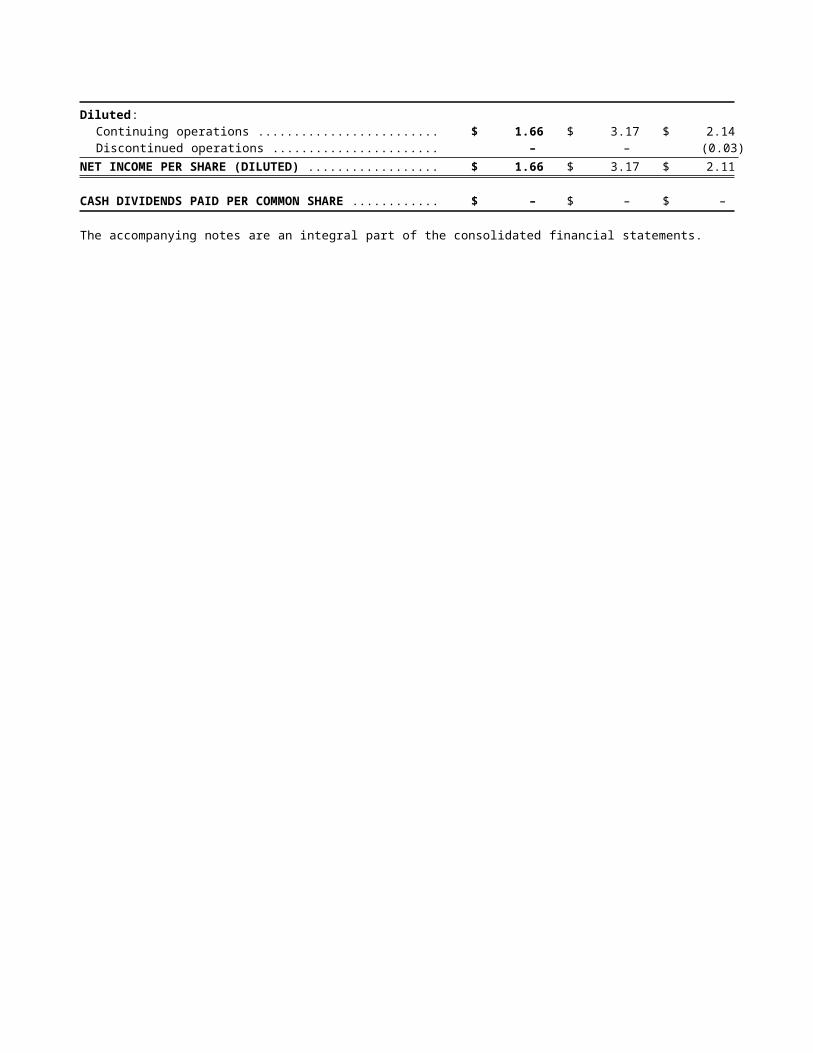
EXHIBIT 21
LIST OF SUBSIDIARY CORPORATIONSARKANSAS BEST CORPORATION
The Registrant owns and controls the following subsidiary corporations:
Jurisdiction of % of VotingName Incorporation Securities Owned
Subsidiaries of Arkansas Best Corporation:ABF Freight System, Inc. Delaware 100Transport Realty, Inc. Arkansas 100Data-Tronics Corp. Arkansas 100ABF Cartage, Inc. Delaware 100Land-Marine Cargo, Inc. Puerto Rico 100ABF Freight System Canada, Ltd. Canada 100ABF Freight System de Mexico, Inc. Delaware 100Agricultural Express of America, Inc. Delaware 100Clipper Exxpress Company Delaware 100Motor Carrier Insurance, Ltd. Bermuda 100Tread-Ark Corporation Delaware 100Best Service Corp. Arkansas 100Clipper Global Air, Inc. Arkansas 100Clipper Freight Management, Inc. Arkansas 100CaroTrans Canada, Ltd. Canada 100CaroTrans de Mexico, S.A. DE C.V. Mexico 100Advertising Counselors, Inc. Arkansas 100Arkansas Underwriters Corporation Arkansas 100
Subsidiary of Tread-Ark Corporation (formerly Treadco, Inc.):FleetNet America, LLC Delaware 100
Subsidiary of ABF Freight System, Inc.:ABF Freight System (B.C.), Ltd. British Columbia 100FreightValue, Inc. Arkansas 100

EXHIBIT 23

EXHIBIT 23
CONSENT OF ERNST & YOUNG LLP, INDEPENDENT AUDITORS
We consent to the incorporation by reference in this Annual Report (Form 10-K) of Arkansas Best Corporation of our report dated January 18, 2002, except for Notes D and U, as to which the date is February 25, 2002, included in the 2001 Annual Report to Stockholders of Arkansas Best Corporation.
Our audits also included the financial statement schedule of Arkansas Best Corporation listed in Item 14(a). This schedule is the responsibility of the Company’s management. Our responsibility is to express an opinion based on our audits. In our opinion, the financial statement schedule referred to above, when considered in relation to the basic consolidated financial statements taken as a whole, presents fairly in all material respects the information set forth therein.
We also consent to the incorporation by reference in the Registration Statement (Form S-8 No. 333-52970) pertaining to the Arkansas Best Corporation Nonqualified Stock Option Plan, the Registration Statement (Form S-8 No. 333-93381) pertaining to the Arkansas Best Corporation Supplemental Benefit Plan, the Registration Statement (Form S-8 No. 333-69953) pertaining to the Arkansas Best Corporation Voluntary Savings Plan, the Registration Statement (Form S-8 No. 333-61793) pertaining to the Arkansas Best Corporation Stock Option Plan, the Registration Statement (Form S-8 No. 333-31475) pertaining to the Arkansas Best Corporation Stock Option Plan, the Registration Statement (Form S-8 No. 33-66694) pertaining to the Arkansas Best Corporation Disinterested Director Stockholder Plan and the Registration Statement (Form S-8, No. 33-52877) pertaining to the Arkansas Best 401(k) Savings Plan, of our report dated January 18, 2002, except for Notes D and U, as to which the date is February 25, 2002, with respect to the consolidated financial statements incorporated herein by reference, and our report included in the preceding paragraph with respect to the financial statement schedule included in this Annual Report (Form 10-K) of Arkansas Best Corporation.
Ernst & Young LLP
Little Rock, ArkansasMarch 6, 2002