Embed Size (px)
Citation preview

Dealerships Are Far Too Valuable To Be Sold Any Other Way
Presentation to Bank of America National Accounts ClientsHalf Moon Bay, California
September 17, 2014
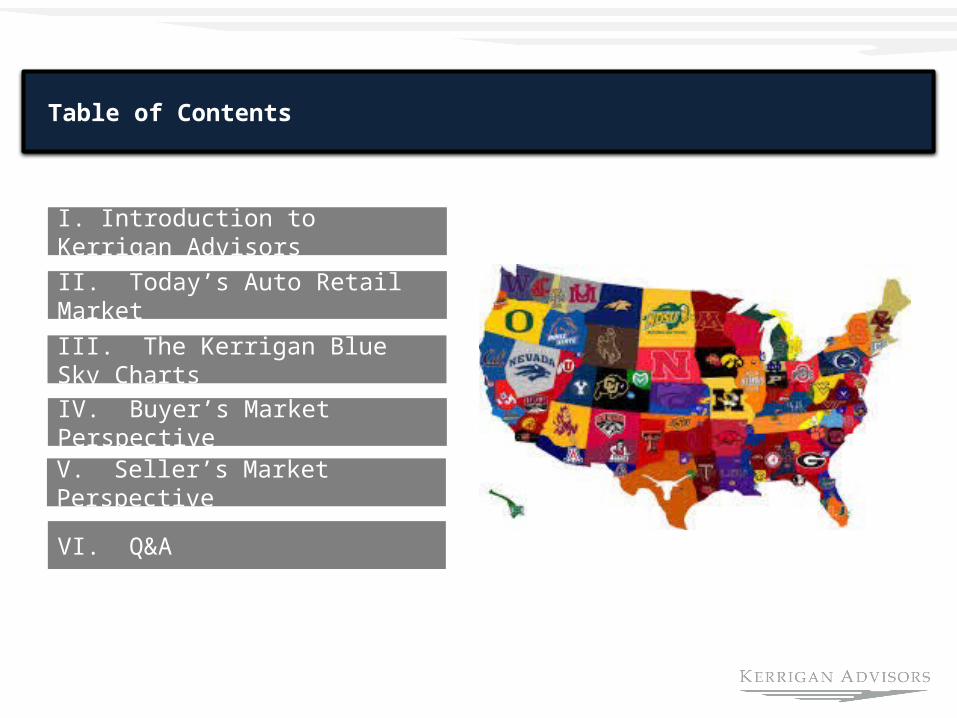
Table of Contents
I. Introduction to Kerrigan Advisors
II. Today’s Auto Retail Market
IV. Buyer’s Market Perspective
V. Seller’s Market Perspective
III. The Kerrigan Blue Sky Charts
VI. Q&A

3
Busch Push
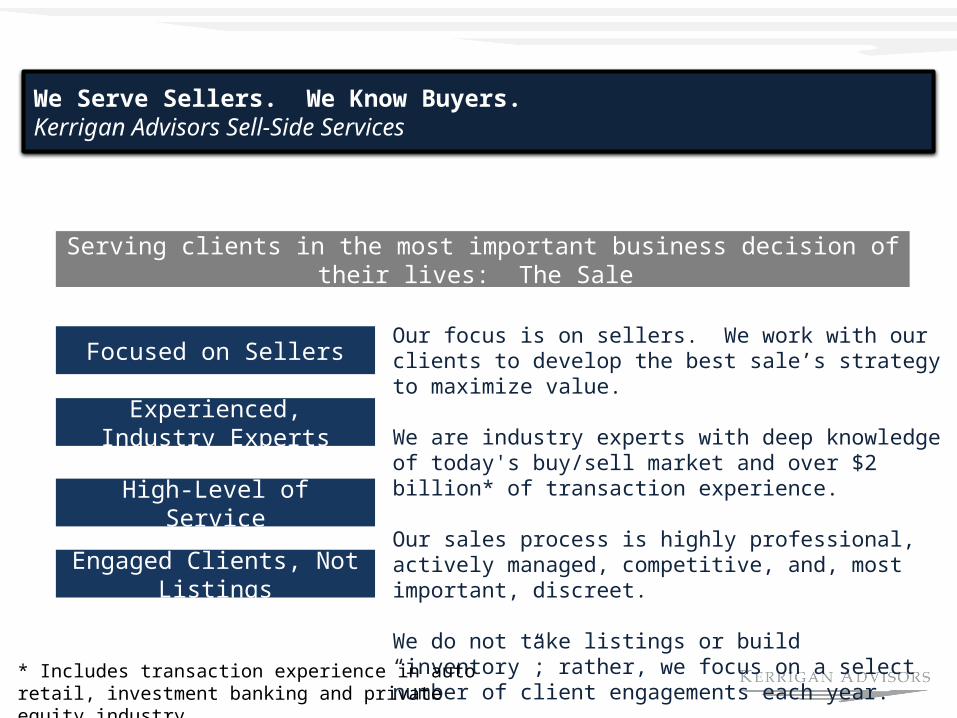
Our focus is on sellers. We work with our clients to develop the best sale’s strategy to maximize value.
We are industry experts with deep knowledge of today's buy/sell market and over $2 billion* of transaction experience.
Our sales process is highly professional, actively managed, competitive, and, most important, discreet.
We do not take listings or build “inventory”; rather, we focus on a select number of client engagements each year.
We Serve Sellers. We Know Buyers.Kerrigan Advisors Sell-Side Services
Serving clients in the most important business decision of their lives: The Sale
Focused on Sellers
Experienced, Industry Experts
High-Level of Service
Engaged Clients, Not Listings
* Includes transaction experience in auto retail, investment banking and private equity industry
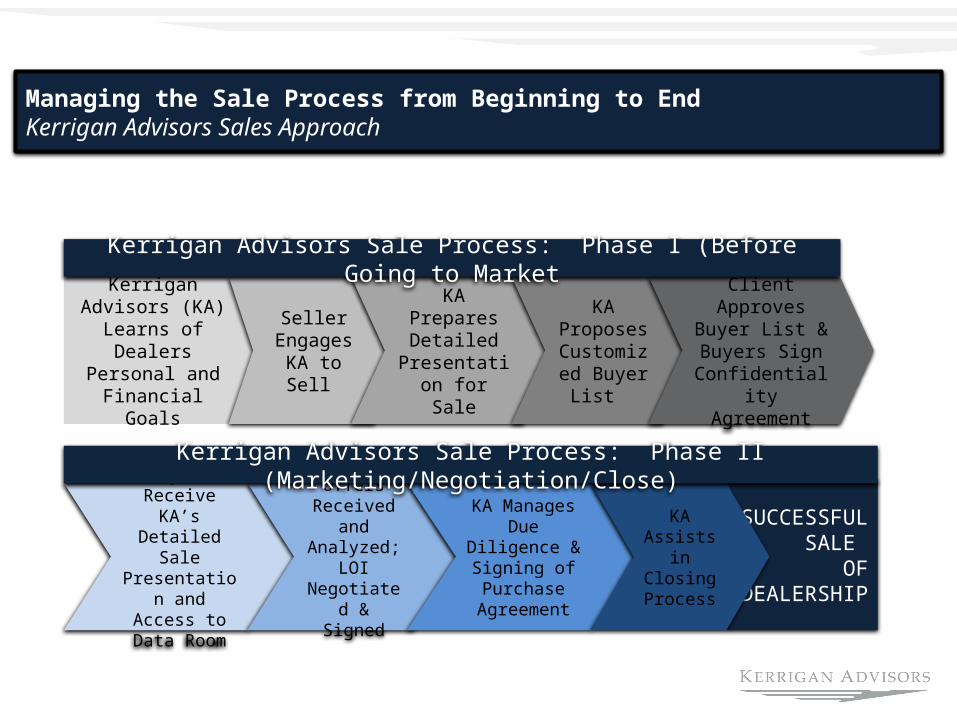
SUCCESSFULSALE
OFDEALERSHIP
Managing the Sale Process from Beginning to EndKerrigan Advisors Sales Approach
Kerrigan Advisors (KA) Learns of
Dealers Personal and Financial Goals
Seller Engages KA
to Sell
KA Prepares Detailed
Presentation for Sale
KA Proposes Customized Buyer List
Client Approves Buyer List & Buyers Sign
Confidentiality Agreement
Buyers Receive KA’s Detailed
Sale Presentation and Access to
Data Room
Offers Received and Analyzed; LOI Negotiated &
Signed
KA Manages Due Diligence &
Signing of Purchase
Agreement
KA Assists in Closing Process
Kerrigan Advisors Sale Process: Phase I (Before Going to Market
Kerrigan Advisors Sale Process: Phase II (Marketing/Negotiation/Close)
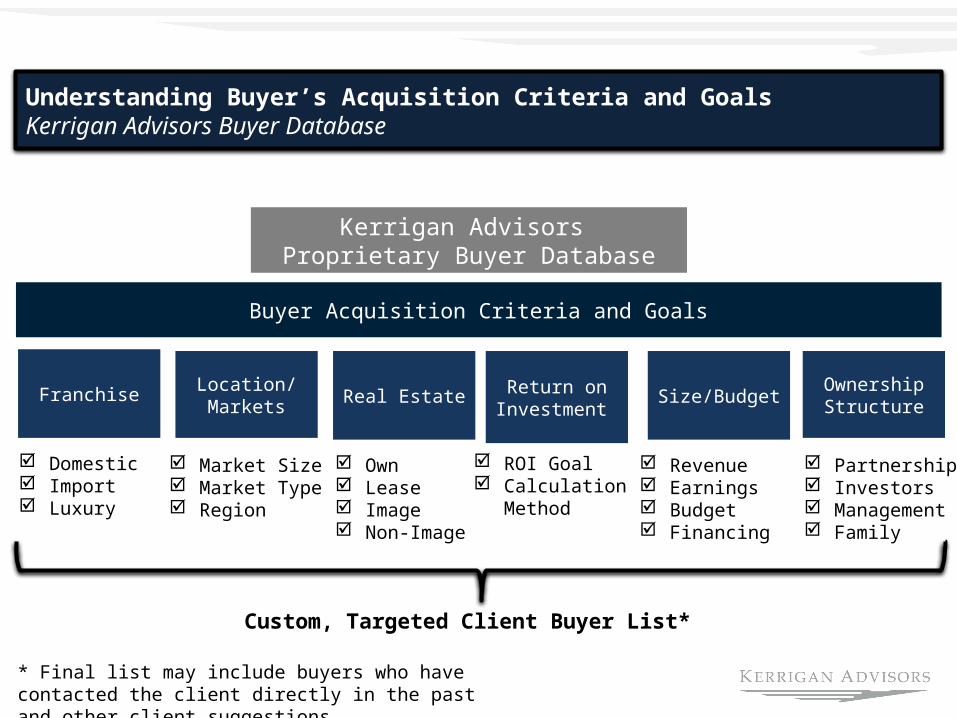
Understanding Buyer’s Acquisition Criteria and GoalsKerrigan Advisors Buyer Database
Kerrigan Advisors Proprietary Buyer Database
Size/BudgetOwnership Structure
Return on Investment
Real EstateLocation/Markets
Franchise
Buyer Acquisition Criteria and Goals
Domestic Import Luxury
Market Size Market Type Region
Own Lease Image Non-Image
ROI Goal Calculation
Method
Revenue Earnings Budget Financing
Partnership Investors Management Family
Custom, Targeted Client Buyer List*
* Final list may include buyers who have contacted the client directly in the past and other client suggestions
II. Today’s Auto Retail Market
9
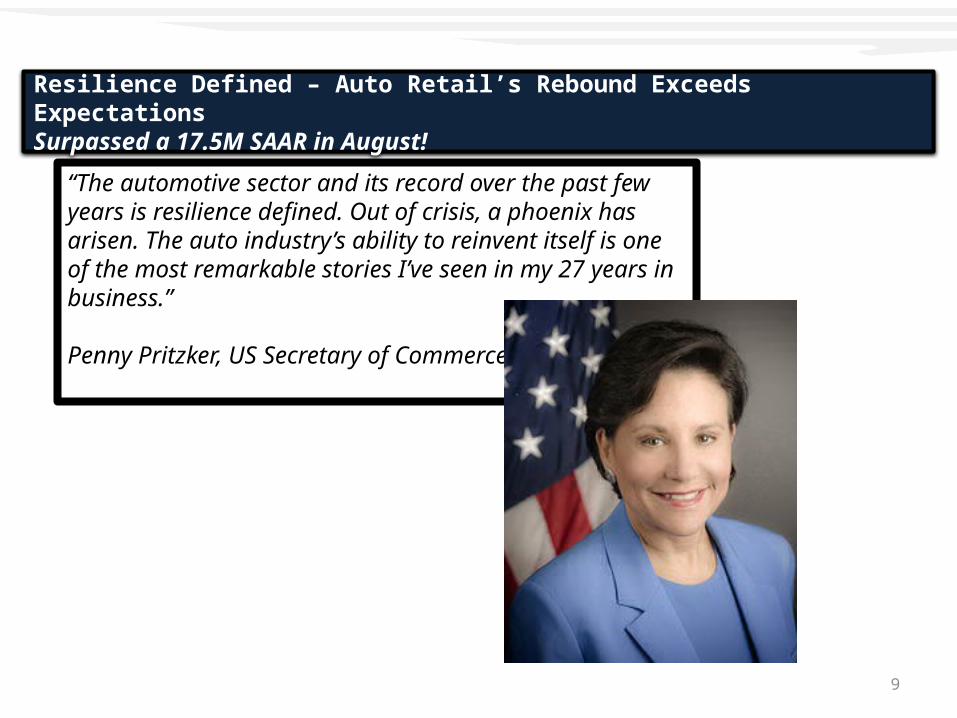
“The automotive sector and its record over the past few years is resilience defined. Out of crisis, a phoenix has arisen. The auto industry’s ability to reinvent itself is one of the most remarkable stories I’ve seen in my 27 years in business.”
Penny Pritzker, US Secretary of Commerce
Resilience Defined – Auto Retail’s Rebound Exceeds ExpectationsSurpassed a 17.5M SAAR in August!
10
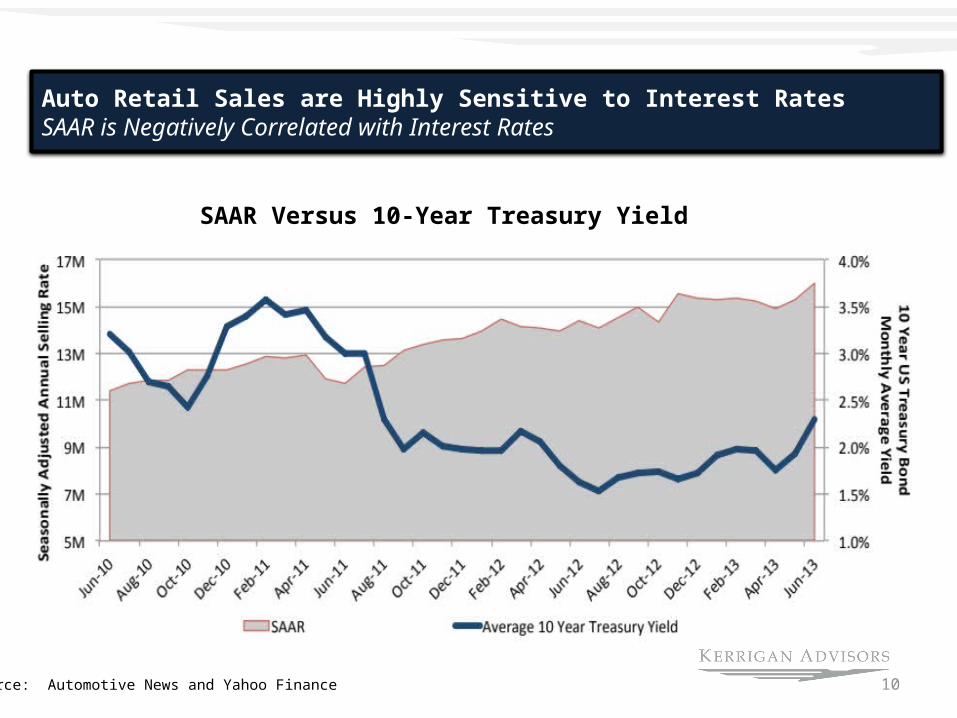
Auto Retail Sales are Highly Sensitive to Interest RatesSAAR is Negatively Correlated with Interest Rates
Source: Automotive News and Yahoo Finance
SAAR Versus 10-Year Treasury Yield
11
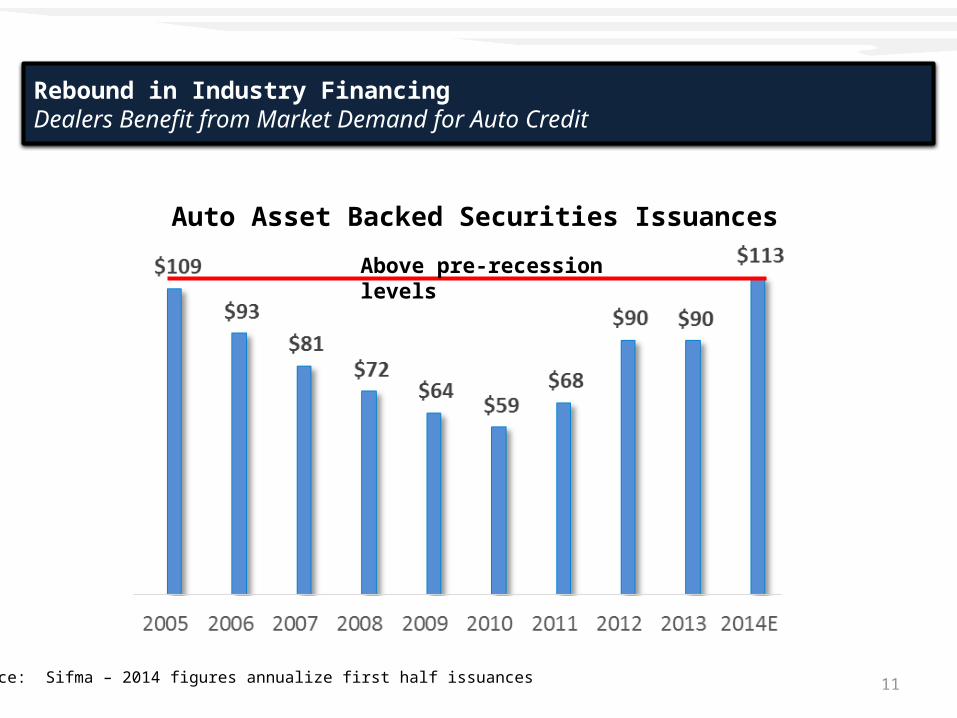
Auto Asset Backed Securities Issuances
Source: Sifma – 2014 figures annualize first half issuances
Rebound in Industry FinancingDealers Benefit from Market Demand for Auto Credit
Above pre-recession levels
12
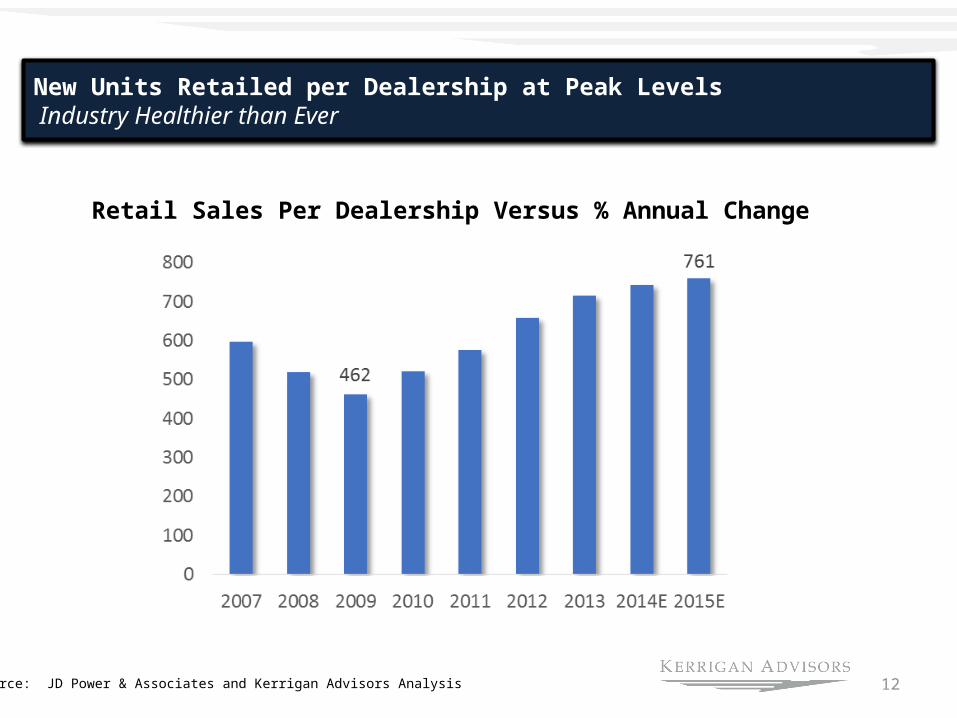
New Units Retailed per Dealership at Peak Levels Industry Healthier than Ever
Source: JD Power & Associates and Kerrigan Advisors Analysis
Retail Sales Per Dealership Versus % Annual Change
13
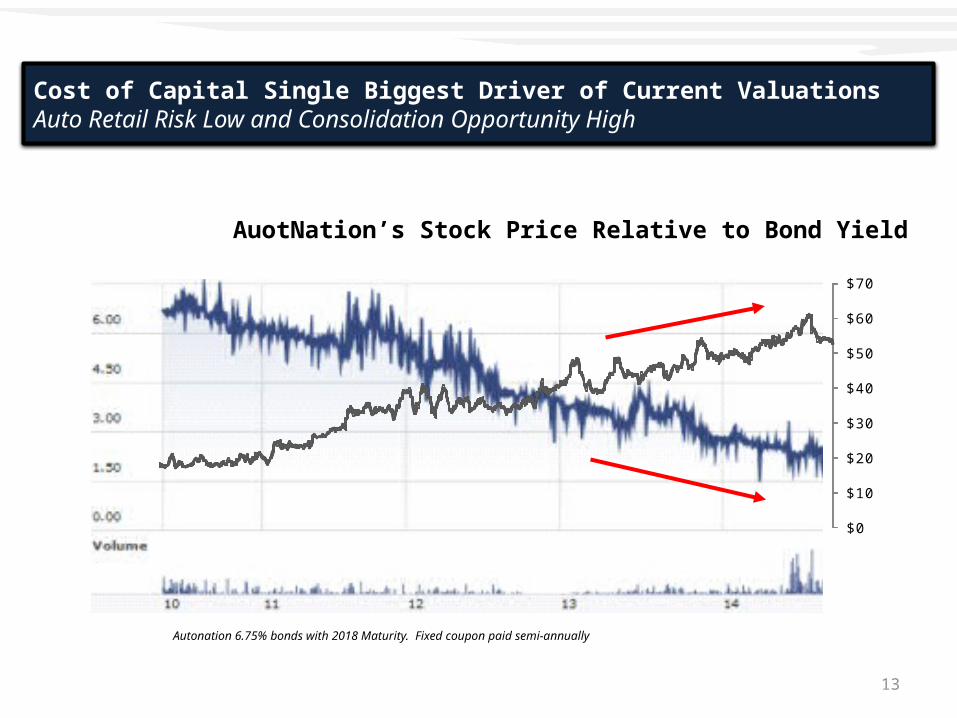
Cost of Capital Single Biggest Driver of Current ValuationsAuto Retail Risk Low and Consolidation Opportunity High
$0
$10
$20
$30
$40
$50
$60
$70
AuotNation’s Stock Price Relative to Bond Yield
Autonation 6.75% bonds with 2018 Maturity. Fixed coupon paid semi-annually
14
Kerrigan Advisors Blue Sky Multiples
15
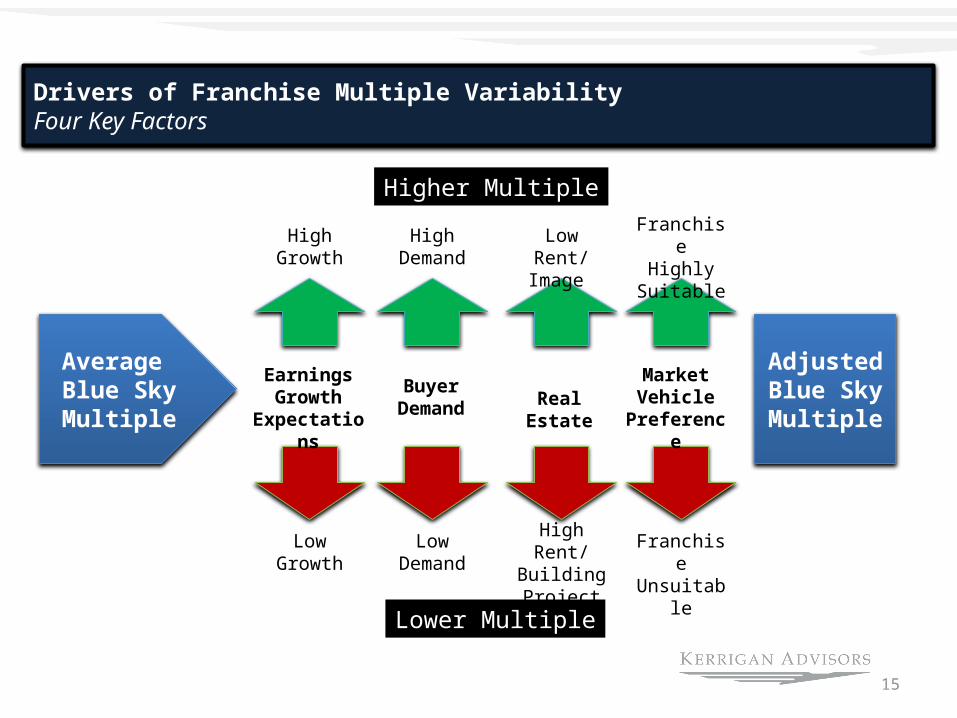
Drivers of Franchise Multiple VariabilityFour Key Factors
Average Blue Sky Multiple
AdjustedBlue Sky Multiple
Earnings Growth
Expectations
Buyer Demand Real Estate
Market Vehicle
Preference
Higher Multiple
Lower Multiple
LowGrowth
LowDemand
High Rent/Building Project
FranchiseUnsuitable
FranchiseHighly
Suitable
HighGrowth
HighDemand
Low Rent/Image
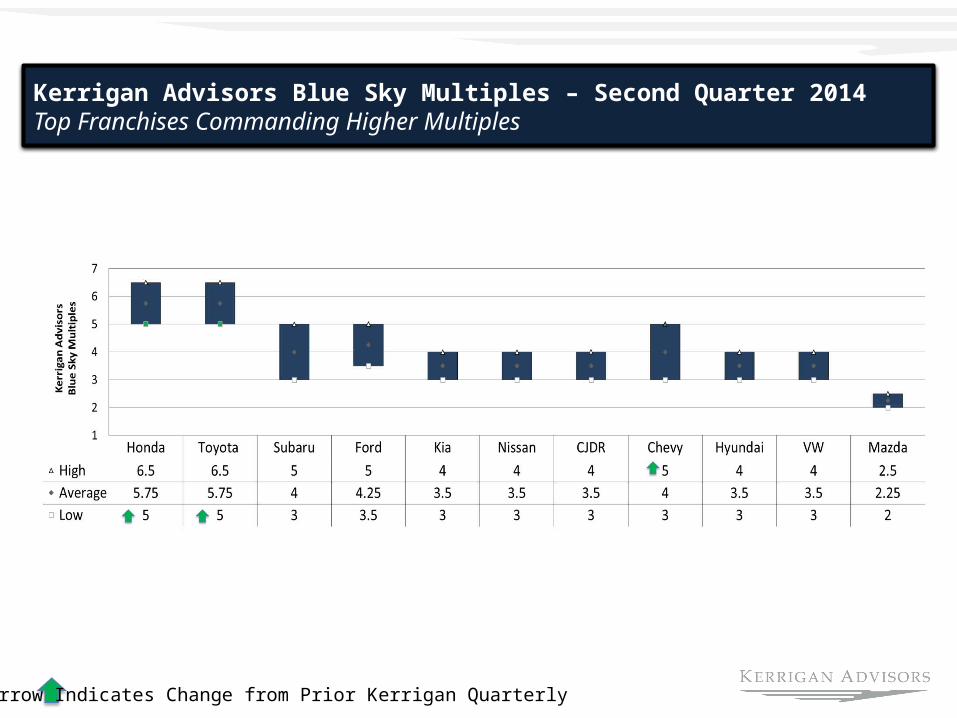
Kerrigan Advisors Blue Sky Multiples – Second Quarter 2014Top Franchises Commanding Higher Multiples
Arrow Indicates Change from Prior Kerrigan Quarterly
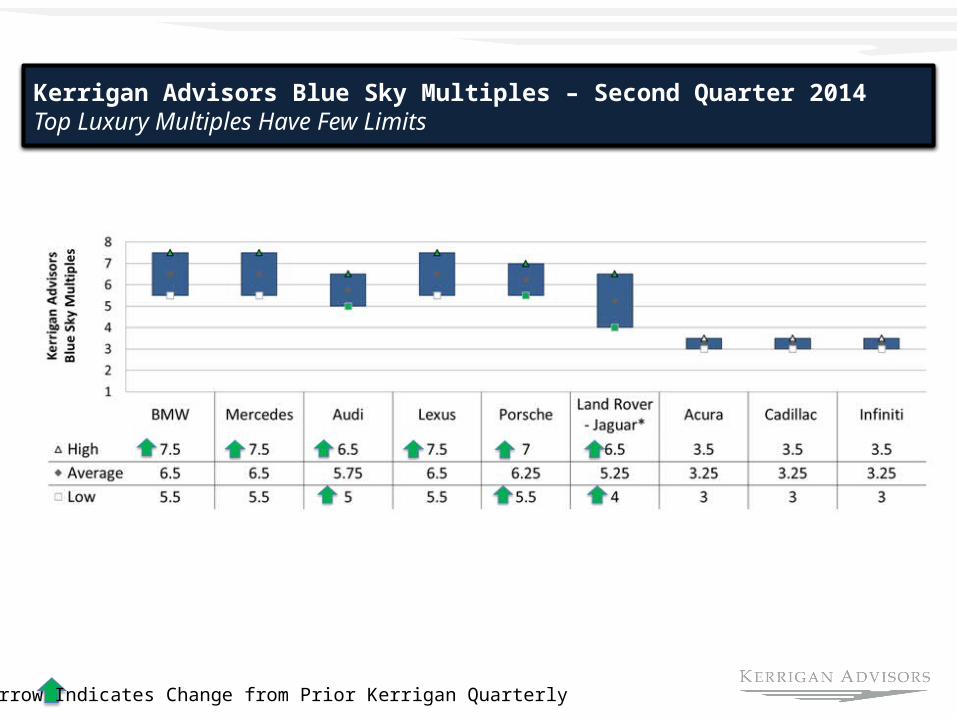
Kerrigan Advisors Blue Sky Multiples – Second Quarter 2014Top Luxury Multiples Have Few Limits
Arrow Indicates Change from Prior Kerrigan Quarterly
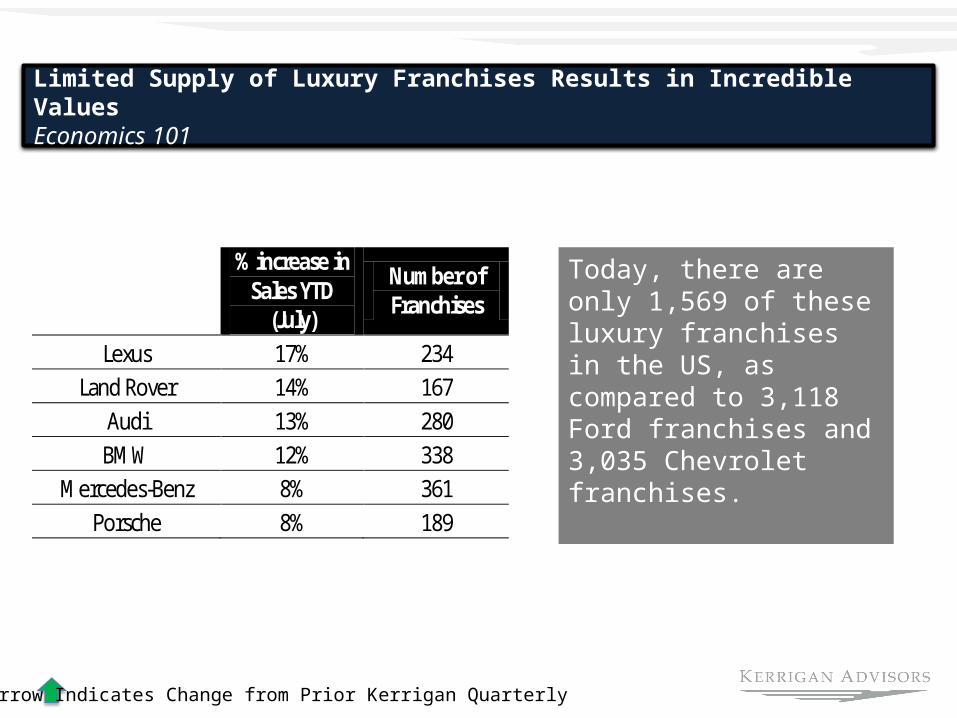
Limited Supply of Luxury Franchises Results in Incredible ValuesEconomics 101
Arrow Indicates Change from Prior Kerrigan Quarterly
% increase in Sales YTD
(July)
Number of Franchises
Lexus 17% 234 Land Rover 14% 167
Audi 13% 280 BMW 12% 338
Mercedes-Benz 8% 361 Porsche 8% 189
Today, there are only 1,569 of these luxury franchises in the US, as compared to 3,118 Ford franchises and 3,035 Chevrolet franchises.
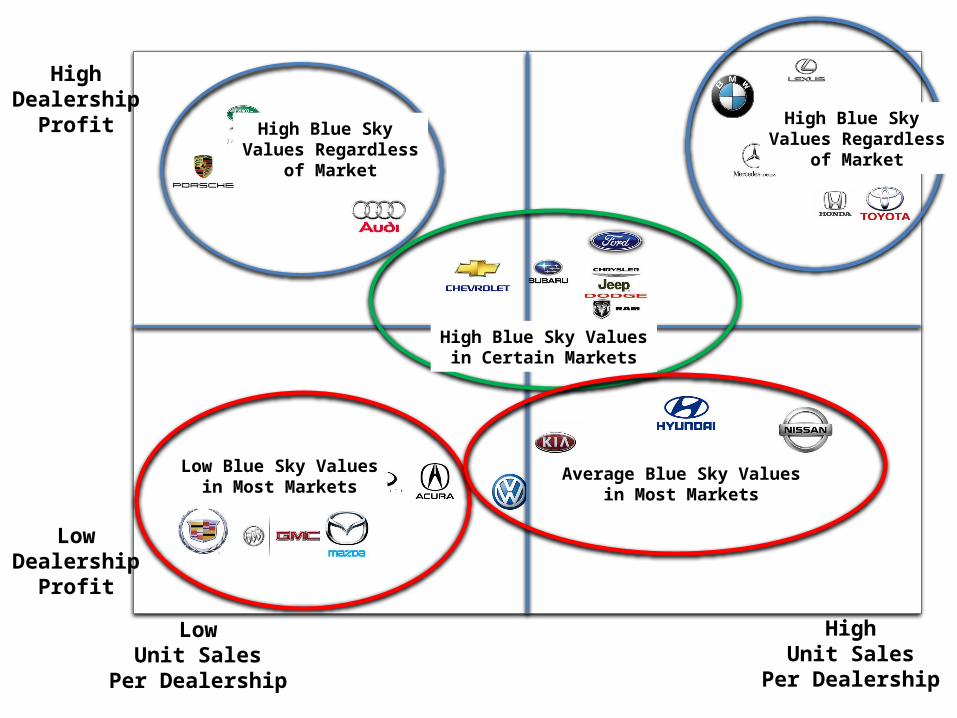
LowUnit Sales
Per Dealership
Some
HighDealership
Profit
LowDealership
Profit
HighUnit Sales
Per Dealership
High Blue Sky Values Regardless
of Market
High Blue Sky Valuesin Certain Markets
High Blue Sky Values Regardless
of Market
Low Blue Sky Valuesin Most Markets
Average Blue Sky Valuesin Most Markets
20
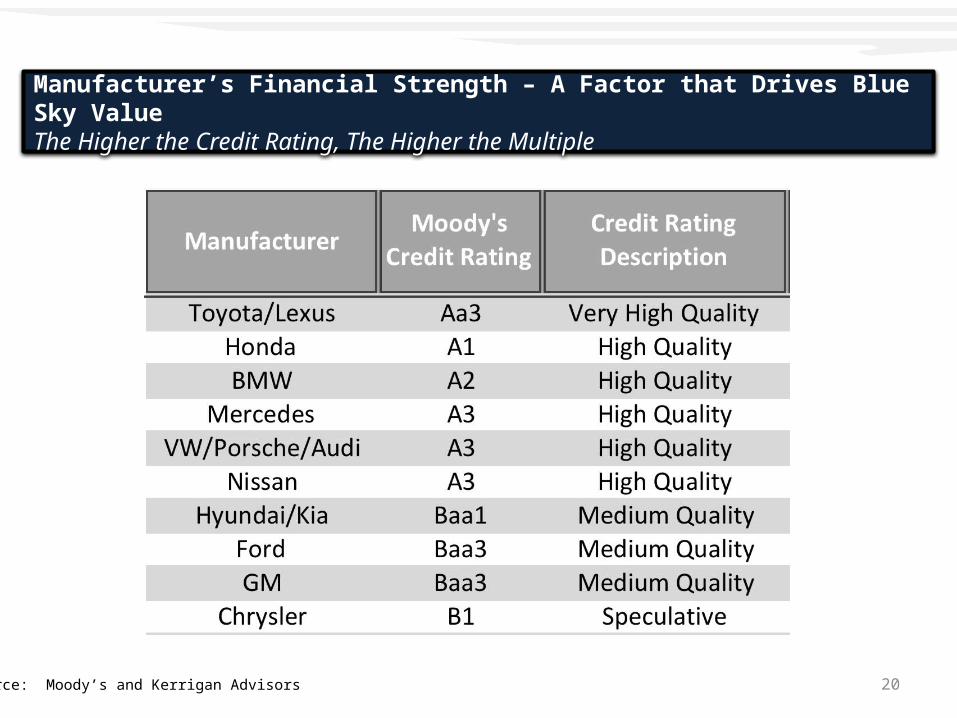
Manufacturer’s Financial Strength – A Factor that Drives Blue Sky ValueThe Higher the Credit Rating, The Higher the Multiple
Source: Moody’s and Kerrigan Advisors
21
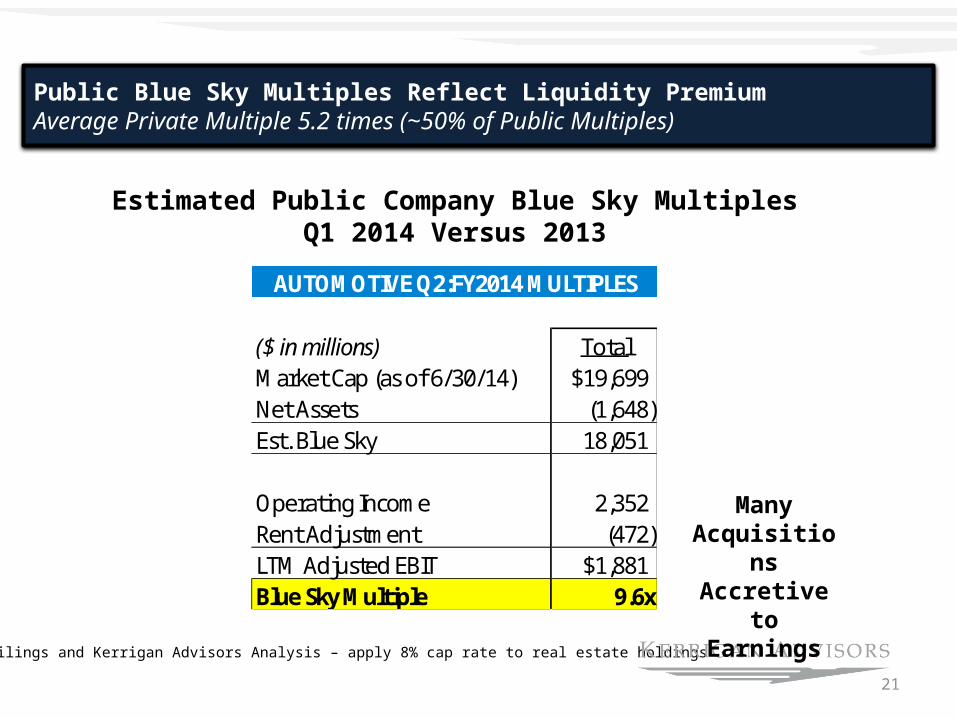
Source: SEC Filings and Kerrigan Advisors Analysis – apply 8% cap rate to real estate holdings
Estimated Public Company Blue Sky MultiplesQ1 2014 Versus 2013
Public Blue Sky Multiples Reflect Liquidity PremiumAverage Private Multiple 5.2 times (~50% of Public Multiples)
AUTOMOTIVE Q2:FY2014 MULTIPLES AUTOMOTIVE Q1:FY2014 MULTIPLES
($ in millions) TotalMarket Cap (as of 6/30/14) $19,699Net Assets (1,648) Est. Blue Sky 18,051
Operating Income 2,352 Rent Adjustment (472) LTM Adjusted EBIT $1,881Blue Sky Multiple 9.6x
Many Acquisitions Accretive to
Earnings
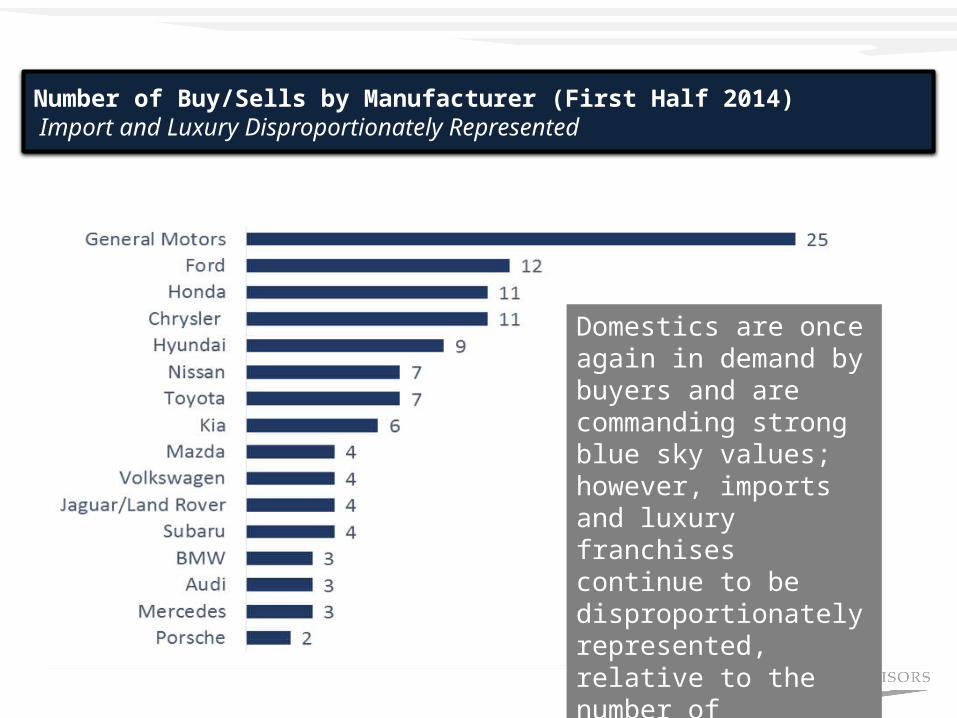
Number of Buy/Sells by Manufacturer (First Half 2014) Import and Luxury Disproportionately Represented
Domestics are once again in demand by buyers and are commanding strong blue sky values; however, imports and luxury franchises continue to be disproportionately represented, relative to the number of franchises.
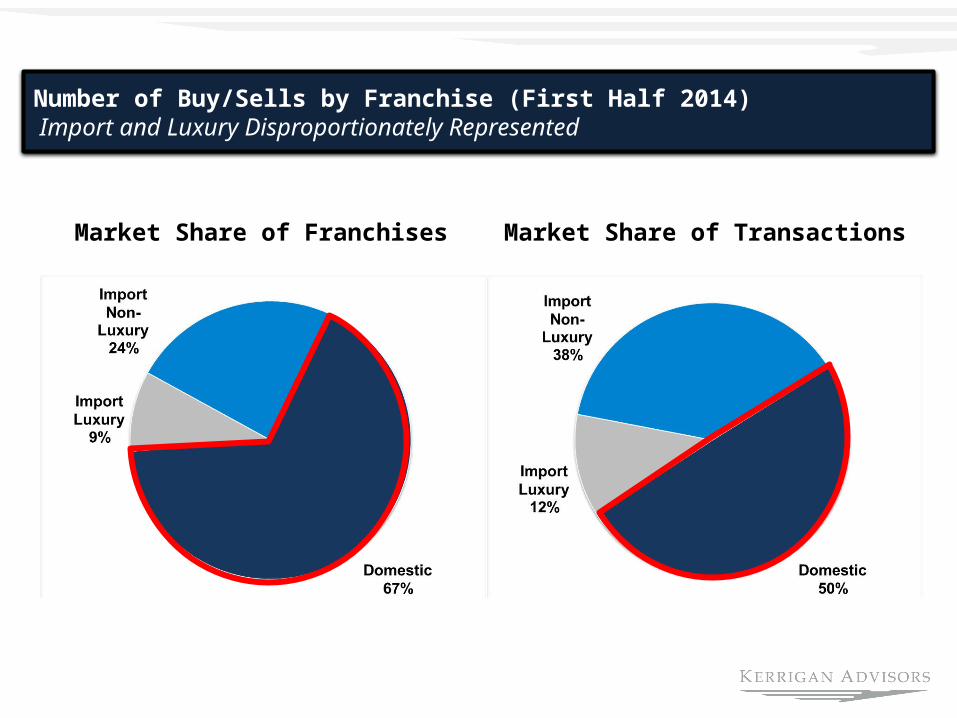
Number of Buy/Sells by Franchise (First Half 2014) Import and Luxury Disproportionately Represented
Market Share of Franchises Market Share of Transactions
24
Buyers Well Positioned With Lots of Support
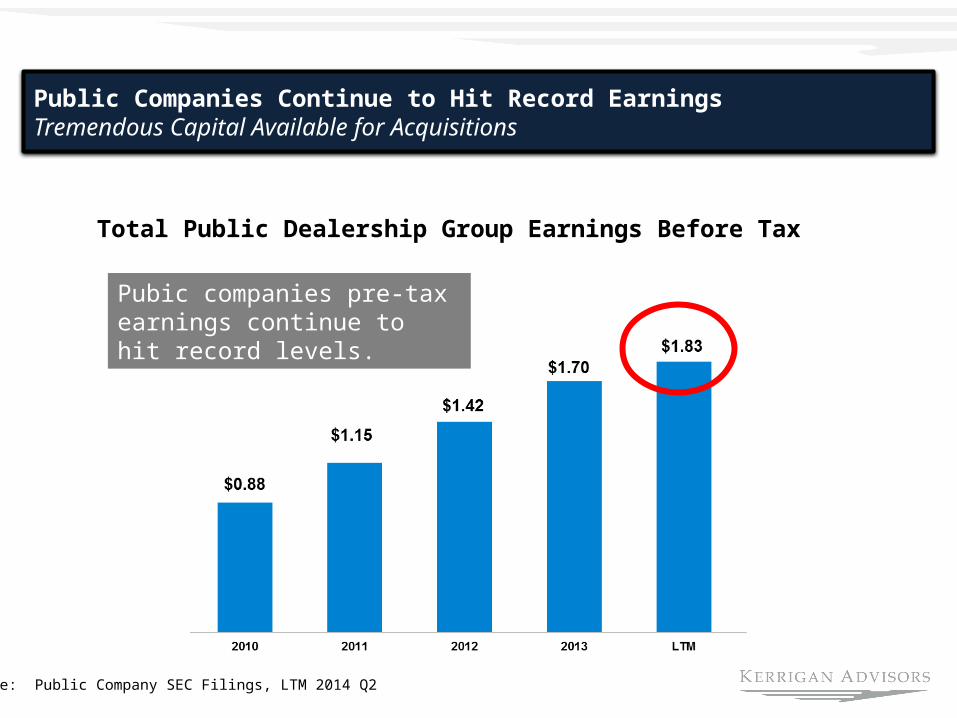
Public Companies Continue to Hit Record Earnings Tremendous Capital Available for Acquisitions
Source: Public Company SEC Filings, LTM 2014 Q2
Total Public Dealership Group Earnings Before Tax
Pubic companies pre-tax earnings continue to hit record levels.
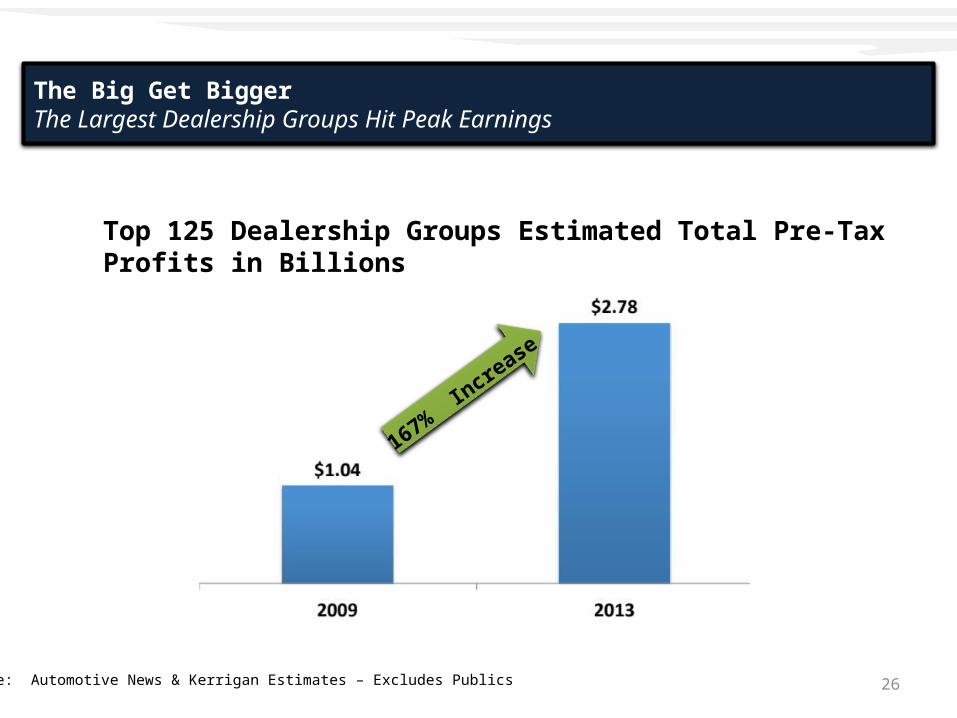
26Source: Automotive News & Kerrigan Estimates – Excludes Publics
Top 125 Dealership Groups Estimated Total Pre-Tax Profits in Billions
167% Increase
The Big Get BiggerThe Largest Dealership Groups Hit Peak Earnings
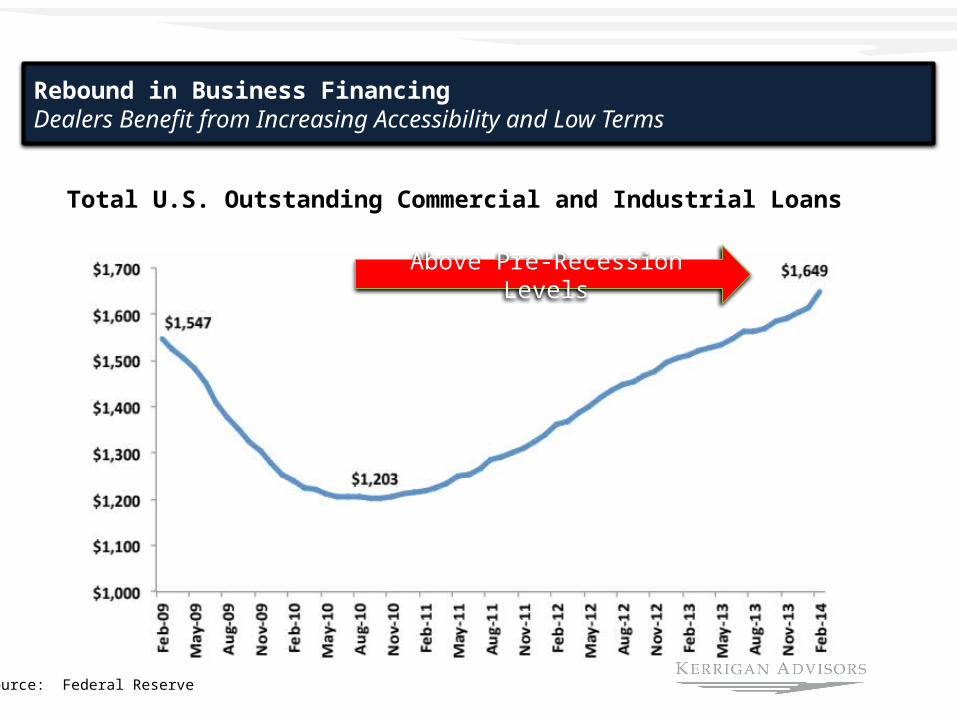
Rebound in Business FinancingDealers Benefit from Increasing Accessibility and Low Terms
Source: Federal Reserve
Total U.S. Outstanding Commercial and Industrial Loans
Above Pre-Recession Levels
28
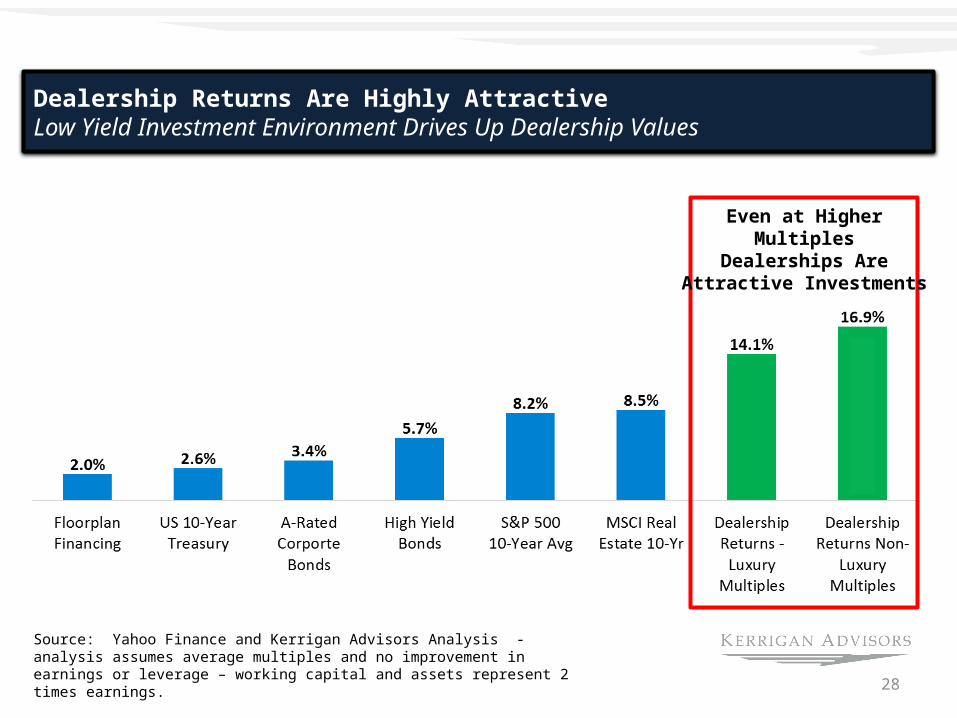
Dealership Returns Are Highly AttractiveLow Yield Investment Environment Drives Up Dealership Values
Source: Yahoo Finance and Kerrigan Advisors Analysis - analysis assumes average multiples and no improvement in earnings or leverage – working capital and assets represent 2 times earnings.
Even at Higher MultiplesDealerships Are Attractive
Investments
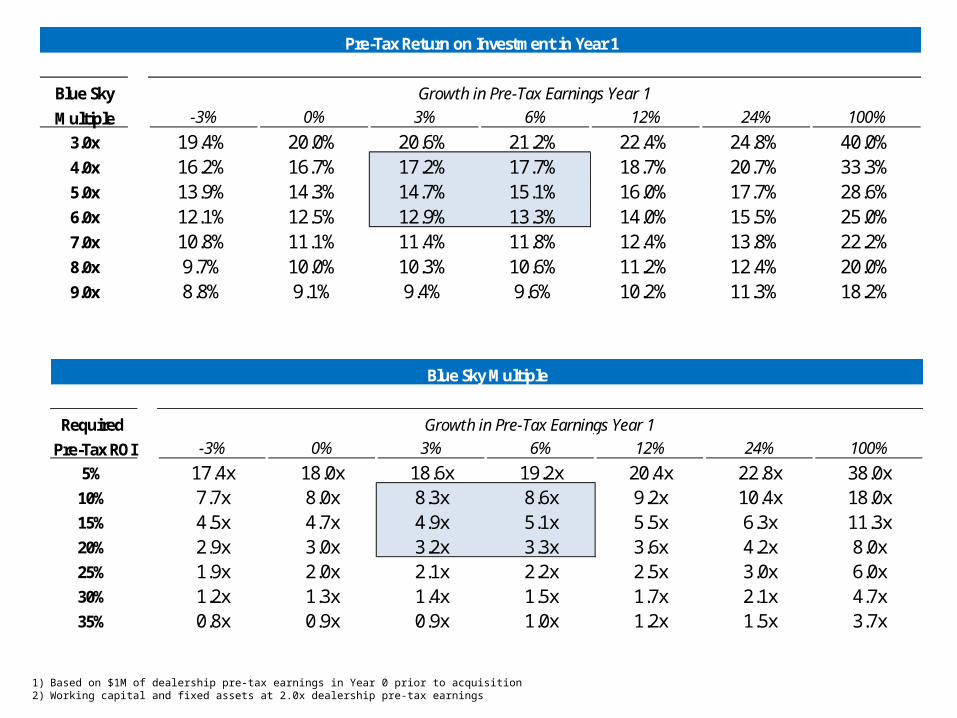
1) Based on $1M of dealership pre-tax earnings in Year 0 prior to acquisition 2) Working capital and fixed assets at 2.0x dealership pre-tax earnings
Pre-Tax Return on Investment in Year 1
Blue Sky Growth in Pre-Tax Earnings Year 1Multiple # -3% 0% 3% 6% 12% 24% 100%
3.0x ## 19.4% 20.0% 20.6% 21.2% 22.4% 24.8% 40.0%4.0x ## 16.2% 16.7% 17.2% 17.7% 18.7% 20.7% 33.3%5.0x ## 13.9% 14.3% 14.7% 15.1% 16.0% 17.7% 28.6%6.0x ## 12.1% 12.5% 12.9% 13.3% 14.0% 15.5% 25.0%7.0x ## 10.8% 11.1% 11.4% 11.8% 12.4% 13.8% 22.2%8.0x ## 9.7% 10.0% 10.3% 10.6% 11.2% 12.4% 20.0%9.0x ## 8.8% 9.1% 9.4% 9.6% 10.2% 11.3% 18.2%
10.0x ## 8.1% 8.3% 8.6% 8.8% 9.3% 10.3% 16.7%
Blue Sky Multiple
Required Growth in Pre-Tax Earnings Year 1Pre-Tax ROI # -3% 0% 3% 6% 12% 24% 100%
5% ## 17.4x 18.0x 18.6x 19.2x 20.4x 22.8x 38.0x10% ## 7.7x 8.0x 8.3x 8.6x 9.2x 10.4x 18.0x15% ## 4.5x 4.7x 4.9x 5.1x 5.5x 6.3x 11.3x20% ## 2.9x 3.0x 3.2x 3.3x 3.6x 4.2x 8.0x25% ## 1.9x 2.0x 2.1x 2.2x 2.5x 3.0x 6.0x30% ## 1.2x 1.3x 1.4x 1.5x 1.7x 2.1x 4.7x35% ## 0.8x 0.9x 0.9x 1.0x 1.2x 1.5x 3.7x
30
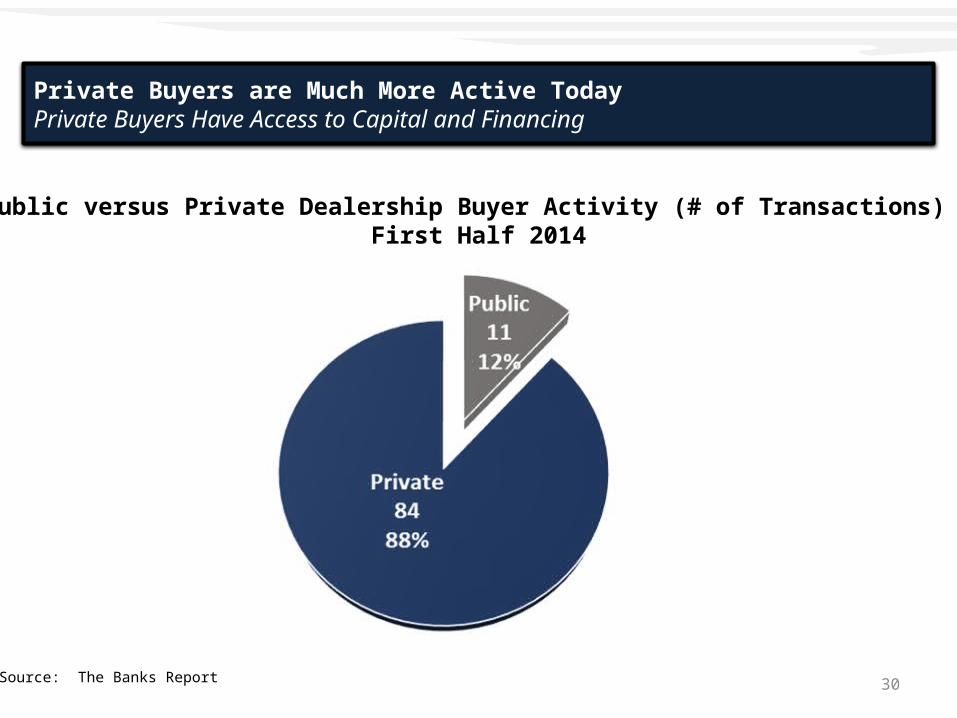
Private Buyers are Much More Active TodayPrivate Buyers Have Access to Capital and Financing
Source: The Banks Report
Public versus Private Dealership Buyer Activity (# of Transactions) First Half 2014
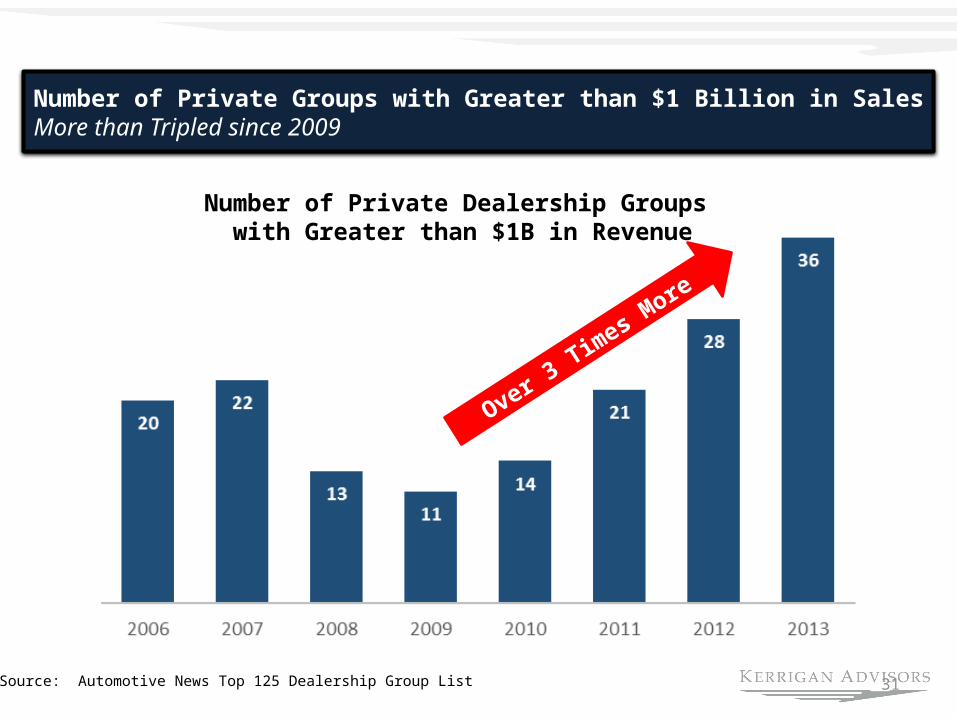
Number of Private Groups with Greater than $1 Billion in SalesMore than Tripled since 2009
31Source: Automotive News Top 125 Dealership Group List
Number of Private Dealership Groups with Greater than $1B in Revenue
Over 3 Times More
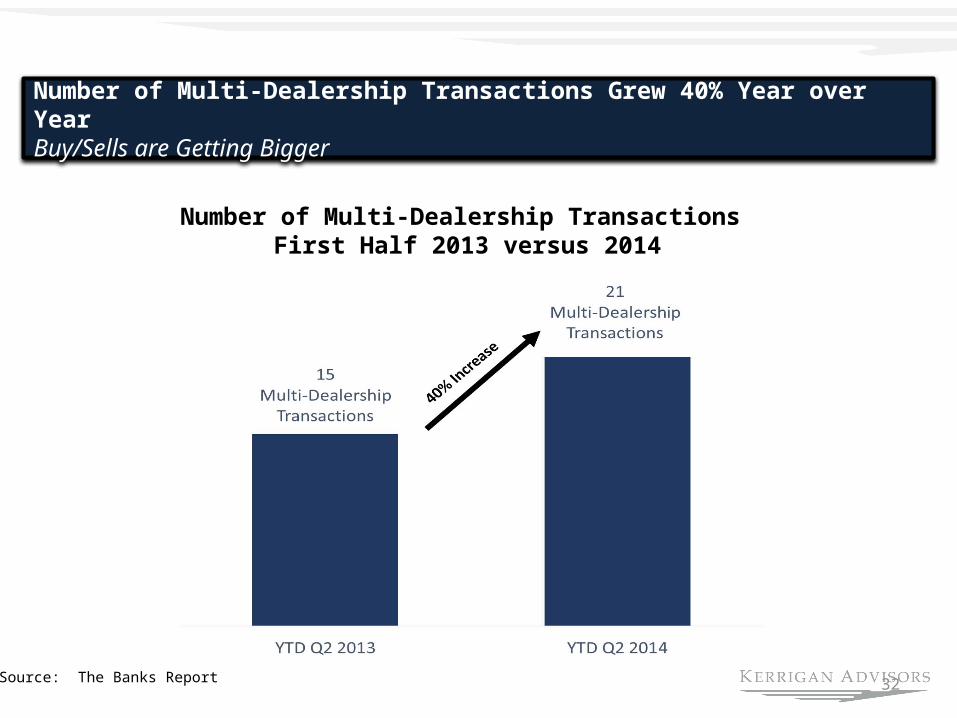
Number of Multi-Dealership Transactions Grew 40% Year over YearBuy/Sells are Getting Bigger
32Source: The Banks Report
Number of Multi-Dealership Transactions First Half 2013 versus 2014
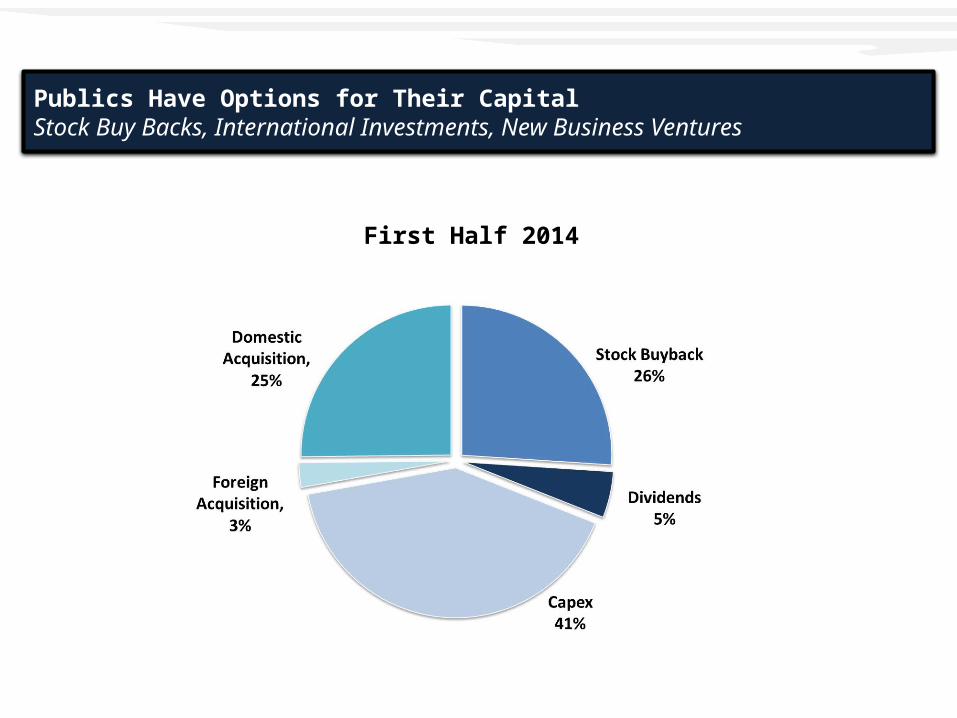
Publics Have Options for Their CapitalStock Buy Backs, International Investments, New Business Ventures
First Half 2014
34
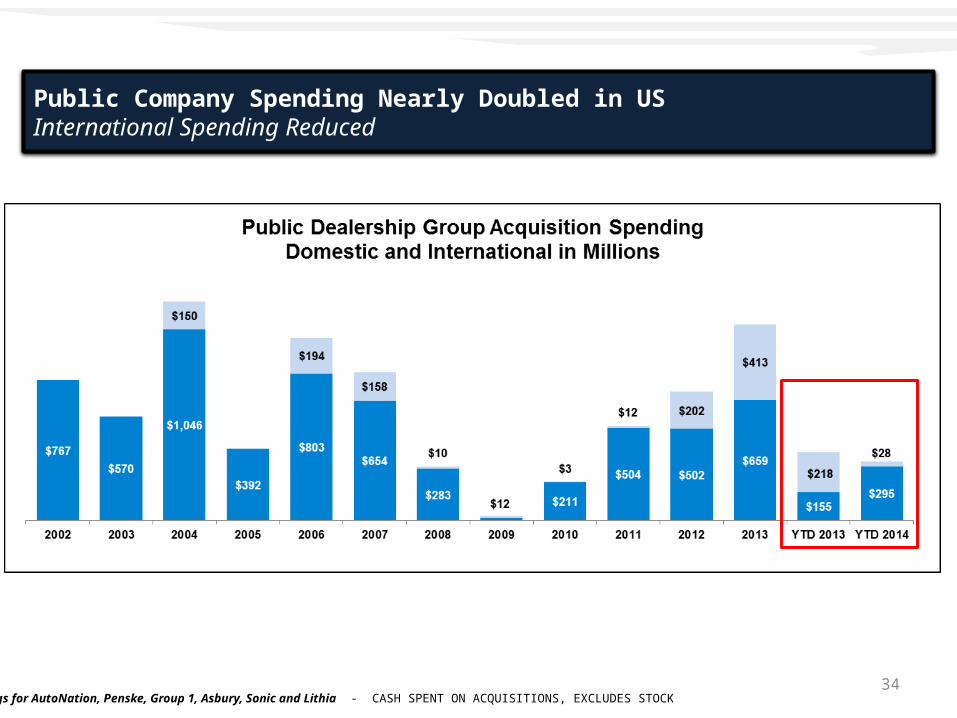
Public Company Spending Nearly Doubled in USInternational Spending Reduced
SEC Filings for AutoNation, Penske, Group 1, Asbury, Sonic and Lithia - CASH SPENT ON ACQUISITIONS, EXCLUDES STOCK
Source: Public SEC Filings
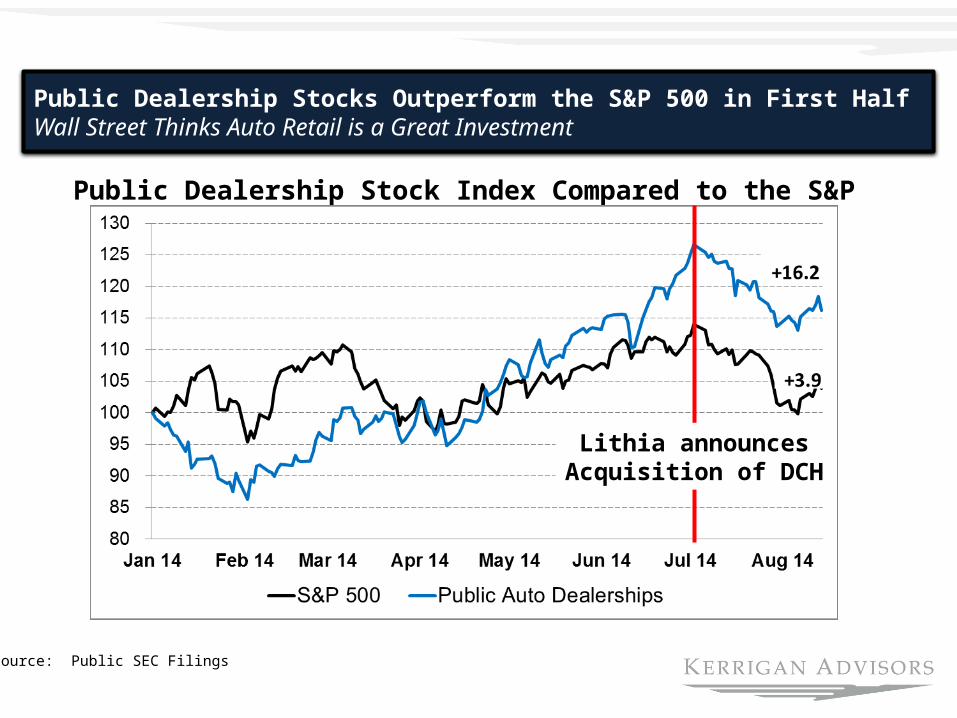
Public Dealership Stock Index Compared to the S&P
Public Dealership Stocks Outperform the S&P 500 in First HalfWall Street Thinks Auto Retail is a Great Investment
Lithia announcesAcquisition of DCH
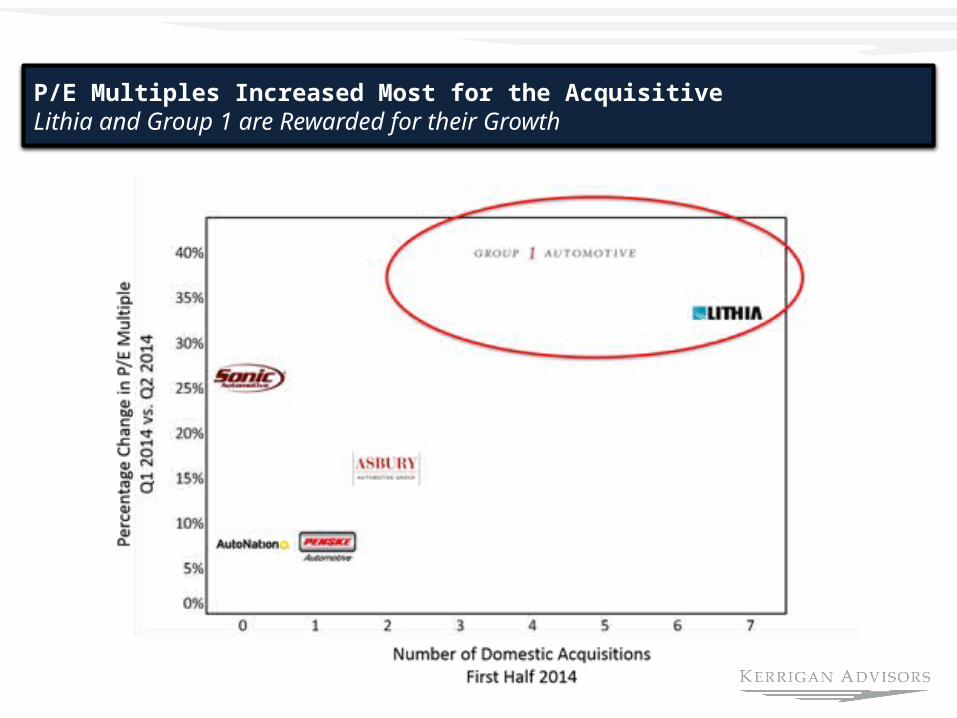
P/E Multiples Increased Most for the AcquisitiveLithia and Group 1 are Rewarded for their Growth
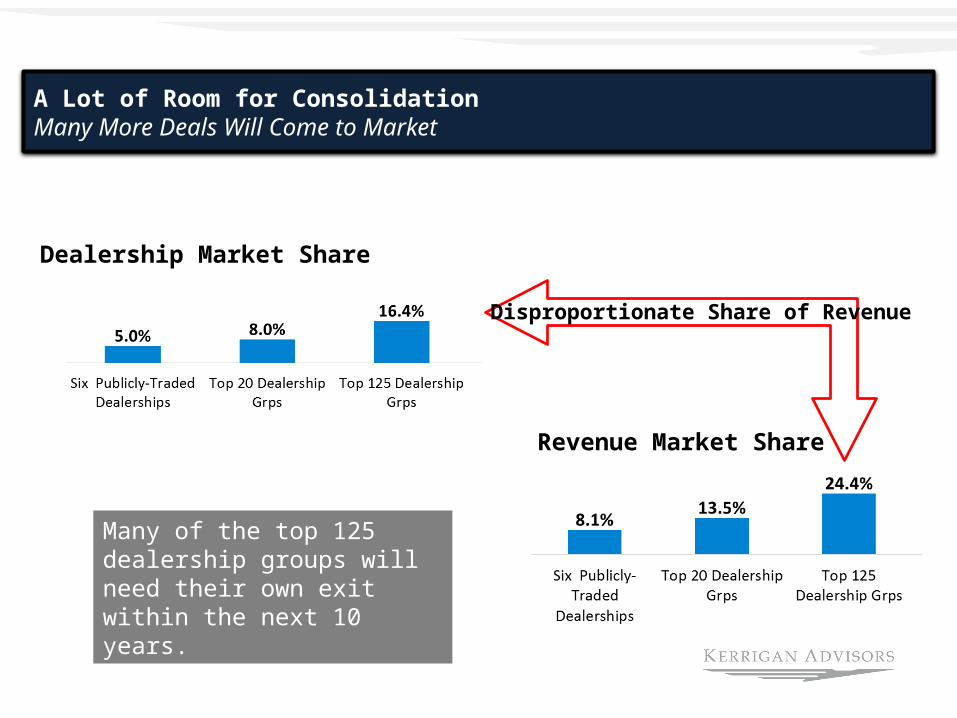
A Lot of Room for ConsolidationMany More Deals Will Come to Market
Revenue Market Share
Dealership Market Share
Many of the top 125 dealership groups will need their own exit within the next 10 years.
Disproportionate Share of Revenue

38
Sellers Are Enjoying a Great Winning Streak
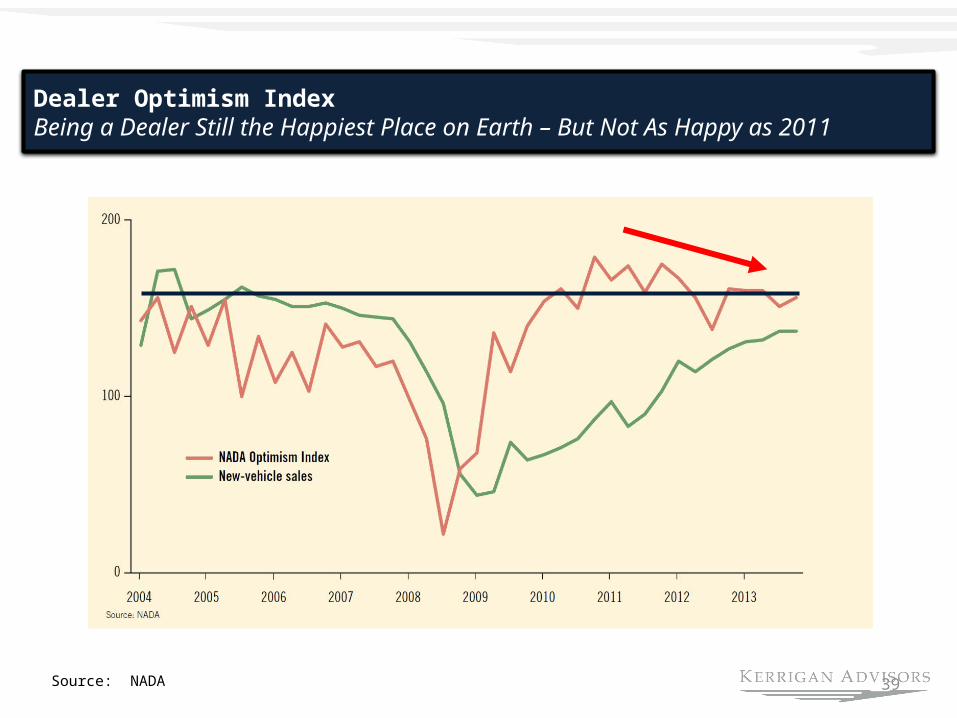
Dealer Optimism IndexBeing a Dealer Still the Happiest Place on Earth – But Not As Happy as 2011
39Source: NADA
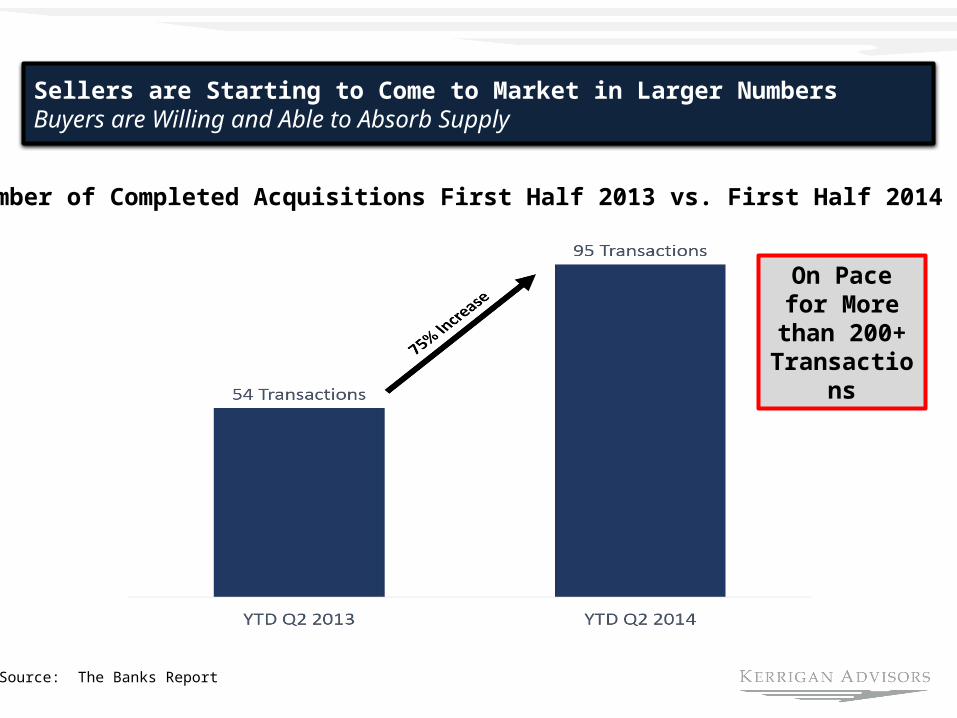
Sellers are Starting to Come to Market in Larger NumbersBuyers are Willing and Able to Absorb Supply
Source: The Banks Report
Number of Completed Acquisitions First Half 2013 vs. First Half 2014
On Pace for More than
200+ Transactions

41
17 Million Peak Sales Means Slower Growth Sales Rebound Near Completion
Source: Automotive News and Kerrigan Advisors Analysis/Estimates
42
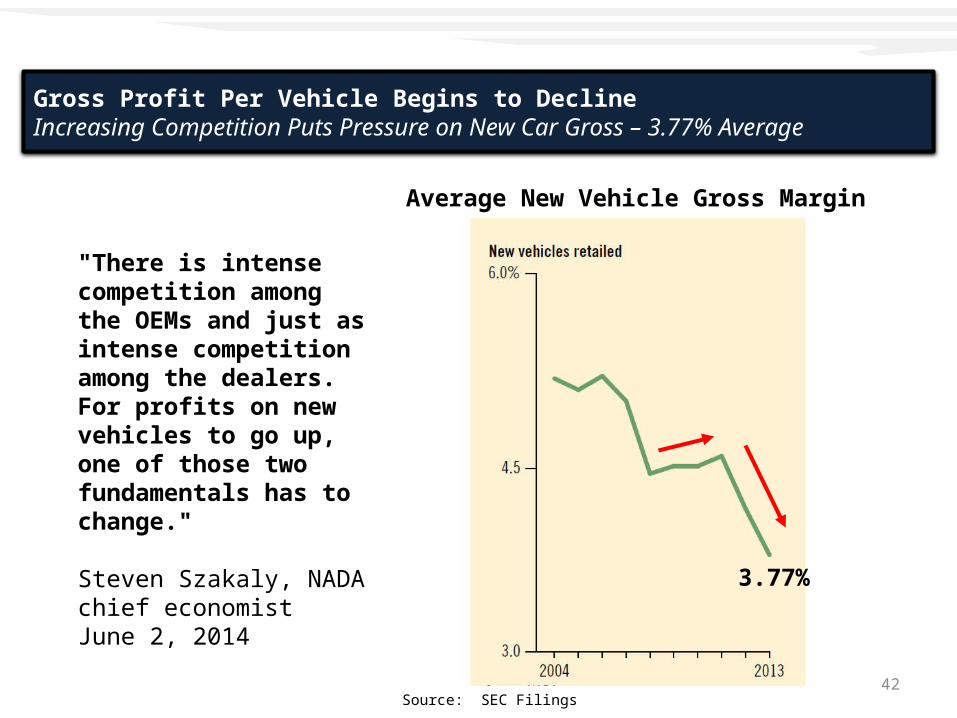
Gross Profit Per Vehicle Begins to DeclineIncreasing Competition Puts Pressure on New Car Gross – 3.77% Average
Source: SEC Filings
Average New Vehicle Gross Margin
"There is intense competition among the OEMs and just as intense competition among the dealers. For profits on new vehicles to go up, one of those two fundamentals has to change."
Steven Szakaly, NADA chief economist June 2, 2014 3.77%
43
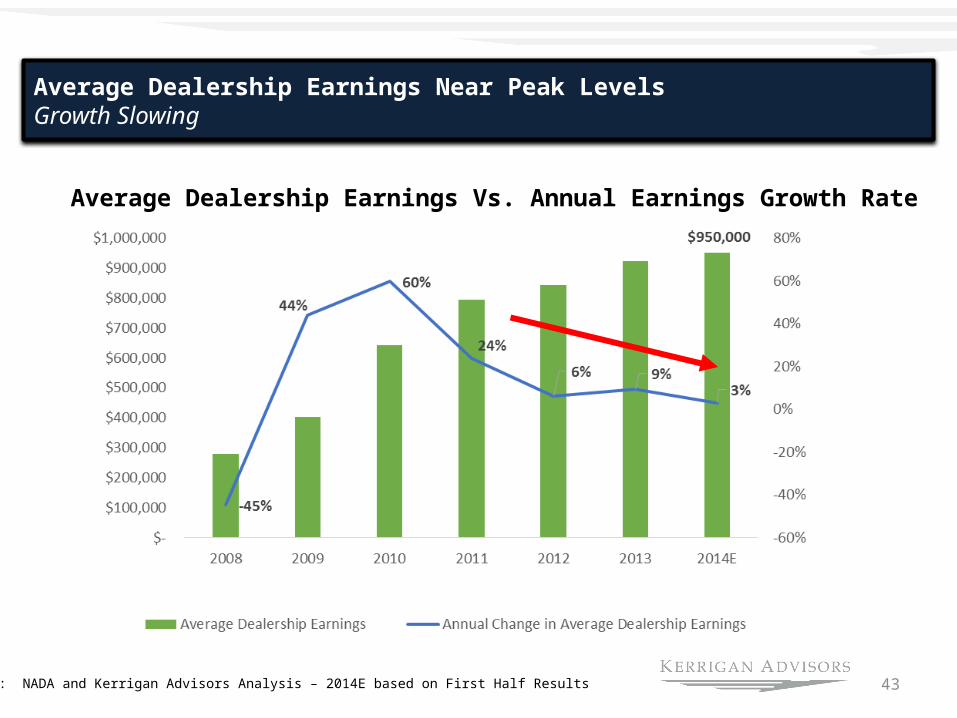
Average Dealership Earnings Near Peak LevelsGrowth Slowing
Source: NADA and Kerrigan Advisors Analysis – 2014E based on First Half Results
Average Dealership Earnings Vs. Annual Earnings Growth Rate
44
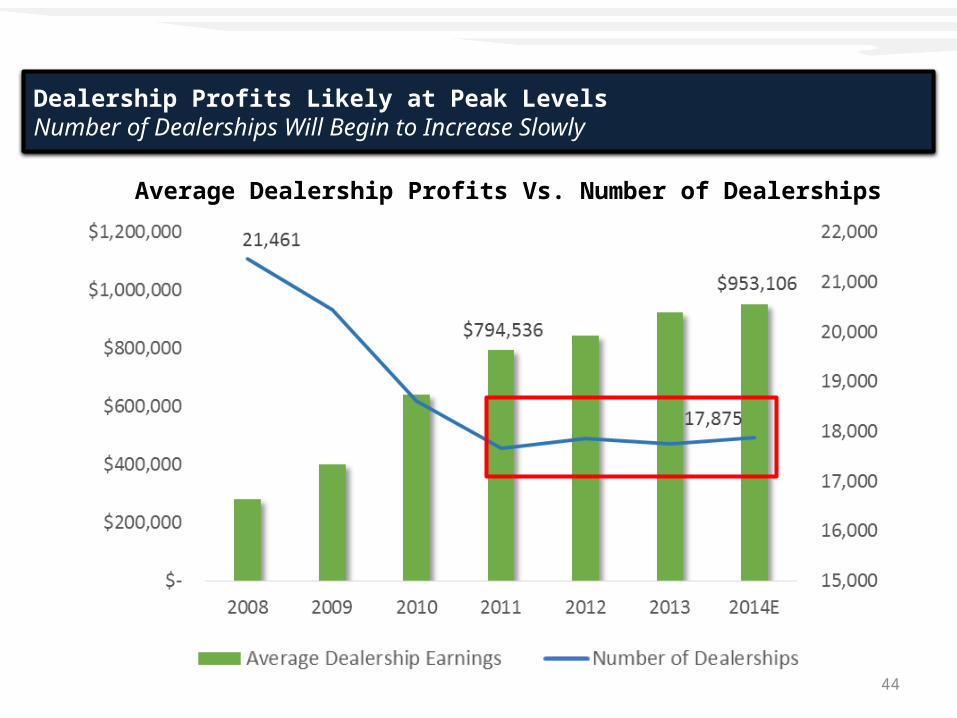
Dealership Profits Likely at Peak LevelsNumber of Dealerships Will Begin to Increase Slowly
Average Dealership Profits Vs. Number of Dealerships
45
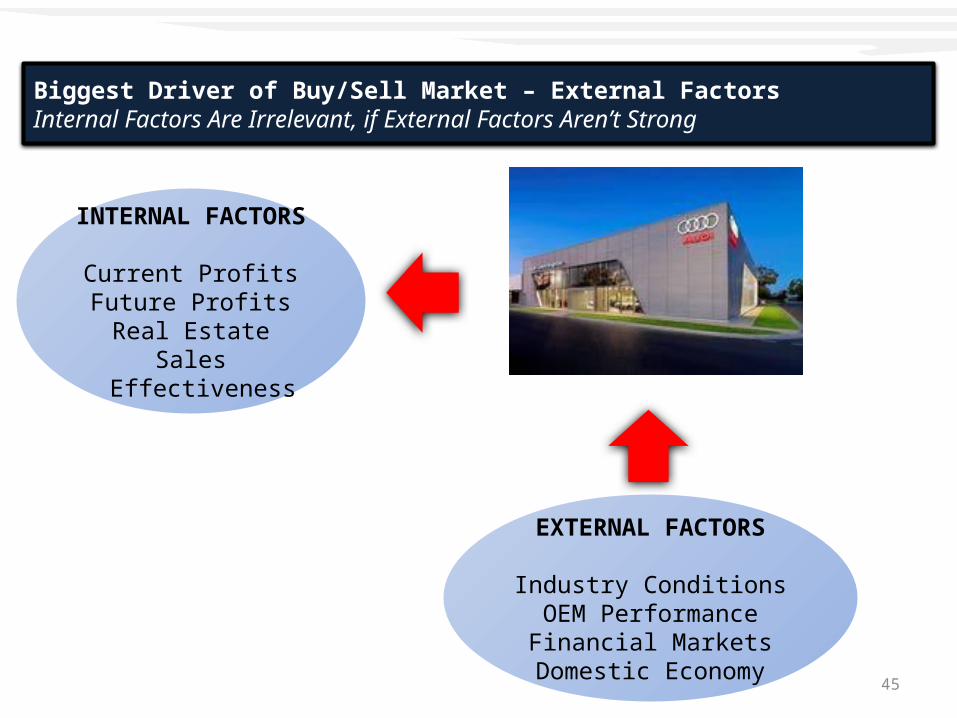
EXTERNAL FACTORS
Industry ConditionsOEM PerformanceFinancial Markets
Domestic Economy
INTERNAL FACTORS
Current ProfitsFuture Profits
Real EstateSales Effectiveness
Source: NADA
Biggest Driver of Buy/Sell Market – External FactorsInternal Factors Are Irrelevant, if External Factors Aren’t Strong

46
47
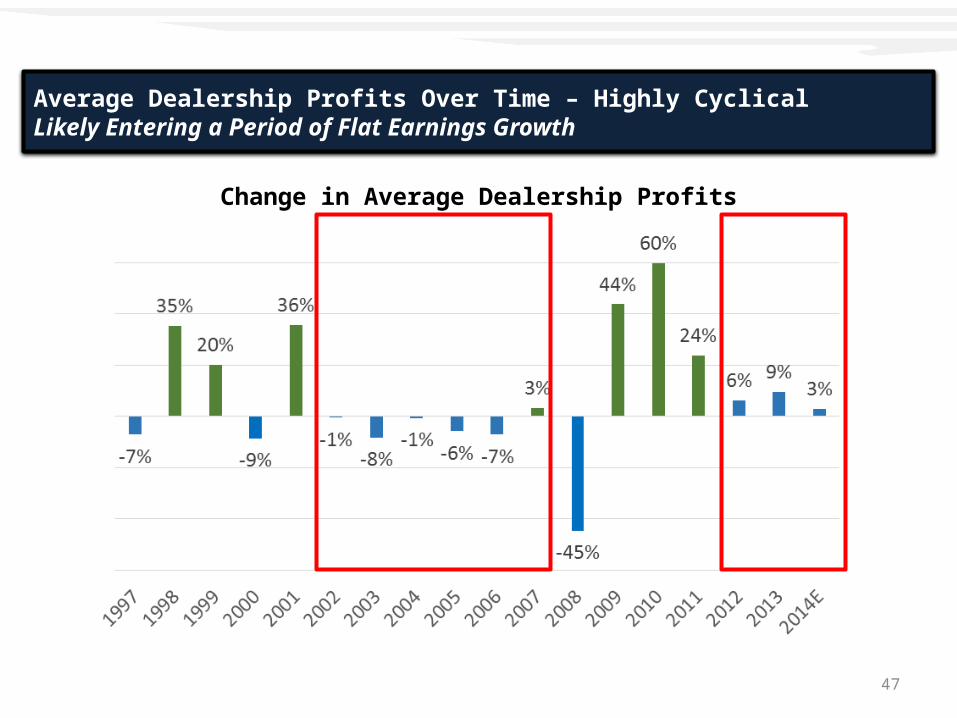
Average Dealership Profits Over Time – Highly CyclicalLikely Entering a Period of Flat Earnings Growth
Change in Average Dealership Profits
48
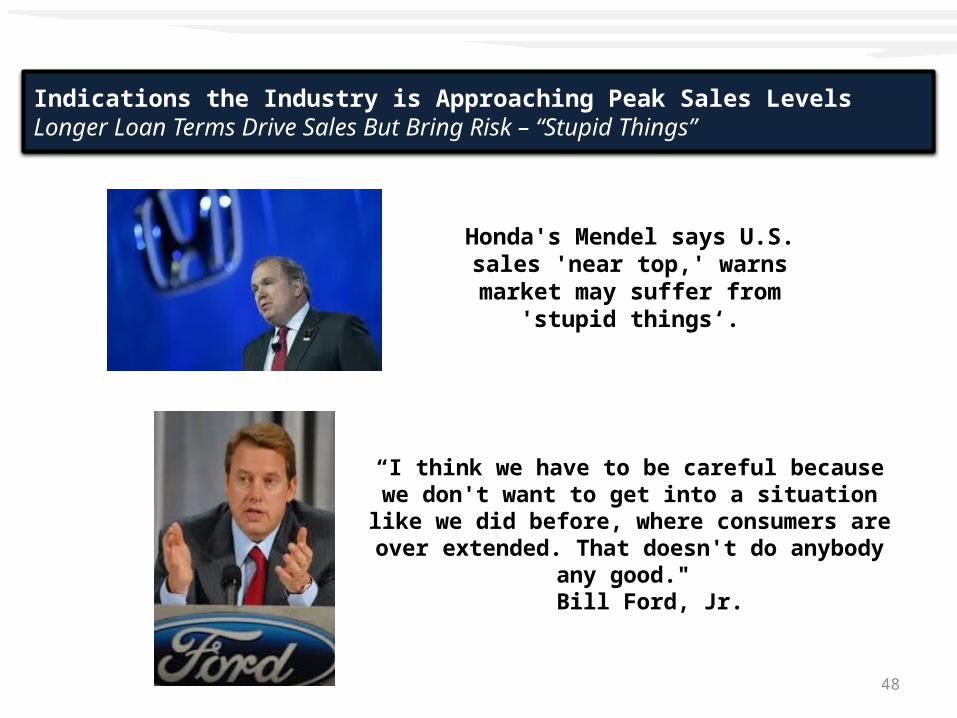
Honda's Mendel says U.S. sales 'near top,' warns market may suffer
from 'stupid things‘.
“I think we have to be careful because we don't want to get into a situation like we did before, where consumers are over extended.
That doesn't do anybody any good." Bill Ford, Jr.
Indications the Industry is Approaching Peak Sales LevelsLonger Loan Terms Drive Sales But Bring Risk – “Stupid Things”
49
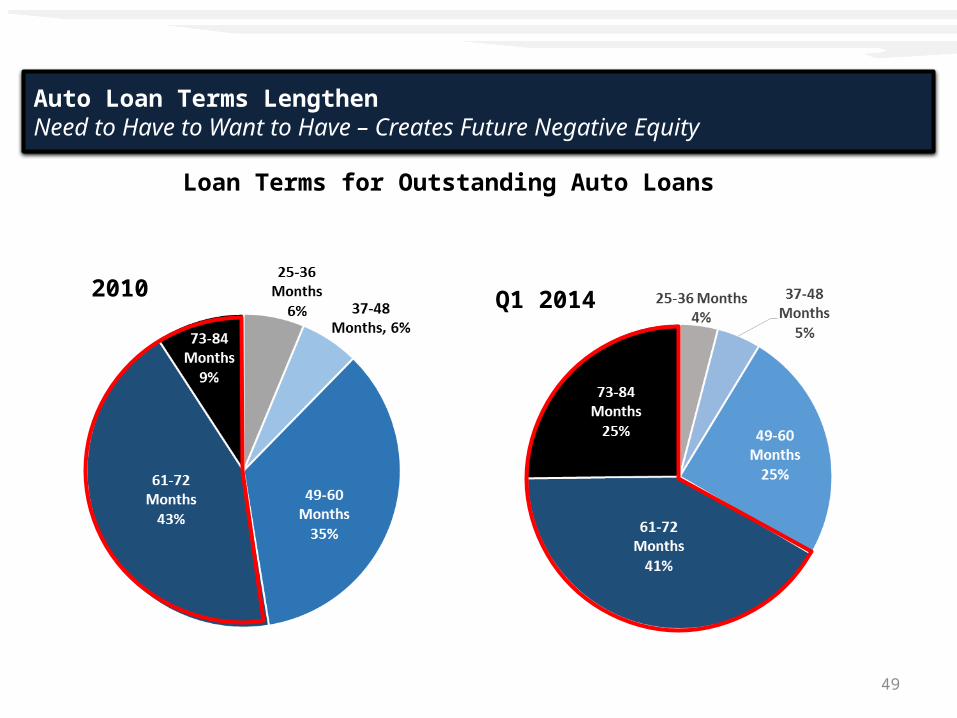
Auto Loan Terms LengthenNeed to Have to Want to Have – Creates Future Negative Equity
Loan Terms for Outstanding Auto Loans
2010 Q1 2014
50
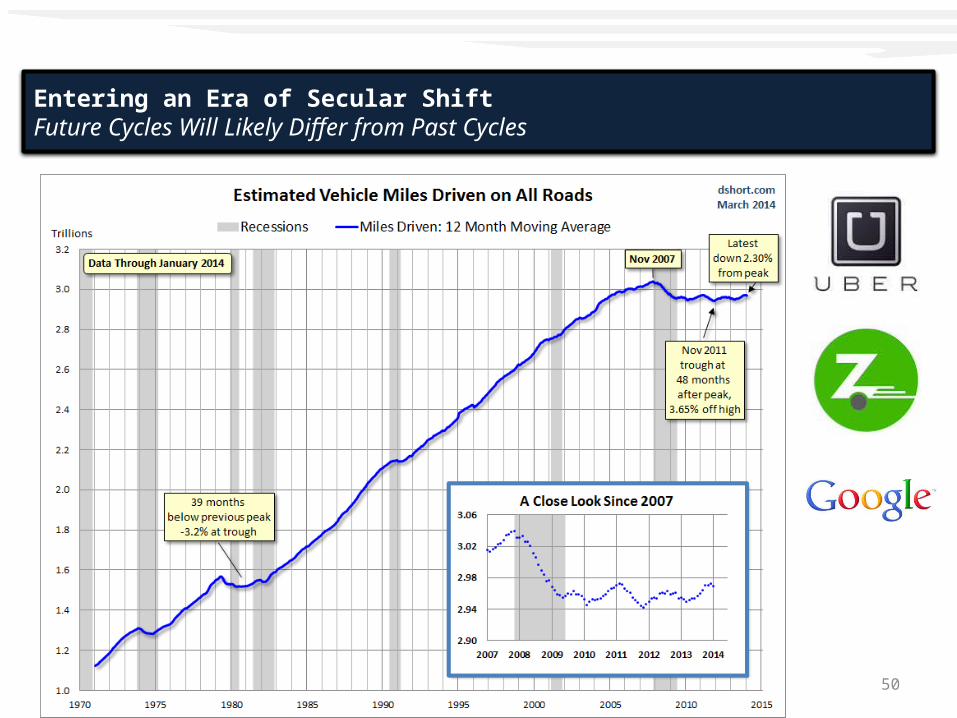
Entering an Era of Secular Shift Future Cycles Will Likely Differ from Past Cycles
51
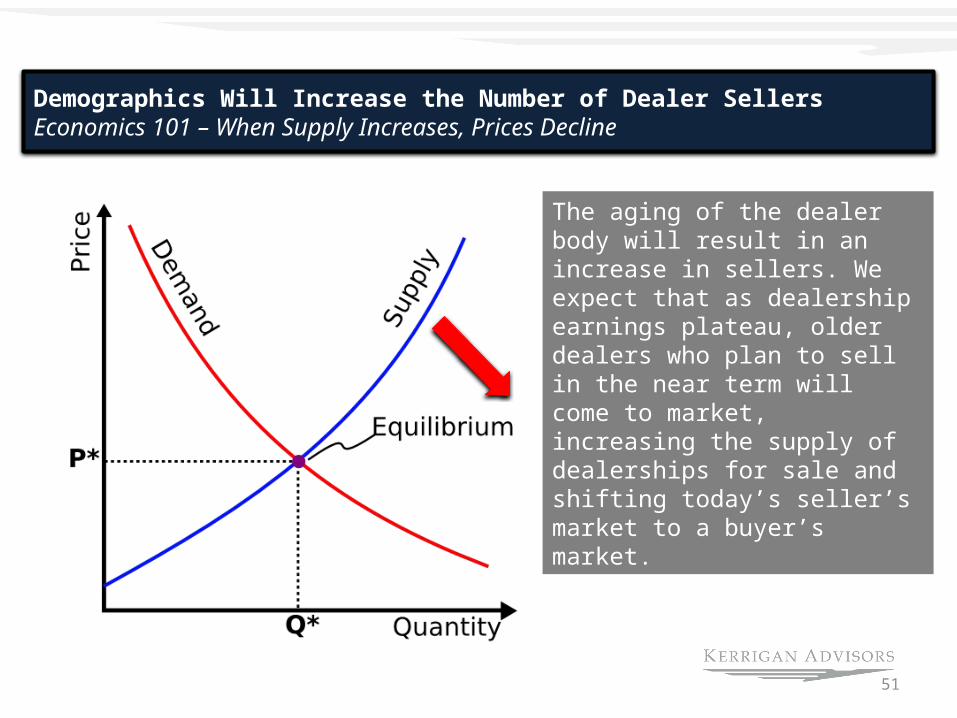
Demographics Will Increase the Number of Dealer SellersEconomics 101 – When Supply Increases, Prices Decline
The aging of the dealer body will result in an increase in sellers. We expect that as dealership earnings plateau, older dealers who plan to sell in the near term will come to market, increasing the supply of dealerships for sale and shifting today’s seller’s market to a buyer’s market.

52
Q & A
53
Erin Kerrigan, Founder and Managing Director
Today’s Auto Retail MarketBuyers’ Considerations Sellers’ ConsiderationsThe Presidio Blue Sky MultiplesValuation MethodsQ&A
Today’s Auto Retail MarketBuyers’ Considerations Sellers’ ConsiderationsThe Presidio Blue Sky MultiplesValuation MethodsQ&A
Erin Kerrigan is Managing Director of Kerrigan Advisors, which she founded in 2014. Kerrigan Advisors is a national dealership brokerage firm focused on providing a limited number of sellers, a high level of client service. Prior to founding Kerrigan Advisors, Ms. Kerrigan headed Presidio Automotive. During her time at Presidio, the firm represented dealer clients in numerous multi-million dollar transactions. Prior to Presidio, she was a Senior Vice President at AutoStar, a subsidiary of iStar Financial (NYSE: SFI), where she led transaction origination. Ms. Kerrigan is a recognized industry expert on dealership valuation, real estate and buy/sells, and is a frequent speaker at leading auto retail events and conferences, including NADA (#1 speaker in 2012), American Institute of Certified Public Accountants (AICPA), National Association of Dealer Counsel (NADC), Auto Team America’s Buy/Sell Summit and DrivingSales’ President’s Club. She has also been a key note speaker for events hosted by American Honda Motor Company, Audi of America, Bank of America, US Trust, Ohio Automobile Dealer Association, Colorado Automobile Dealer Association, and SunTrust Bank. Ms. Kerrigan has also led webinars for NADA and Automotive News and she writes a monthly column for Dealer Magazine.
Ms. Kerrigan graduated from Northwestern University with a BA in History and International Studies and the UCLA Anderson School of Business with an MBA. She is a member of Northwestern University’s Council of One Hundred, a select group of leading female professional alumnae who mentor current students and alumnae. She lives in Newport Beach, California with her husband and three children.
Erin KerriganFounder and Managing PartnerKerrigan Advisors [email protected] (office)949-439-6768 (cell)