Embed Size (px)
Citation preview
Profits
1
THE GOAL
Making our factory financially viable
Ron McFarland, Tokyo, Japan [email protected]
2
Cash
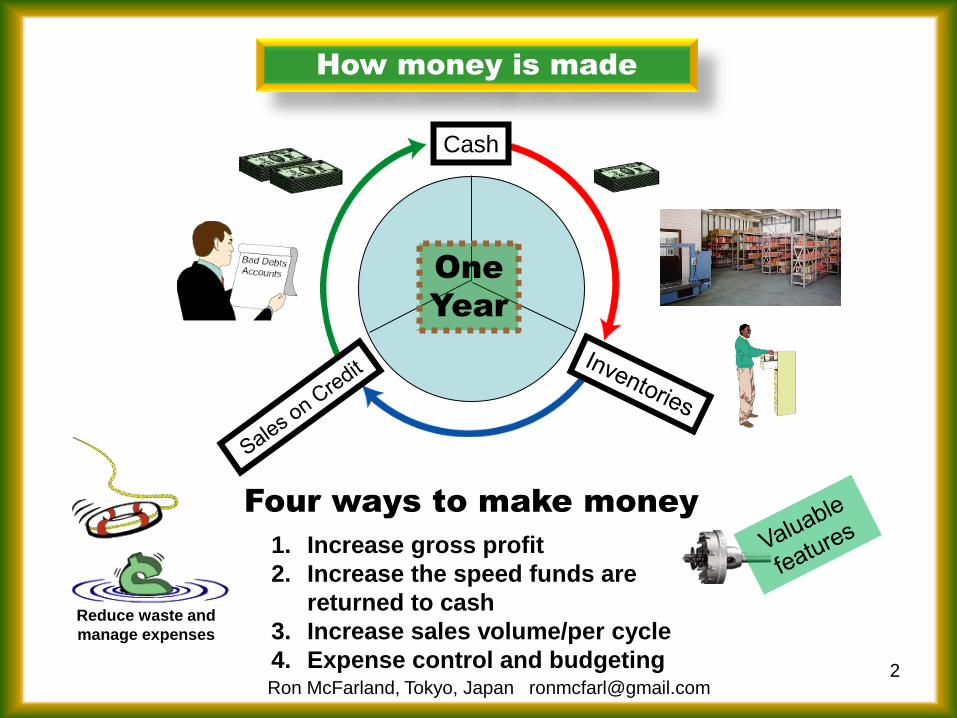
Four ways to make money
Reduce waste and
manage expenses
One
Year
1. Increase gross profit
2. Increase the speed funds are
returned to cash
3. Increase sales volume/per cycle
4. Expense control and budgeting
How money is made
Ron McFarland, Tokyo, Japan [email protected]
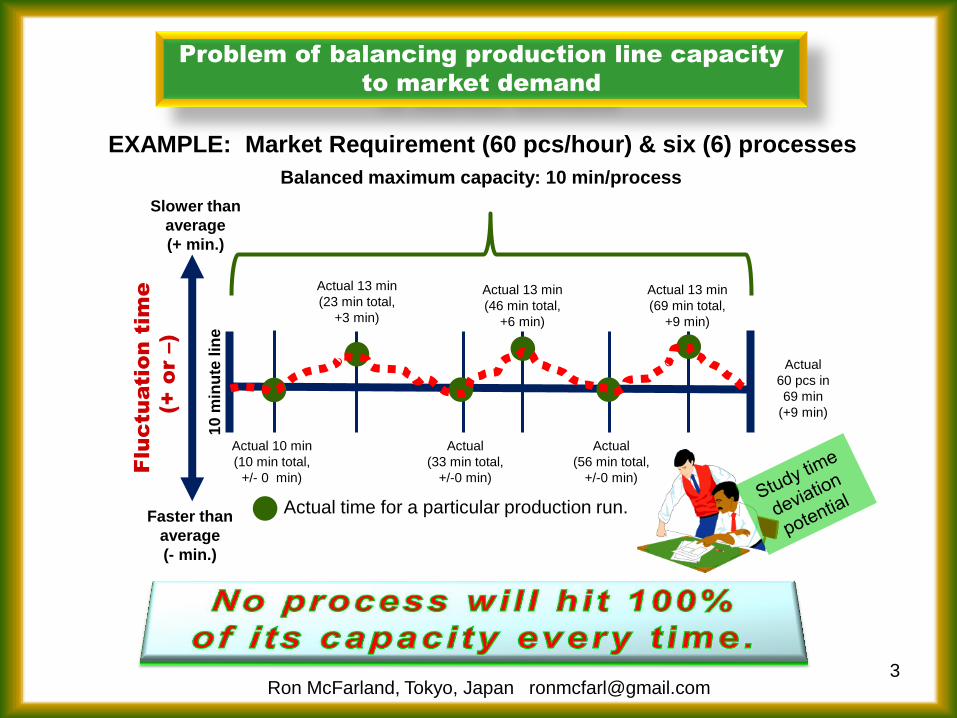
Problem of balancing production line capacity
to market demand
EXAMPLE: Market Requirement (60 pcs/hour) & six (6) processes F
lu
ctu
atio
n tim
e
(+ o
r –)
Faster than
average
(- min.)
Slower than
average
(+ min.)
Balanced maximum capacity: 10 min/process
Actual time for a particular production run.
Actual
(33 min total,
+/-0 min)
Actual 13 min
(46 min total,
+6 min)
Actual
(56 min total,
+/-0 min)
Actual 13 min
(69 min total,
+9 min)
Actual 10 min
(10 min total,
+/- 0 min)
Actual 13 min
(23 min total,
+3 min)
Actual
60 pcs in
69 min
(+9 min)
3
10
min
ute
lin
e
Ron McFarland, Tokyo, Japan [email protected]
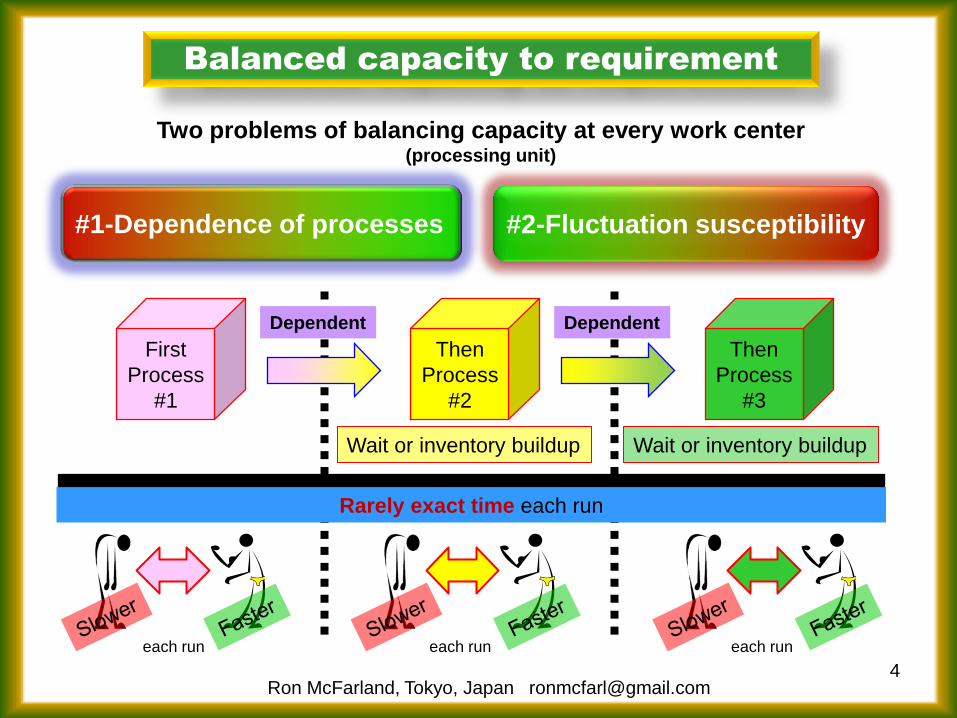
Balanced capacity to requirement
Two problems of balancing capacity at every work center (processing unit)
#1-Dependence of processes #2-Fluctuation susceptibility
Then
Process
#2
Then
Process
#3
First
Process
#1
Wait or inventory buildup Wait or inventory buildup
4
each run each run each run
Rarely exact time each run
Dependent Dependent
Ron McFarland, Tokyo, Japan [email protected]
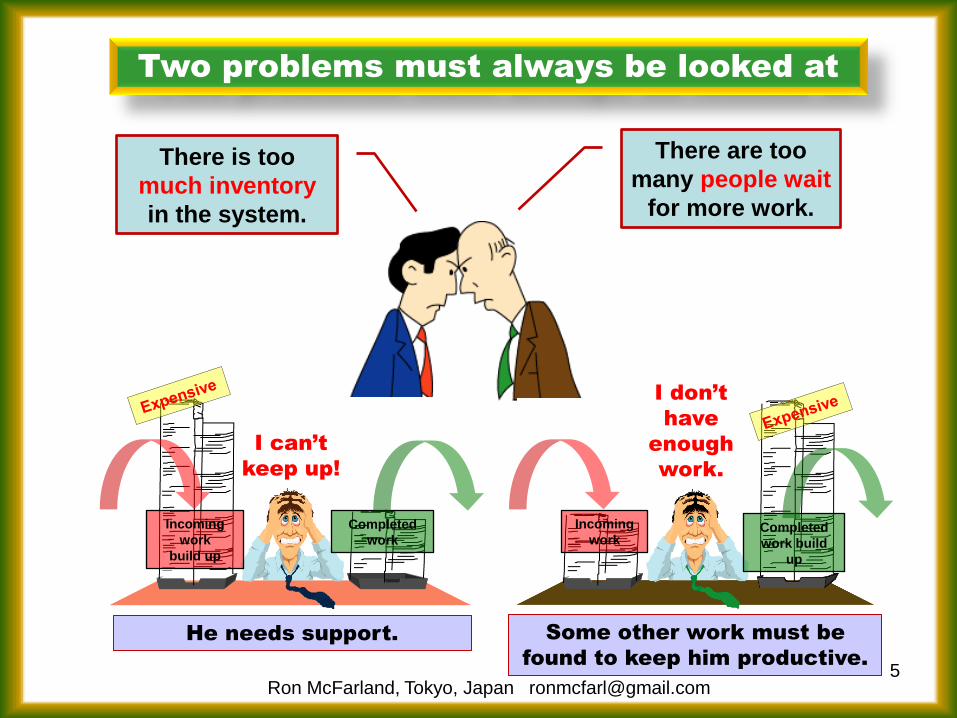
Two problems must always be looked at
5
There are too
many people wait
for more work.
There is too
much inventory
in the system.
Completed
work
Incoming
work
build up
I can’t
keep up!
Completed
work build
up
Incoming
work
I don’t
have
enough
work.
Some other work must be
found to keep him productive.
He needs support.
Ron McFarland, Tokyo, Japan [email protected]
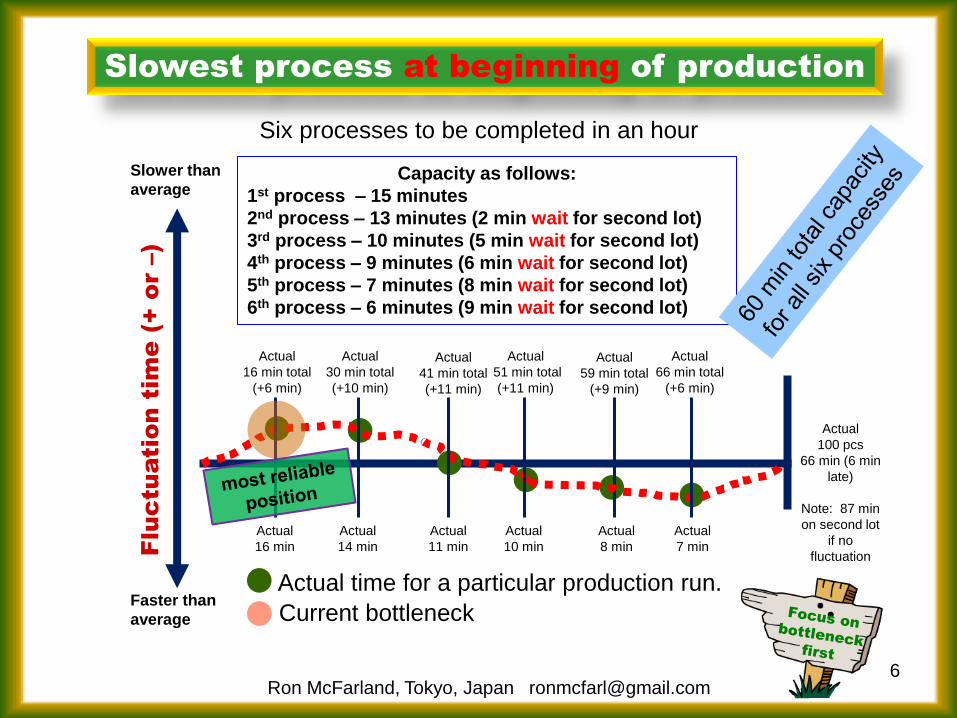
Slowest process at beginning of production
Six processes to be completed in an hour F
lu
ctu
atio
n tim
e (+ o
r –)
Faster than
average
Slower than
average Capacity as follows:
1st process – 15 minutes
2nd process – 13 minutes (2 min wait for second lot)
3rd process – 10 minutes (5 min wait for second lot)
4th process – 9 minutes (6 min wait for second lot)
5th process – 7 minutes (8 min wait for second lot)
6th process – 6 minutes (9 min wait for second lot)
Actual time for a particular production run.
Actual
41 min total
(+11 min)
Actual
51 min total
(+11 min)
Actual
59 min total
(+9 min)
Actual
66 min total
(+6 min)
Actual
14 min
Actual
30 min total
(+10 min)
Actual
100 pcs
66 min (6 min
late)
Note: 87 min
on second lot
if no
fluctuation
Actual
11 min
Actual
8 min
Actual
7 min
Actual
10 min
Actual
16 min total
(+6 min)
Actual
16 min
6
Current bottleneck
Ron McFarland, Tokyo, Japan [email protected]
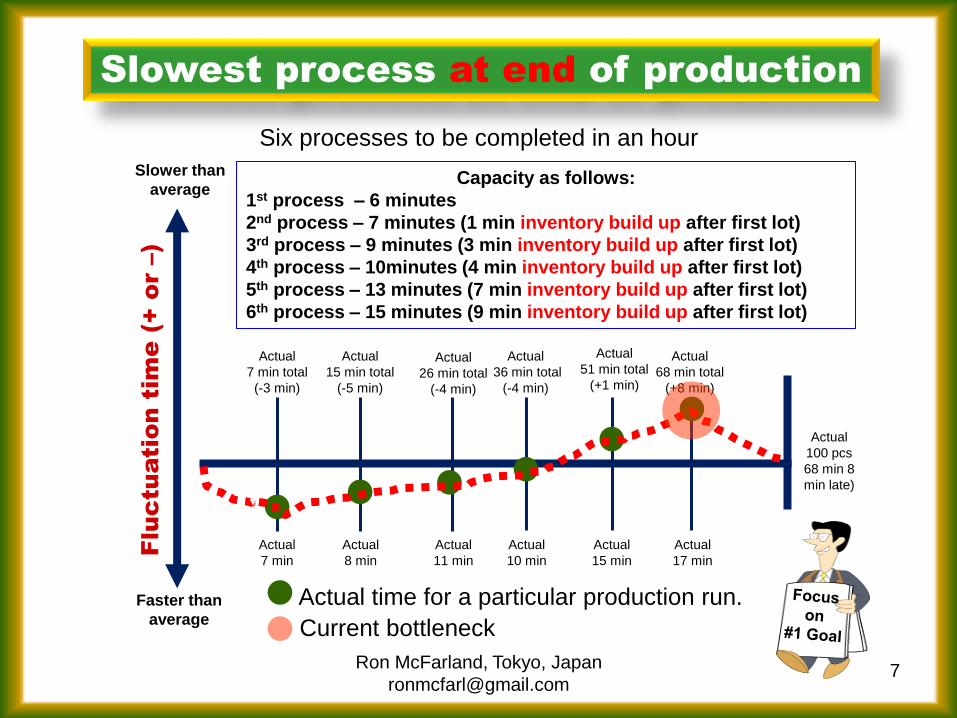
Slowest process at end of production
Six processes to be completed in an hour
Actual time for a particular production run.
Actual
26 min total
(-4 min)
Actual
36 min total
(-4 min)
Actual
51 min total
(+1 min)
Actual
68 min total
(+8 min)
Actual
8 min
Actual
15 min total
(-5 min)
Actual
100 pcs
68 min 8
min late)
Actual
11 min
Actual
15 min
Actual
17 min
Actual
10 min
Actual
7 min total
(-3 min)
Actual
7 min
Capacity as follows:
1st process – 6 minutes
2nd process – 7 minutes (1 min inventory build up after first lot)
3rd process – 9 minutes (3 min inventory build up after first lot)
4th process – 10minutes (4 min inventory build up after first lot)
5th process – 13 minutes (7 min inventory build up after first lot)
6th process – 15 minutes (9 min inventory build up after first lot)
Flu
ctu
atio
n tim
e (+ o
r –)
Faster than
average
Slower than
average
7
Current bottleneck
Ron McFarland, Tokyo, Japan
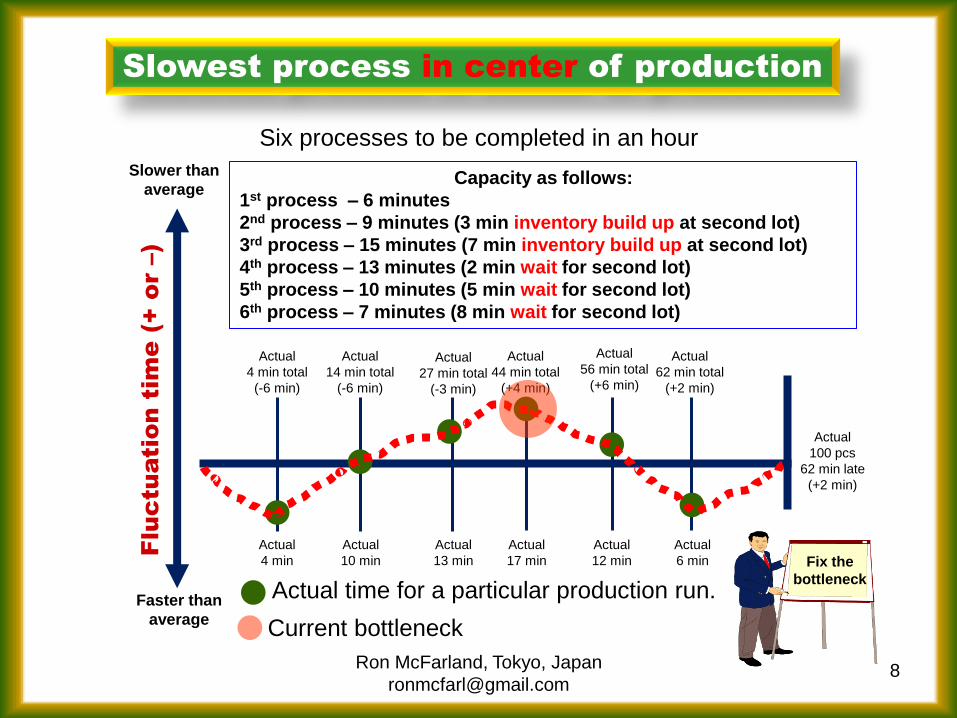
Slowest process in center of production
Six processes to be completed in an hour
Actual time for a particular production run.
Actual
27 min total
(-3 min)
Actual
44 min total
(+4 min)
Actual
56 min total
(+6 min)
Actual
62 min total
(+2 min)
Actual
10 min
Actual
14 min total
(-6 min)
Actual
100 pcs
62 min late
(+2 min)
Actual
13 min
Actual
12 min
Actual
6 min
Actual
17 min
Actual
4 min total
(-6 min)
Actual
4 min
Capacity as follows:
1st process – 6 minutes
2nd process – 9 minutes (3 min inventory build up at second lot)
3rd process – 15 minutes (7 min inventory build up at second lot)
4th process – 13 minutes (2 min wait for second lot)
5th process – 10 minutes (5 min wait for second lot)
6th process – 7 minutes (8 min wait for second lot)
Flu
ctu
atio
n tim
e (+ o
r –)
Faster than
average
Slower than
average
8
Current bottleneck
Fix the
bottleneck
Ron McFarland, Tokyo, Japan
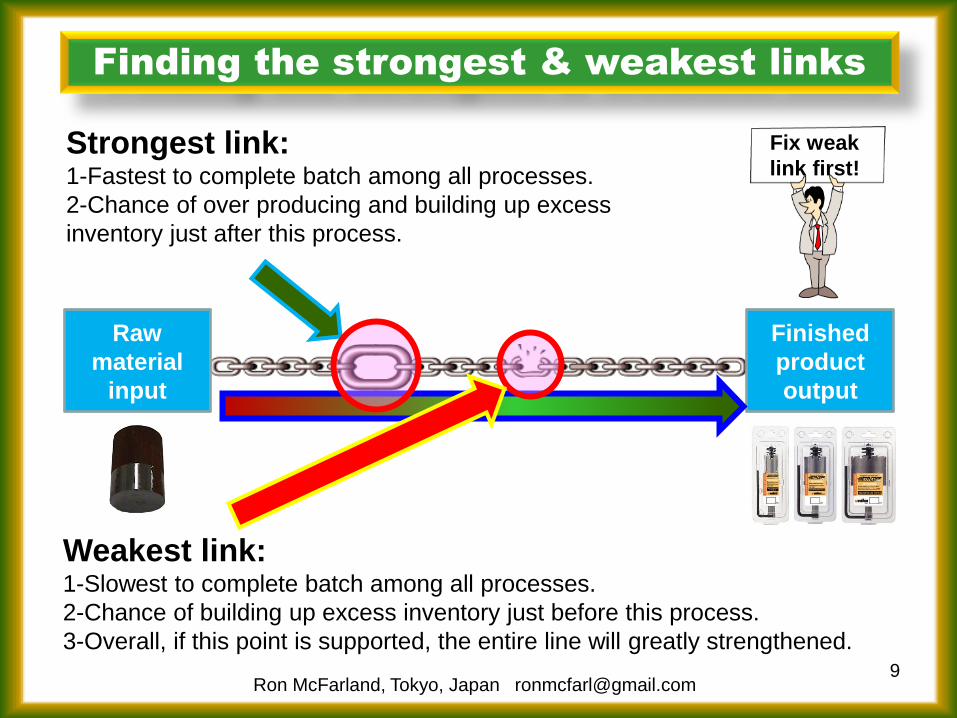
Finding the strongest & weakest links
9
Raw
material
input
Finished
product
output
Strongest link: 1-Fastest to complete batch among all processes.
2-Chance of over producing and building up excess
inventory just after this process.
Weakest link: 1-Slowest to complete batch among all processes.
2-Chance of building up excess inventory just before this process.
3-Overall, if this point is supported, the entire line will greatly strengthened.
Fix weak
link first!
Ron McFarland, Tokyo, Japan [email protected]
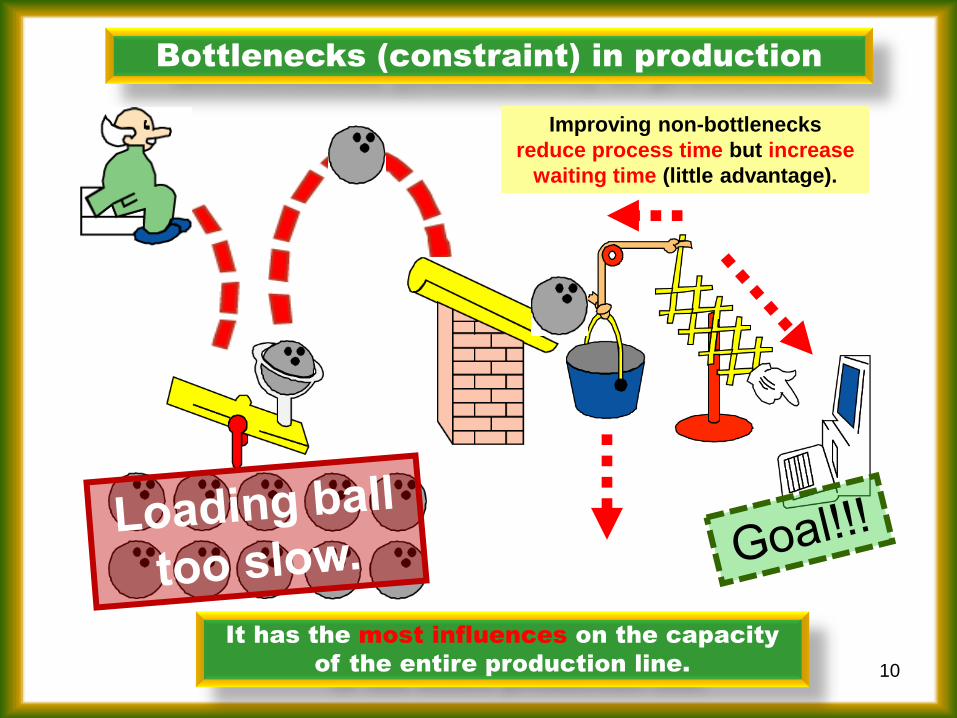
It has the most influences on the capacity
of the entire production line.
Bottlenecks (constraint) in production
10
Improving non-bottlenecks
reduce process time but increase
waiting time (little advantage).
11
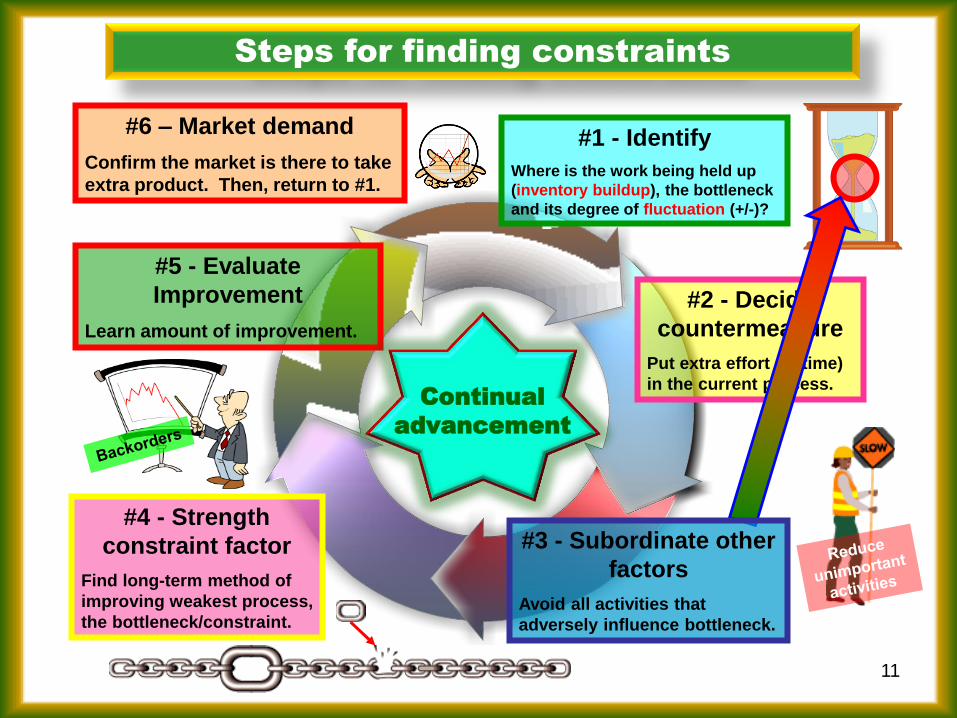
#4 - Strength
constraint factor
Find long-term method of
improving weakest process,
the bottleneck/constraint.
#2 - Decide
countermeasure
Put extra effort (uptime)
in the current process.
#5 - Evaluate
Improvement
Learn amount of improvement.
#1 - Identify
Where is the work being held up
(inventory buildup), the bottleneck
and its degree of fluctuation (+/-)?
Steps for finding constraints
Continual
advancement
#6 – Market demand
Confirm the market is there to take
extra product. Then, return to #1.
#3 - Subordinate other
factors
Avoid all activities that
adversely influence bottleneck.
12
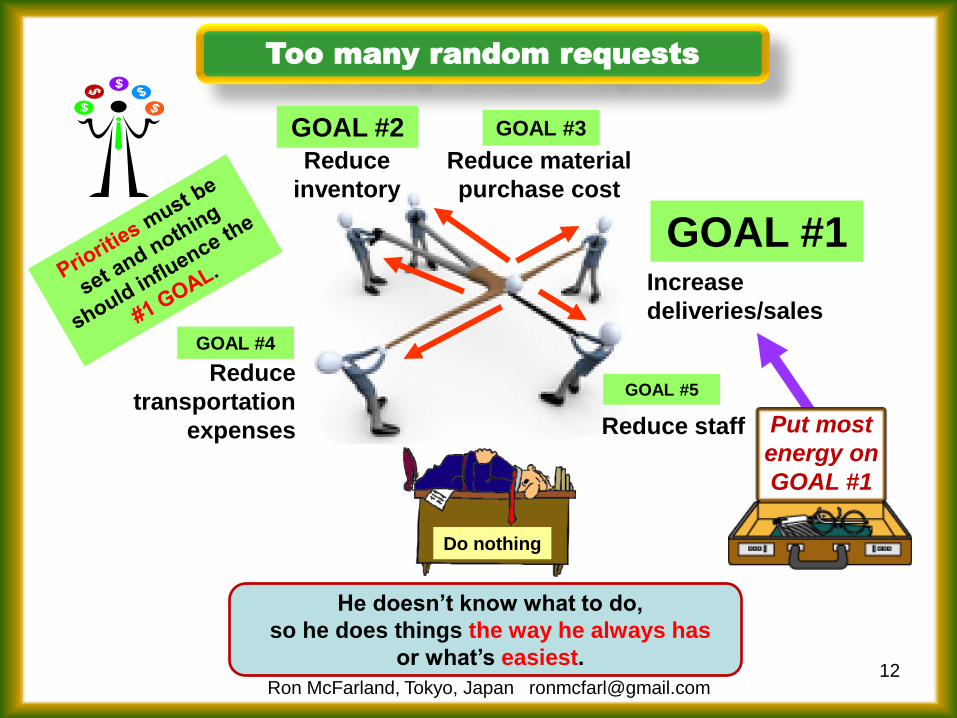
Increase
deliveries/sales
Reduce material
purchase cost
Reduce staff
Reduce
transportation
expenses
Reduce
inventory
Too many random requests
He doesn’t know what to do,
so he does things the way he always has
or what’s easiest.
GOAL #1
GOAL #2 GOAL #3
GOAL #4
GOAL #5
Do nothing
Put most
energy on
GOAL #1
Ron McFarland, Tokyo, Japan [email protected]
Reduce
inventory
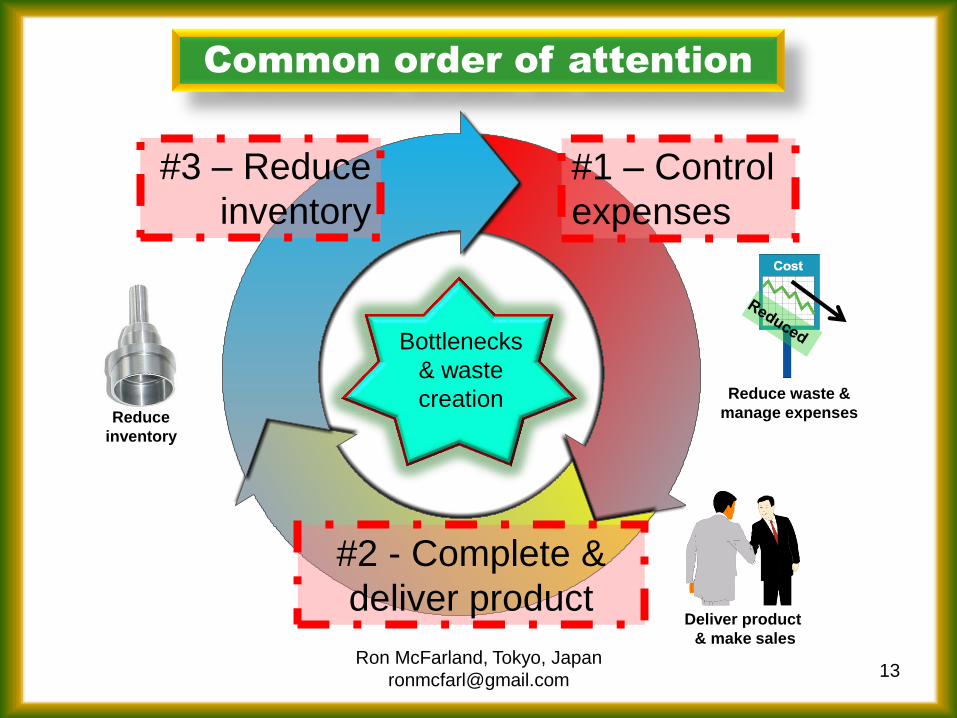
Common order of attention
#1 – Control
expenses
#3 – Reduce
inventory
#2 - Complete &
deliver product
Bottlenecks
& waste
creation
13
Reduce waste &
manage expenses
Deliver product
& make sales
Ron McFarland, Tokyo, Japan
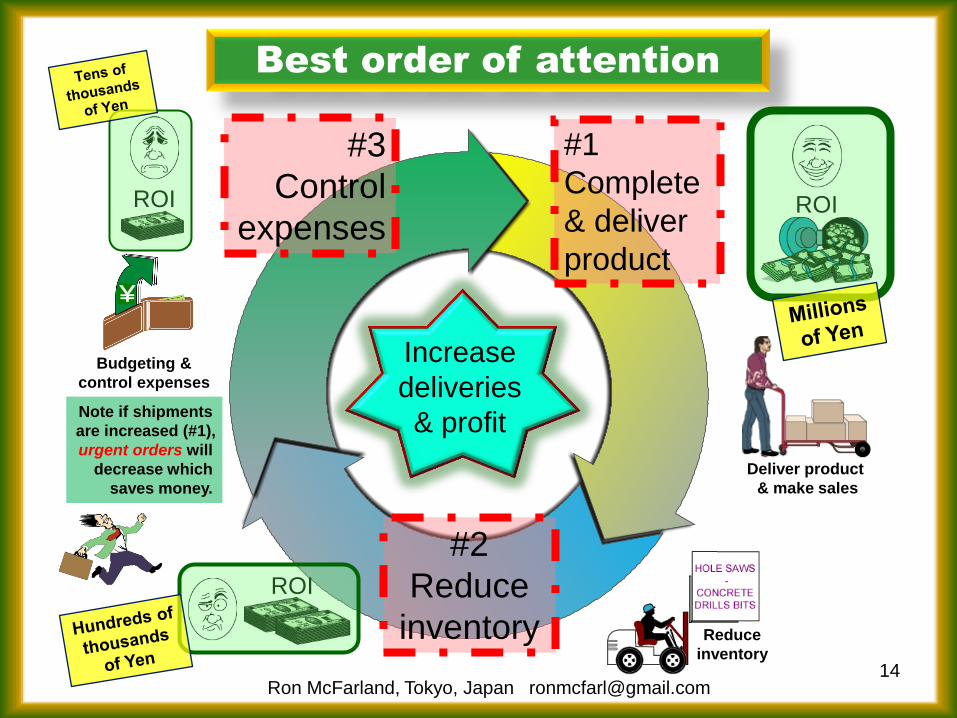
Best order of attention
#3
Control
expenses
#2
Reduce
inventory
#1
Complete
& deliver
product
ROI
ROI
ROI
14
Increase
deliveries
& profit
Deliver product
& make sales
Reduce
inventory
¥
Budgeting &
control expenses
Note if shipments
are increased (#1),
urgent orders will
decrease which
saves money.
Ron McFarland, Tokyo, Japan [email protected]
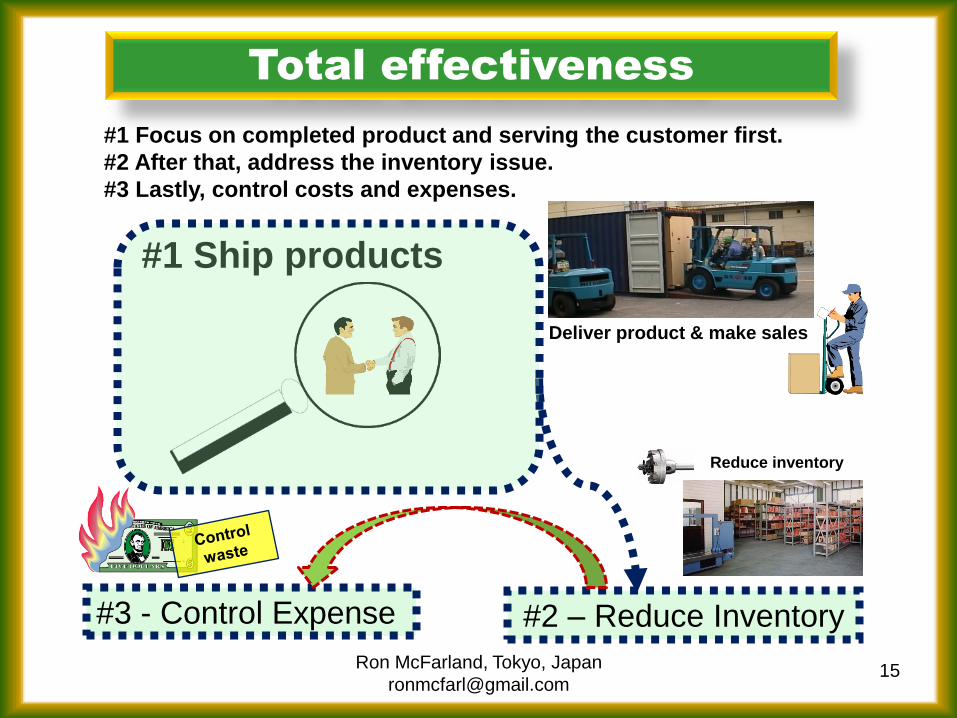
Total effectiveness
#3 - Control Expense #2 – Reduce Inventory
#1 Ship products
15
Deliver product & make sales
Reduce inventory
#1 Focus on completed product and serving the customer first.
#2 After that, address the inventory issue.
#3 Lastly, control costs and expenses.
Ron McFarland, Tokyo, Japan

Greatest challenge
16
Our #1 goal is to
control expenses!
Our #1 goal is to
increase deliveries,
and sales!
¥
Finance
Marketing
PROBLEM:
Finance sees the value through good profit margins.
Marketing sees the value through satisfied customers.
Ron McFarland, Tokyo, Japan
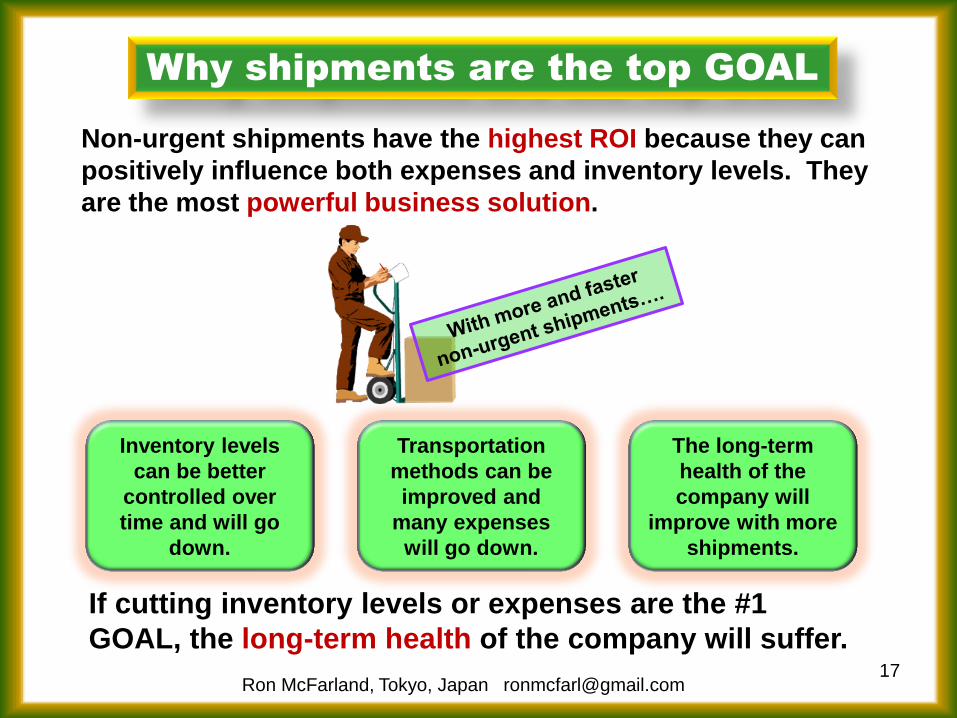
Non-urgent shipments have the highest ROI because they can
positively influence both expenses and inventory levels. They
are the most powerful business solution.
17
Why shipments are the top GOAL
Transportation
methods can be
improved and
many expenses
will go down.
The long-term
health of the
company will
improve with more
shipments.
Inventory levels
can be better
controlled over
time and will go
down.
If cutting inventory levels or expenses are the #1
GOAL, the long-term health of the company will suffer.
Ron McFarland, Tokyo, Japan [email protected]
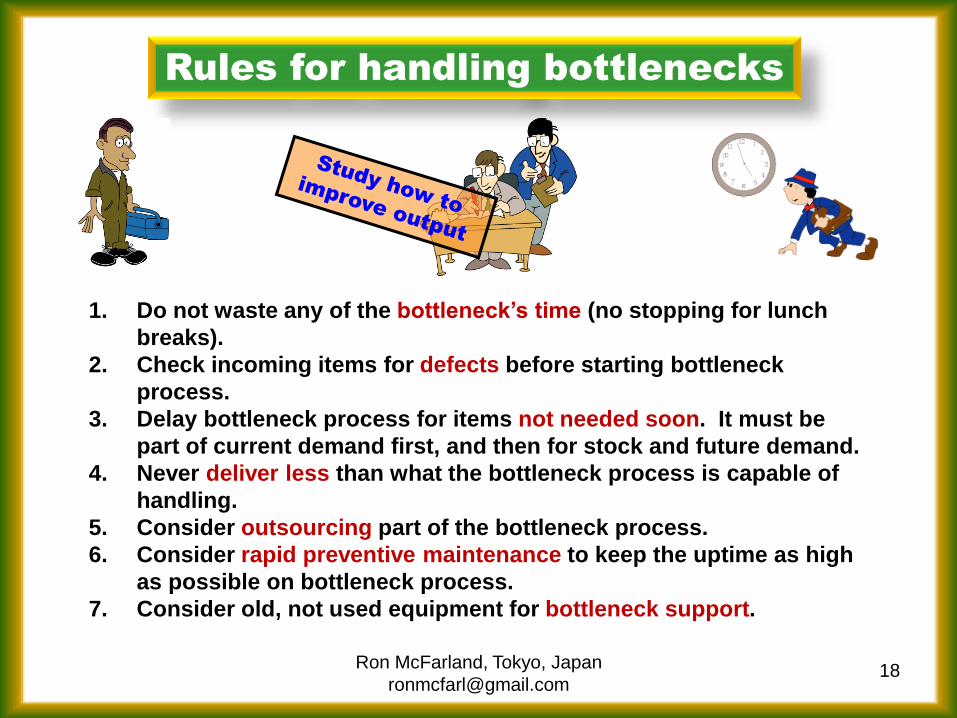
Rules for handling bottlenecks
18
1. Do not waste any of the bottleneck’s time (no stopping for lunch
breaks).
2. Check incoming items for defects before starting bottleneck
process.
3. Delay bottleneck process for items not needed soon. It must be
part of current demand first, and then for stock and future demand.
4. Never deliver less than what the bottleneck process is capable of
handling.
5. Consider outsourcing part of the bottleneck process.
6. Consider rapid preventive maintenance to keep the uptime as high
as possible on bottleneck process.
7. Consider old, not used equipment for bottleneck support.
Ron McFarland, Tokyo, Japan
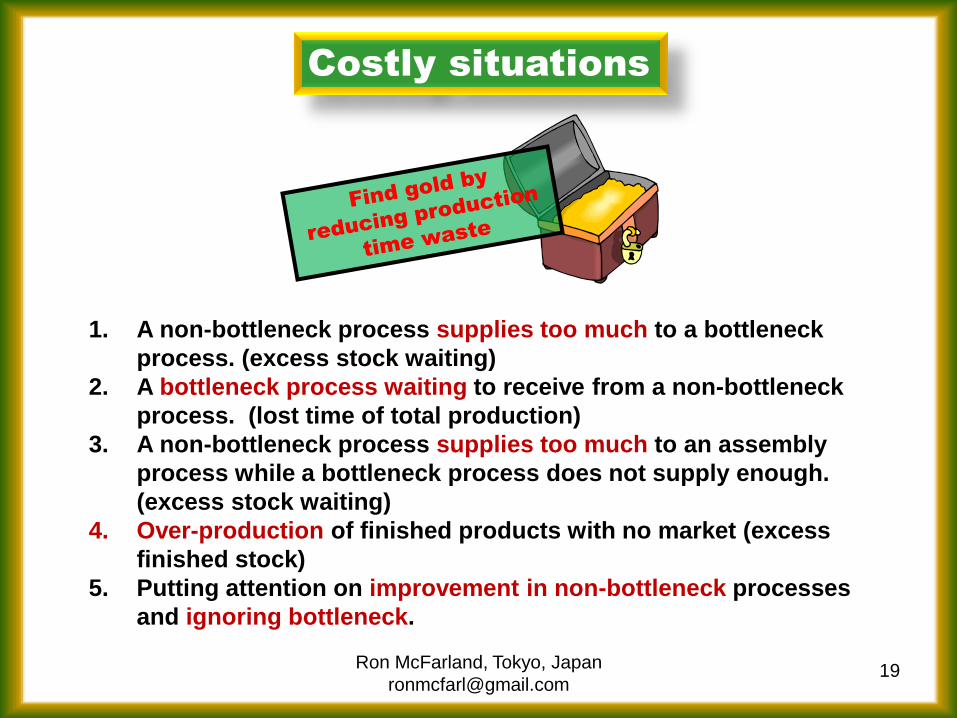
Costly situations
19
1. A non-bottleneck process supplies too much to a bottleneck
process. (excess stock waiting)
2. A bottleneck process waiting to receive from a non-bottleneck
process. (lost time of total production)
3. A non-bottleneck process supplies too much to an assembly
process while a bottleneck process does not supply enough.
(excess stock waiting)
4. Over-production of finished products with no market (excess
finished stock)
5. Putting attention on improvement in non-bottleneck processes
and ignoring bottleneck.
Ron McFarland, Tokyo, Japan
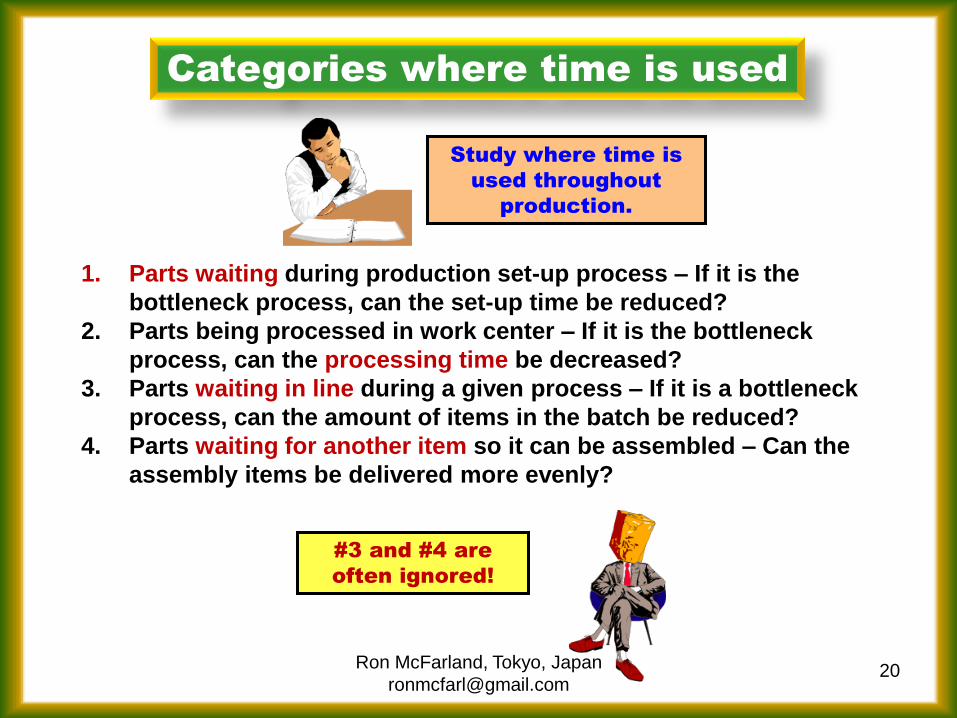
Categories where time is used
20
#3 and #4 are
often ignored!
Study where time is
used throughout
production.
1. Parts waiting during production set-up process – If it is the
bottleneck process, can the set-up time be reduced?
2. Parts being processed in work center – If it is the bottleneck
process, can the processing time be decreased?
3. Parts waiting in line during a given process – If it is a bottleneck
process, can the amount of items in the batch be reduced?
4. Parts waiting for another item so it can be assembled – Can the
assembly items be delivered more evenly?
Ron McFarland, Tokyo, Japan
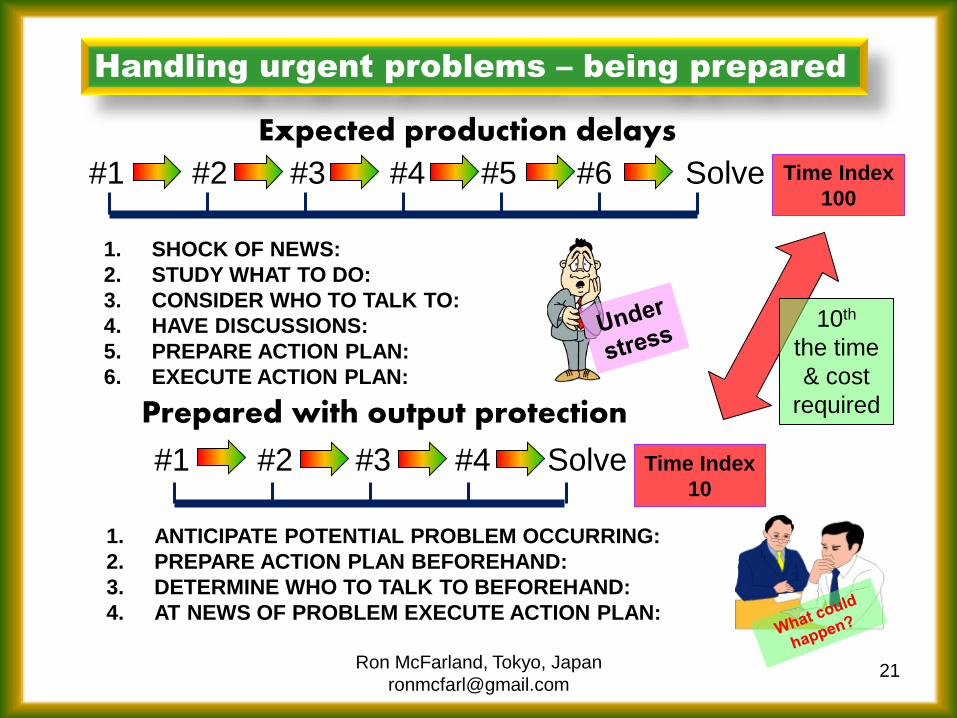
Handling urgent problems – being prepared
#2 #3 #4 #1
#2 #3 #4 #5 #6 Solve #1
Time Index
10
Time Index
100
21
Expected production delays
Prepared with output protection
Solve
1. ANTICIPATE POTENTIAL PROBLEM OCCURRING:
2. PREPARE ACTION PLAN BEFOREHAND:
3. DETERMINE WHO TO TALK TO BEFOREHAND:
4. AT NEWS OF PROBLEM EXECUTE ACTION PLAN:
1. SHOCK OF NEWS:
2. STUDY WHAT TO DO:
3. CONSIDER WHO TO TALK TO:
4. HAVE DISCUSSIONS:
5. PREPARE ACTION PLAN:
6. EXECUTE ACTION PLAN:
10th
the time
& cost
required
Ron McFarland, Tokyo, Japan
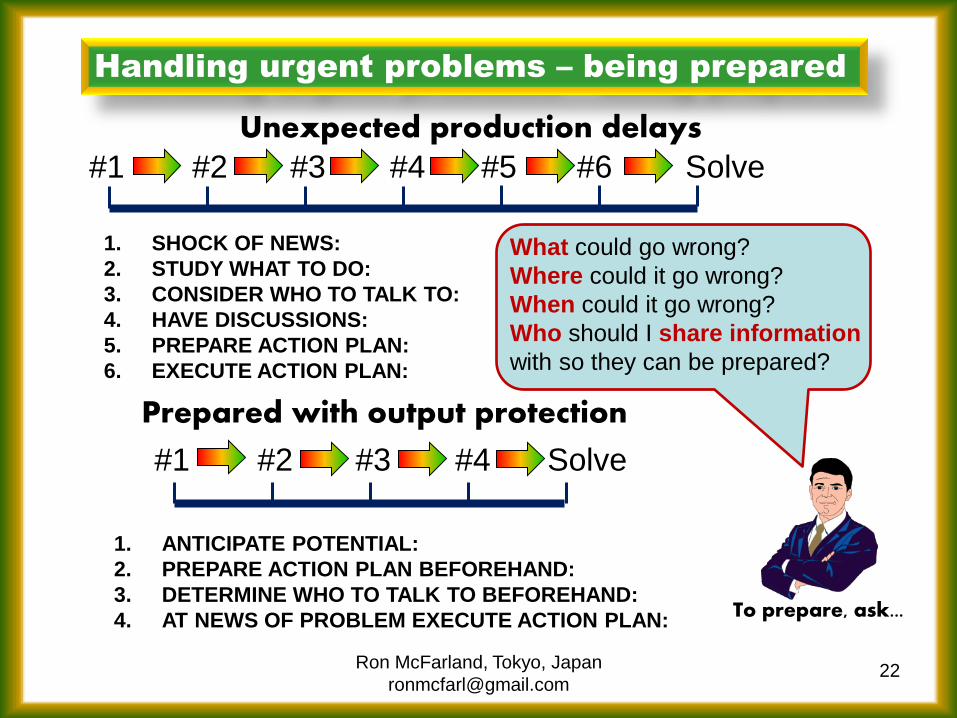
Handling urgent problems – being prepared
#2 #3 #4 #1
#2 #3 #4 #5 #6 Solve #1
22
Unexpected production delays
Prepared with output protection
Solve
1. ANTICIPATE POTENTIAL:
2. PREPARE ACTION PLAN BEFOREHAND:
3. DETERMINE WHO TO TALK TO BEFOREHAND:
4. AT NEWS OF PROBLEM EXECUTE ACTION PLAN:
1. SHOCK OF NEWS:
2. STUDY WHAT TO DO:
3. CONSIDER WHO TO TALK TO:
4. HAVE DISCUSSIONS:
5. PREPARE ACTION PLAN:
6. EXECUTE ACTION PLAN:
What could go wrong?
Where could it go wrong?
When could it go wrong?
Who should I share information
with so they can be prepared?
To prepare, ask...
Ron McFarland, Tokyo, Japan
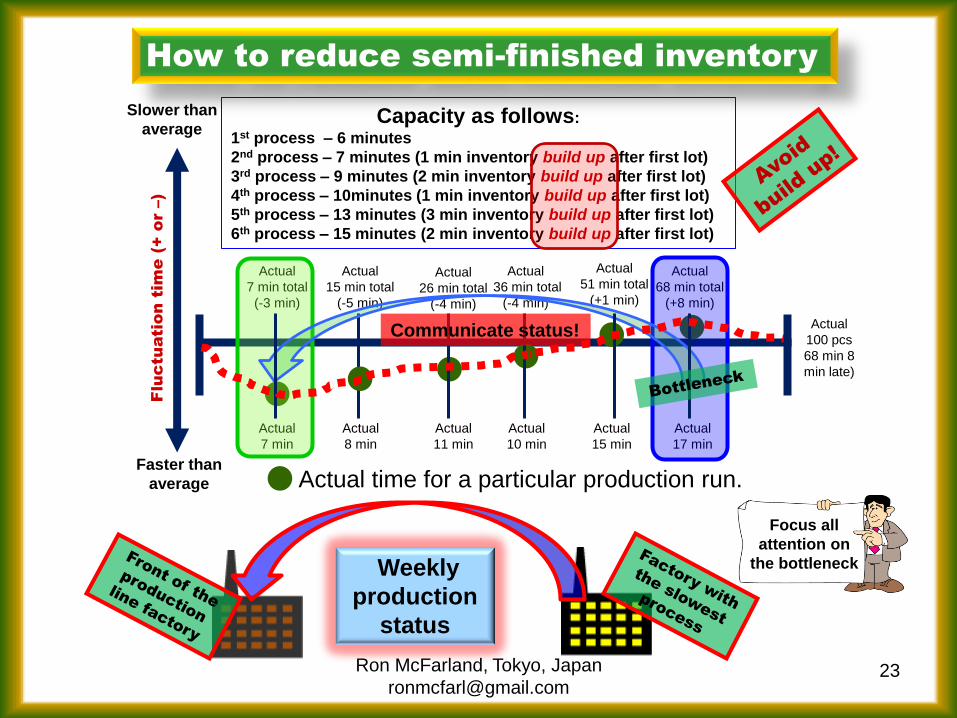
How to reduce semi-finished inventory
Actual time for a particular production run.
Actual
26 min total
(-4 min)
Actual
36 min total
(-4 min)
Actual
51 min total
(+1 min)
Actual
68 min total
(+8 min)
Actual
8 min
Actual
15 min total
(-5 min)
Actual
100 pcs
68 min 8
min late)
Actual
11 min
Actual
15 min
Actual
17 min
Actual
10 min
Actual
7 min total
(-3 min)
Actual
7 min
Capacity as follows:
1st process – 6 minutes
2nd process – 7 minutes (1 min inventory build up after first lot)
3rd process – 9 minutes (2 min inventory build up after first lot)
4th process – 10minutes (1 min inventory build up after first lot)
5th process – 13 minutes (3 min inventory build up after first lot)
6th process – 15 minutes (2 min inventory build up after first lot)
Flu
ctu
atio
n tim
e (+ o
r –)
Faster than
average
Slower than
average
23
Weekly
production
status
Communicate status!
Focus all
attention on
the bottleneck
Ron McFarland, Tokyo, Japan
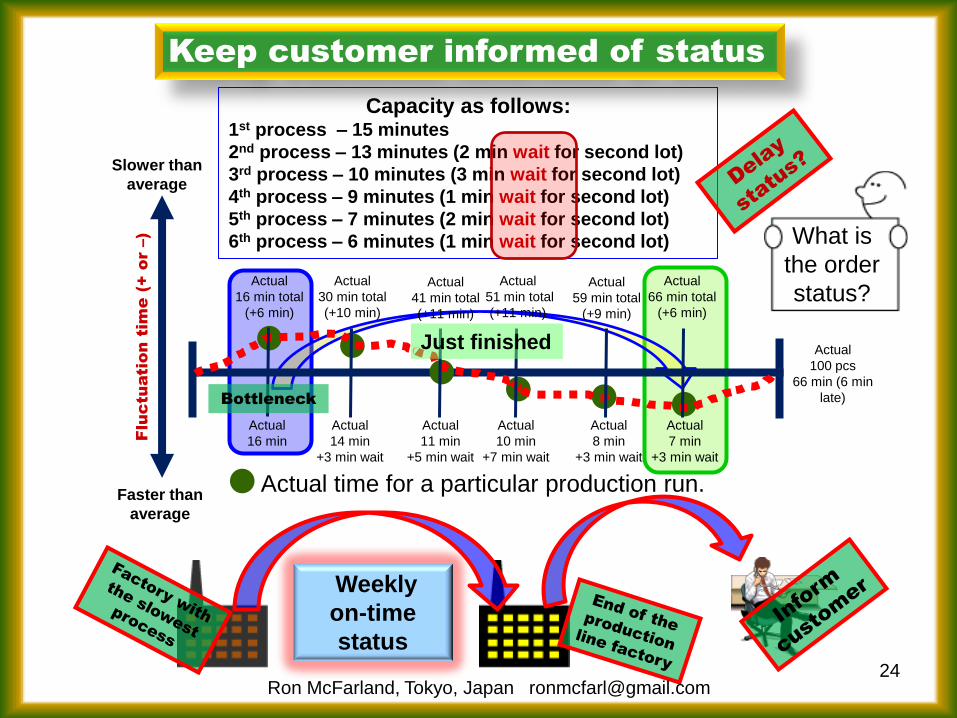
Keep customer informed of status
Flu
ctu
atio
n tim
e (+ o
r –)
Faster than
average
Slower than
average
24
Weekly
on-time
status
Capacity as follows: 1st process – 15 minutes
2nd process – 13 minutes (2 min wait for second lot)
3rd process – 10 minutes (3 min wait for second lot)
4th process – 9 minutes (1 min wait for second lot)
5th process – 7 minutes (2 min wait for second lot)
6th process – 6 minutes (1 min wait for second lot)
Actual time for a particular production run.
Actual
41 min total
(+11 min)
Actual
51 min total
(+11 min)
Actual
59 min total
(+9 min)
Actual
66 min total
(+6 min)
Actual
14 min
+3 min wait
Actual
30 min total
(+10 min)
Actual
100 pcs
66 min (6 min
late)
Actual
11 min
+5 min wait
Actual
8 min
+3 min wait
Actual
7 min
+3 min wait
Actual
10 min
+7 min wait
Actual
16 min total
(+6 min)
Actual
16 min
Just finished
Bottleneck
What is
the order
status?
Ron McFarland, Tokyo, Japan [email protected]
25
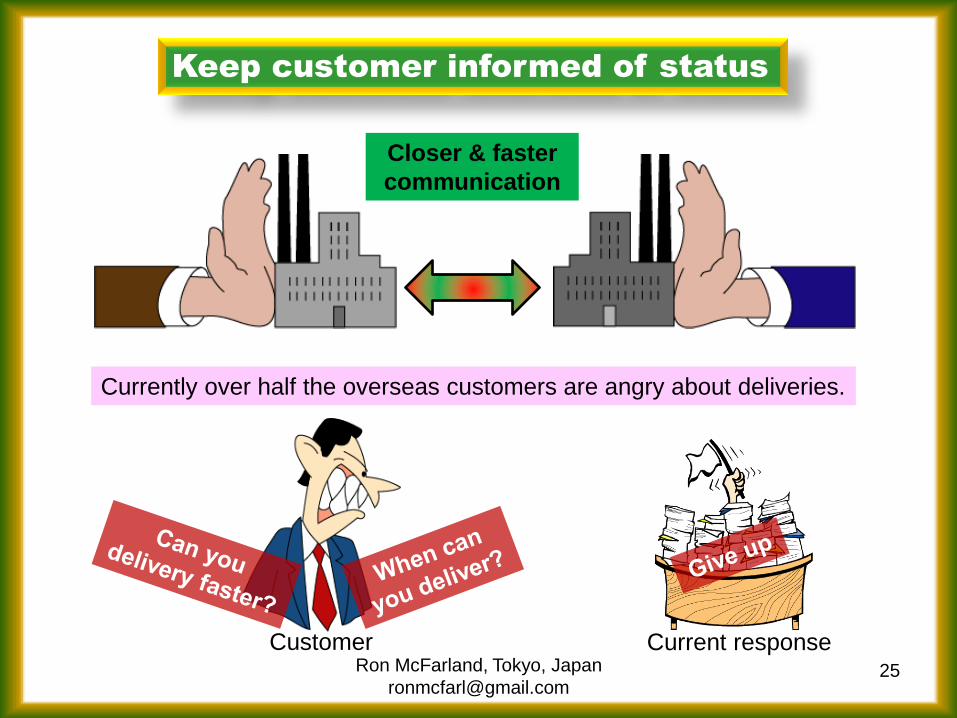
Keep customer informed of status
Closer & faster
communication
Customer
Currently over half the overseas customers are angry about deliveries.
Current response Ron McFarland, Tokyo, Japan
26
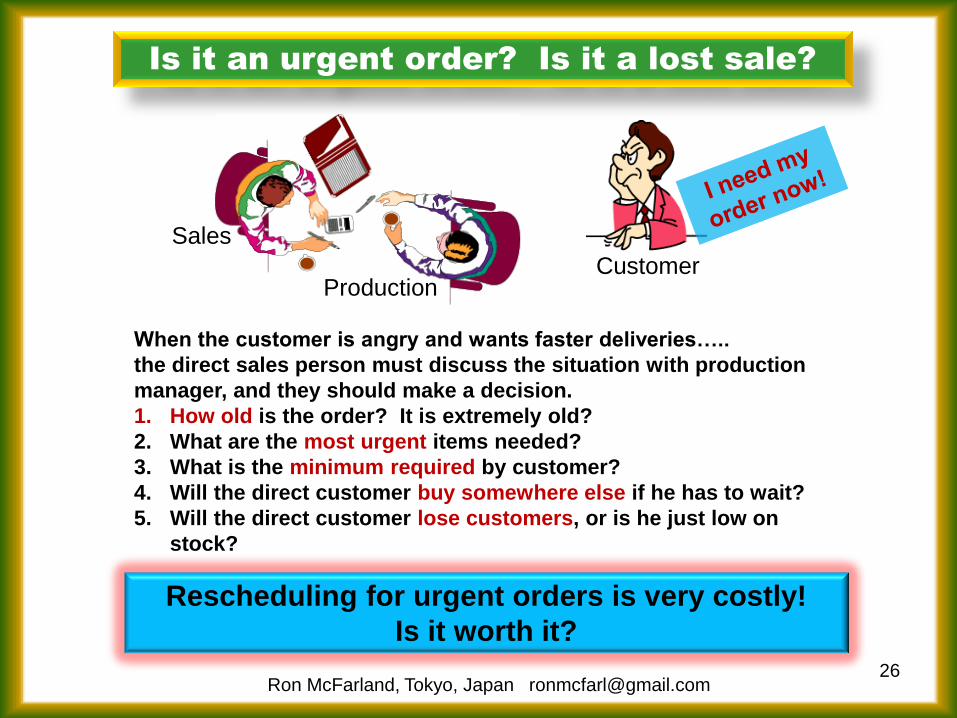
Is it an urgent order? Is it a lost sale?
Customer
Rescheduling for urgent orders is very costly!
Is it worth it?
When the customer is angry and wants faster deliveries…..
the direct sales person must discuss the situation with production
manager, and they should make a decision.
1. How old is the order? It is extremely old?
2. What are the most urgent items needed?
3. What is the minimum required by customer?
4. Will the direct customer buy somewhere else if he has to wait?
5. Will the direct customer lose customers, or is he just low on
stock?
Sales
Production
Ron McFarland, Tokyo, Japan [email protected]
27
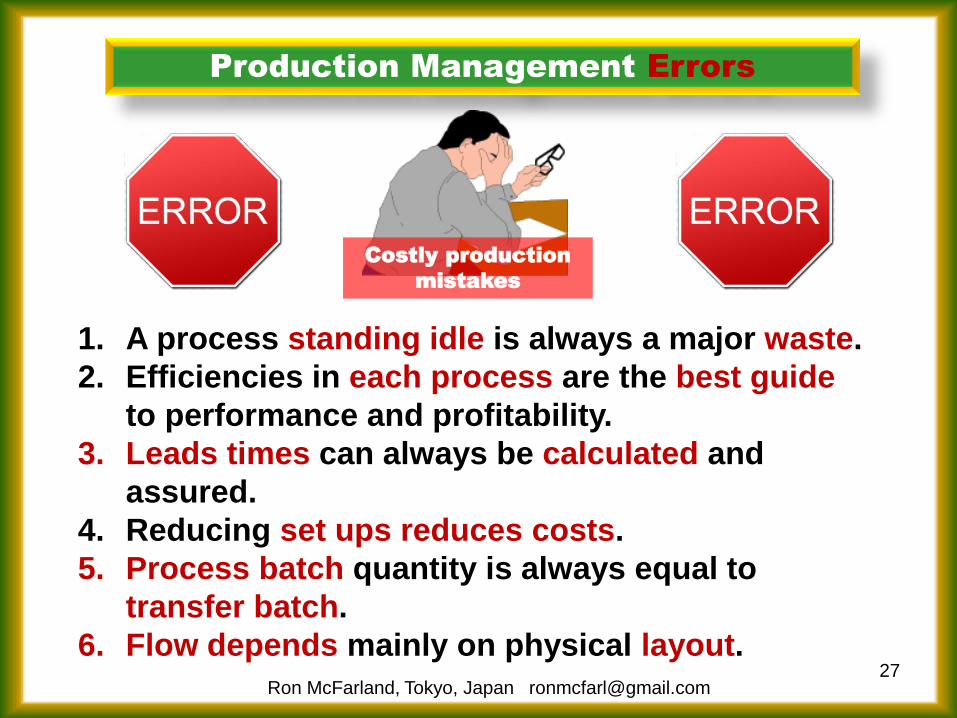
Production Management Errors
1. A process standing idle is always a major waste.
2. Efficiencies in each process are the best guide
to performance and profitability.
3. Leads times can always be calculated and
assured.
4. Reducing set ups reduces costs.
5. Process batch quantity is always equal to
transfer batch.
6. Flow depends mainly on physical layout.
Costly production
mistakes
Ron McFarland, Tokyo, Japan [email protected]
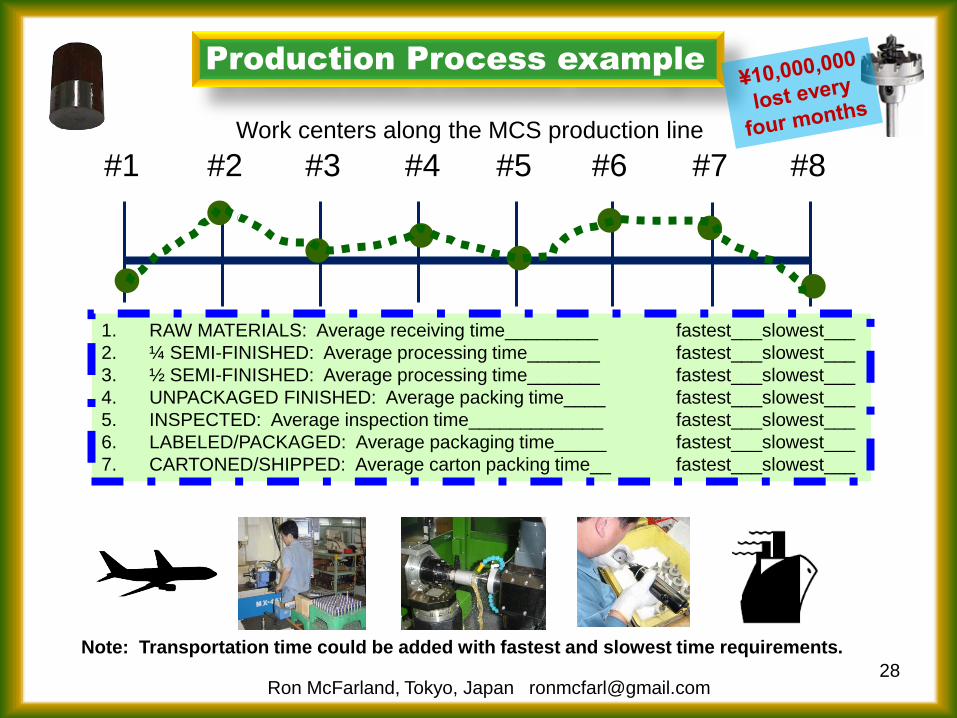
Production Process example
Work centers along the MCS production line
#2 #3 #4 #5 #6 #7 #8 #1
1. RAW MATERIALS: Average receiving time_________ fastest___slowest___
2. ¼ SEMI-FINISHED: Average processing time_______ fastest___slowest___
3. ½ SEMI-FINISHED: Average processing time_______ fastest___slowest___
4. UNPACKAGED FINISHED: Average packing time____ fastest___slowest___
5. INSPECTED: Average inspection time_____________ fastest___slowest___
6. LABELED/PACKAGED: Average packaging time_____ fastest___slowest___
7. CARTONED/SHIPPED: Average carton packing time__ fastest___slowest___
28
Note: Transportation time could be added with fastest and slowest time requirements.
Ron McFarland, Tokyo, Japan [email protected]
29
#4 - Strength
constraint factor
#2 - Decide
#5 - Evaluate
Improvement
#1 - Identify
#3 - Subordinate
factors
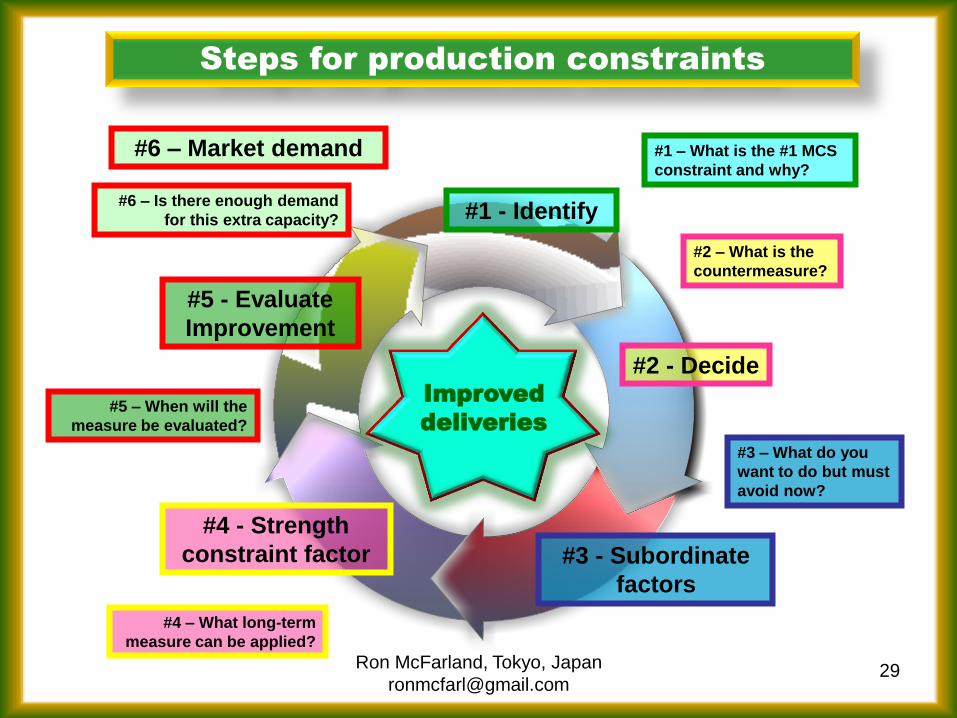
Steps for production constraints
Improved
deliveries
#6 – Market demand #1 – What is the #1 MCS
constraint and why?
#2 – What is the
countermeasure?
#3 – What do you
want to do but must
avoid now?
#4 – What long-term
measure can be applied?
#5 – When will the
measure be evaluated?
#6 – Is there enough demand
for this extra capacity?
Ron McFarland, Tokyo, Japan
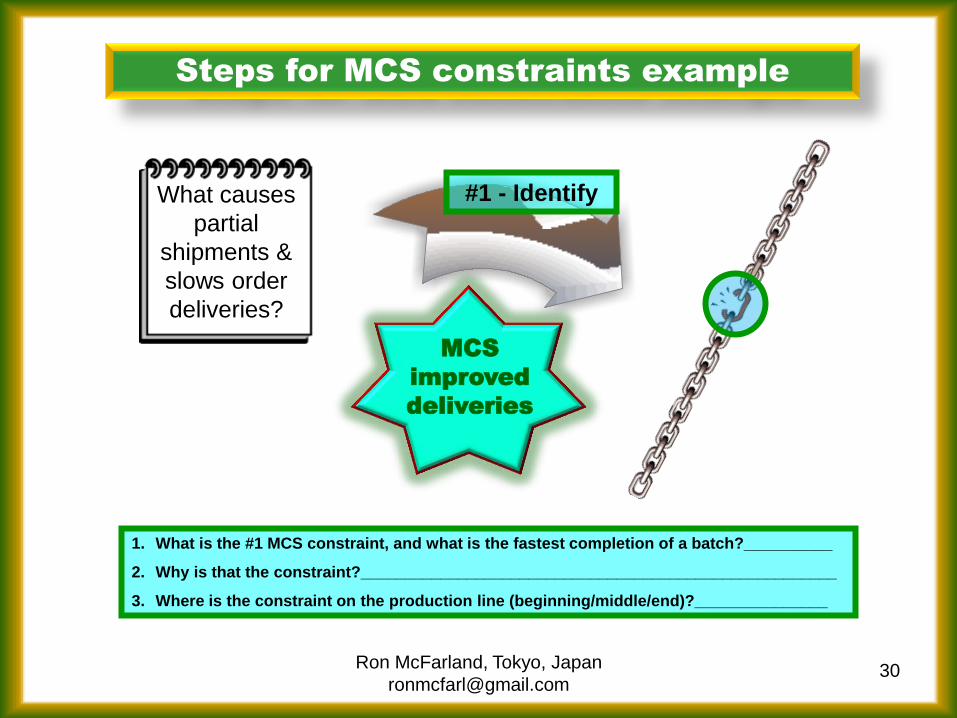
30
#1 - Identify
Steps for MCS constraints example
1. What is the #1 MCS constraint, and what is the fastest completion of a batch?__________
2. Why is that the constraint?______________________________________________________
3. Where is the constraint on the production line (beginning/middle/end)?_______________
MCS
improved
deliveries
What causes
partial
shipments &
slows order
deliveries?
Ron McFarland, Tokyo, Japan
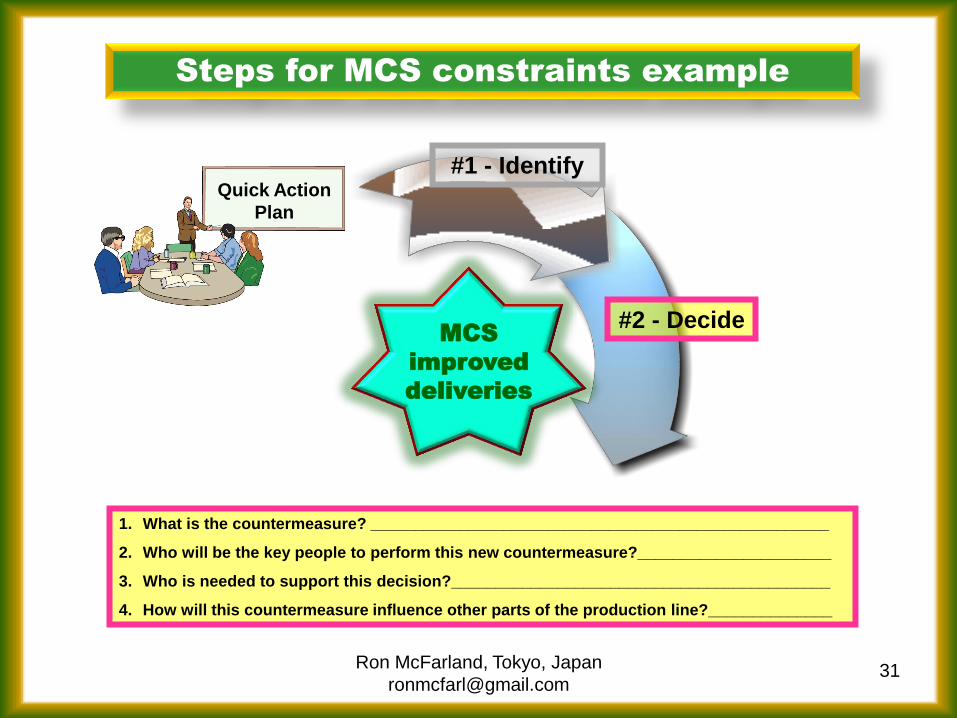
31
#2 - Decide
#1 - Identify
Steps for MCS constraints example
MCS
improved
deliveries
1. What is the countermeasure? ____________________________________________________
2. Who will be the key people to perform this new countermeasure?______________________
3. Who is needed to support this decision?___________________________________________
4. How will this countermeasure influence other parts of the production line?______________
Quick Action
Plan
Ron McFarland, Tokyo, Japan
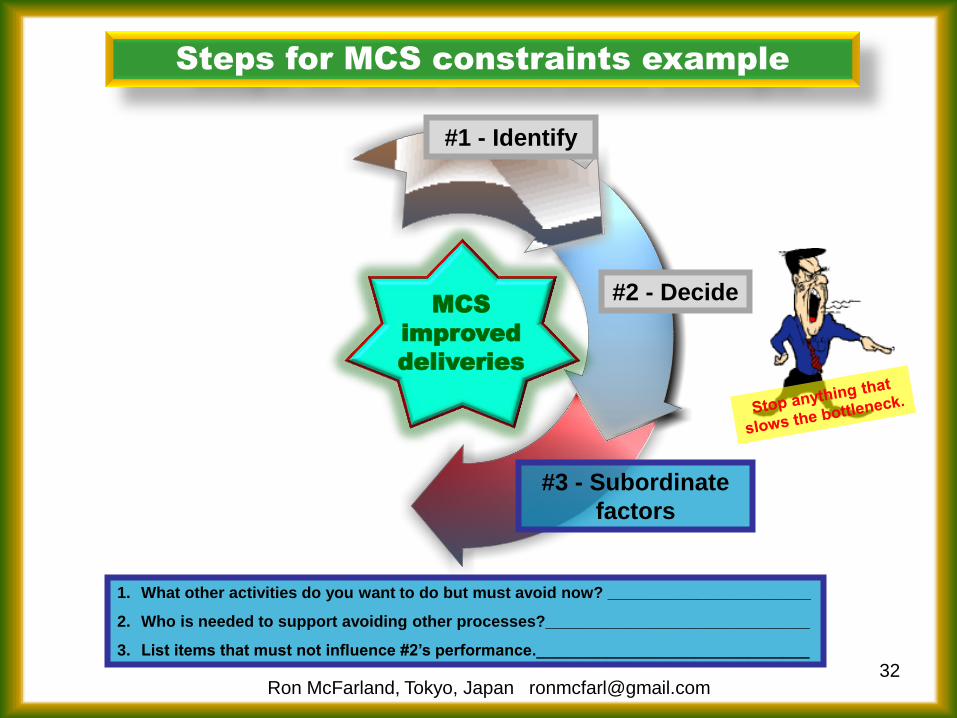
32
#2 - Decide
#1 - Identify
#3 - Subordinate
factors
Steps for MCS constraints example
MCS
improved
deliveries
1. What other activities do you want to do but must avoid now? _______________________
2. Who is needed to support avoiding other processes?______________________________
3. List items that must not influence #2’s performance._______________________________
Ron McFarland, Tokyo, Japan [email protected]
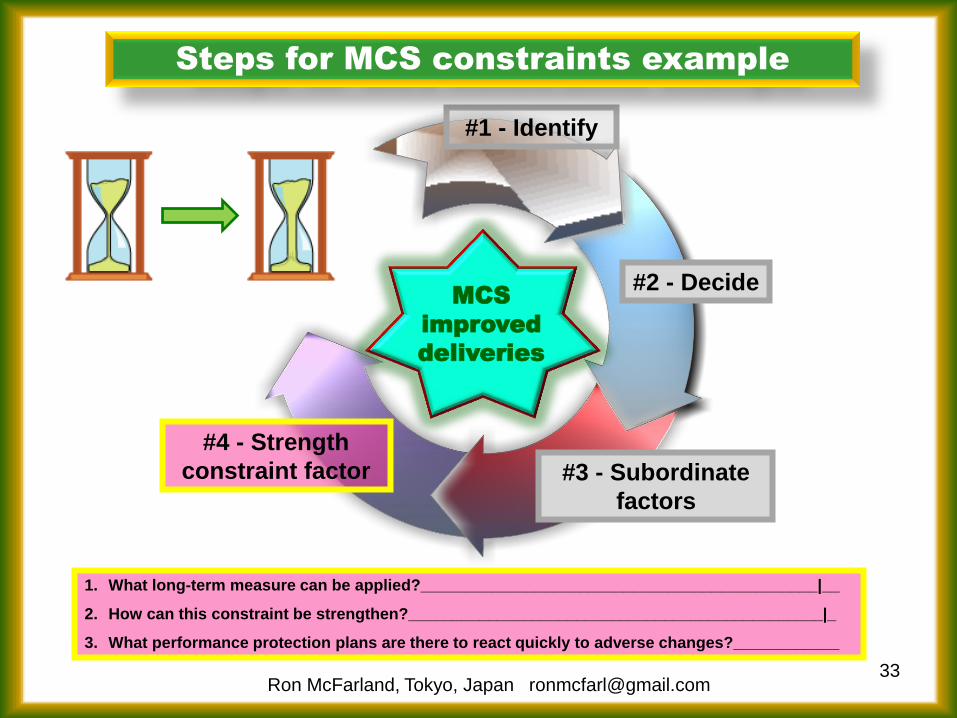
33
#4 - Strength
constraint factor
#2 - Decide
#1 - Identify
#3 - Subordinate
factors
Steps for MCS constraints example
MCS
improved
deliveries
1. What long-term measure can be applied?_____________________________________________|__
2. How can this constraint be strengthen?_______________________________________________|_
3. What performance protection plans are there to react quickly to adverse changes?____________
Ron McFarland, Tokyo, Japan [email protected]
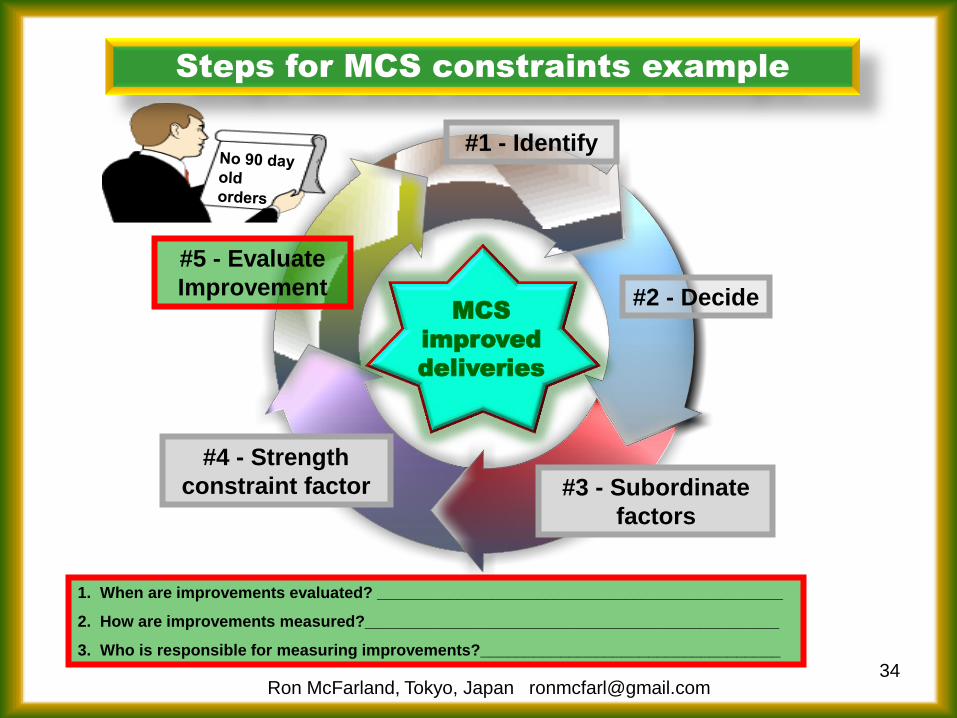
34
#4 - Strength
constraint factor
#2 - Decide
#5 - Evaluate
Improvement
#1 - Identify
#3 - Subordinate
factors
Steps for MCS constraints example
MCS
improved
deliveries
1. When are improvements evaluated? ______________________________________________
2. How are improvements measured?_______________________________________________
3. Who is responsible for measuring improvements?__________________________________
Ron McFarland, Tokyo, Japan [email protected]
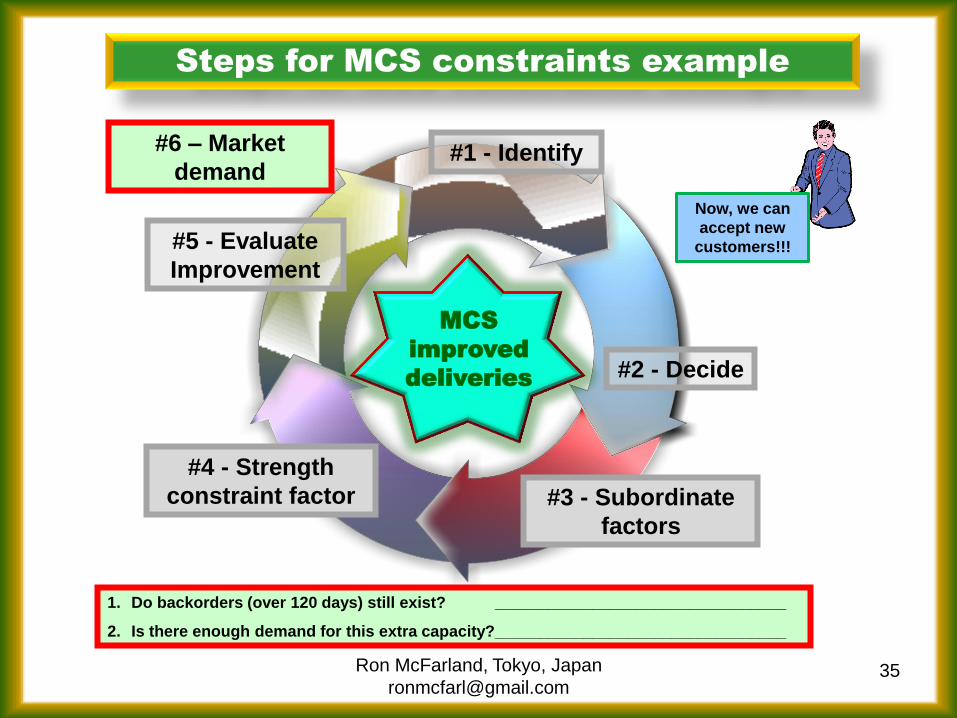
35
#4 - Strength
constraint factor
#2 - Decide
#5 - Evaluate
Improvement
#1 - Identify
#3 - Subordinate
factors
Steps for MCS constraints example
MCS
improved
deliveries
#6 – Market
demand
1. Do backorders (over 120 days) still exist? _________________________________
2. Is there enough demand for this extra capacity?_________________________________
Now, we can
accept new
customers!!!
Ron McFarland, Tokyo, Japan
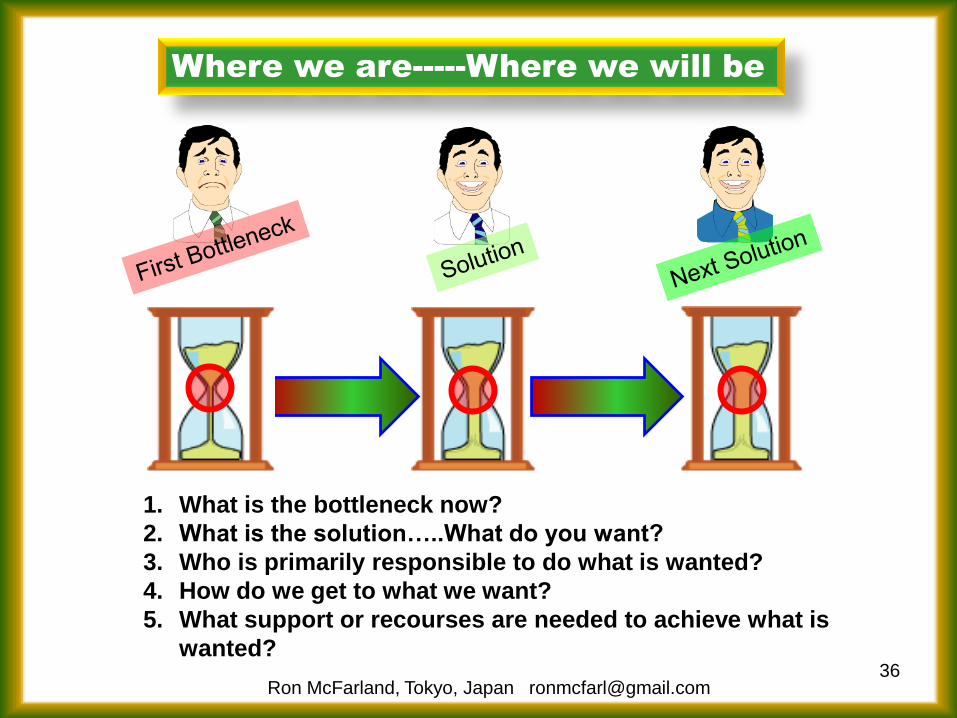
Where we are-----Where we will be
36
1. What is the bottleneck now?
2. What is the solution…..What do you want?
3. Who is primarily responsible to do what is wanted?
4. How do we get to what we want?
5. What support or recourses are needed to achieve what is
wanted?
Ron McFarland, Tokyo, Japan [email protected]
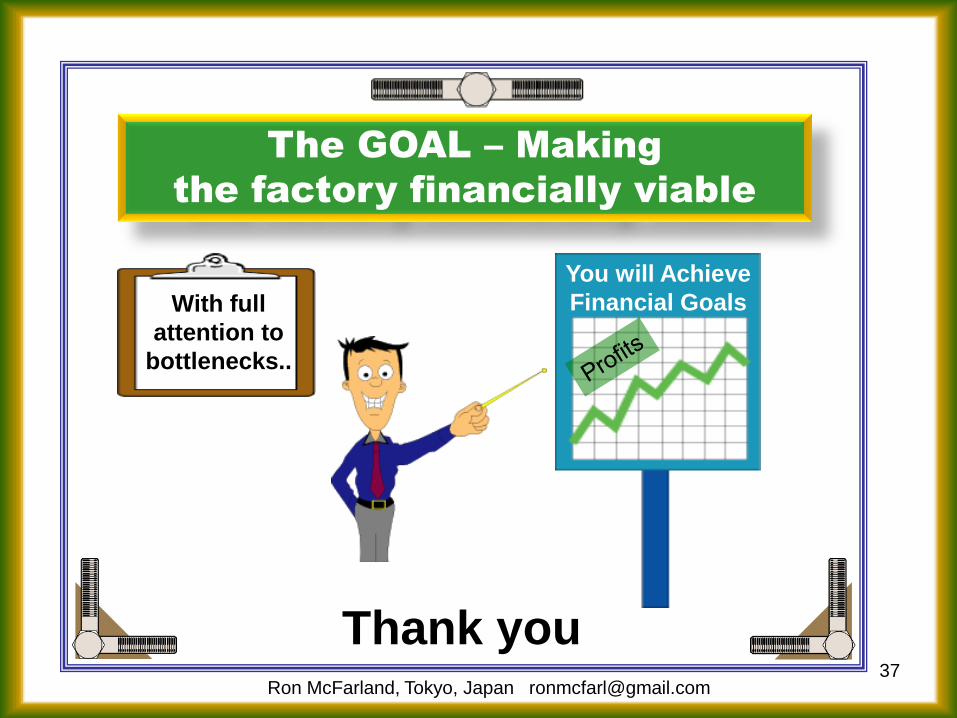
With full
attention to
bottlenecks..
The GOAL – Making
the factory financially viable
37
You will Achieve
Financial Goals
Thank you Ron McFarland, Tokyo, Japan [email protected]