Embed Size (px)
Citation preview

EUROPEAN COMMUNICATION MONITOR 2015 CREATING COMMUNICATION VALUE THROUGH LISTENING, MESSAGING AND MEASUREMENT. RESULTS OF A SURVEY IN 41 COUNTRIES.
Ansgar Zerfass, Dejan Verčič, Piet Verhoeven, Angeles Moreno & Ralph Tench
A study conducted by the European Public RelaPons EducaPon and Research AssociaPon (EUPRERA) and the European AssociaPon of CommunicaPon Directors (EACD) supported by partner PRIME Research InternaPonal and media partner CommunicaPon Director magazine
4
Imprint
Published by:
EACD European AssociaPon of CommunicaPon Directors, Brussels, www.eacd-‐online.eu EUPRERA European Public RelaPons EducaPon and Research AssociaPon, Brussels, www.euprera.org
Cita=on of this publica=on (APA style):
Zerfass, A., Verčič, D., Verhoeven, P., Moreno, A., & Tench, R. (2015). European CommunicaPon Monitor 2015. CreaPng communicaPon value through listening, messaging and measurement. Results of a Survey in 41 Countries. Brussels: EACD/EUPRERA, Helios Media.
Short quotaPon to be used in legends (charts/graphics): Source: European Communica0on Monitor 2015.
June 2015. All rights reserved.
© Prof. Dr. Ansgar Zerfass and the research team for the whole document and all parts, charts and data. The material presented in this document represents empirical insights and interpretaPon by the research team. It is intellectual property subject to internaPonal copyright. IllustraPon licensed by istockphoto.com. Title graphic provided by Helios Media. Permission is gained to quote from the content of this survey and reproduce any graphics, subject to the condiPon that the source including the internet address is clearly quoted and depicted on every chart. It is not allowed to use this data to illustrate promoPonal material for commercial services. Publishing this PDF document on websites run by third parPes and storing this document in databases or on plaaorms which are only open to subscribers/members or charge payments for assessing informaPon is prohibited. Please use a link to the official website www.communicaPonmonitor.eu instead.
This report (chart version) is available as a free PDF document at www.communicaPonmonitor.eu The report is also available as a booklet published by Helios Media, ISBN 978-‐3-‐942263-‐34-‐4.
Contact:
Please contact naPonal EUPRERA researchers at universiPes in your country listed on page 132, lead researcher Prof. Dr. Ansgar Zerfass, zerfass@uni-‐leipzig.de, or EACD coordinator Vanessa Eggert, vanessa.eggert@eacd-‐online.eu, if your are interested in presentaPons, workshops, interviews, or further analyses of the insights presented here.
5
Content
Foreword and IntroducPon 6
Research design 8 Methodology and demographics 10 Future relevance of mass media 16 IntegraPng communicaPon and content strategies 26 Strategic issues and value contribuPon 38 CommunicaPon strategies and organisaPonal listening 52 Measurement and evaluaPon 70 RelaPonship between agencies and clients 82 Salaries 96 CharacterisPcs of excellent communicaPon funcPons 106
References 126 Survey organisers and partners 129 NaPonal contacts 132 Authors and research team 133
6
The 2015 ediPon of the European CommunicaPon Monitor provides a direct line into the mindset of communicators across Europe, revealing the trends, challenges and new ideas that are prevalent in European communicaPons management today.
As with previous years, linking communicaPons and business strategy remains the key management issue idenPfied by communicators in Europe. For this link to occur, communicators must demonstrate the value of the funcPon to organisaPonal execuPves. The survey results suggest communicators are likely to highlight the posiPve effects on reputaPon, brand and organisaPonal culture as evidence of this value. CiPng posiPve impacts on economic value and tangible and intangible resources is used to a lesser extent.
The dynamic development of the communicaPon funcPon during the digital age has opened up many new channels for reaching stakeholders. The majority of communicators surveyed in the European CommunicaPon Monitor believe the integraPon of these channels with those already in existence is crucial
for a successful communicaPons strategy. Digital channels have also led to the opportunity for data analysis to be incorporated into the assessment of communicaPons campaigns. Yet, according to this year’s Monitor, more than half of all communicaPons departments uPlise tradiPonal measurement and evaluaPon acPviPes without leveraging the value of data for managing communicaPons.
The European AssociaPon of CommunicaPon Directors (EACD) is commimed to supporPng communicators in their goal to execute successful communicaPons management strategies. Through a conPnuous exchange with our members we hope to assist communicators in implemenPng innovaPve content strategies and data analyPcs. The results of the survey illustrate ambiPon for further progress and we at the EACD are moPvated to display how the communicaPon funcPon contributes value to every organisaPon. I invite you to explore the findings of this year’s European CommunicaPon Monitor in-‐depth on the following pages.
Dr. Herbert Heitmann President, European Associa0on of Communica0on Directors (EACD)
Foreword
7
Rapid changes in the communicaPon environment challenge organisaPons around the globe. Many claim that mass media are losing their leading role in shaping public opinion and new approaches like content markePng are propagated. However, there is limle evidence that this helps to support organisaPonal goals. Looking further, there is no compelling answer at all to the overarching quesPon of how communicaPon creates value for organisaPons – instead, various raPonales like building reputaPon, managing relaPon-‐ships, avoiding crises, securing legiPmacy, idenPfying opportuniPes or supporPng sales compete with each other both in theory and pracPce.
The European CommunicaPon Monitor 2015 explores these quesPons as well as a number of other important topics in the field. With 2,253 communicaPon professionals from 41 countries parPcipaPng and
detailed analyses for 20 countries, it is the largest annual survey of its kind worldwide. The study reveals that there is a vast discrepancy between the ambiPon of communicaPon professionals to build immaterial assets, which they also claim as being valuable to top execuPves, and their pracPces of evaluaPng such impacts. The study also shows that organisaPonal listening is a premier, but open neglected, goal for strategic communicaPon.
On behalf of the research team, I would like to thank all professionals who spent some of their valuable Pme to parPcipate in the survey. Our naPonal partners from many renowned universiPes, assistant researchers Markus Wiesenberg and Ronny Fechner, and Stefanie Schwerdaeger and Grit Fiedler at the EACD did a great job. Many thanks to our partners CommunicaPon Director magazine and PRIME Research InternaPonal – they enabled us to deliver this report to you. Prof. Dr. Ansgar Zerfass Lead researcher; Professor and Chair in Strategic Communica0on, University of Leipzig, Germany & President, European Public Rela0ons Educa0on and Research Associa0on (EUPRERA)
IntroducPon
Research design
9
Research design
The European CommunicaPon Monitor (ECM) is a unique, longitudinal transnaPonal survey in strategic communicaPon. It has been organised annually since 2007 and similar studies have been iniPated by the research team on other conPnents (LaPn America, since 2014, and Asia-‐Pacific, starPng 2015). All surveys focus on current pracPces and future developments of communicaPon management and public relaPons in corporaPons, non-‐profits, governmental organisaPons and communicaPon agencies. Owing to its depth, long-‐term consistency of quesPons and structure, the ECM is known as the most comprehensive research in the field worldwide. The ninth ediPon presented in this report is based on responses from 2,253 communicaPon professionals from 41 countries.
A joint study by academia and pracPce, the ECM is organised by the European Public RelaPons EducaPon and Research AssociaPon (EUPRERA) and the European AssociaPon of CommunicaPon Directors (EACD), supported by partner PRIME Research InternaPonal, a global leader in strategic communicaPon research, and media partner CommunicaPon Director magazine. Authors of the study are five university professors represenPng leading academic insPtuPons in the field, led by Professor Ansgar Zerfass from the University of Leipzig. A wider board of professors and naPonal research collaborators ensure that the survey reflects the diversity of the field across Europe. The research framework for the survey has been modified and expanded in 2015. The survey quesPonnaire includes a large number of independent and dependent variables along five key factors: personal characterisPcs of communicaPon professionals (demographics, educaPon, job status, experience); features of the organisaPon (structure, country); amributes of the communicaPon funcPon; the current situaPon as well as percepPons on key developments relevant for the profession.
The study explores three constructs. Firstly, dynamics in the field are idenPfied by longitudinal comparisons, i.e. on strategic issues, collaboraPon between communicaPon funcPons, measurement, and salaries. To this end, quesPons from previous ECM surveys (Zerfass et al., 2014, 2011, 2010) have been repeated. Secondly, recent developments in pracPce and academic theories are empirically tested by using a set of quesPonnaire instruments derived from literature. The conceptual background of the ECM 2015 includes debates on the future role of mass media for opinion building and strategic communicaPon (Macnamara, 2014b; Supa, 2014), new concepts like content markePng, brand journalism and naPve adverPsing (Hallahan, 2014), integraPon of communicaPon acPviPes (Smith, 2012), alternaPve ways to explain the value of communicaPon (Kiesenbauer & Zerfass, 2015), organisaPonal listening (Macnamara, 2014c), measurement and evaluaPon (Watson & Noble, 2014), as well as collaboraPon and conflict between communicaPon departments and agencies (Eagle et al., 2015: 123-‐138). Last but not least, this study applies staPsPcal methods to idenPfy outperforming communicaPon departments in the sample. Excellent communicaPon funcPons differ from others in various aspects, and the ECM explains these differences. The mulP-‐tude of insights based on research instead of aspiraPons and promises enables the profession to strengthen or reject concepts in the field and take informed decisions.
Methodology and demographics
11
Methology and demographics
The quesPonnaire used for the European CommunicaPon Monitor 2015 consisted of 33 quesPons arranged in 19 secPons. Three quesPons were used in two different versions for respondents working in communicaPon departments and agencies respecPvely. Six quesPons were only presented to professionals working in departments. All instruments were based on research quesPons and hypotheses derived from previous research and literature.
The online survey used the English language and was pre-‐tested with 51 communicaPon professionals in 18 European countries. Amendments were made where appropriate and the final quesPonnaire was acPvated for four weeks in March 2015. 30,000+ profession-‐als throughout Europe were invited with personal e-‐mails based on a database provided by the European AssociaPon of CommunicaPon Directors (EACD). AddiPonal invitaPons were sent via naPonal research collaborators and professional associaPons. 6,415 respondents started the survey and 2,391 of them completed it. Answers from parPcipants who could not be clearly idenPfied as part of the popula-‐Pon were deleted from the dataset. This strict selecPon of respondents is a disPnct feature of the ECM and sets it apart from many studies which are based on snowball sampling or which include students, academics and people outside of the focused profession or region. The evaluaPon is then based on 2,253 fully completed replies by communicaPon professionals in Europe.
The StaPsPcal Package for the Social Sciences (SPSS) was used for data analysis. Results have been tested staPsPcally with, depending on the variable, Pearson's chi-‐square tests (χ²), ANOVA/Scheffe post-‐hoc tests, Cramér’s V, one sample T-‐Tests, and independent samples T-‐tests. In this report, results are classified as significant (p ≤ 0.05)* or highly significant (p ≤ 0.01)** in the graphics and tables or marked in the footnotes.
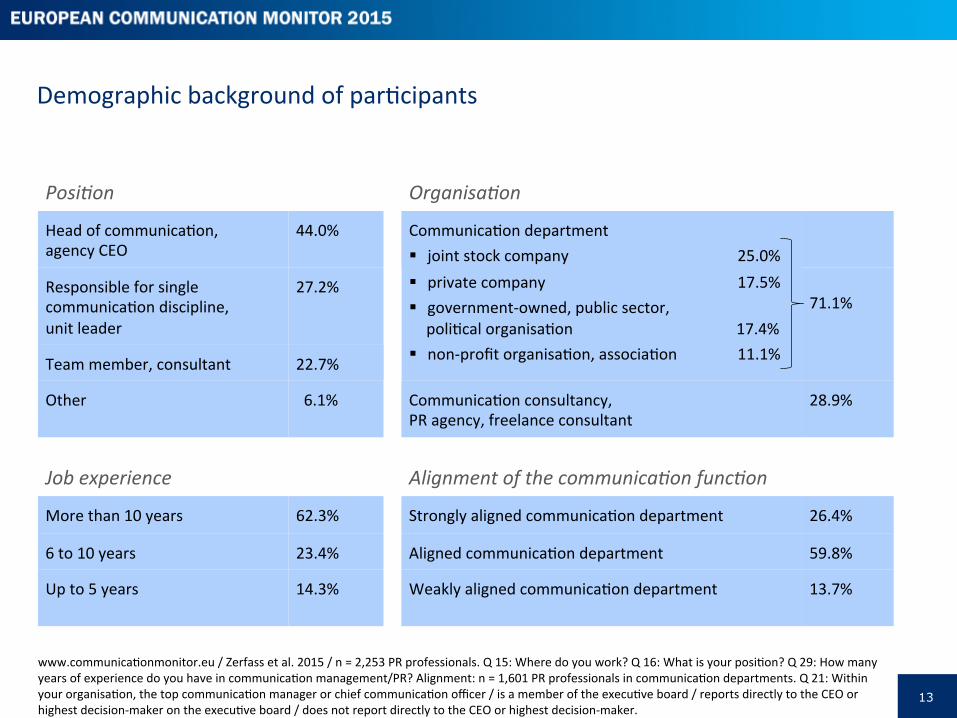
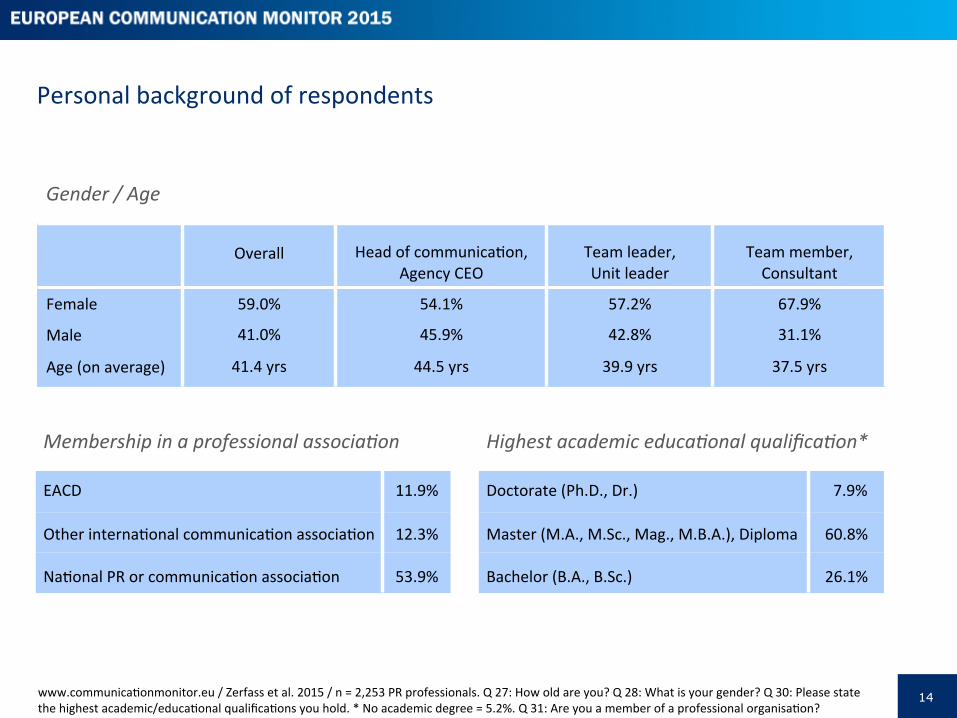
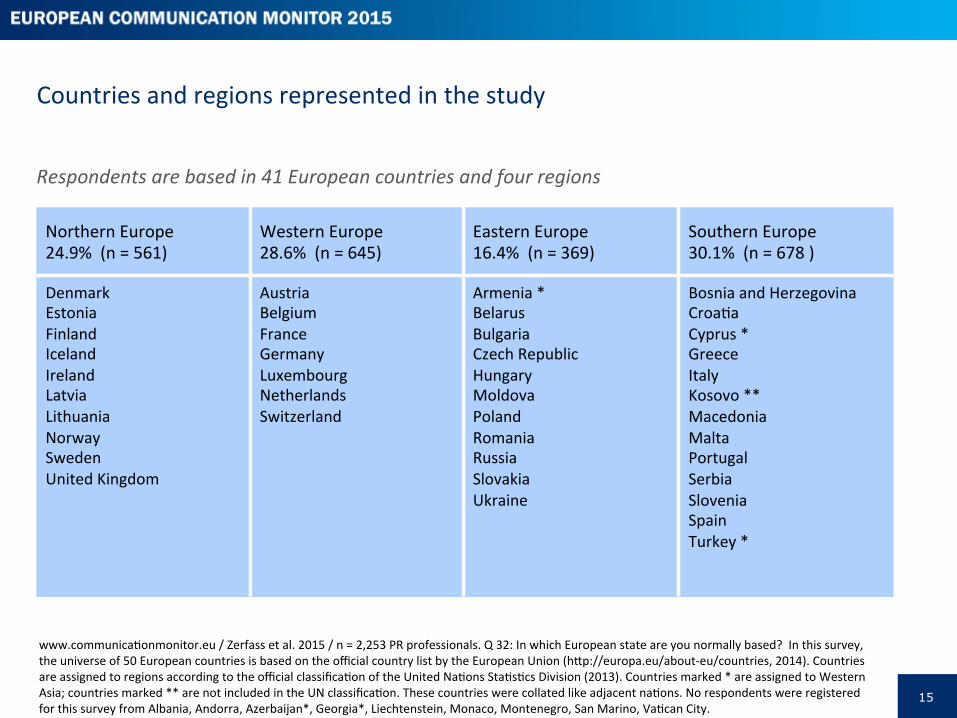
The demographics show that seven out of ten respondents are communicaPon leaders: 44.0 per cent hold a top hierarchical posiPon as head of communicaPon or as CEO of a communicaPon consultancy; 27.2 per cent are unit leaders or in charge of a single communicaPon discipline in an organisaPon. 62.3 per cent of the professionals interviewed have more than ten years of experience in communicaPon management, 59.0 per cent of them are female and the average age is 41.4 years. A vast majority (94.8 per cent) in the sample has an academic degree, and more than two third hold a graduate degree or even a doctorate. Almost three out of four respon-‐dents work in communicaPon departments in organisaPons (joint stock companies, 25.0 per cent; private companies, 17.5 per cent; government-‐owned, public sector, poliPcal organisaPons, 17.4 per cent; non-‐profit organisaPons, associaPons, 11.1 per cent), while 28.9 per cent are communicaPon consultants working freelance or for agencies. Most respondents (30.1 per cent) are based in Southern Europe (countries like Italy, Spain, CroaPa), followed by Western Europe (28.6 per cent; countries like Germany, Netherlands, France), Northern Europe (24.9 per cent; countries like Norway, Sweden, United Kingdom), and Eastern Europe (16.4 per cent; countries like Poland, Romania, Ukraine). The universe of 50 European countries is based on an official list of European Countries by the European Union. Countries are assigned to regions according to the official classificaPon of the United NaPons StaPsPcs Division (2013).
Overall, 41 countries parPcipated in the survey. The dataset provided more detailed insights for 20 countries, including most key markets in Europe.
12
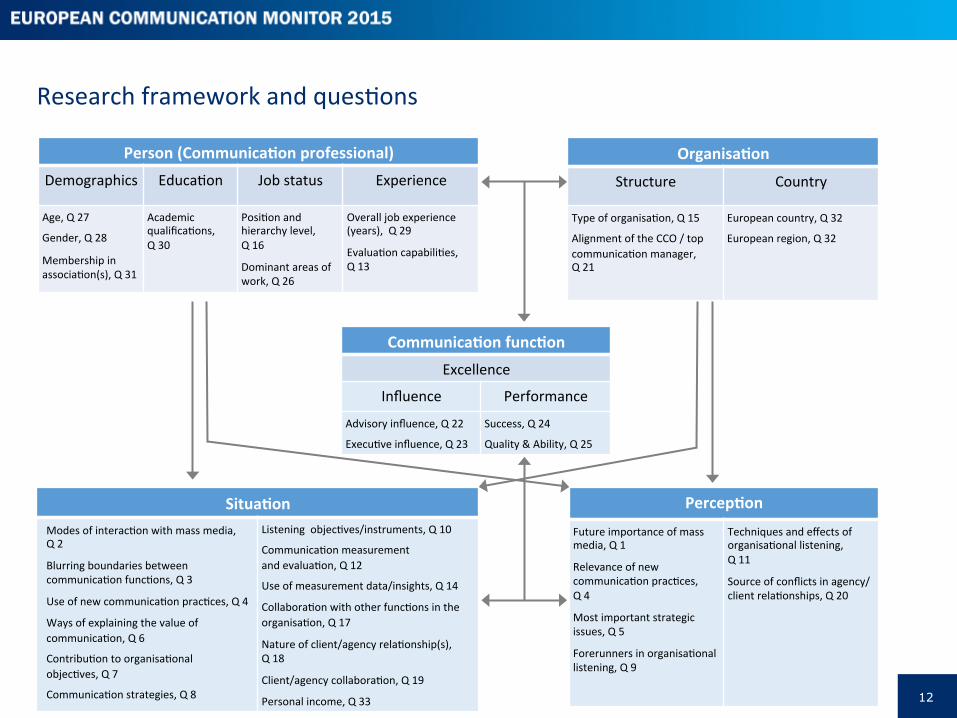
Research framework and quesPons
Situa=on Modes of interacPon with mass media, Q 2
Blurring boundaries between communicaPon funcPons, Q 3
Use of new communicaPon pracPces, Q 4
Ways of explaining the value of communicaPon, Q 6
ContribuPon to organisaPonal objecPves, Q 7
CommunicaPon strategies, Q 8
Listening objecPves/instruments, Q 10
CommunicaPon measurement and evaluaPon, Q 12
Use of measurement data/insights, Q 14
CollaboraPon with other funcPons in the organisaPon, Q 17
Nature of client/agency relaPonship(s), Q 18
Client/agency collaboraPon, Q 19
Personal income, Q 33
Person (Communica=on professional) Demographics EducaPon Job status Experience
Age, Q 27
Gender, Q 28
Membership in associaPon(s), Q 31
Academic qualificaPons, Q 30
PosiPon and hierarchy level, Q 16
Dominant areas of work, Q 26
Overall job experience (years), Q 29
EvaluaPon capabiliPes, Q 13
Communica=on func=on Excellence
Influence Performance
Advisory influence, Q 22
ExecuPve influence, Q 23
Success, Q 24
Quality & Ability, Q 25
Organisa=on
Structure Country
Type of organisaPon, Q 15
Alignment of the CCO / top communicaPon manager, Q 21
European country, Q 32
European region, Q 32
Percep=on
Future importance of mass media, Q 1
Relevance of new communicaPon pracPces, Q 4
Most important strategic issues, Q 5
Forerunners in organisaPonal listening, Q 9
Techniques and effects of organisaPonal listening, Q 11
Source of conflicts in agency/ client relaPonships, Q 20
13
Demographic background of parPcipants
www.communicaPonmonitor.eu / Zerfass et al. 2015 / n = 2,253 PR professionals. Q 15: Where do you work? Q 16: What is your posiPon? Q 29: How many years of experience do you have in communicaPon management/PR? Alignment: n = 1,601 PR professionals in communicaPon departments. Q 21: Within your organisaPon, the top communicaPon manager or chief communicaPon officer / is a member of the execuPve board / reports directly to the CEO or highest decision-‐maker on the execuPve board / does not report directly to the CEO or highest decision-‐maker.
Posi0on Organisa0on
Head of communicaPon, agency CEO
44.0% CommunicaPon department § joint stock company 25.0% § private company 17.5% § government-‐owned, public sector, poliPcal organisaPon 17.4%
§ non-‐profit organisaPon, associaPon 11.1%
Responsible for single communicaPon discipline, unit leader
27.2% 71.1%
Team member, consultant 22.7%
Other 6.1% CommunicaPon consultancy, PR agency, freelance consultant
28.9%
Job experience Alignment of the communica0on func0on
More than 10 years 62.3% Strongly aligned communicaPon department 26.4%
6 to 10 years 23.4% Aligned communicaPon department 59.8%
Up to 5 years 14.3% Weakly aligned communicaPon department
13.7%
14
Gender / Age
Personal background of respondents
www.communicaPonmonitor.eu / Zerfass et al. 2015 / n = 2,253 PR professionals. Q 27: How old are you? Q 28: What is your gender? Q 30: Please state the highest academic/educaPonal qualificaPons you hold. * No academic degree = 5.2%. Q 31: Are you a member of a professional organisaPon?
Overall
Head of communicaPon, Agency CEO
Team leader, Unit leader
Team member, Consultant
Female
Male
Age (on average)
59.0%
41.0%
41.4 yrs
54.1%
45.9%
44.5 yrs
57.2%
42.8%
39.9 yrs
67.9%
31.1%
37.5 yrs
Highest academic educa0onal qualifica0on*
Doctorate (Ph.D., Dr.) 7.9%
Master (M.A., M.Sc., Mag., M.B.A.), Diploma 60.8%
Bachelor (B.A., B.Sc.) 26.1%
Membership in a professional associa0on
EACD 11.9%
Other internaPonal communicaPon associaPon 12.3%
NaPonal PR or communicaPon associaPon 53.9%
15
Countries and regions represented in the study
Respondents are based in 41 European countries and four regions
Northern Europe 24.9% (n = 561)
Western Europe 28.6% (n = 645)
Eastern Europe 16.4% (n = 369)
Southern Europe 30.1% (n = 678 )
Denmark Estonia Finland Iceland Ireland Latvia Lithuania Norway Sweden United Kingdom
Austria Belgium France Germany Luxembourg Netherlands Switzerland
Armenia * Belarus Bulgaria Czech Republic Hungary Moldova Poland Romania Russia Slovakia Ukraine
Bosnia and Herzegovina CroaPa Cyprus * Greece Italy Kosovo ** Macedonia Malta Portugal Serbia Slovenia Spain Turkey *
www.communicaPonmonitor.eu / Zerfass et al. 2015 / n = 2,253 PR professionals. Q 32: In which European state are you normally based? In this survey, the universe of 50 European countries is based on the official country list by the European Union (hmp://europa.eu/about-‐eu/countries, 2014). Countries are assigned to regions according to the official classificaPon of the United NaPons StaPsPcs Division (2013). Countries marked * are assigned to Western Asia; countries marked ** are not included in the UN classificaPon. These countries were collated like adjacent naPons. No respondents were registered for this survey from Albania, Andorra, Azerbaijan*, Georgia*, Liechtenstein, Monaco, Montenegro, San Marino, VaPcan City.
Future relevance of mass media

17
Chapter overview
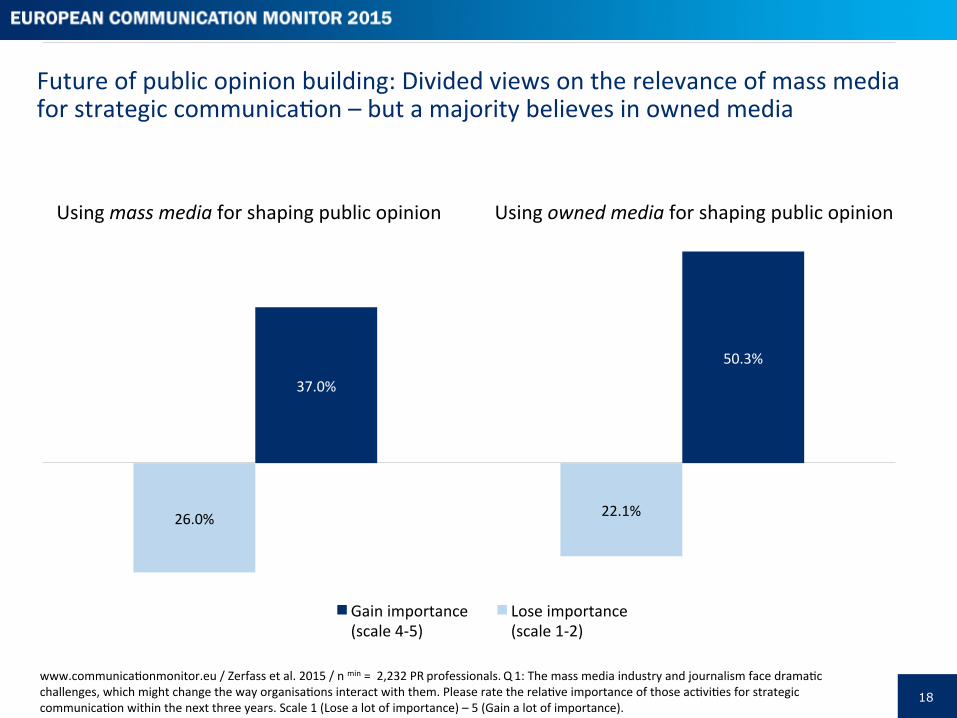
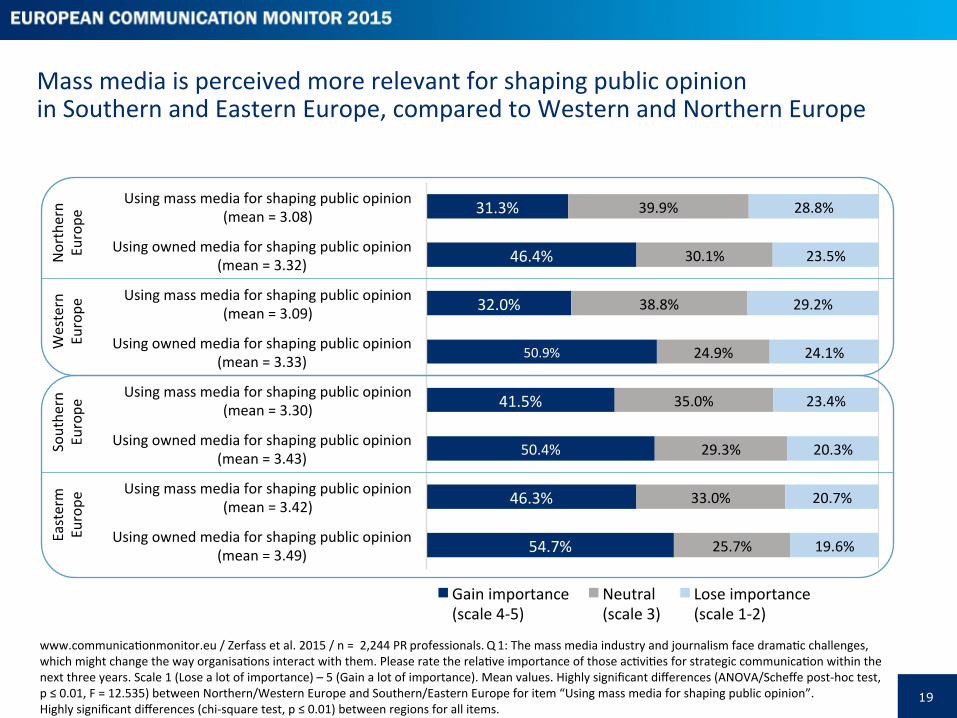
Developments and changes of mass media significantly affect strategic communicaPon pracPce. TradiPonal media like press, radio and television were divided between editorial (news) and adverPsing content, while today we are witnessing the evoluPon into the PESO (= paid, earned, social and owned) media environment (Hallahan, 2014; Verčič & Tkalac Verčič, 2015). CommunicaPon professionals in Europe predict a tectonic ship from the predominance of mass media to owned media (which used to be called “corporate publishing”) for shaping public opinion. More than half the respondents predict an increasing importance of owned media in the next three years (50.3 per cent). This might diminish the societal role of specialised media organisaPons and facilitate the transformaPon of all organisaPons into (also) media organisaPons (Ihlen & Pallas, 2014). Mass media are predicted to be more relevant in the future in Eastern and Southern Europe in comparison to Western and Northern Europe.
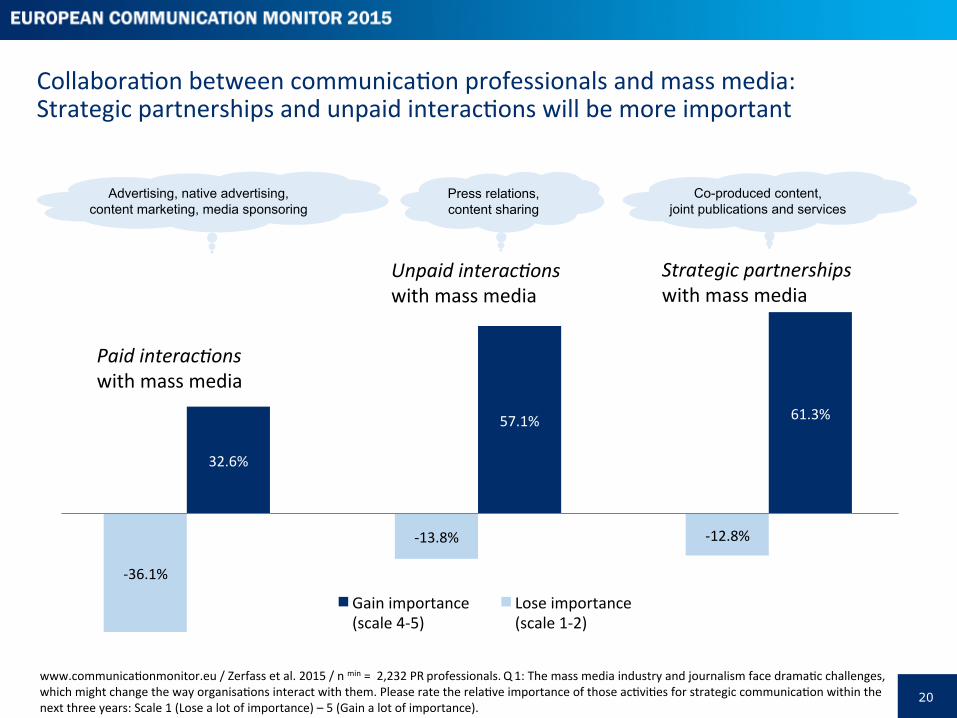
Strategic communicators intend to spend less on adverPsing (paid interacPons with the mass media), while they see a strong rise in the use of unpaid interacPons with the mass media (e.g. through media relaPons programs, 57.1 per cent believe this will gain in impor-‐tance) and even more for strategic partnerships with the mass media (61.3 per cent gain in importance). Jointly produced quality content and/or creaPon of topical plaaorms will be especially relevant in Eastern and Southern Europe.
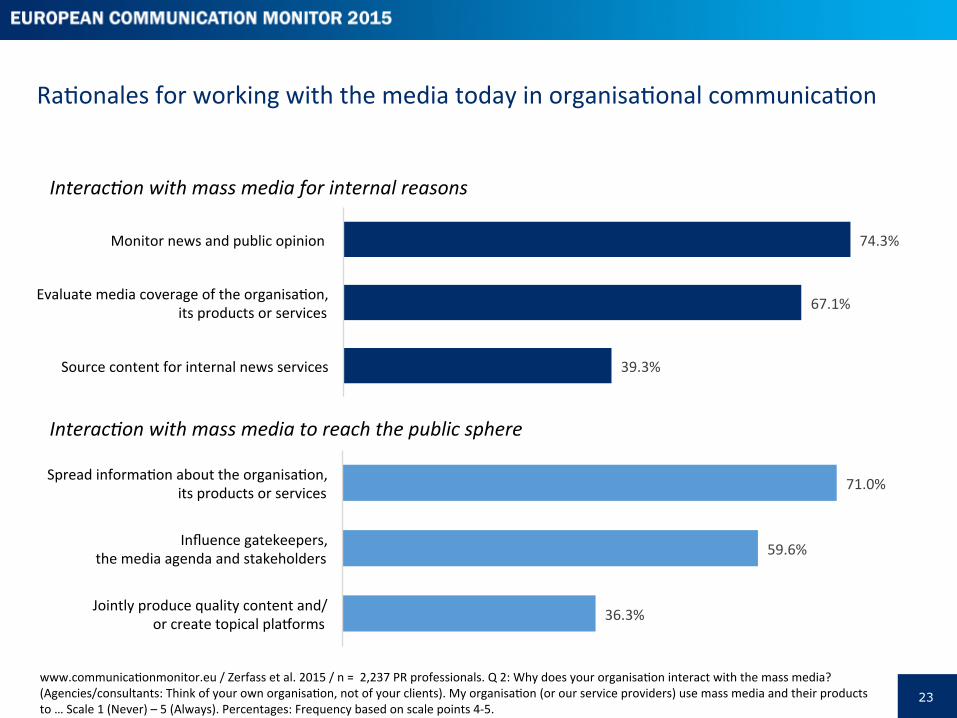
Although these trends are obvious and strong, it would be premature to predict the death of the tradiPonal mass media: nearly three quarters of the respondents use the mass media to monitor news and public opinion (74.3 per cent), and more than two thirds of them evaluate media coverage of the organisaPon, its products and services. Over one third of them also use mass media content as a source for internal news services (39.3 per cent). Besides these inbound uses of the mass media, communicators sPll extensively use the mass media for outbound reasons: more than seven out of ten respondents spread informaPon about the organisaPon, its products and services through the mass media and more than half use them to influence gatekeepers, the media agenda and stakeholders. This result is congruent with other studies on the current relaPonship between journalism and public relaPons (Macnamara, 2014b; Supa, 2014; Zoch & Molleda, 2006).
PercepPons of the future of media relaPons developments are largely dependent on the area of communicaPon in which profession-‐als are working. Strategic partnerships with the mass media are preferred by specialists in markePng, brand and consumer communicaPon and those working in online media. Those specialists are also strongly in favour of concepts like content markePng, brand journalism and naPve adverPsing. This seems to confirm Hallahan’s (2014) observaPon of an “encroachment on public relaPons by marketers” (Hallahan, 2014: 406). Lines between adverPsing and publicity are blurring, and new rules of behaviour will be needed for professional communica-‐tors: “The PR, adverPsing, markePng, and media industries need to work together to develop consistent responsible codes of pracPce in relaPon to emerging pracPces of 'embedded' markePng communicaPon in its various guises, such as 'naPve adverPsing', 'integrated content', and new forms of 'advertorial' to address their potenPal negaPve effects on the public sphere through the blurring of boundaries between paid promoPon and independent news, analysis, and commentary” (Macnamara, 2014a: 231).
18
50.3%
37.0%
22.1% 26.0%
Gain importance (scale 4-‐5)
Lose importance (scale 1-‐2)
Future of public opinion building: Divided views on the relevance of mass media for strategic communicaPon – but a majority believes in owned media
www.communicaPonmonitor.eu / Zerfass et al. 2015 / n min = 2,232 PR professionals. Q 1: The mass media industry and journalism face dramaPc challenges, which might change the way organisaPons interact with them. Please rate the relaPve importance of those acPviPes for strategic communicaPon within the next three years. Scale 1 (Lose a lot of importance) – 5 (Gain a lot of importance).
Using mass media for shaping public opinion Using owned media for shaping public opinion
19
31.3%
46.4%
32.0%
50.9%
41.5%
50.4%
46.3%
54.7%
39.9%
30.1%
38.8%
24.9%
35.0%
29.3%
33.0%
25.7%
28.8%
23.5%
29.2%
24.1%
23.4%
20.3%
20.7%
19.6%
Using mass media for shaping public opinion (mean = 3.08)
Using owned media for shaping public opinion (mean = 3.32)
Using mass media for shaping public opinion (mean = 3.09)
Using owned media for shaping public opinion (mean = 3.33)
Using mass media for shaping public opinion (mean = 3.30)
Using owned media for shaping public opinion (mean = 3.43)
Using mass media for shaping public opinion (mean = 3.42)
Using owned media for shaping public opinion (mean = 3.49)
Gain importance (scale 4-‐5)
Neutral (scale 3)
Lose importance (scale 1-‐2)
Northern
Europe
Western
Europe
Southe
rn
Europe
Easterm
Europe
Mass media is perceived more relevant for shaping public opinion in Southern and Eastern Europe, compared to Western and Northern Europe
www.communicaPonmonitor.eu / Zerfass et al. 2015 / n = 2,244 PR professionals. Q 1: The mass media industry and journalism face dramaPc challenges, which might change the way organisaPons interact with them. Please rate the relaPve importance of those acPviPes for strategic communicaPon within the next three years. Scale 1 (Lose a lot of importance) – 5 (Gain a lot of importance). Mean values. Highly significant differences (ANOVA/Scheffe post-‐hoc test, p ≤ 0.01, F = 12.535) between Northern/Western Europe and Southern/Eastern Europe for item “Using mass media for shaping public opinion”. Highly significant differences (chi-‐square test, p ≤ 0.01) between regions for all items.
20
61.3% 57.1%
32.6%
-‐12.8% -‐13.8%
-‐36.1%
Gain importance (scale 4-‐5)
Lose importance (scale 1-‐2)
CollaboraPon between communicaPon professionals and mass media: Strategic partnerships and unpaid interacPons will be more important
www.communicaPonmonitor.eu / Zerfass et al. 2015 / n min = 2,232 PR professionals. Q 1: The mass media industry and journalism face dramaPc challenges, which might change the way organisaPons interact with them. Please rate the relaPve importance of those acPviPes for strategic communicaPon within the next three years: Scale 1 (Lose a lot of importance) – 5 (Gain a lot of importance).
Paid interac0ons with mass media
Unpaid interac0ons with mass media
Strategic partnerships with mass media
Advertising, native advertising, content marketing, media sponsoring
Press relations, content sharing
Co-produced content, joint publications and services
21
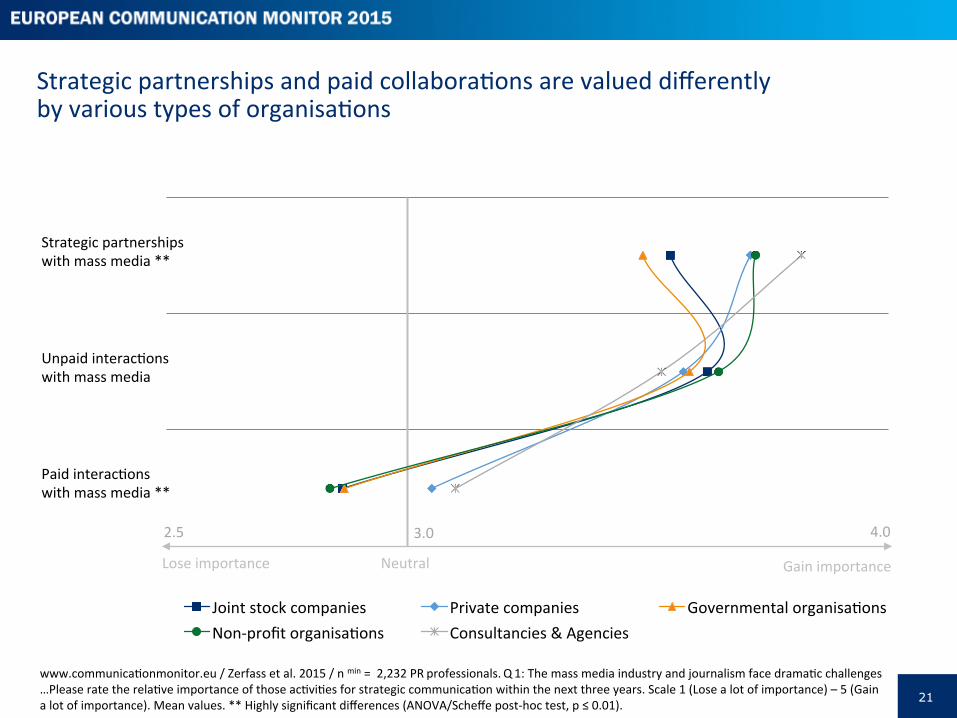
Strategic partnerships and paid collaboraPons are valued differently by various types of organisaPons
www.communicaPonmonitor.eu / Zerfass et al. 2015 / n min = 2,232 PR professionals. Q 1: The mass media industry and journalism face dramaPc challenges …Please rate the relaPve importance of those acPviPes for strategic communicaPon within the next three years. Scale 1 (Lose a lot of importance) – 5 (Gain a lot of importance). Mean values. ** Highly significant differences (ANOVA/Scheffe post-‐hoc test, p ≤ 0.01).
Joint stock companies Private companies Governmental organisaPons Non-‐profit organisaPons Consultancies & Agencies
Strategic partnerships with mass media **
Unpaid interacPons with mass media
Paid interacPons with mass media **
Lose importance Gain importance Neutral
2.5 3.0 4.0
22
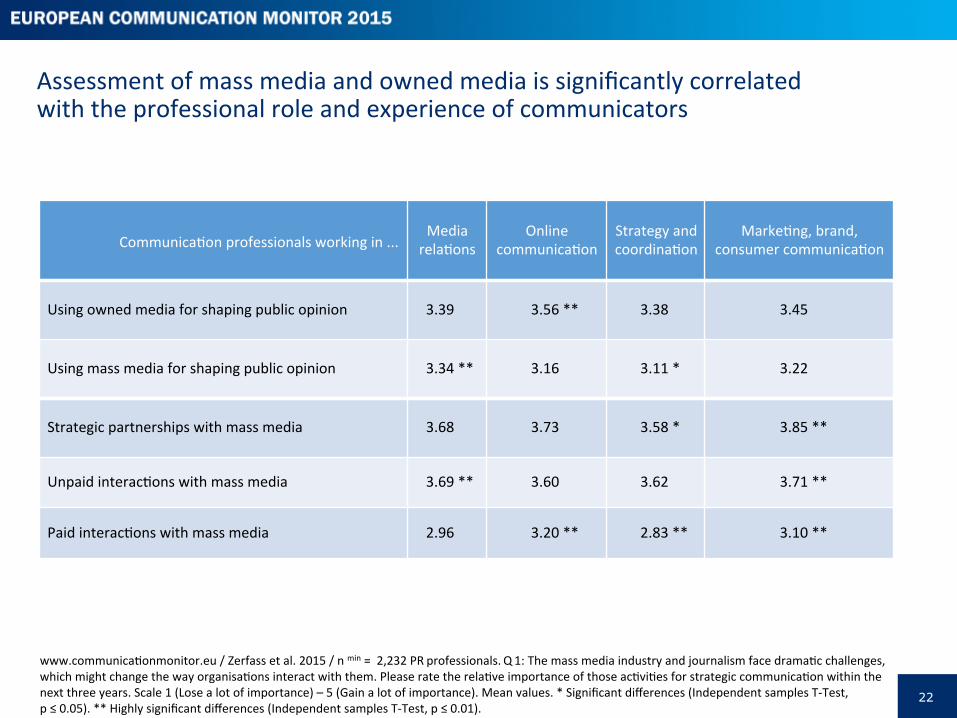
Assessment of mass media and owned media is significantly correlated with the professional role and experience of communicators
CommunicaPon professionals working in ... Media relaPons
Online communicaPon
Strategy and coordinaPon
MarkePng, brand, consumer communicaPon
Using owned media for shaping public opinion 3.39 3.56 ** 3.38 3.45
Using mass media for shaping public opinion 3.34 ** 3.16 3.11 * 3.22
Strategic partnerships with mass media 3.68 3.73 3.58 * 3.85 **
Unpaid interacPons with mass media 3.69 ** 3.60 3.62 3.71 **
Paid interacPons with mass media 2.96 3.20 ** 2.83 ** 3.10 **
www.communicaPonmonitor.eu / Zerfass et al. 2015 / n min = 2,232 PR professionals. Q 1: The mass media industry and journalism face dramaPc challenges, which might change the way organisaPons interact with them. Please rate the relaPve importance of those acPviPes for strategic communicaPon within the next three years. Scale 1 (Lose a lot of importance) – 5 (Gain a lot of importance). Mean values. * Significant differences (Independent samples T-‐Test, p ≤ 0.05). ** Highly significant differences (Independent samples T-‐Test, p ≤ 0.01).
23
RaPonales for working with the media today in organisaPonal communicaPon
74.3%
67.1%
39.3%
Monitor news and public opinion
Evaluate media coverage of the organisaPon, its products or services
Source content for internal news services
Interac0on with mass media for internal reasons
www.communicaPonmonitor.eu / Zerfass et al. 2015 / n = 2,237 PR professionals. Q 2: Why does your organisaPon interact with the mass media? (Agencies/consultants: Think of your own organisaPon, not of your clients). My organisaPon (or our service providers) use mass media and their products to … Scale 1 (Never) – 5 (Always). Percentages: Frequency based on scale points 4-‐5.
71.0%
59.6%
36.3%
Spread informaPon about the organisaPon, its products or services
Influence gatekeepers, the media agenda and stakeholders
Jointly produce quality content and/ or create topical plaaorms
Interac0on with mass media to reach the public sphere
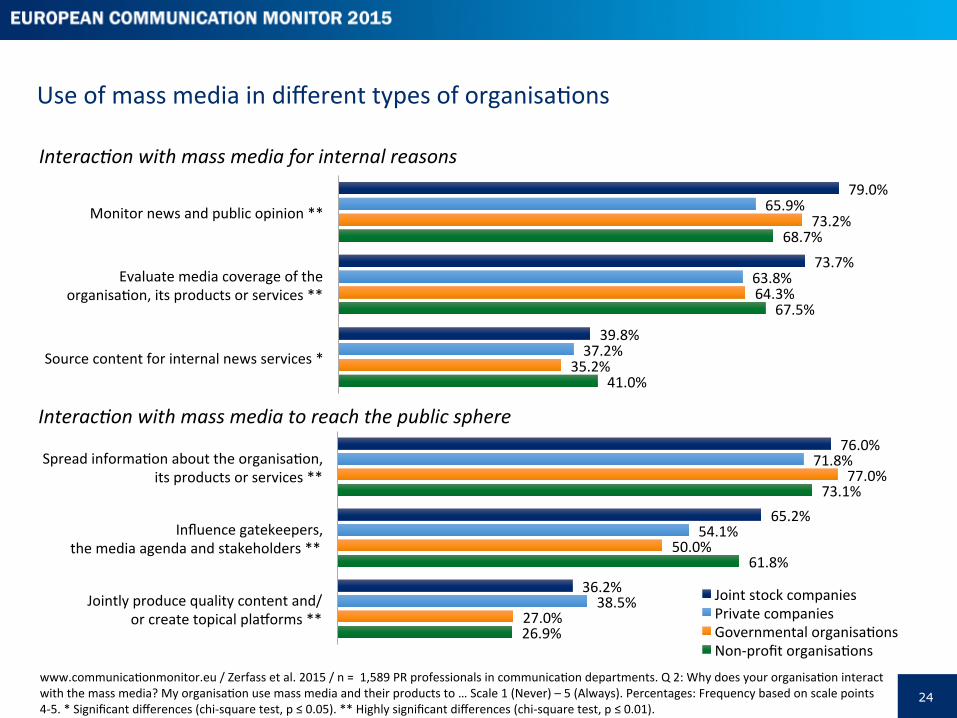
24
Use of mass media in different types of organisaPons
79.0%
73.7%
39.8%
65.9%
63.8%
37.2%
73.2%
64.3%
35.2%
68.7%
67.5%
41.0%
Monitor news and public opinion **
Evaluate media coverage of the organisaPon, its products or services **
Source content for internal news services *
www.communicaPonmonitor.eu / Zerfass et al. 2015 / n = 1,589 PR professionals in communicaPon departments. Q 2: Why does your organisaPon interact with the mass media? My organisaPon use mass media and their products to … Scale 1 (Never) – 5 (Always). Percentages: Frequency based on scale points 4-‐5. * Significant differences (chi-‐square test, p ≤ 0.05). ** Highly significant differences (chi-‐square test, p ≤ 0.01).
76.0%
65.2%
36.2%
71.8%
54.1%
38.5%
77.0%
50.0%
27.0%
73.1%
61.8%
26.9%
Spread informaPon about the organisaPon, its products or services **
Influence gatekeepers, the media agenda and stakeholders **
Jointly produce quality content and/ or create topical plaaorms **
Joint stock companies Private companies Governmental organisaPons Non-‐profit organisaPons
Interac0on with mass media for internal reasons
Interac0on with mass media to reach the public sphere
25
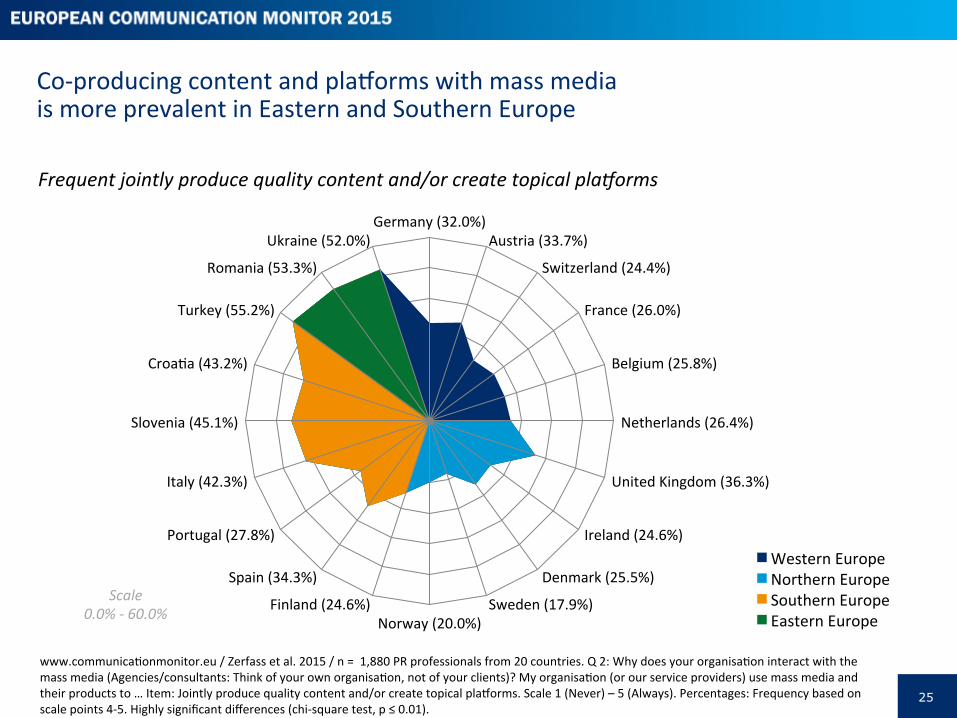
Co-‐producing content and plaaorms with mass media is more prevalent in Eastern and Southern Europe
www.communicaPonmonitor.eu / Zerfass et al. 2015 / n = 1,880 PR professionals from 20 countries. Q 2: Why does your organisaPon interact with the mass media (Agencies/consultants: Think of your own organisaPon, not of your clients)? My organisaPon (or our service providers) use mass media and their products to … Item: Jointly produce quality content and/or create topical plaaorms. Scale 1 (Never) – 5 (Always). Percentages: Frequency based on scale points 4-‐5. Highly significant differences (chi-‐square test, p ≤ 0.01).
Germany (32.0%) Austria (33.7%)
Switzerland (24.4%)
France (26.0%)
Belgium (25.8%)
Netherlands (26.4%)
United Kingdom (36.3%)
Ireland (24.6%)
Denmark (25.5%)
Sweden (17.9%) Norway (20.0%)
Finland (24.6%)
Spain (34.3%)
Portugal (27.8%)
Italy (42.3%)
Slovenia (45.1%)
CroaPa (43.2%)
Turkey (55.2%)
Romania (53.3%)
Ukraine (52.0%)
Frequent jointly produce quality content and/or create topical pla[orms
Western Europe Northern Europe Southern Europe Eastern Europe
Scale 0.0% -‐ 60.0%
Integra=ng communica=on and content strategies
27
Chapter overview
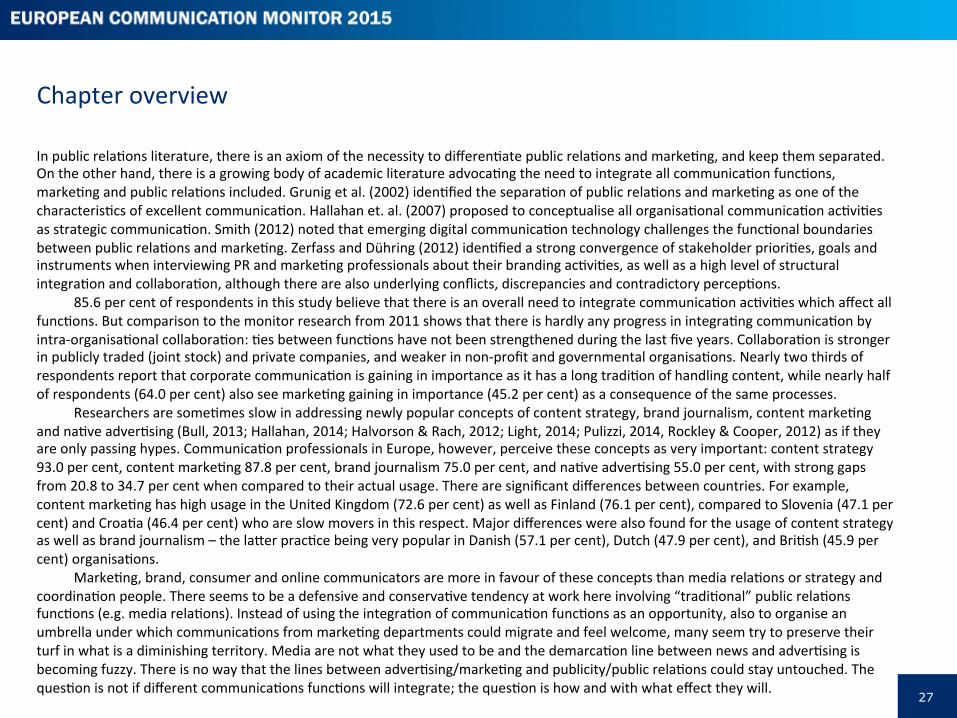
In public relaPons literature, there is an axiom of the necessity to differenPate public relaPons and markePng, and keep them separated. On the other hand, there is a growing body of academic literature advocaPng the need to integrate all communicaPon funcPons, markePng and public relaPons included. Grunig et al. (2002) idenPfied the separaPon of public relaPons and markePng as one of the characterisPcs of excellent communicaPon. Hallahan et. al. (2007) proposed to conceptualise all organisaPonal communicaPon acPviPes as strategic communicaPon. Smith (2012) noted that emerging digital communicaPon technology challenges the funcPonal boundaries between public relaPons and markePng. Zerfass and Dühring (2012) idenPfied a strong convergence of stakeholder prioriPes, goals and instruments when interviewing PR and markePng professionals about their branding acPviPes, as well as a high level of structural integraPon and collaboraPon, although there are also underlying conflicts, discrepancies and contradictory percepPons.
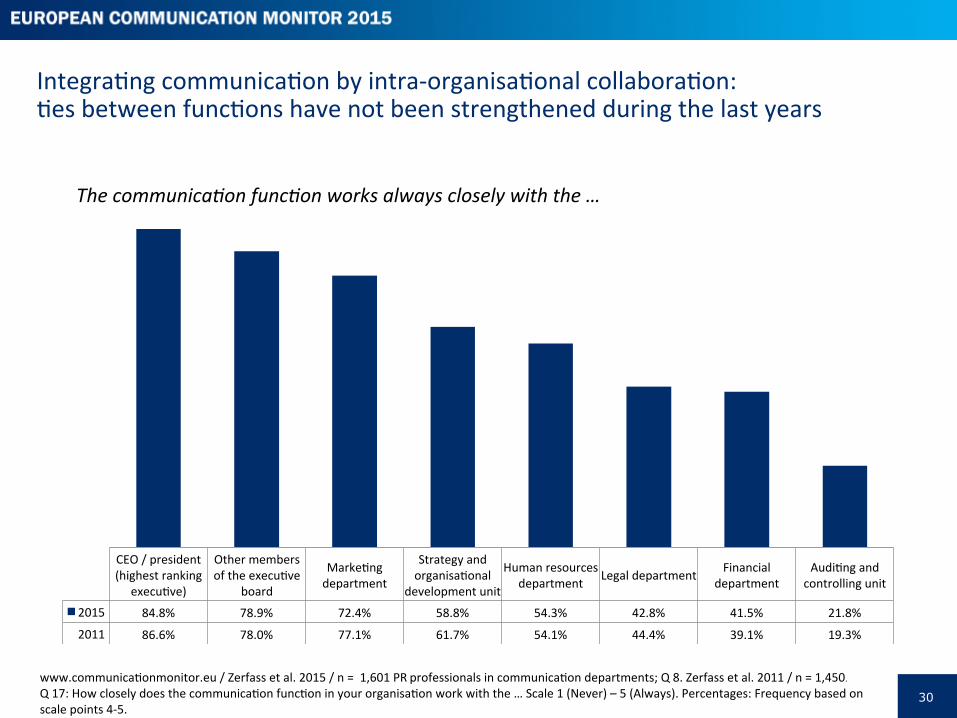
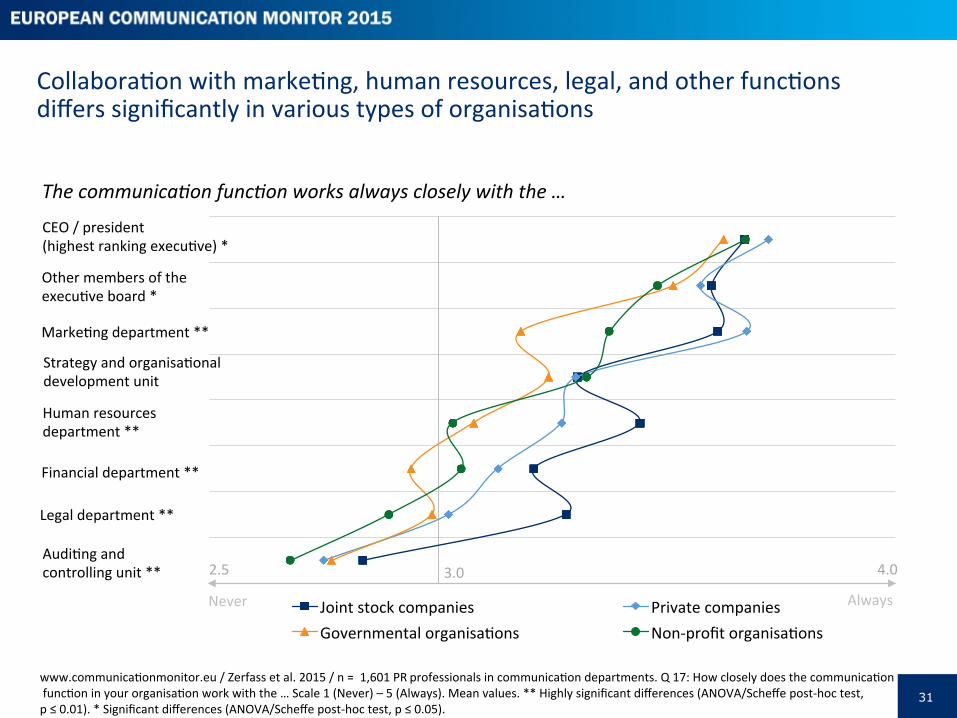
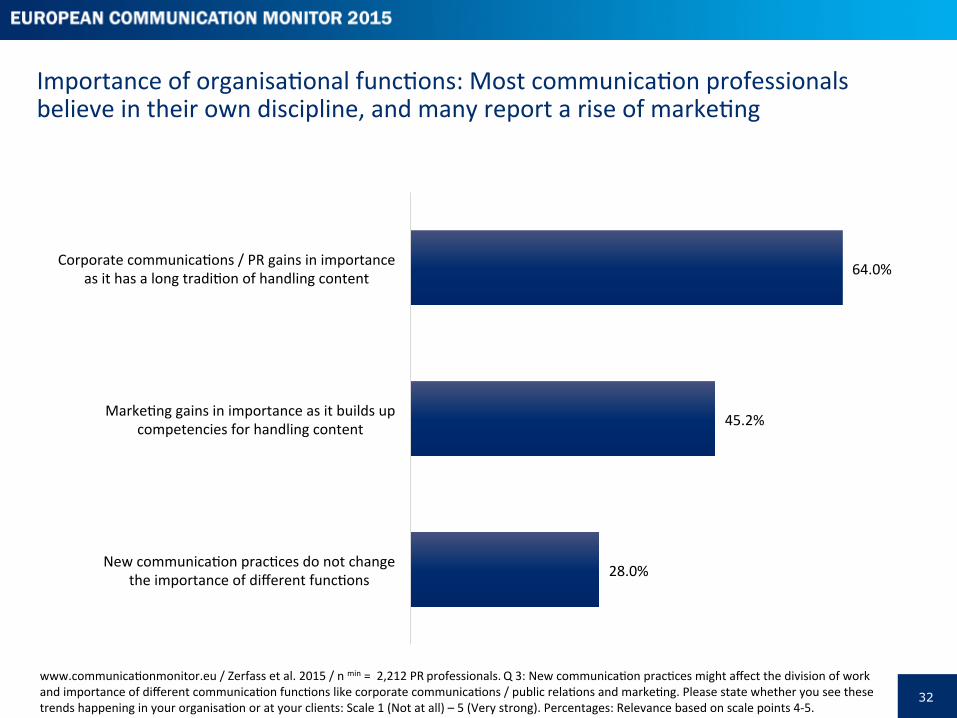
85.6 per cent of respondents in this study believe that there is an overall need to integrate communicaPon acPviPes which affect all funcPons. But comparison to the monitor research from 2011 shows that there is hardly any progress in integraPng communicaPon by intra-‐organisaPonal collaboraPon: Pes between funcPons have not been strengthened during the last five years. CollaboraPon is stronger in publicly traded (joint stock) and private companies, and weaker in non-‐profit and governmental organisaPons. Nearly two thirds of respondents report that corporate communicaPon is gaining in importance as it has a long tradiPon of handling content, while nearly half of respondents (64.0 per cent) also see markePng gaining in importance (45.2 per cent) as a consequence of the same processes.
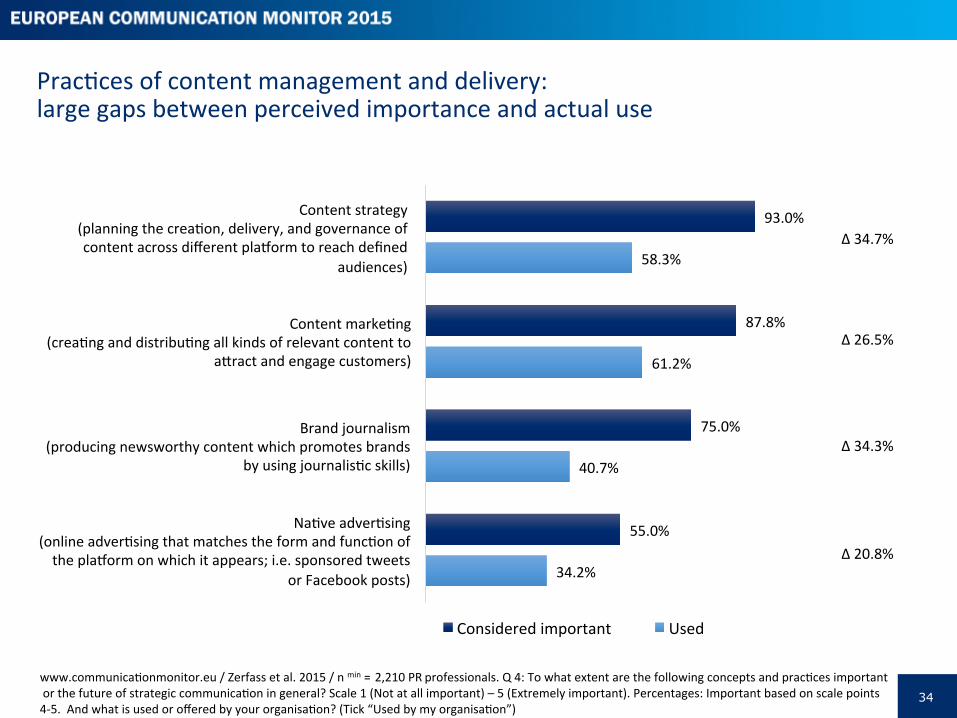
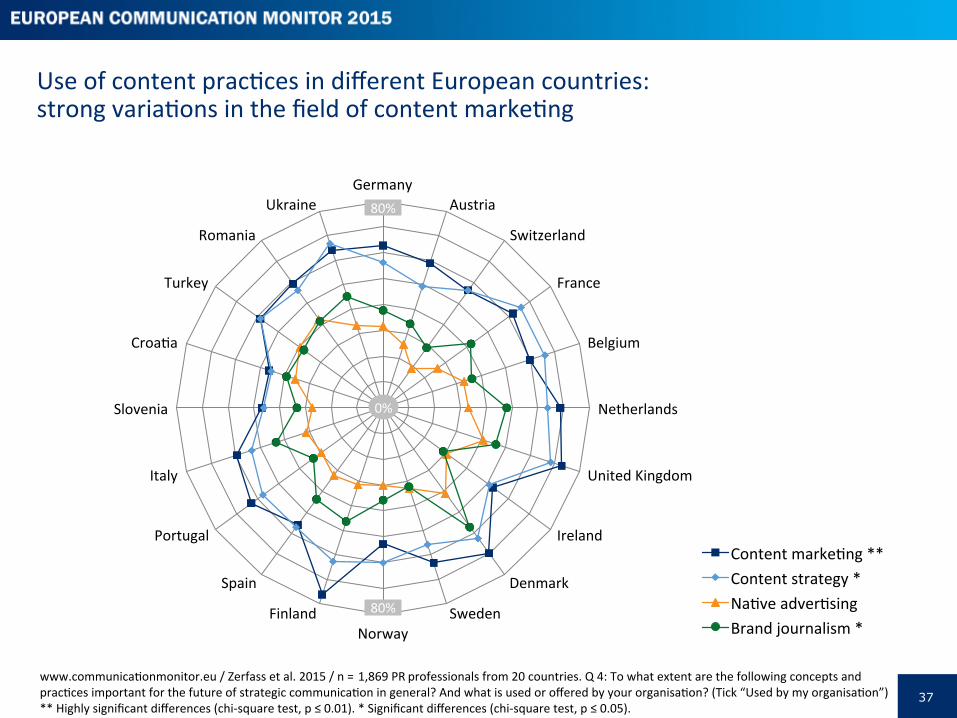
Researchers are somePmes slow in addressing newly popular concepts of content strategy, brand journalism, content markePng and naPve adverPsing (Bull, 2013; Hallahan, 2014; Halvorson & Rach, 2012; Light, 2014; Pulizzi, 2014, Rockley & Cooper, 2012) as if they are only passing hypes. CommunicaPon professionals in Europe, however, perceive these concepts as very important: content strategy 93.0 per cent, content markePng 87.8 per cent, brand journalism 75.0 per cent, and naPve adverPsing 55.0 per cent, with strong gaps from 20.8 to 34.7 per cent when compared to their actual usage. There are significant differences between countries. For example, content markePng has high usage in the United Kingdom (72.6 per cent) as well as Finland (76.1 per cent), compared to Slovenia (47.1 per cent) and CroaPa (46.4 per cent) who are slow movers in this respect. Major differences were also found for the usage of content strategy as well as brand journalism – the lamer pracPce being very popular in Danish (57.1 per cent), Dutch (47.9 per cent), and BriPsh (45.9 per cent) organisaPons.
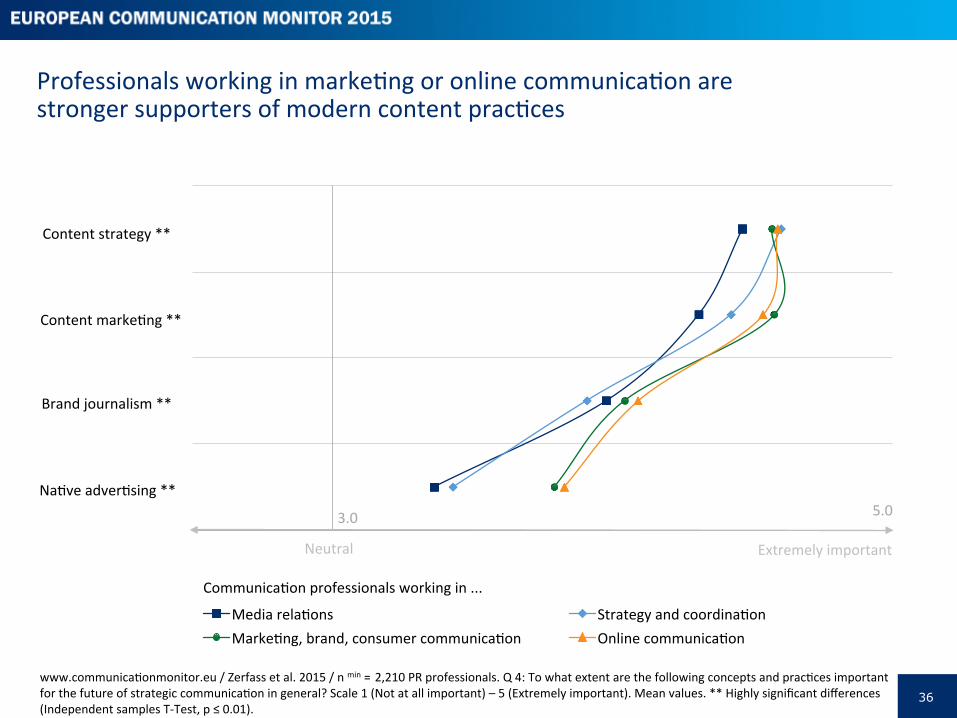
MarkePng, brand, consumer and online communicators are more in favour of these concepts than media relaPons or strategy and coordinaPon people. There seems to be a defensive and conservaPve tendency at work here involving “tradiPonal” public relaPons funcPons (e.g. media relaPons). Instead of using the integraPon of communicaPon funcPons as an opportunity, also to organise an umbrella under which communicaPons from markePng departments could migrate and feel welcome, many seem try to preserve their turf in what is a diminishing territory. Media are not what they used to be and the demarcaPon line between news and adverPsing is becoming fuzzy. There is no way that the lines between adverPsing/markePng and publicity/public relaPons could stay untouched. The quesPon is not if different communicaPons funcPons will integrate; the quesPon is how and with what effect they will.
28
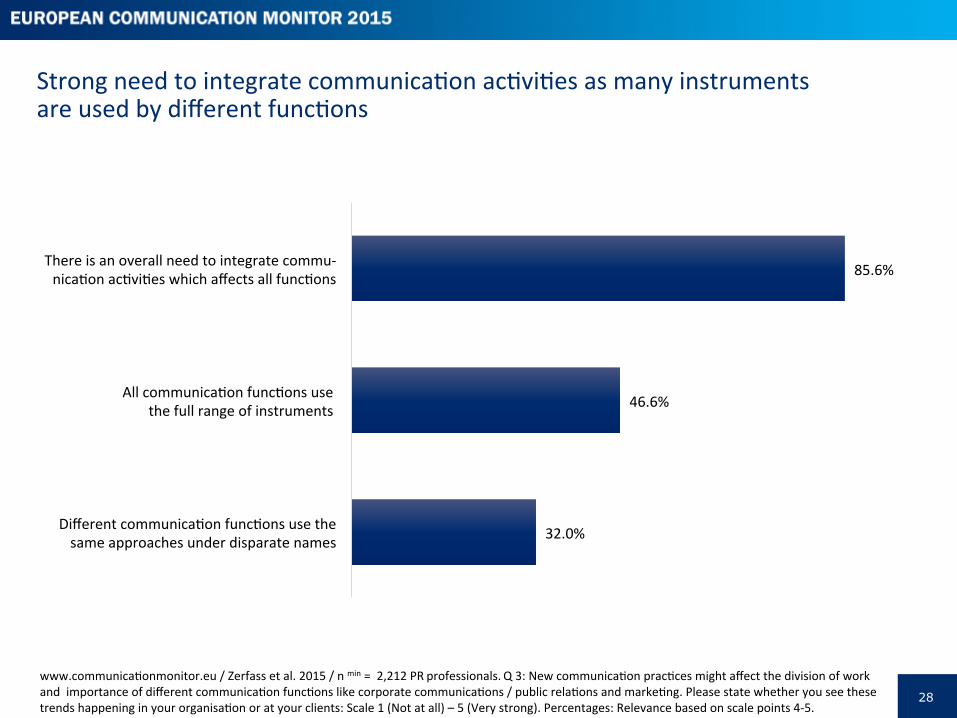
Strong need to integrate communicaPon acPviPes as many instruments are used by different funcPons
www.communicaPonmonitor.eu / Zerfass et al. 2015 / n min = 2,212 PR professionals. Q 3: New communicaPon pracPces might affect the division of work and importance of different communicaPon funcPons like corporate communicaPons / public relaPons and markePng. Please state whether you see these trends happening in your organisaPon or at your clients: Scale 1 (Not at all) – 5 (Very strong). Percentages: Relevance based on scale points 4-‐5.
85.6%
46.6%
32.0%
There is an overall need to integrate commu-‐ nicaPon acPviPes which affects all funcPons
All communicaPon funcPons use the full range of instruments
Different communicaPon funcPons use the same approaches under disparate names
29
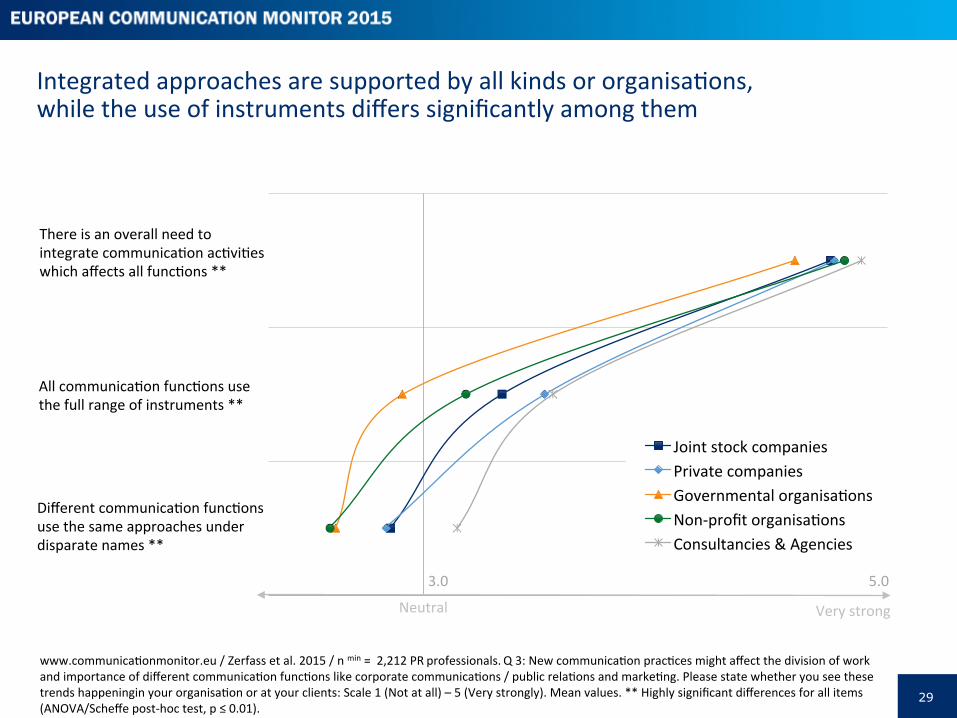
Integrated approaches are supported by all kinds or organisaPons, while the use of instruments differs significantly among them
www.communicaPonmonitor.eu / Zerfass et al. 2015 / n min = 2,212 PR professionals. Q 3: New communicaPon pracPces might affect the division of work and importance of different communicaPon funcPons like corporate communicaPons / public relaPons and markePng. Please state whether you see these trends happeningin your organisaPon or at your clients: Scale 1 (Not at all) – 5 (Very strongly). Mean values. ** Highly significant differences for all items (ANOVA/Scheffe post-‐hoc test, p ≤ 0.01).
Joint stock companies Private companies Governmental organisaPons Non-‐profit organisaPons Consultancies & Agencies
All communicaPon funcPons use the full range of instruments **
There is an overall need to integrate communicaPon acPviPes which affects all funcPons **
Different communicaPon funcPons use the same approaches under disparate names **
Neutral Very strong
3.0 5.0
30
IntegraPng communicaPon by intra-‐organisaPonal collaboraPon: Pes between funcPons have not been strengthened during the last years
CEO / president (highest ranking
execuPve)
Other members of the execuPve
board
MarkePng department
Strategy and organisaPonal
development unit
Human resources department Legal department Financial
department AudiPng and
controlling unit
2015 84.8% 78.9% 72.4% 58.8% 54.3% 42.8% 41.5% 21.8%
2011 86.6% 78.0% 77.1% 61.7% 54.1% 44.4% 39.1% 19.3%
The communica0on func0on works always closely with the …
www.communicaPonmonitor.eu / Zerfass et al. 2015 / n = 1,601 PR professionals in communicaPon departments; Q 8. Zerfass et al. 2011 / n = 1,450. Q 17: How closely does the communicaPon funcPon in your organisaPon work with the … Scale 1 (Never) – 5 (Always). Percentages: Frequency based on scale points 4-‐5.
31
CollaboraPon with markePng, human resources, legal, and other funcPons differs significantly in various types of organisaPons
Joint stock companies Private companies Governmental organisaPons Non-‐profit organisaPons
Human resources department **
CEO / president (highest ranking execuPve) *
Other members of the execuPve board *
Strategy and organisaPonal development unit
Legal department **
Never Always
Financial department **
MarkePng department **
AudiPng and controlling unit **
www.communicaPonmonitor.eu / Zerfass et al. 2015 / n = 1,601 PR professionals in communicaPon departments. Q 17: How closely does the communicaPon funcPon in your organisaPon work with the … Scale 1 (Never) – 5 (Always). Mean values. ** Highly significant differences (ANOVA/Scheffe post-‐hoc test, p ≤ 0.01). * Significant differences (ANOVA/Scheffe post-‐hoc test, p ≤ 0.05).
2.5 3.0 4.0
The communica0on func0on works always closely with the …
32
Importance of organisaPonal funcPons: Most communicaPon professionals believe in their own discipline, and many report a rise of markePng
www.communicaPonmonitor.eu / Zerfass et al. 2015 / n min = 2,212 PR professionals. Q 3: New communicaPon pracPces might affect the division of work and importance of different communicaPon funcPons like corporate communicaPons / public relaPons and markePng. Please state whether you see these trends happening in your organisaPon or at your clients: Scale 1 (Not at all) – 5 (Very strong). Percentages: Relevance based on scale points 4-‐5.
64.0%
45.2%
28.0%
Corporate communicaPons / PR gains in importance as it has a long tradiPon of handling content
MarkePng gains in importance as it builds up competencies for handling content
New communicaPon pracPces do not change the importance of different funcPons
33
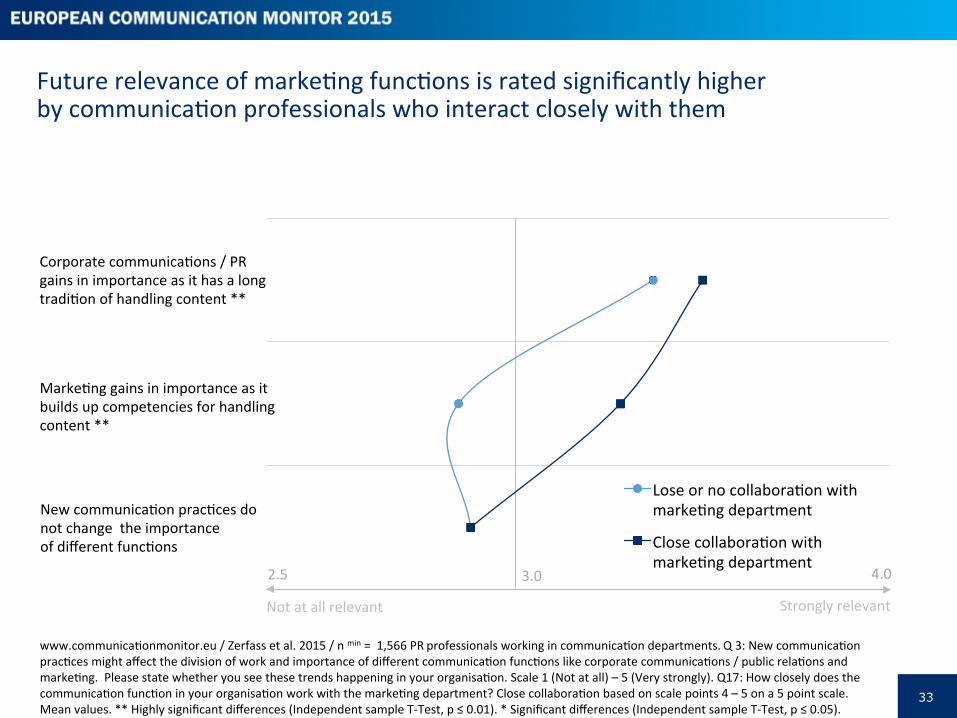
Lose or no collaboraPon with markePng department
Close collaboraPon with markePng department
Not at all relevant Strongly relevant
New communicaPon pracPces do not change the importance of different funcPons
MarkePng gains in importance as it builds up competencies for handling content **
Corporate communicaPons / PR gains in importance as it has a long tradiPon of handling content **
Future relevance of markePng funcPons is rated significantly higher by communicaPon professionals who interact closely with them
www.communicaPonmonitor.eu / Zerfass et al. 2015 / n min = 1,566 PR professionals working in communicaPon departments. Q 3: New communicaPon pracPces might affect the division of work and importance of different communicaPon funcPons like corporate communicaPons / public relaPons and markePng. Please state whether you see these trends happening in your organisaPon. Scale 1 (Not at all) – 5 (Very strongly). Q17: How closely does the communicaPon funcPon in your organisaPon work with the markePng department? Close collaboraPon based on scale points 4 – 5 on a 5 point scale. Mean values. ** Highly significant differences (Independent sample T-‐Test, p ≤ 0.01). * Significant differences (Independent sample T-‐Test, p ≤ 0.05).
2.5 3.0 4.0
34
PracPces of content management and delivery: large gaps between perceived importance and actual use
34.2%
40.7%
61.2%
58.3%
55.0%
75.0%
87.8%
93.0%
NaPve adverPsing (online adverPsing that matches the form and funcPon of the plaaorm on which it appears; i.e. sponsored tweets
or Facebook posts)
Brand journalism (producing newsworthy content which promotes brands
by using journalisPc skills)
Content markePng (creaPng and distribuPng all kinds of relevant content to
amract and engage customers)
Content strategy (planning the creaPon, delivery, and governance of content across different plaaorm to reach defined
audiences)
Considered important Used
www.communicaPonmonitor.eu / Zerfass et al. 2015 / n min = 2,210 PR professionals. Q 4: To what extent are the following concepts and pracPces important or the future of strategic communicaPon in general? Scale 1 (Not at all important) – 5 (Extremely important). Percentages: Important based on scale points 4-‐5. And what is used or offered by your organisaPon? (Tick “Used by my organisaPon”)
Δ 34.7%
Δ 26.5%
Δ 34.3%
Δ 20.8%
35
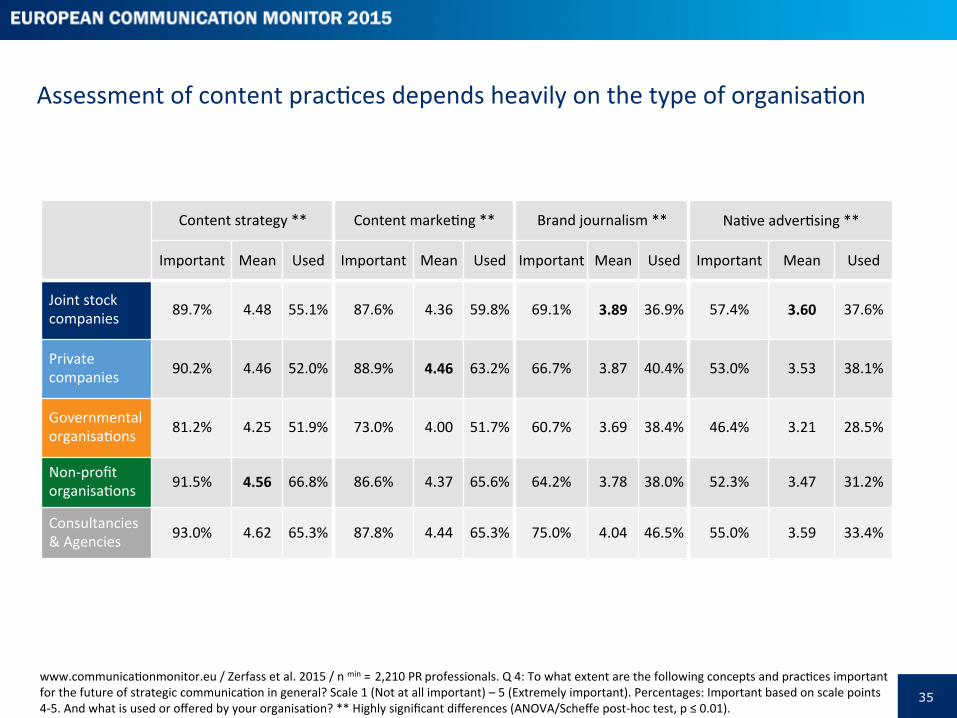
Assessment of content pracPces depends heavily on the type of organisaPon
Content strategy ** Content markePng ** Brand journalism ** NaPve adverPsing **
Important Mean Used Important Mean Used Important Mean Used Important Mean Used
Joint stock companies 89.7% 4.48 55.1% 87.6% 4.36 59.8% 69.1% 3.89 36.9% 57.4% 3.60 37.6%
Private companies 90.2% 4.46 52.0% 88.9% 4.46 63.2% 66.7% 3.87 40.4% 53.0% 3.53 38.1%
Governmental organisaPons 81.2% 4.25 51.9% 73.0% 4.00 51.7% 60.7% 3.69 38.4% 46.4% 3.21 28.5%
Non-‐profit organisaPons 91.5% 4.56 66.8% 86.6% 4.37 65.6% 64.2% 3.78 38.0% 52.3% 3.47 31.2%
Consultancies & Agencies 93.0% 4.62 65.3% 87.8% 4.44 65.3% 75.0% 4.04 46.5% 55.0% 3.59 33.4%
www.communicaPonmonitor.eu / Zerfass et al. 2015 / n min = 2,210 PR professionals. Q 4: To what extent are the following concepts and pracPces important for the future of strategic communicaPon in general? Scale 1 (Not at all important) – 5 (Extremely important). Percentages: Important based on scale points 4-‐5. And what is used or offered by your organisaPon? ** Highly significant differences (ANOVA/Scheffe post-‐hoc test, p ≤ 0.01).
36
Professionals working in markePng or online communicaPon are stronger supporters of modern content pracPces
www.communicaPonmonitor.eu / Zerfass et al. 2015 / n min = 2,210 PR professionals. Q 4: To what extent are the following concepts and pracPces important for the future of strategic communicaPon in general? Scale 1 (Not at all important) – 5 (Extremely important). Mean values. ** Highly significant differences (Independent samples T-‐Test, p ≤ 0.01).
Media relaPons Strategy and coordinaPon MarkePng, brand, consumer communicaPon Online communicaPon
Brand journalism **
Content strategy **
Content markePng **
Neutral Extremely important
NaPve adverPsing **
3.0 5.0
CommunicaPon professionals working in ...
37
Use of content pracPces in different European countries: strong variaPons in the field of content markePng
www.communicaPonmonitor.eu / Zerfass et al. 2015 / n = 1,869 PR professionals from 20 countries. Q 4: To what extent are the following concepts and pracPces important for the future of strategic communicaPon in general? And what is used or offered by your organisaPon? (Tick “Used by my organisaPon”) ** Highly significant differences (chi-‐square test, p ≤ 0.01). * Significant differences (chi-‐square test, p ≤ 0.05).
Germany Austria
Switzerland
France
Belgium
Netherlands
United Kingdom
Ireland
Denmark
Sweden Norway
Finland
Spain
Portugal
Italy
Slovenia
CroaPa
Turkey
Romania
Ukraine
Content markePng ** Content strategy * NaPve adverPsing Brand journalism *
0%
80%
80%
Strategic issues and value contribu=on

39
Chapter overview
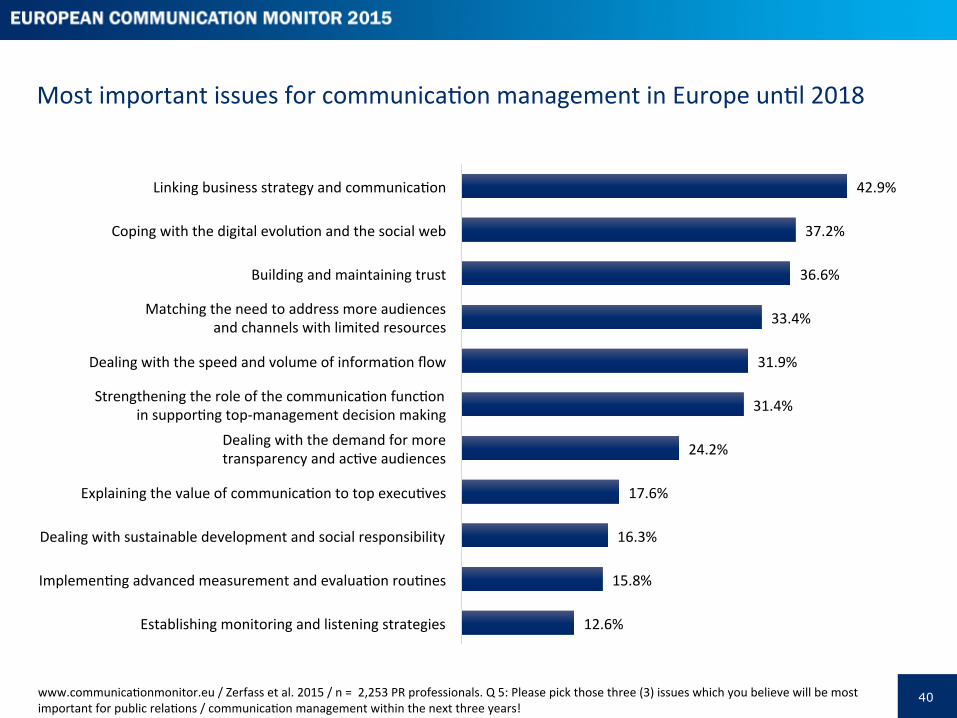
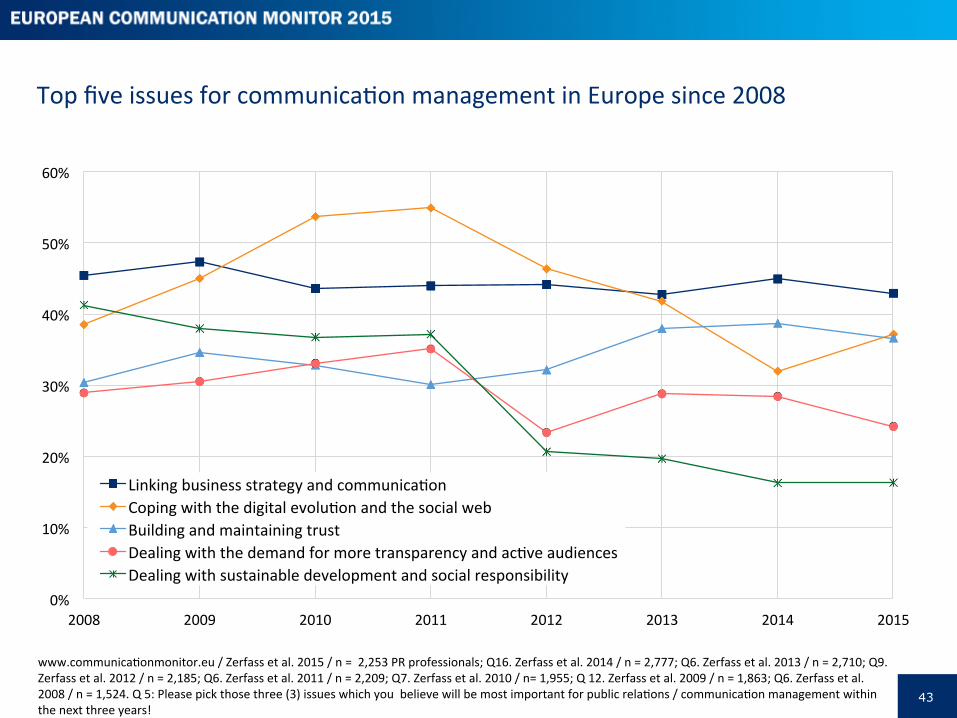
“Linking communicaPon and business strategy” has been idenPfied as the most enduring challenge for communicaPon professionals in previous ECM surveys (Verčič et al., 2014) and academic literature (Steyn, 2007). Each year the European CommunicaPon Monitor asks for the most important challenges for communicaPon management in the next three years. Once again, 42.9 per cent of the 2,253 respondents in this year’s survey stated that the profession has to tackle the ongoing challenge of linking communicaPon and business strategies. This finding reiterates that the profession is conPnuing to strive for a strategic posiPon at the decision-‐making table in order to become a part of the strategic management of an organisaPon (Cornelissen et al., 2013; Verčič & Grunig 2002).
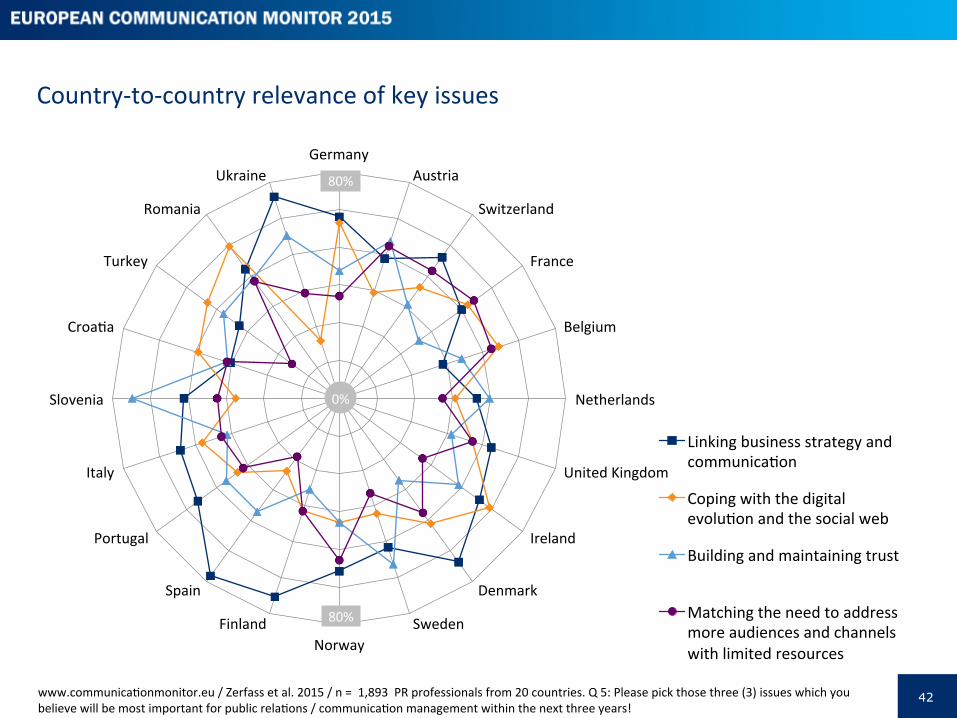
Looking forward for the next three years to 2018, European communicators regard “Coping with the digital evoluPon and the social web” as the second most important challenge as it has returned to second place (37.2 per cent) in the list, aper dipping to third last year. Meanwhile “Building and maintaining trust” is in the close third posiPon (36.6 per cent). There are, however, very interesPng differences between countries: “Linking business strategy and communicaPon” is the homest issue in Spain, Finland and Ukraine. “Coping with the digital evoluPon and the social web” is the top issue in Ireland, Belgium, Romania, Turkey and CroaPa; “Building and maintaining trust” is the top issue in Slovenia and Sweden; while in France the top issue is “Matching the needs to address more audiences and channels with limited resources”.
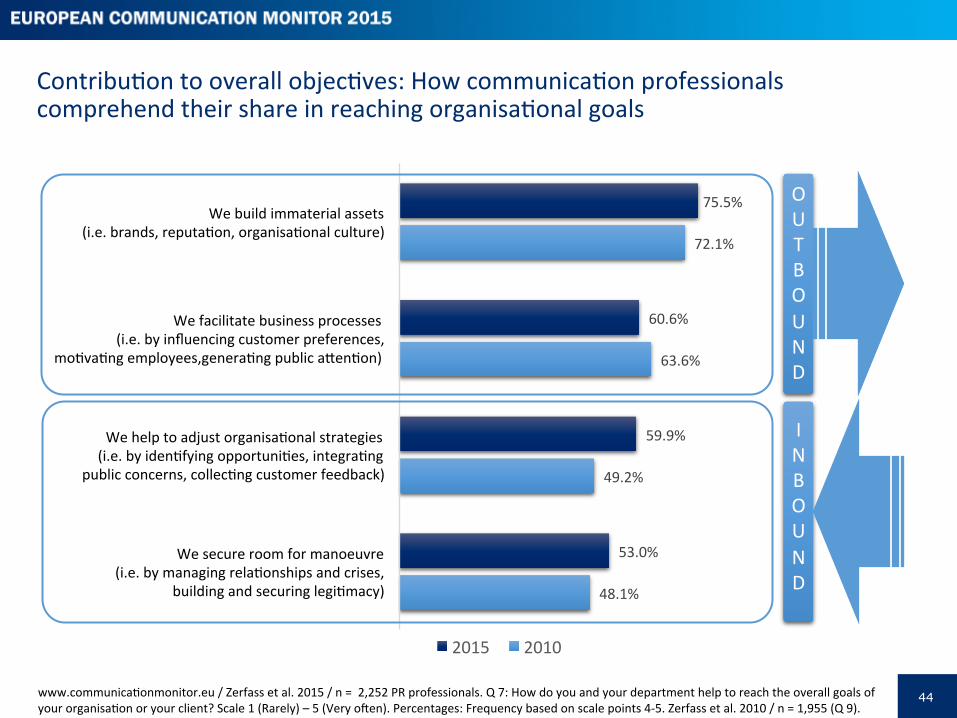
Looking at how communicators and their departments help to reach the overall organisaPonal goals of their organisaPon or client it is interesPng to see how the responses breakdown into inbound and outbound acPviPes. Within these divides communicators see their major role at the outbound in contribuPng to organisaPonal objecPves by building immaterial assets (brands, reputaPon, culture) and facilitaPng business processes (influencing customer preferences, moPvaPng employees, generaPng public amenPon) and in the inbound by helping to adjust organisaPonal strategies (idenPfying opportuniPes, integraPng public concerns and collecPng customer feedback) and securing room for manoeuvre (by managing relaPonships and crises, building and securing legiPmacy).
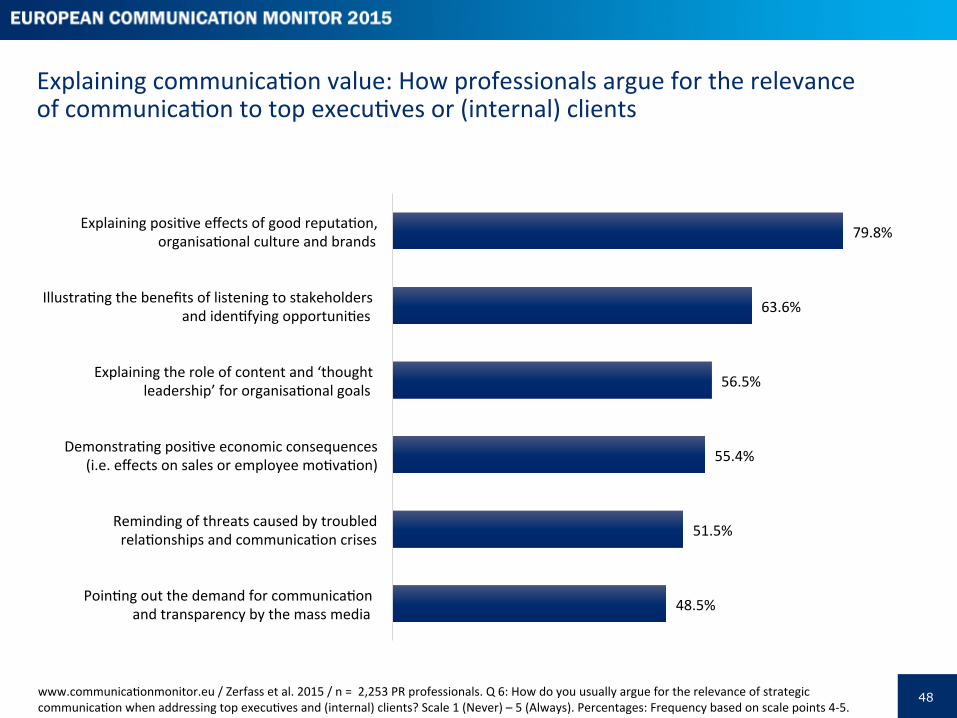
QualitaPve research among chief communicaPon officers in Germany (Kiesenbauer & Zerfass, 2015) showed that communicators use various strategies to explain what they do and why. When considering how communicators argue for the jusPficaPon and legiPmaPon of communicaPon to top execuPves and internal clients there are some interesPng results from this survey. The major way the respon-‐dents state they argue for the relevance of communicaPon is by explaining the posiPve effects of good reputaPon, organisaPonal culture and brands (79.8 per cent). This is followed by illustraPng the benefits of listening to stakeholders and idenPfying opportuniPes (63.6 per cent); explaining the role of content and “thought leadership” for organisaPonal goals at 56.5 per cent. Only 55.4 per cent claim to demonstrate posiPve economic consequences of communicaPon acPviPes. However, the measurement and evaluaPon chapter of this report emphasises the contradicPon that what respondents claim to do and what they monitor and measure do not match. The majority of acPviPes reported as contribuPng to organisaPonal goals are not monitored and measured, and for that reason it may be hard to defend, explain and legiPmise them to top decision-‐makers.
40
Most important issues for communicaPon management in Europe unPl 2018
www.communicaPonmonitor.eu / Zerfass et al. 2015 / n = 2,253 PR professionals. Q 5: Please pick those three (3) issues which you believe will be most important for public relaPons / communicaPon management within the next three years!
12.6%
15.8%
16.3%
17.6%
24.2%
31.4%
31.9%
33.4%
36.6%
37.2%
42.9%
Establishing monitoring and listening strategies
ImplemenPng advanced measurement and evaluaPon rouPnes
Dealing with sustainable development and social responsibility
Explaining the value of communicaPon to top execuPves
Dealing with the demand for more transparency and acPve audiences
Strengthening the role of the communicaPon funcPon in supporPng top-‐management decision making
Dealing with the speed and volume of informaPon flow
Matching the need to address more audiences and channels with limited resources
Building and maintaining trust
Coping with the digital evoluPon and the social web
Linking business strategy and communicaPon
41
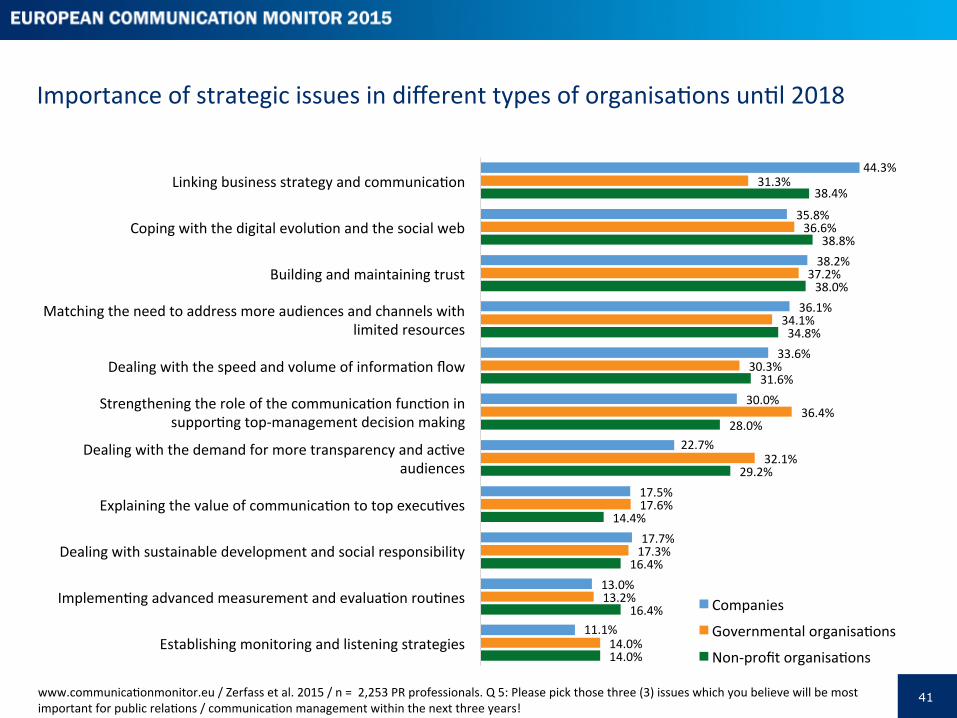
Importance of strategic issues in different types of organisaPons unPl 2018
www.communicaPonmonitor.eu / Zerfass et al. 2015 / n = 2,253 PR professionals. Q 5: Please pick those three (3) issues which you believe will be most important for public relaPons / communicaPon management within the next three years!
44.3%
35.8%
38.2%
36.1%
33.6%
30.0%
22.7%
17.5%
17.7%
13.0%
11.1%
31.3%
36.6%
37.2%
34.1%
30.3%
36.4%
32.1%
17.6%
17.3%
13.2%
14.0%
38.4%
38.8%
38.0%
34.8%
31.6%
28.0%
29.2%
14.4%
16.4%
16.4%
14.0%
Linking business strategy and communicaPon
Coping with the digital evoluPon and the social web
Building and maintaining trust
Matching the need to address more audiences and channels with limited resources
Dealing with the speed and volume of informaPon flow
Strengthening the role of the communicaPon funcPon in supporPng top-‐management decision making
Dealing with the demand for more transparency and acPve audiences
Explaining the value of communicaPon to top execuPves
Dealing with sustainable development and social responsibility
ImplemenPng advanced measurement and evaluaPon rouPnes
Establishing monitoring and listening strategies
Companies
Governmental organisaPons
Non-‐profit organisaPons
42
Country-‐to-‐country relevance of key issues
www.communicaPonmonitor.eu / Zerfass et al. 2015 / n = 1,893 PR professionals from 20 countries. Q 5: Please pick those three (3) issues which you believe will be most important for public relaPons / communicaPon management within the next three years!
Germany Austria
Switzerland
France
Belgium
Netherlands
United Kingdom
Ireland
Denmark
Sweden Norway
Finland
Spain
Portugal
Italy
Slovenia
CroaPa
Turkey
Romania
Ukraine
Linking business strategy and communicaPon
Coping with the digital evoluPon and the social web
Building and maintaining trust
Matching the need to address more audiences and channels with limited resources
0%
80%
80%
43
Top five issues for communicaPon management in Europe since 2008
www.communicaPonmonitor.eu / Zerfass et al. 2015 / n = 2,253 PR professionals; Q16. Zerfass et al. 2014 / n = 2,777; Q6. Zerfass et al. 2013 / n = 2,710; Q9. Zerfass et al. 2012 / n = 2,185; Q6. Zerfass et al. 2011 / n = 2,209; Q7. Zerfass et al. 2010 / n= 1,955; Q 12. Zerfass et al. 2009 / n = 1,863; Q6. Zerfass et al. 2008 / n = 1,524. Q 5: Please pick those three (3) issues which you believe will be most important for public relaPons / communicaPon management within the next three years!
0%
10%
20%
30%
40%
50%
60%
2008 2009 2010 2011 2012 2013 2014 2015
Linking business strategy and communicaPon Coping with the digital evoluPon and the social web Building and maintaining trust Dealing with the demand for more transparency and acPve audiences Dealing with sustainable development and social responsibility
44
75.5%
60.6%
59.9%
53.0%
72.1%
63.6%
49.2%
48.1%
We build immaterial assets (i.e. brands, reputaPon, organisaPonal culture)
We facilitate business processes (i.e. by influencing customer preferences, moPvaPng employees,generaPng public amenPon)
We help to adjust organisaPonal strategies (i.e. by idenPfying opportuniPes, integraPng public concerns, collecPng customer feedback)
We secure room for manoeuvre (i.e. by managing relaPonships and crises, building and securing legiPmacy)
2015 2010
ContribuPon to overall objecPves: How communicaPon professionals comprehend their share in reaching organisaPonal goals
www.communicaPonmonitor.eu / Zerfass et al. 2015 / n = 2,252 PR professionals. Q 7: How do you and your department help to reach the overall goals of your organisaPon or your client? Scale 1 (Rarely) – 5 (Very open). Percentages: Frequency based on scale points 4-‐5. Zerfass et al. 2010 / n = 1,955 (Q 9).
O U T B O U N D
I N B O U N D
45
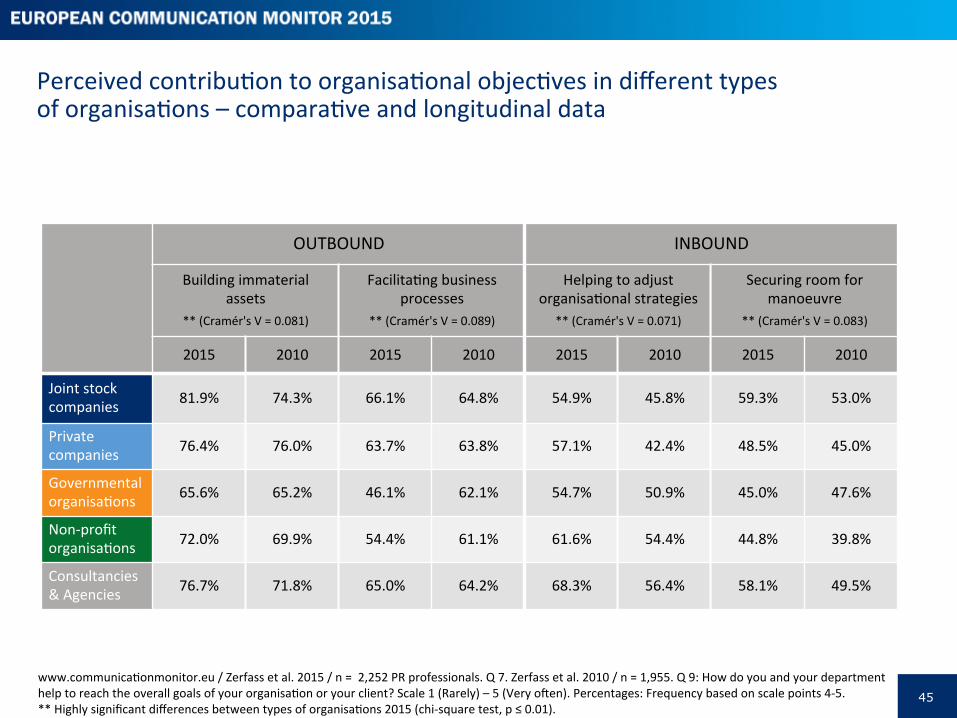
Perceived contribuPon to organisaPonal objecPves in different types of organisaPons – comparaPve and longitudinal data
OUTBOUND INBOUND
Building immaterial assets
** (Cramér's V = 0.081)
FacilitaPng business processes
** (Cramér's V = 0.089)
Helping to adjust organisaPonal strategies
** (Cramér's V = 0.071)
Securing room for manoeuvre
** (Cramér's V = 0.083)
2015 2010 2015 2010 2015 2010 2015 2010
Joint stock companies 81.9% 74.3% 66.1% 64.8% 54.9% 45.8% 59.3% 53.0%
Private companies 76.4% 76.0% 63.7% 63.8% 57.1% 42.4% 48.5% 45.0%
Governmental organisaPons 65.6% 65.2% 46.1% 62.1% 54.7% 50.9% 45.0% 47.6%
Non-‐profit organisaPons 72.0% 69.9% 54.4% 61.1% 61.6% 54.4% 44.8% 39.8%
Consultancies & Agencies 76.7% 71.8% 65.0% 64.2% 68.3% 56.4% 58.1% 49.5%
www.communicaPonmonitor.eu / Zerfass et al. 2015 / n = 2,252 PR professionals. Q 7. Zerfass et al. 2010 / n = 1,955. Q 9: How do you and your department help to reach the overall goals of your organisaPon or your client? Scale 1 (Rarely) – 5 (Very open). Percentages: Frequency based on scale points 4-‐5. ** Highly significant differences between types of organisaPons 2015 (chi-‐square test, p ≤ 0.01).
46
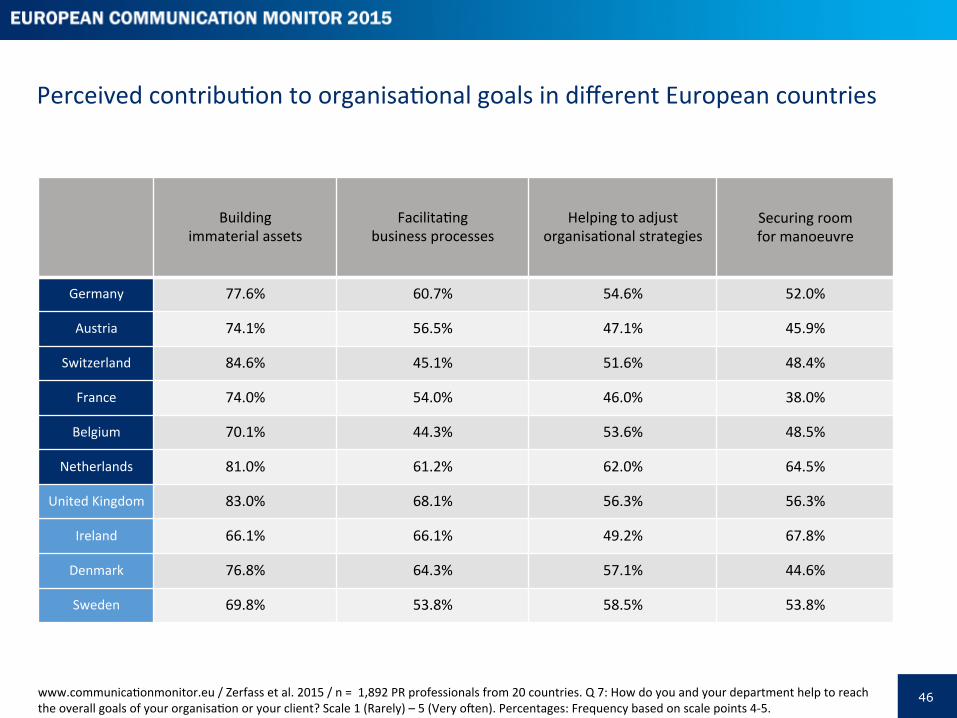
Perceived contribuPon to organisaPonal goals in different European countries
www.communicaPonmonitor.eu / Zerfass et al. 2015 / n = 1,892 PR professionals from 20 countries. Q 7: How do you and your department help to reach the overall goals of your organisaPon or your client? Scale 1 (Rarely) – 5 (Very open). Percentages: Frequency based on scale points 4-‐5.
Building immaterial assets
FacilitaPng business processes
Helping to adjust organisaPonal strategies
Securing room for manoeuvre
Germany 77.6% 60.7% 54.6% 52.0%
Austria 74.1% 56.5% 47.1% 45.9%
Switzerland 84.6% 45.1% 51.6% 48.4%
France 74.0% 54.0% 46.0% 38.0%
Belgium 70.1% 44.3% 53.6% 48.5%
Netherlands 81.0% 61.2% 62.0% 64.5%
United Kingdom 83.0% 68.1% 56.3% 56.3%
Ireland 66.1% 66.1% 49.2% 67.8%
Denmark 76.8% 64.3% 57.1% 44.6%
Sweden 69.8% 53.8% 58.5% 53.8%
47
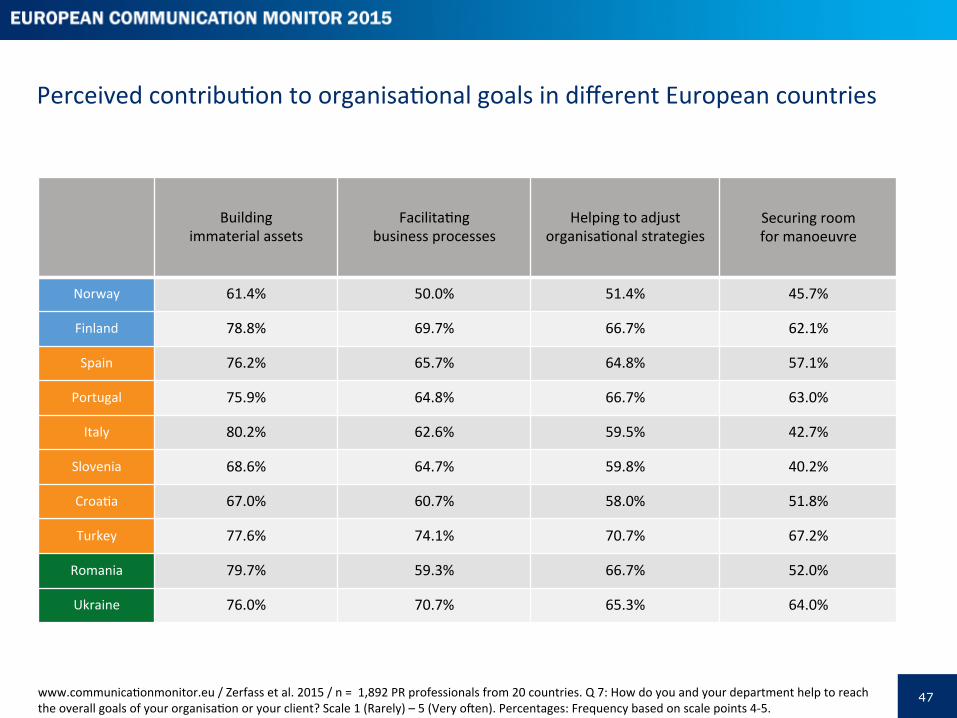
Perceived contribuPon to organisaPonal goals in different European countries
Building immaterial assets
FacilitaPng business processes
Helping to adjust organisaPonal strategies
Securing room for manoeuvre
Norway 61.4% 50.0% 51.4% 45.7%
Finland 78.8% 69.7% 66.7% 62.1%
Spain 76.2% 65.7% 64.8% 57.1%
Portugal 75.9% 64.8% 66.7% 63.0%
Italy 80.2% 62.6% 59.5% 42.7%
Slovenia 68.6% 64.7% 59.8% 40.2%
CroaPa 67.0% 60.7% 58.0% 51.8%
Turkey 77.6% 74.1% 70.7% 67.2%
Romania 79.7% 59.3% 66.7% 52.0%
Ukraine 76.0% 70.7% 65.3% 64.0%
www.communicaPonmonitor.eu / Zerfass et al. 2015 / n = 1,892 PR professionals from 20 countries. Q 7: How do you and your department help to reach the overall goals of your organisaPon or your client? Scale 1 (Rarely) – 5 (Very open). Percentages: Frequency based on scale points 4-‐5.
48
Explaining communicaPon value: How professionals argue for the relevance of communicaPon to top execuPves or (internal) clients
www.communicaPonmonitor.eu / Zerfass et al. 2015 / n = 2,253 PR professionals. Q 6: How do you usually argue for the relevance of strategic communicaPon when addressing top execuPves and (internal) clients? Scale 1 (Never) – 5 (Always). Percentages: Frequency based on scale points 4-‐5.
79.8%
63.6%
56.5%
55.4%
51.5%
48.5%
Explaining posiPve effects of good reputaPon, organisaPonal culture and brands
IllustraPng the benefits of listening to stakeholders and idenPfying opportuniPes
Explaining the role of content and ‘thought leadership’ for organisaPonal goals
DemonstraPng posiPve economic consequences (i.e. effects on sales or employee moPvaPon)
Reminding of threats caused by troubled relaPonships and communicaPon crises
PoinPng out the demand for communicaPon and transparency by the mass media
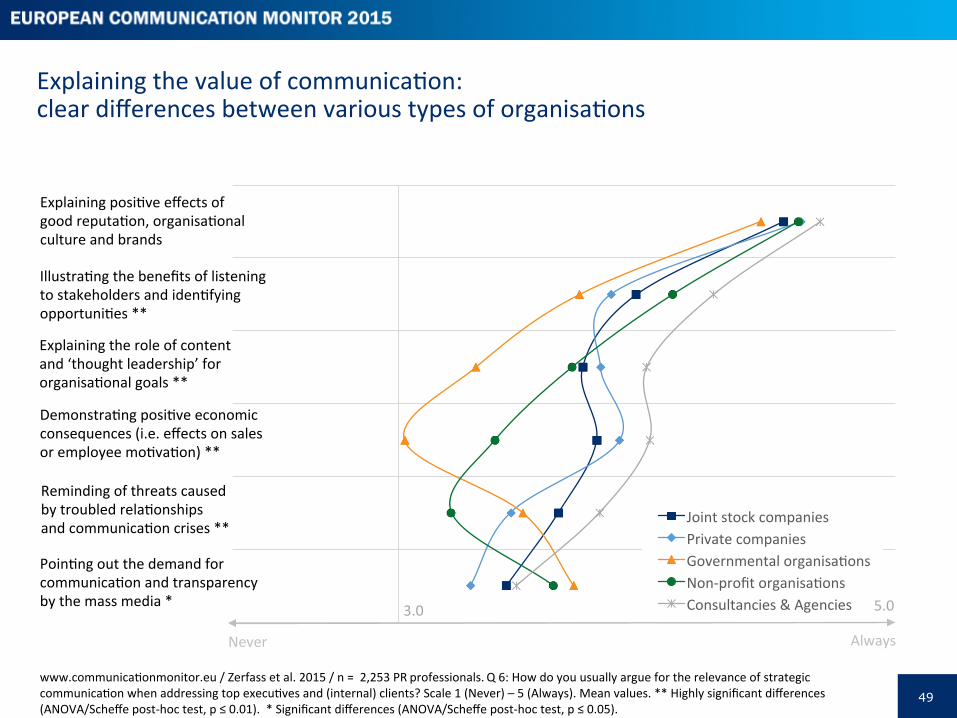
49
Joint stock companies Private companies Governmental organisaPons Non-‐profit organisaPons Consultancies & Agencies
DemonstraPng posiPve economic consequences (i.e. effects on sales or employee moPvaPon) **
Explaining posiPve effects of good reputaPon, organisaPonal culture and brands
IllustraPng the benefits of listening to stakeholders and idenPfying opportuniPes **
Explaining the role of content and ‘thought leadership’ for organisaPonal goals **
PoinPng out the demand for communicaPon and transparency by the mass media *
Reminding of threats caused by troubled relaPonships and communicaPon crises **
Explaining the value of communicaPon: clear differences between various types of organisaPons
www.communicaPonmonitor.eu / Zerfass et al. 2015 / n = 2,253 PR professionals. Q 6: How do you usually argue for the relevance of strategic communicaPon when addressing top execuPves and (internal) clients? Scale 1 (Never) – 5 (Always). Mean values. ** Highly significant differences (ANOVA/Scheffe post-‐hoc test, p ≤ 0.01). * Significant differences (ANOVA/Scheffe post-‐hoc test, p ≤ 0.05).
Always Never
3.0 5.0
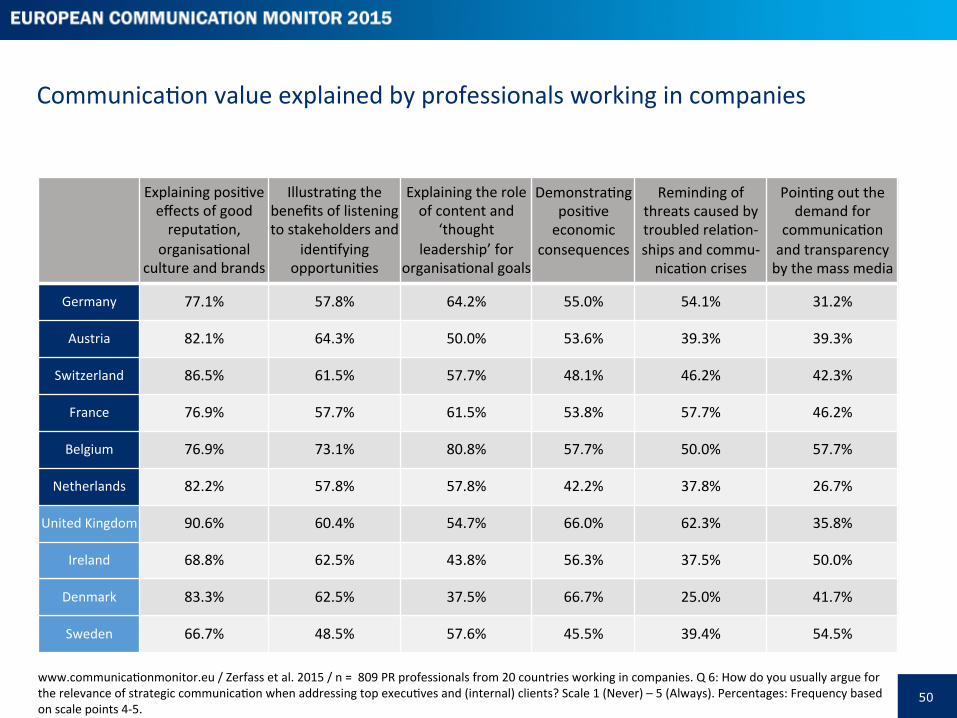
50
CommunicaPon value explained by professionals working in companies
www.communicaPonmonitor.eu / Zerfass et al. 2015 / n = 809 PR professionals from 20 countries working in companies. Q 6: How do you usually argue for the relevance of strategic communicaPon when addressing top execuPves and (internal) clients? Scale 1 (Never) – 5 (Always). Percentages: Frequency based on scale points 4-‐5.
Explaining posiPve effects of good reputaPon,
organisaPonal culture and brands
IllustraPng the benefits of listening to stakeholders and
idenPfying opportuniPes
Explaining the role of content and
‘thought leadership’ for
organisaPonal goals
DemonstraPng posiPve economic
consequences
Reminding of threats caused by troubled relaPon-‐ships and commu-‐nicaPon crises
PoinPng out the demand for
communicaPon and transparency by the mass media
Germany 77.1% 57.8% 64.2% 55.0% 54.1% 31.2%
Austria 82.1% 64.3% 50.0% 53.6% 39.3% 39.3%
Switzerland 86.5% 61.5% 57.7% 48.1% 46.2% 42.3%
France 76.9% 57.7% 61.5% 53.8% 57.7% 46.2%
Belgium 76.9% 73.1% 80.8% 57.7% 50.0% 57.7%
Netherlands 82.2% 57.8% 57.8% 42.2% 37.8% 26.7%
United Kingdom 90.6% 60.4% 54.7% 66.0% 62.3% 35.8%
Ireland 68.8% 62.5% 43.8% 56.3% 37.5% 50.0%
Denmark 83.3% 62.5% 37.5% 66.7% 25.0% 41.7%
Sweden 66.7% 48.5% 57.6% 45.5% 39.4% 54.5%
51
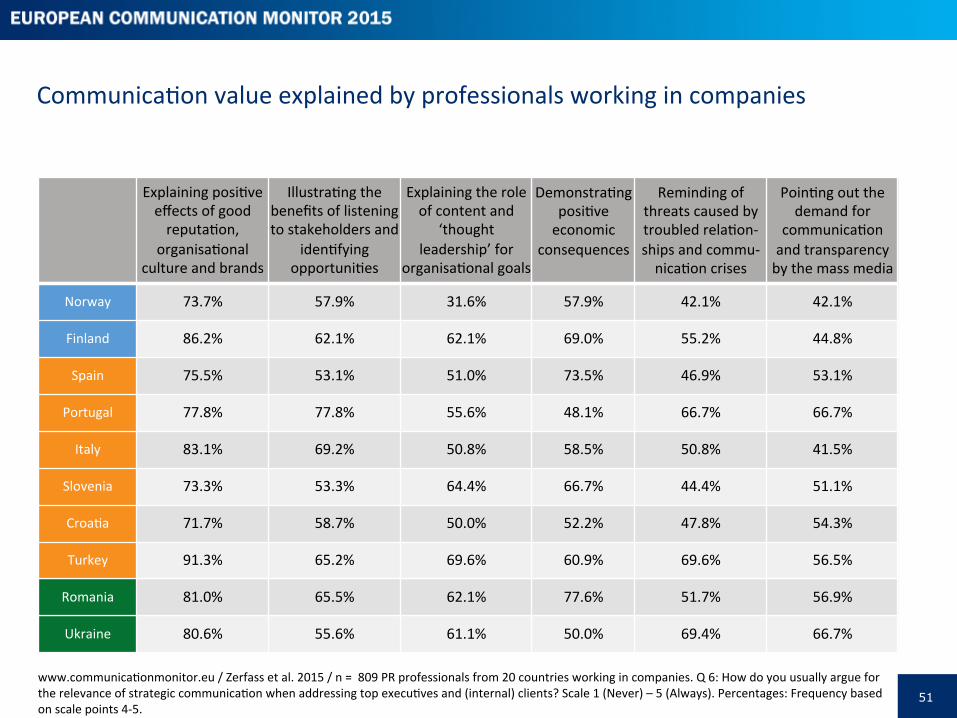
CommunicaPon value explained by professionals working in companies
www.communicaPonmonitor.eu / Zerfass et al. 2015 / n = 809 PR professionals from 20 countries working in companies. Q 6: How do you usually argue for the relevance of strategic communicaPon when addressing top execuPves and (internal) clients? Scale 1 (Never) – 5 (Always). Percentages: Frequency based on scale points 4-‐5.
Explaining posiPve effects of good reputaPon,
organisaPonal culture and brands
IllustraPng the benefits of listening to stakeholders and
idenPfying opportuniPes
Explaining the role of content and
‘thought leadership’ for
organisaPonal goals
DemonstraPng posiPve economic
consequences
Reminding of threats caused by troubled relaPon-‐ships and commu-‐ nicaPon crises
PoinPng out the demand for
communicaPon and transparency by the mass media
Norway 73.7% 57.9% 31.6% 57.9% 42.1% 42.1%
Finland 86.2% 62.1% 62.1% 69.0% 55.2% 44.8%
Spain 75.5% 53.1% 51.0% 73.5% 46.9% 53.1%
Portugal 77.8% 77.8% 55.6% 48.1% 66.7% 66.7%
Italy 83.1% 69.2% 50.8% 58.5% 50.8% 41.5%
Slovenia 73.3% 53.3% 64.4% 66.7% 44.4% 51.1%
CroaPa 71.7% 58.7% 50.0% 52.2% 47.8% 54.3%
Turkey 91.3% 65.2% 69.6% 60.9% 69.6% 56.5%
Romania 81.0% 65.5% 62.1% 77.6% 51.7% 56.9%
Ukraine 80.6% 55.6% 61.1% 50.0% 69.4% 66.7%
Communica=on strategies and organisa=onal listening
53
Chapter overview
While listening to stakeholders and idenPfying opportuniPes is the second most important way in which communicators argue for their relevance towards their superiors, in many organisaPons listening strategies are open neglected. Macnamara (2013, 2014c) has idenPfied the need to create and maintain audiences and the “work of listening”, which become all the more challenging in an environment of simultaneous audience fragmentaPon and proliferaPng media channels and speakers. Pestana and Daniels (2011) highlighted the importance of research, measurement and listening for dialogue and stakeholder engagement, and Willis (2012) underlined the relevance of face-‐to-‐face communicaPon for community engagement. While 84.7 per cent of organisaPons in this study have an overall communicaPon strategy and nearly 78.3 per cent a messaging strategy or strategies, only 55.6 per cent have also developed an organisaPonal listening strategy or strategies. The most acPve listeners are joint stock (62.9 per cent) and private (56.8 per cent) companies and the least are governmental organisaPons (47.9 per cent). There are also significant differences between countries.
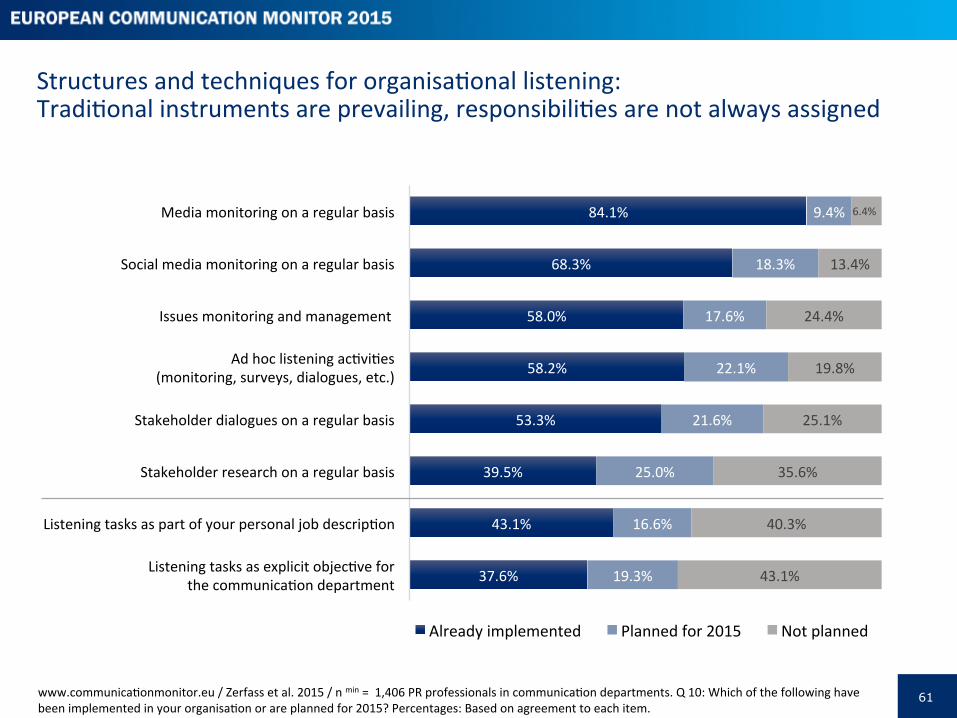
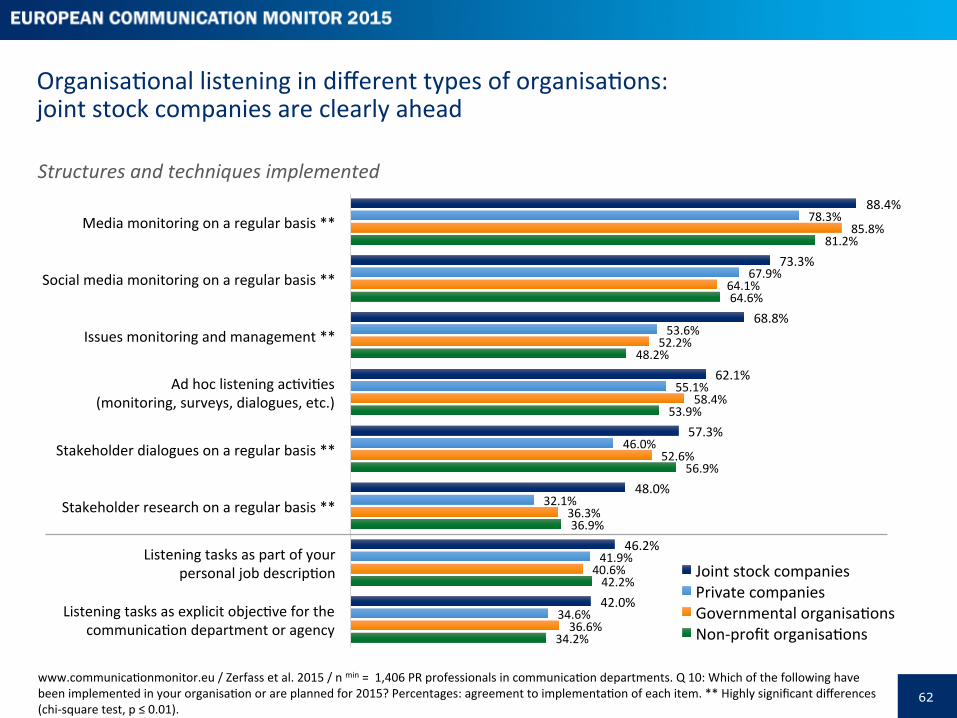
The most important structures and techniques for organisaPonal listening are media monitoring on a regular basis (in 84.1 per cent), social media monitoring (68.3 per cent), ad hoc listening acPviPes (58.2 per cent), issues monitoring and management (58.0 per cent) and regular dialogues with stakeholders (53.3 per cent). It is clear from the findings that joint stock companies lead the way in the pracPce of organisaPonal listening.
The respondents of the ECM 2015, who are mainly coming from the corporate communicaPons and public relaPons field, see themselves in the dominant role in organisaPonal listening. When asked to rate the forerunners in organisaPonal listening they posted firstly the corporate communicaPons/ public relaPons department (76.4 per cent), second the markePng / sales funcPons (49.7%) and thirdly customer relaPons (45.4 per cent). There were some regional differences with markePng and sales reporPng higher importance in France, Finland and Turkey.
An in-‐depth analysis into the idenPficaPon of listening-‐minded communicaPon departments (based on their mindsets and structures) shows that 18.9 per cent of departments can be labelled as being ahead of the rest: they are bemer in contribuPng to overall objecPves by idenPfying opportuniPes, in explaining communicaPon value though the benefits of listening, in implemenPng listening strategies and in spearheading listening within the organisaPon. The main differenPaPng aspect is that they are making listening tasks an explicit objecPve for the communicaPon funcPon (62.0 per cent of listening-‐minded communicaPon departments versus 31.5 per cent of other departments). Listening tasks are also more open a part of the communicators’ job descripPon (in 64.5 per cent of listening-‐minded against 33.4 per cent in other communicaPon funcPons). Other major differences are in conducPng stakeholder research on a regular basis (63.1 per cent against 37.8 per cent), issues monitoring and management (77.8 per cent against 52.8 per cent), and leading stakeholder dialogue on a regular basis (69.9 per cent against 48.9 per cent). The difference between listening-‐minded and other communicaPon funcPons is the smallest in social media monitoring on a regular basis (77.4 per cent against 66.2 per cent).
54
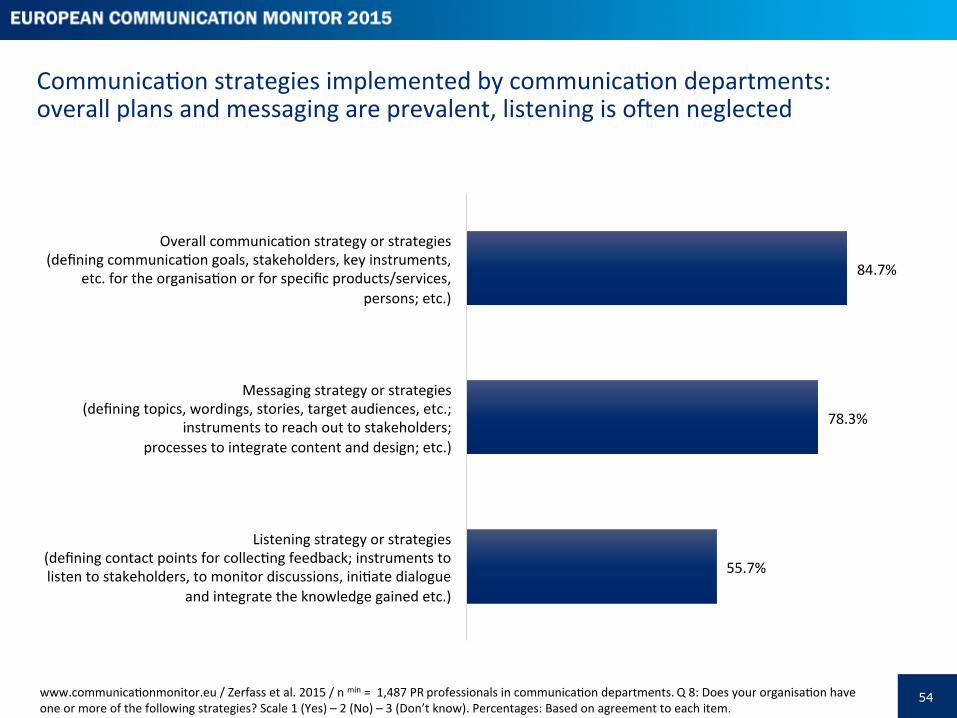
CommunicaPon strategies implemented by communicaPon departments: overall plans and messaging are prevalent, listening is open neglected
www.communicaPonmonitor.eu / Zerfass et al. 2015 / n min = 1,487 PR professionals in communicaPon departments. Q 8: Does your organisaPon have one or more of the following strategies? Scale 1 (Yes) – 2 (No) – 3 (Don’t know). Percentages: Based on agreement to each item.
84.7%
78.3%
55.7%
Overall communicaPon strategy or strategies (defining communicaPon goals, stakeholders, key instruments,
etc. for the organisaPon or for specific products/services, persons; etc.)
Messaging strategy or strategies (defining topics, wordings, stories, target audiences, etc.;
instruments to reach out to stakeholders; processes to integrate content and design; etc.)
Listening strategy or strategies (defining contact points for collecPng feedback; instruments to listen to stakeholders, to monitor discussions, iniPate dialogue
and integrate the knowledge gained etc.)
55
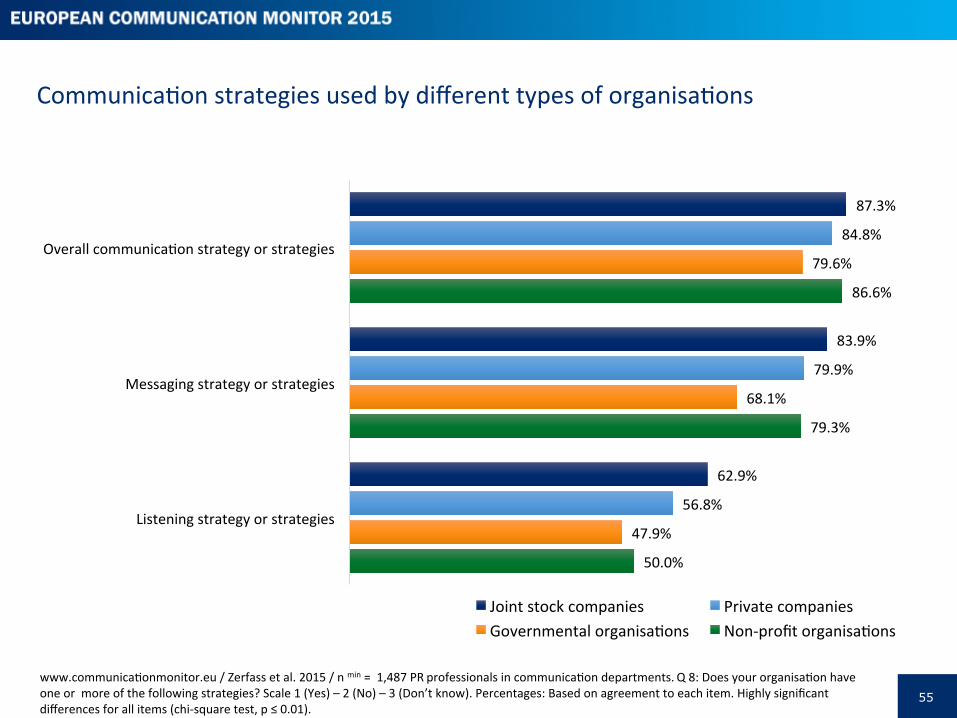
CommunicaPon strategies used by different types of organisaPons
87.3%
83.9%
62.9%
84.8%
79.9%
56.8%
79.6%
68.1%
47.9%
86.6%
79.3%
50.0%
Overall communicaPon strategy or strategies
Messaging strategy or strategies
Listening strategy or strategies
Joint stock companies Private companies Governmental organisaPons Non-‐profit organisaPons
www.communicaPonmonitor.eu / Zerfass et al. 2015 / n min = 1,487 PR professionals in communicaPon departments. Q 8: Does your organisaPon have one or more of the following strategies? Scale 1 (Yes) – 2 (No) – 3 (Don’t know). Percentages: Based on agreement to each item. Highly significant differences for all items (chi-‐square test, p ≤ 0.01).
56
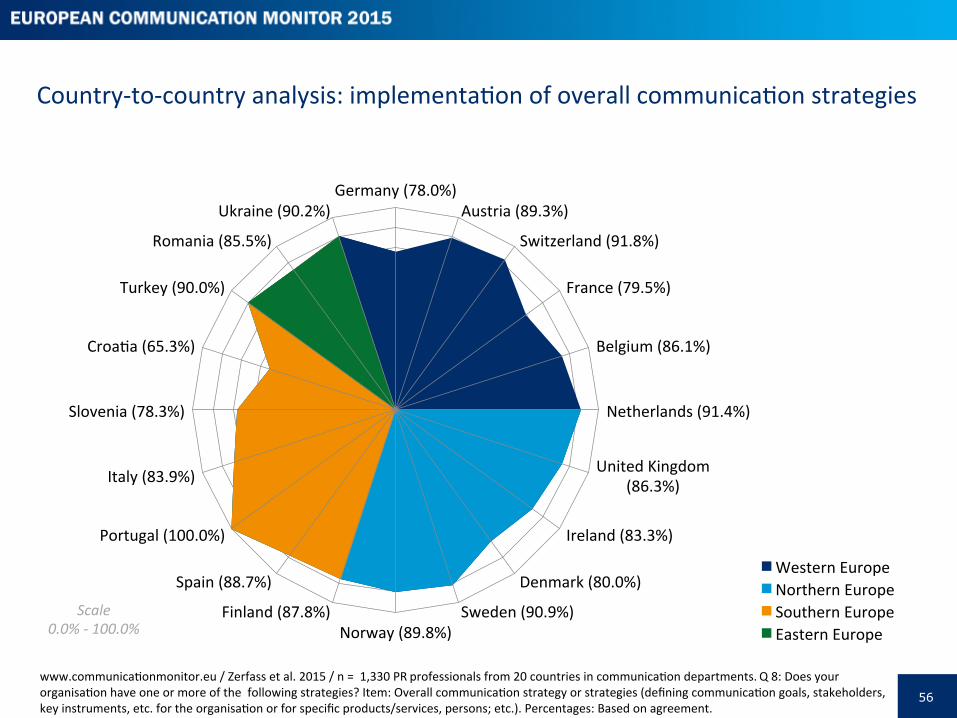
Country-‐to-‐country analysis: implementaPon of overall communicaPon strategies
www.communicaPonmonitor.eu / Zerfass et al. 2015 / n = 1,330 PR professionals from 20 countries in communicaPon departments. Q 8: Does your organisaPon have one or more of the following strategies? Item: Overall communicaPon strategy or strategies (defining communicaPon goals, stakeholders, key instruments, etc. for the organisaPon or for specific products/services, persons; etc.). Percentages: Based on agreement.
Germany (78.0%) Austria (89.3%)
Switzerland (91.8%)
France (79.5%)
Belgium (86.1%)
Netherlands (91.4%)
United Kingdom (86.3%)
Ireland (83.3%)
Denmark (80.0%)
Sweden (90.9%) Norway (89.8%)
Finland (87.8%)
Spain (88.7%)
Portugal (100.0%)
Italy (83.9%)
Slovenia (78.3%)
CroaPa (65.3%)
Turkey (90.0%)
Romania (85.5%)
Ukraine (90.2%)
Western Europe Northern Europe Southern Europe Eastern Europe
Scale 0.0% -‐ 100.0%
57
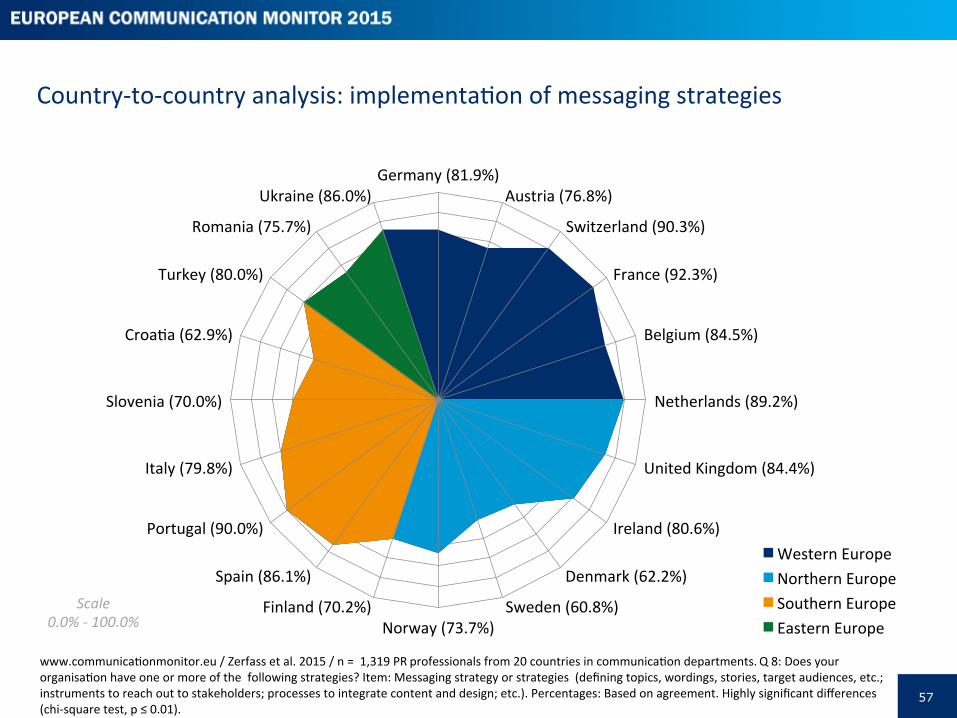
Country-‐to-‐country analysis: implementaPon of messaging strategies
www.communicaPonmonitor.eu / Zerfass et al. 2015 / n = 1,319 PR professionals from 20 countries in communicaPon departments. Q 8: Does your organisaPon have one or more of the following strategies? Item: Messaging strategy or strategies (defining topics, wordings, stories, target audiences, etc.; instruments to reach out to stakeholders; processes to integrate content and design; etc.). Percentages: Based on agreement. Highly significant differences (chi-‐square test, p ≤ 0.01).
Germany (81.9%) Austria (76.8%)
Switzerland (90.3%)
France (92.3%)
Belgium (84.5%)
Netherlands (89.2%)
United Kingdom (84.4%)
Ireland (80.6%)
Denmark (62.2%)
Sweden (60.8%) Norway (73.7%)
Finland (70.2%)
Spain (86.1%)
Portugal (90.0%)
Italy (79.8%)
Slovenia (70.0%)
CroaPa (62.9%)
Turkey (80.0%)
Romania (75.7%)
Ukraine (86.0%)
Western Europe Northern Europe Southern Europe Eastern Europe
Scale 0.0% -‐ 100.0%
58
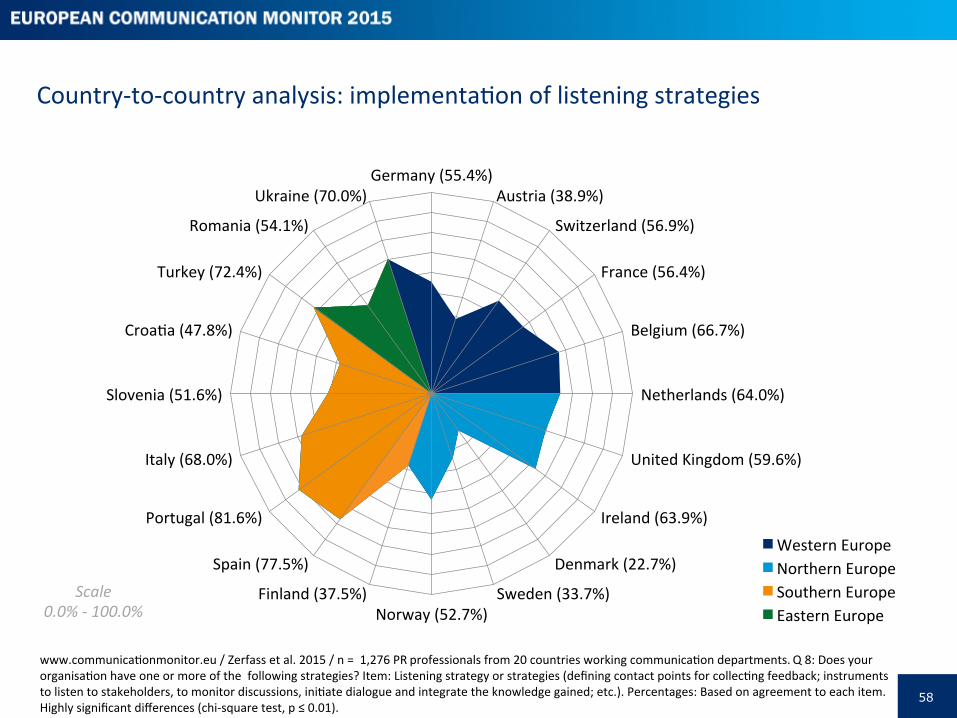
Country-‐to-‐country analysis: implementaPon of listening strategies
www.communicaPonmonitor.eu / Zerfass et al. 2015 / n = 1,276 PR professionals from 20 countries working communicaPon departments. Q 8: Does your organisaPon have one or more of the following strategies? Item: Listening strategy or strategies (defining contact points for collecPng feedback; instruments to listen to stakeholders, to monitor discussions, iniPate dialogue and integrate the knowledge gained; etc.). Percentages: Based on agreement to each item. Highly significant differences (chi-‐square test, p ≤ 0.01).
Germany (55.4%) Austria (38.9%)
Switzerland (56.9%)
France (56.4%)
Belgium (66.7%)
Netherlands (64.0%)
United Kingdom (59.6%)
Ireland (63.9%)
Denmark (22.7%)
Sweden (33.7%) Norway (52.7%)
Finland (37.5%)
Spain (77.5%)
Portugal (81.6%)
Italy (68.0%)
Slovenia (51.6%)
CroaPa (47.8%)
Turkey (72.4%)
Romania (54.1%)
Ukraine (70.0%)
Western Europe Northern Europe Southern Europe Eastern Europe
Scale 0.0% -‐ 100.0%
59
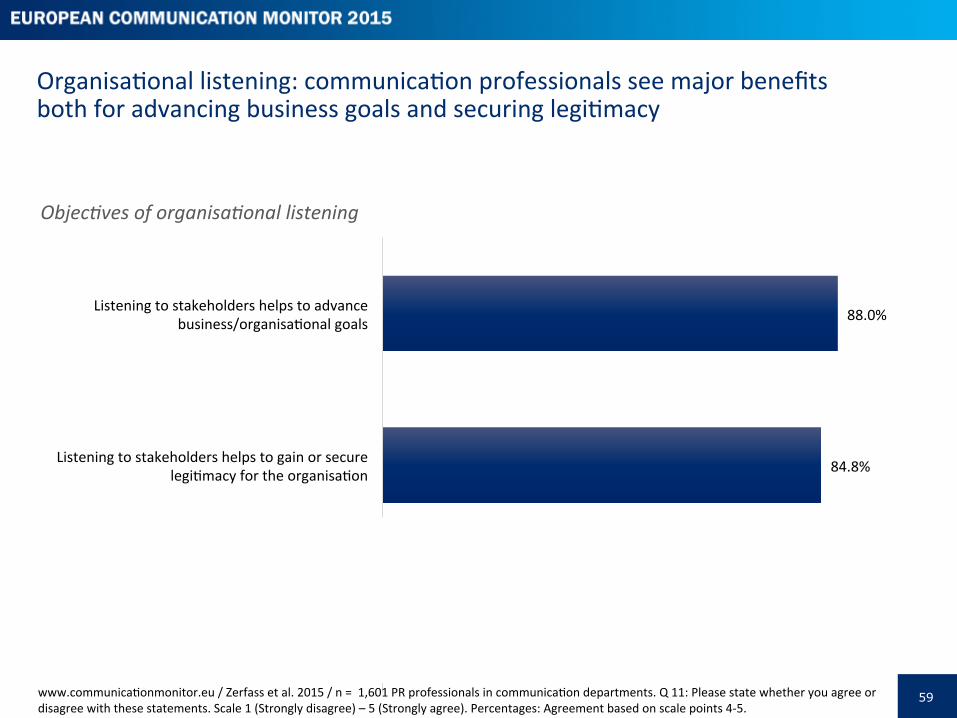
88.0%
84.8%
Listening to stakeholders helps to advance business/organisaPonal goals
Listening to stakeholders helps to gain or secure legiPmacy for the organisaPon
OrganisaPonal listening: communicaPon professionals see major benefits both for advancing business goals and securing legiPmacy
www.communicaPonmonitor.eu / Zerfass et al. 2015 / n = 1,601 PR professionals in communicaPon departments. Q 11: Please state whether you agree or disagree with these statements. Scale 1 (Strongly disagree) – 5 (Strongly agree). Percentages: Agreement based on scale points 4-‐5.
Objec0ves of organisa0onal listening
60
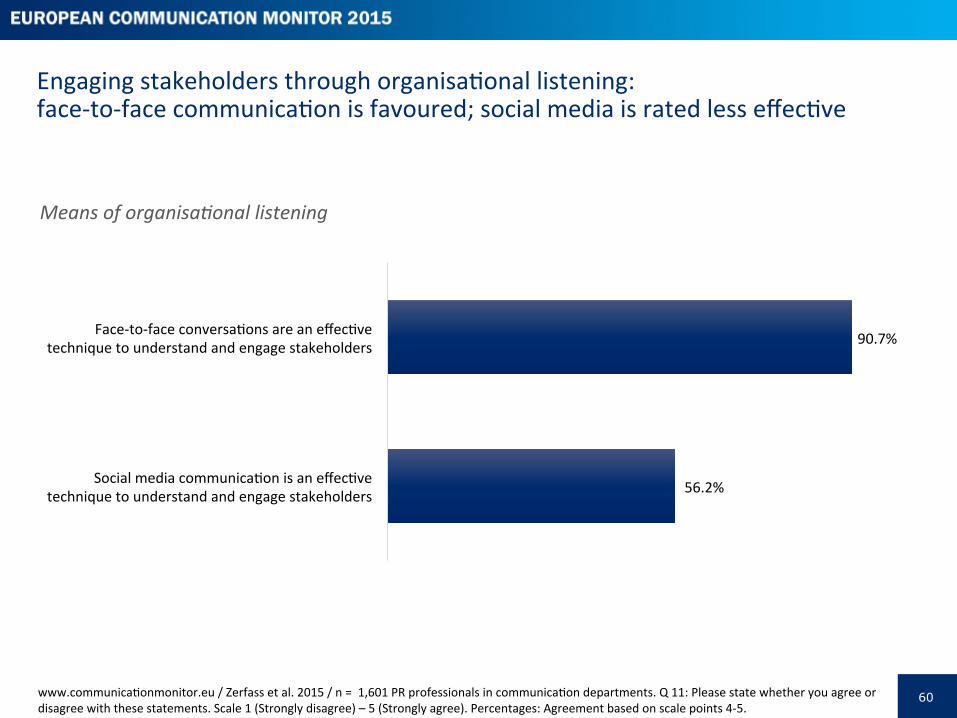
Engaging stakeholders through organisaPonal listening: face-‐to-‐face communicaPon is favoured; social media is rated less effecPve
www.communicaPonmonitor.eu / Zerfass et al. 2015 / n = 1,601 PR professionals in communicaPon departments. Q 11: Please state whether you agree or disagree with these statements. Scale 1 (Strongly disagree) – 5 (Strongly agree). Percentages: Agreement based on scale points 4-‐5.
90.7%
56.2%
Face-‐to-‐face conversaPons are an effecPve technique to understand and engage stakeholders
Social media communicaPon is an effecPve technique to understand and engage stakeholders
Means of organisa0onal listening
61
Structures and techniques for organisaPonal listening: TradiPonal instruments are prevailing, responsibiliPes are not always assigned
www.communicaPonmonitor.eu / Zerfass et al. 2015 / n min = 1,406 PR professionals in communicaPon departments. Q 10: Which of the following have been implemented in your organisaPon or are planned for 2015? Percentages: Based on agreement to each item.
84.1%
68.3%
58.0%
58.2%
53.3%
39.5%
43.1%
37.6%
9.4%
18.3%
17.6%
22.1%
21.6%
25.0%
16.6%
19.3%
6.4%
13.4%
24.4%
19.8%
25.1%
35.6%
40.3%
43.1%
Media monitoring on a regular basis
Social media monitoring on a regular basis
Issues monitoring and management
Ad hoc listening acPviPes (monitoring, surveys, dialogues, etc.)
Stakeholder dialogues on a regular basis
Stakeholder research on a regular basis
Listening tasks as part of your personal job descripPon
Listening tasks as explicit objecPve for the communicaPon department
Already implemented Planned for 2015 Not planned
62
OrganisaPonal listening in different types of organisaPons: joint stock companies are clearly ahead
www.communicaPonmonitor.eu / Zerfass et al. 2015 / n min = 1,406 PR professionals in communicaPon departments. Q 10: Which of the following have been implemented in your organisaPon or are planned for 2015? Percentages: agreement to implementaPon of each item. ** Highly significant differences (chi-‐square test, p ≤ 0.01).
88.4%
73.3%
68.8%
62.1%
57.3%
48.0%
46.2%
42.0%
78.3%
67.9%
53.6%
55.1%
46.0%
32.1%
41.9%
34.6%
85.8%
64.1%
52.2%
58.4%
52.6%
36.3%
40.6%
36.6%
81.2%
64.6%
48.2%
53.9%
56.9%
36.9%
42.2%
34.2%
Media monitoring on a regular basis **
Social media monitoring on a regular basis **
Issues monitoring and management **
Ad hoc listening acPviPes (monitoring, surveys, dialogues, etc.)
Stakeholder dialogues on a regular basis **
Stakeholder research on a regular basis **
Listening tasks as part of your personal job descripPon
Listening tasks as explicit objecPve for the communicaPon department or agency
Joint stock companies Private companies Governmental organisaPons Non-‐profit organisaPons
Structures and techniques implemented
63
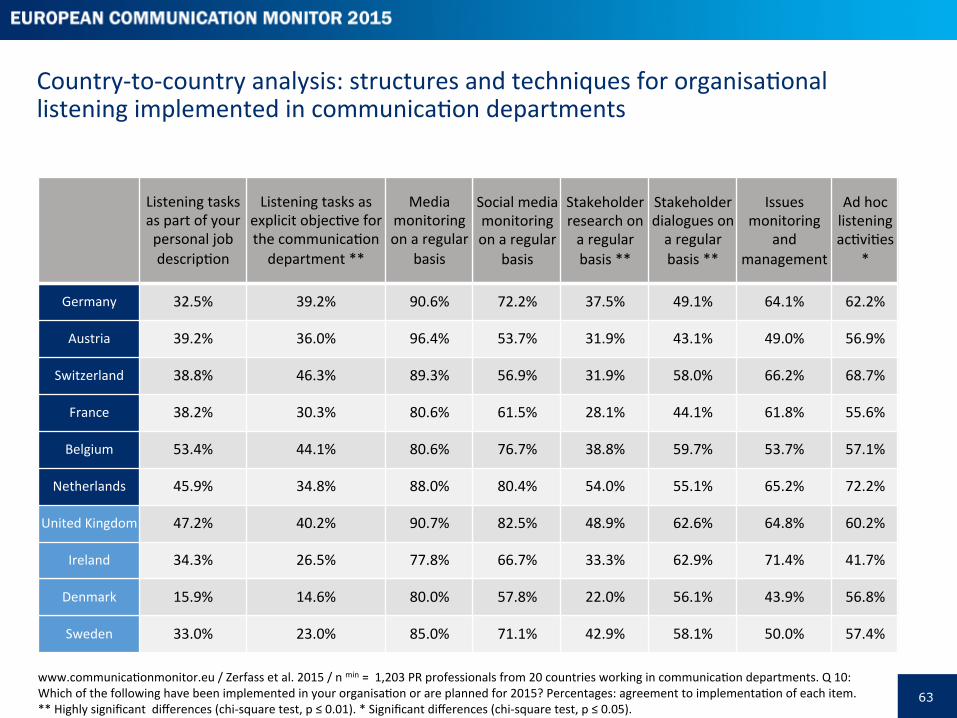
Country-‐to-‐country analysis: structures and techniques for organisaPonal listening implemented in communicaPon departments
www.communicaPonmonitor.eu / Zerfass et al. 2015 / n min = 1,203 PR professionals from 20 countries working in communicaPon departments. Q 10: Which of the following have been implemented in your organisaPon or are planned for 2015? Percentages: agreement to implementaPon of each item. ** Highly significant differences (chi-‐square test, p ≤ 0.01). * Significant differences (chi-‐square test, p ≤ 0.05).
Listening tasks as part of your personal job descripPon
Listening tasks as explicit objecPve for the communicaPon department **
Media monitoring on a regular
basis
Social media monitoring on a regular
basis
Stakeholder research on a regular basis **
Stakeholder dialogues on a regular basis **
Issues monitoring
and management
Ad hoc listening acPviPes
*
Germany 32.5% 39.2% 90.6% 72.2% 37.5% 49.1% 64.1% 62.2%
Austria 39.2% 36.0% 96.4% 53.7% 31.9% 43.1% 49.0% 56.9%
Switzerland 38.8% 46.3% 89.3% 56.9% 31.9% 58.0% 66.2% 68.7%
France 38.2% 30.3% 80.6% 61.5% 28.1% 44.1% 61.8% 55.6%
Belgium 53.4% 44.1% 80.6% 76.7% 38.8% 59.7% 53.7% 57.1%
Netherlands 45.9% 34.8% 88.0% 80.4% 54.0% 55.1% 65.2% 72.2%
United Kingdom 47.2% 40.2% 90.7% 82.5% 48.9% 62.6% 64.8% 60.2%
Ireland 34.3% 26.5% 77.8% 66.7% 33.3% 62.9% 71.4% 41.7%
Denmark 15.9% 14.6% 80.0% 57.8% 22.0% 56.1% 43.9% 56.8%
Sweden 33.0% 23.0% 85.0% 71.1% 42.9% 58.1% 50.0% 57.4%
64
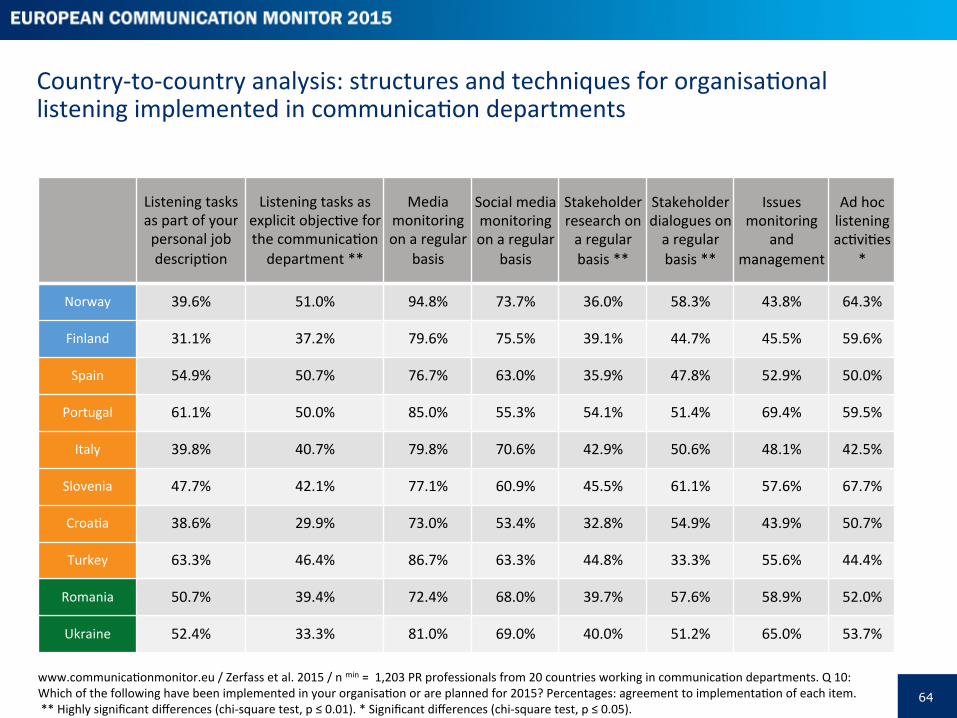
Country-‐to-‐country analysis: structures and techniques for organisaPonal listening implemented in communicaPon departments
Listening tasks as part of your personal job descripPon
Listening tasks as explicit objecPve for the communicaPon department **
Media monitoring on a regular
basis
Social media monitoring on a regular
basis
Stakeholder research on a regular basis **
Stakeholder dialogues on a regular basis **
Issues monitoring
and management
Ad hoc listening acPviPes
*
Norway 39.6% 51.0% 94.8% 73.7% 36.0% 58.3% 43.8% 64.3%
Finland 31.1% 37.2% 79.6% 75.5% 39.1% 44.7% 45.5% 59.6%
Spain 54.9% 50.7% 76.7% 63.0% 35.9% 47.8% 52.9% 50.0%
Portugal 61.1% 50.0% 85.0% 55.3% 54.1% 51.4% 69.4% 59.5%
Italy 39.8% 40.7% 79.8% 70.6% 42.9% 50.6% 48.1% 42.5%
Slovenia 47.7% 42.1% 77.1% 60.9% 45.5% 61.1% 57.6% 67.7%
CroaPa 38.6% 29.9% 73.0% 53.4% 32.8% 54.9% 43.9% 50.7%
Turkey 63.3% 46.4% 86.7% 63.3% 44.8% 33.3% 55.6% 44.4%
Romania 50.7% 39.4% 72.4% 68.0% 39.7% 57.6% 58.9% 52.0%
Ukraine 52.4% 33.3% 81.0% 69.0% 40.0% 51.2% 65.0% 53.7%
www.communicaPonmonitor.eu / Zerfass et al. 2015 / n min = 1,203 PR professionals from 20 countries working in communicaPon departments. Q 10: Which of the following have been implemented in your organisaPon or are planned for 2015? Percentages: agreement to implementaPon of each item. ** Highly significant differences (chi-‐square test, p ≤ 0.01). * Significant differences (chi-‐square test, p ≤ 0.05).
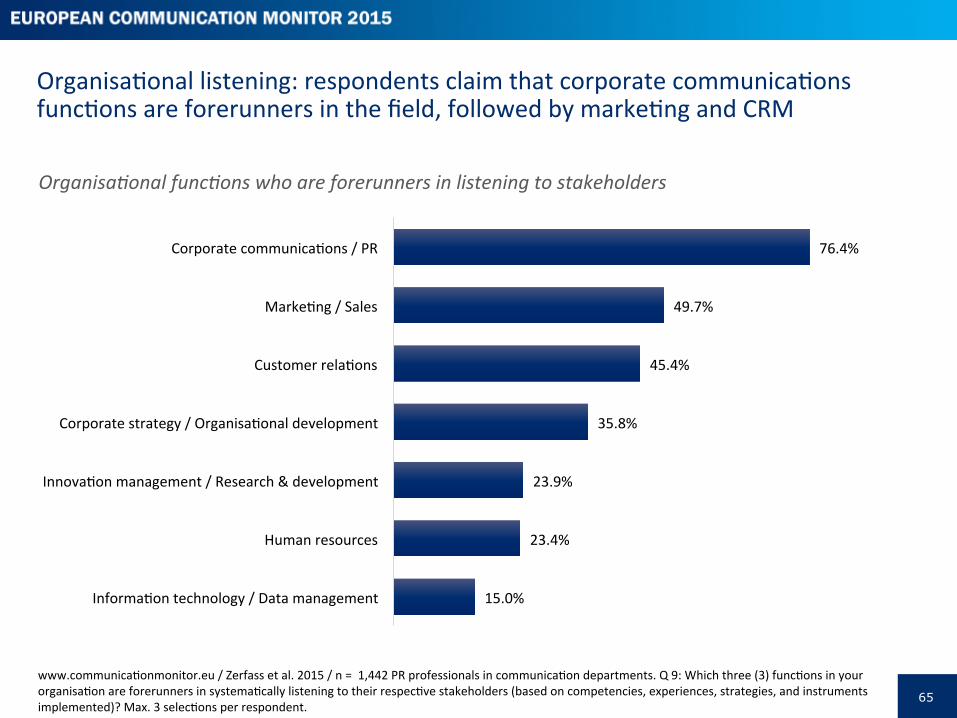
65
OrganisaPonal listening: respondents claim that corporate communicaPons funcPons are forerunners in the field, followed by markePng and CRM
www.communicaPonmonitor.eu / Zerfass et al. 2015 / n = 1,442 PR professionals in communicaPon departments. Q 9: Which three (3) funcPons in your organisaPon are forerunners in systemaPcally listening to their respecPve stakeholders (based on competencies, experiences, strategies, and instruments implemented)? Max. 3 selecPons per respondent.
76.4%
49.7%
45.4%
35.8%
23.9%
23.4%
15.0%
Corporate communicaPons / PR
MarkePng / Sales
Customer relaPons
Corporate strategy / OrganisaPonal development
InnovaPon management / Research & development
Human resources
InformaPon technology / Data management
Organisa0onal func0ons who are forerunners in listening to stakeholders
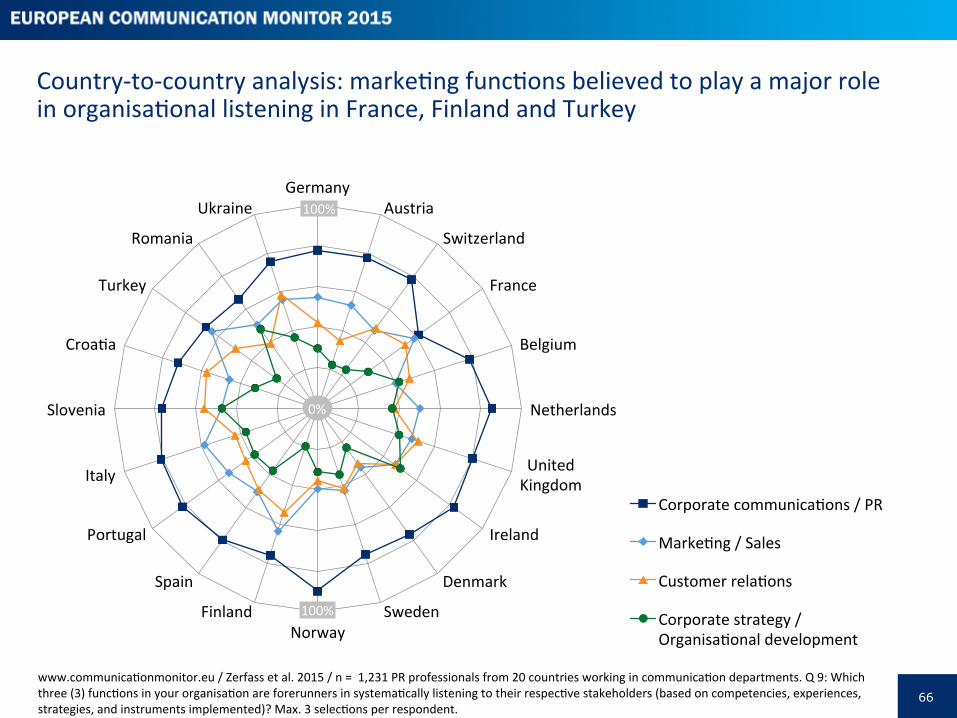
66
Germany Austria
Switzerland
France
Belgium
Netherlands
United Kingdom
Ireland
Denmark
Sweden Norway
Finland
Spain
Portugal
Italy
Slovenia
CroaPa
Turkey
Romania
Ukraine
Corporate communicaPons / PR
MarkePng / Sales
Customer relaPons
Corporate strategy / OrganisaPonal development
100%
100%
Country-‐to-‐country analysis: markePng funcPons believed to play a major role in organisaPonal listening in France, Finland and Turkey
www.communicaPonmonitor.eu / Zerfass et al. 2015 / n = 1,231 PR professionals from 20 countries working in communicaPon departments. Q 9: Which three (3) funcPons in your organisaPon are forerunners in systemaPcally listening to their respecPve stakeholders (based on competencies, experiences, strategies, and instruments implemented)? Max. 3 selecPons per respondent.
0%
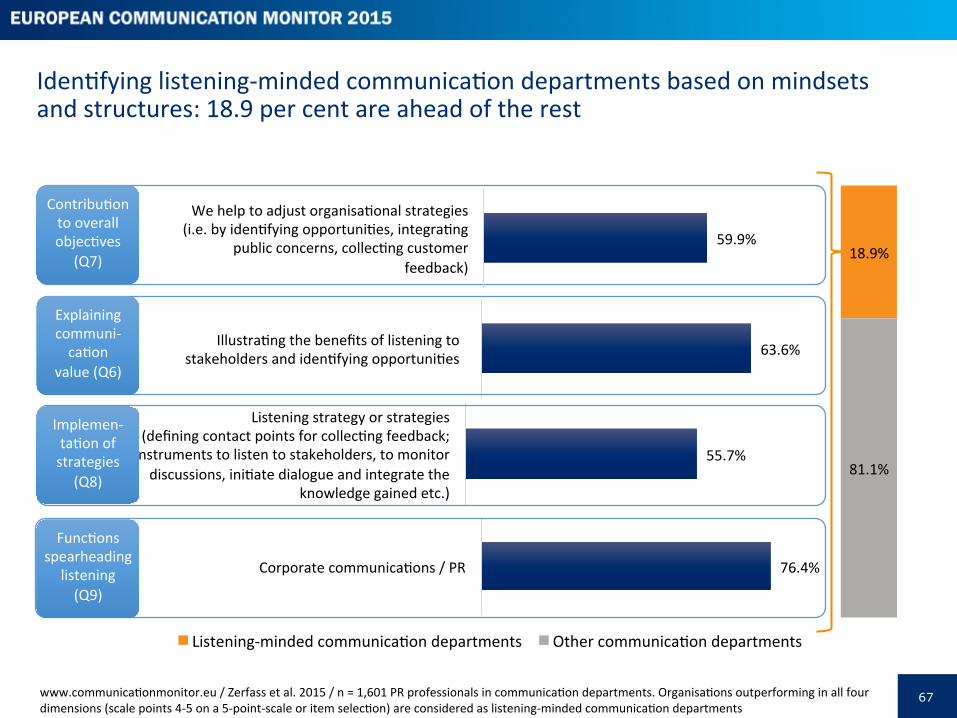
67
82.2% 52.8% 66.2% 54.0% 48.9% 37.8% 33.4% 31.5%
Listening-‐minded communicaPon departments Other communicaPon departments
63.6% IllustraPng the benefits of listening to stakeholders and idenPfying opportuniPes
IdenPfying listening-‐minded communicaPon departments based on mindsets and structures: 18.9 per cent are ahead of the rest
www.communicaPonmonitor.eu / Zerfass et al. 2015 / n = 1,601 PR professionals in communicaPon departments. OrganisaPons outperforming in all four dimensions (scale points 4-‐5 on a 5-‐point-‐scale or item selecPon) are considered as listening-‐minded communicaPon departments
59.9%
We help to adjust organisaPonal strategies (i.e. by idenPfying opportuniPes, integraPng
public concerns, collecPng customer feedback)
55.7%
Listening strategy or strategies (defining contact points for collecPng feedback; instruments to listen to stakeholders, to monitor discussions, iniPate dialogue and integrate the
knowledge gained etc.)
76.4% Corporate communicaPons / PR
ContribuPon to overall objecPves
(Q7)
Explaining communi-‐caPon
value (Q6)
Implemen-‐ taPon of strategies
(Q8)
FuncPons spearheading
listening (Q9)
18.9%
81.1%
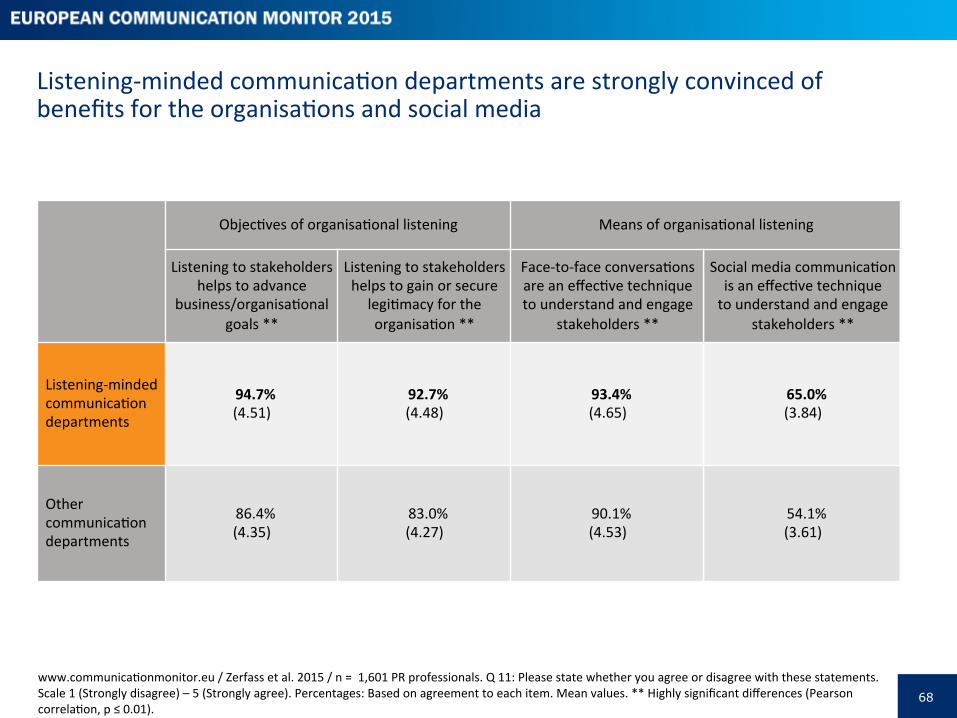
68
Listening-‐minded communicaPon departments are strongly convinced of benefits for the organisaPons and social media
ObjecPves of organisaPonal listening Means of organisaPonal listening
Listening to stakeholders helps to advance
business/organisaPonal goals **
Listening to stakeholders helps to gain or secure
legiPmacy for the organisaPon **
Face-‐to-‐face conversaPons are an effecPve technique to understand and engage
stakeholders **
Social media communicaPon is an effecPve technique to understand and engage
stakeholders **
Listening-‐minded communicaPon departments
94.7% (4.51)
92.7% (4.48)
93.4% (4.65)
65.0% (3.84)
Other communicaPon departments
86.4% (4.35)
83.0% (4.27)
90.1% (4.53)
54.1% (3.61)
www.communicaPonmonitor.eu / Zerfass et al. 2015 / n = 1,601 PR professionals. Q 11: Please state whether you agree or disagree with these statements. Scale 1 (Strongly disagree) – 5 (Strongly agree). Percentages: Based on agreement to each item. Mean values. ** Highly significant differences (Pearson correlaPon, p ≤ 0.01).
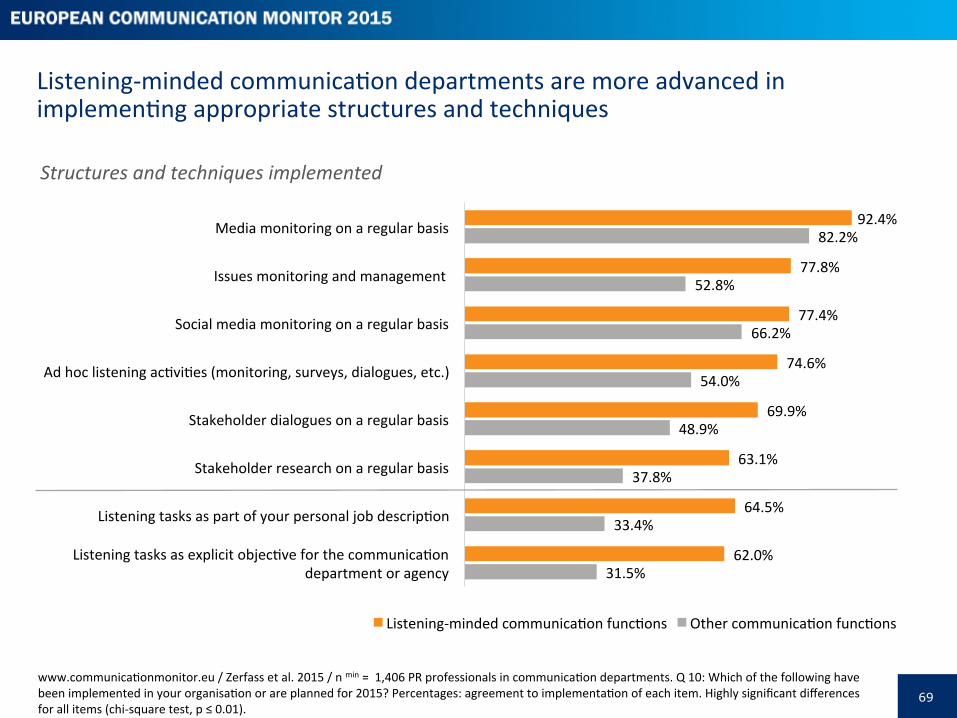
69
Listening-‐minded communicaPon departments are more advanced in implemenPng appropriate structures and techniques
www.communicaPonmonitor.eu / Zerfass et al. 2015 / n min = 1,406 PR professionals in communicaPon departments. Q 10: Which of the following have been implemented in your organisaPon or are planned for 2015? Percentages: agreement to implementaPon of each item. Highly significant differences for all items (chi-‐square test, p ≤ 0.01).
92.4%
77.8%
77.4%
74.6%
69.9%
63.1%
64.5%
62.0%
82.2%
52.8%
66.2%
54.0%
48.9%
37.8%
33.4%
31.5%
Media monitoring on a regular basis
Issues monitoring and management
Social media monitoring on a regular basis
Ad hoc listening acPviPes (monitoring, surveys, dialogues, etc.)
Stakeholder dialogues on a regular basis
Stakeholder research on a regular basis
Listening tasks as part of your personal job descripPon
Listening tasks as explicit objecPve for the communicaPon department or agency
Listening-‐minded communicaPon funcPons Other communicaPon funcPons
Structures and techniques implemented
Measurement and evalua=on
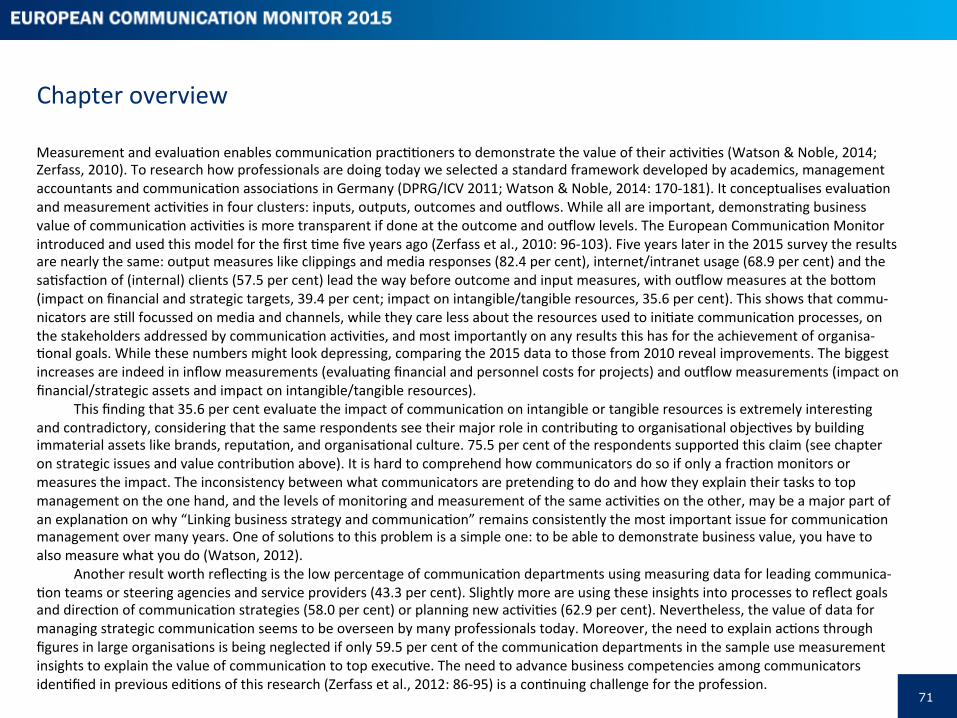
71
Chapter overview
Measurement and evaluaPon enables communicaPon pracPPoners to demonstrate the value of their acPviPes (Watson & Noble, 2014; Zerfass, 2010). To research how professionals are doing today we selected a standard framework developed by academics, management accountants and communicaPon associaPons in Germany (DPRG/ICV 2011; Watson & Noble, 2014: 170-‐181). It conceptualises evaluaPon and measurement acPviPes in four clusters: inputs, outputs, outcomes and oualows. While all are important, demonstraPng business value of communicaPon acPviPes is more transparent if done at the outcome and oualow levels. The European CommunicaPon Monitor introduced and used this model for the first Pme five years ago (Zerfass et al., 2010: 96-‐103). Five years later in the 2015 survey the results are nearly the same: output measures like clippings and media responses (82.4 per cent), internet/intranet usage (68.9 per cent) and the saPsfacPon of (internal) clients (57.5 per cent) lead the way before outcome and input measures, with oualow measures at the bomom (impact on financial and strategic targets, 39.4 per cent; impact on intangible/tangible resources, 35.6 per cent). This shows that commu-‐nicators are sPll focussed on media and channels, while they care less about the resources used to iniPate communicaPon processes, on the stakeholders addressed by communicaPon acPviPes, and most importantly on any results this has for the achievement of organisa-‐Ponal goals. While these numbers might look depressing, comparing the 2015 data to those from 2010 reveal improvements. The biggest increases are indeed in inflow measurements (evaluaPng financial and personnel costs for projects) and oualow measurements (impact on financial/strategic assets and impact on intangible/tangible resources).
This finding that 35.6 per cent evaluate the impact of communicaPon on intangible or tangible resources is extremely interesPng and contradictory, considering that the same respondents see their major role in contribuPng to organisaPonal objecPves by building immaterial assets like brands, reputaPon, and organisaPonal culture. 75.5 per cent of the respondents supported this claim (see chapter on strategic issues and value contribuPon above). It is hard to comprehend how communicators do so if only a fracPon monitors or measures the impact. The inconsistency between what communicators are pretending to do and how they explain their tasks to top management on the one hand, and the levels of monitoring and measurement of the same acPviPes on the other, may be a major part of an explanaPon on why “Linking business strategy and communicaPon” remains consistently the most important issue for communicaPon management over many years. One of soluPons to this problem is a simple one: to be able to demonstrate business value, you have to also measure what you do (Watson, 2012).
Another result worth reflecPng is the low percentage of communicaPon departments using measuring data for leading communica-‐Pon teams or steering agencies and service providers (43.3 per cent). Slightly more are using these insights into processes to reflect goals and direcPon of communicaPon strategies (58.0 per cent) or planning new acPviPes (62.9 per cent). Nevertheless, the value of data for managing strategic communicaPon seems to be overseen by many professionals today. Moreover, the need to explain acPons through figures in large organisaPons is being neglected if only 59.5 per cent of the communicaPon departments in the sample use measurement insights to explain the value of communicaPon to top execuPve. The need to advance business competencies among communicators idenPfied in previous ediPons of this research (Zerfass et al., 2012: 86-‐95) is a conPnuing challenge for the profession.
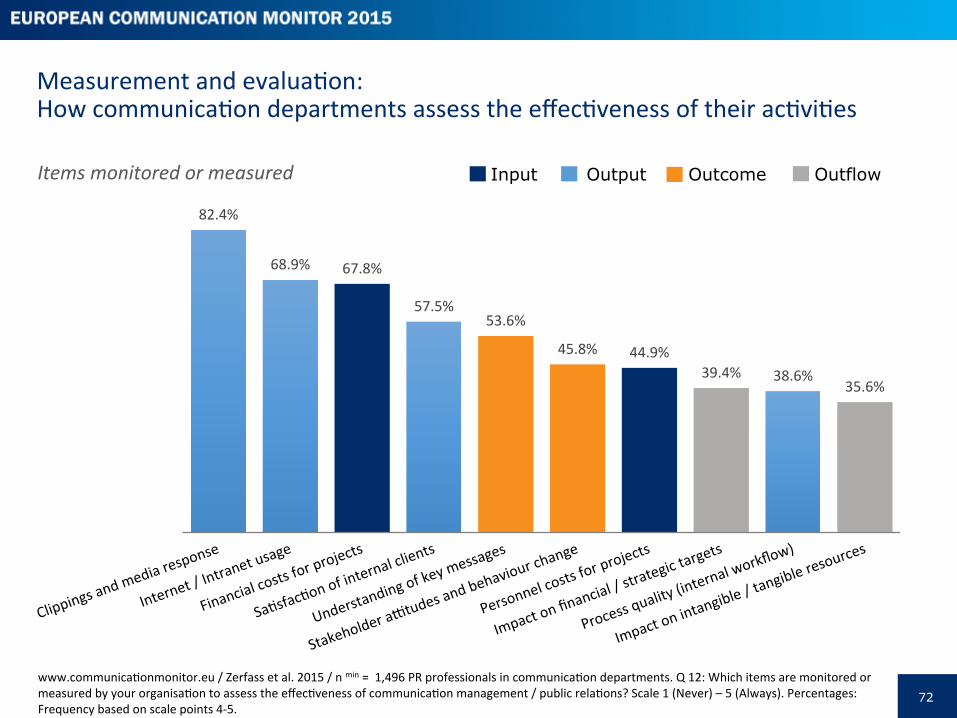
72
82.4%
68.9% 67.8%
57.5% 53.6%
45.8% 44.9% 39.4% 38.6%
35.6%
Measurement and evaluaPon: How communicaPon departments assess the effecPveness of their acPviPes
www.communicaPonmonitor.eu / Zerfass et al. 2015 / n min = 1,496 PR professionals in communicaPon departments. Q 12: Which items are monitored or measured by your organisaPon to assess the effecPveness of communicaPon management / public relaPons? Scale 1 (Never) – 5 (Always). Percentages: Frequency based on scale points 4-‐5.
Input Output Outcome Outflow Items monitored or measured
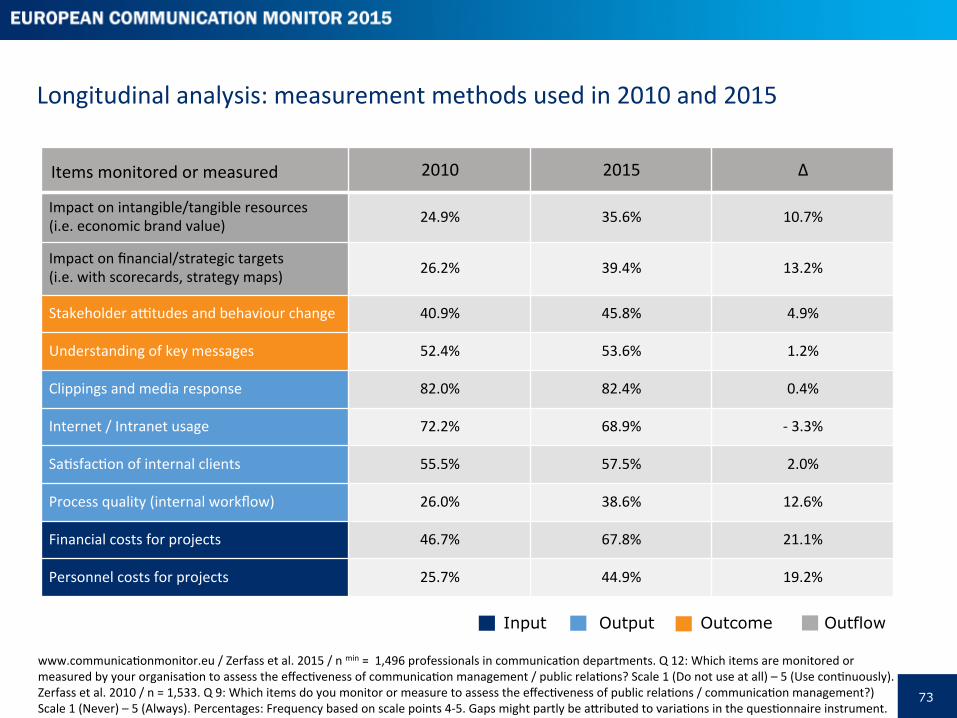
73
Longitudinal analysis: measurement methods used in 2010 and 2015
Items monitored or measured 2010 2015 Δ
Impact on intangible/tangible resources (i.e. economic brand value) 24.9% 35.6% 10.7%
Impact on financial/strategic targets (i.e. with scorecards, strategy maps) 26.2% 39.4% 13.2%
Stakeholder a�tudes and behaviour change 40.9% 45.8% 4.9%
Understanding of key messages 52.4% 53.6% 1.2%
Clippings and media response 82.0% 82.4% 0.4%
Internet / Intranet usage 72.2% 68.9% -‐ 3.3%
SaPsfacPon of internal clients 55.5% 57.5% 2.0%
Process quality (internal workflow) 26.0% 38.6% 12.6%
Financial costs for projects 46.7% 67.8% 21.1%
Personnel costs for projects 25.7% 44.9% 19.2%
www.communicaPonmonitor.eu / Zerfass et al. 2015 / n min = 1,496 professionals in communicaPon departments. Q 12: Which items are monitored or measured by your organisaPon to assess the effecPveness of communicaPon management / public relaPons? Scale 1 (Do not use at all) – 5 (Use conPnuously). Zerfass et al. 2010 / n = 1,533. Q 9: Which items do you monitor or measure to assess the effecPveness of public relaPons / communicaPon management?) Scale 1 (Never) – 5 (Always). Percentages: Frequency based on scale points 4-‐5. Gaps might partly be amributed to variaPons in the quesPonnaire instrument.
Input Output Outcome Outflow
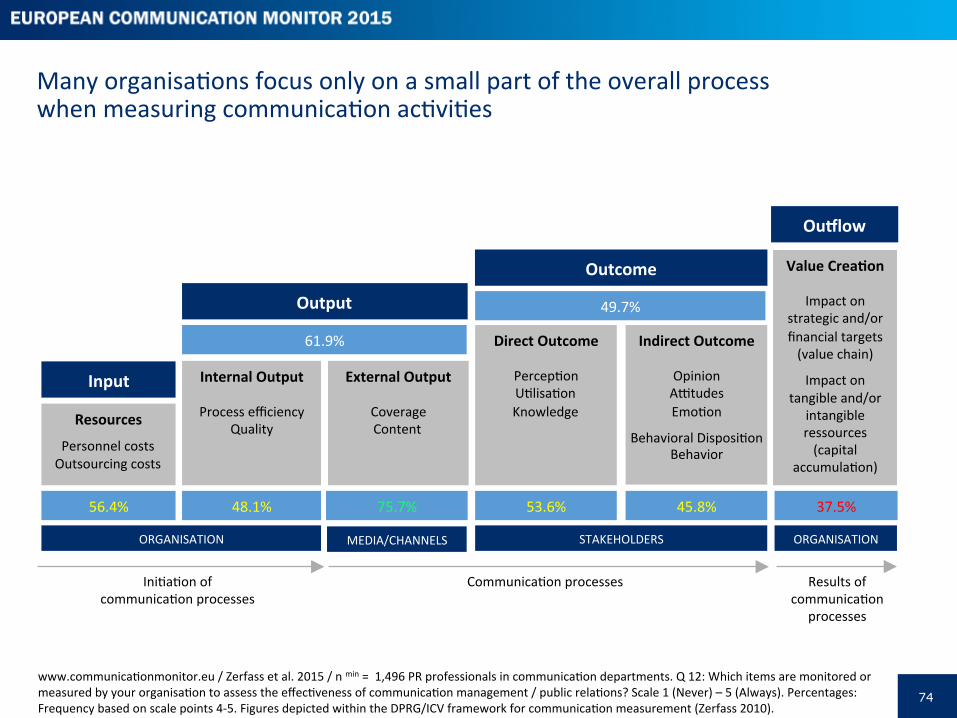
74
Many organisaPons focus only on a small part of the overall process when measuring communicaPon acPviPes
www.communicaPonmonitor.eu / Zerfass et al. 2015 / n min = 1,496 PR professionals in communicaPon departments. Q 12: Which items are monitored or measured by your organisaPon to assess the effecPveness of communicaPon management / public relaPons? Scale 1 (Never) – 5 (Always). Percentages: Frequency based on scale points 4-‐5. Figures depicted within the DPRG/ICV framework for communicaPon measurement (Zerfass 2010).
Results of communicaPon
processes
Output
Outcome
Internal Output
Process efficiency Quality
External Output
Coverage Content
Direct Outcome
PercepPon UPlisaPon Knowledge
Indirect Outcome
Opinion A�tudes EmoPon
Behavioral DisposiPon Behavior
Resources
Personnel costs Outsourcing costs
Input
Value Crea=on
Impact on strategic and/or financial targets (value chain)
Impact on tangible and/or
intangible ressources (capital
accumulaPon)
OuVlow
ORGANISATION
CommunicaPon processes IniPaPon of communicaPon processes
MEDIA/CHANNELS STAKEHOLDERS ORGANISATION
56.4% 48.1% 75.7% 53.6% 45.8% 37.5%
61.9%
49.7%
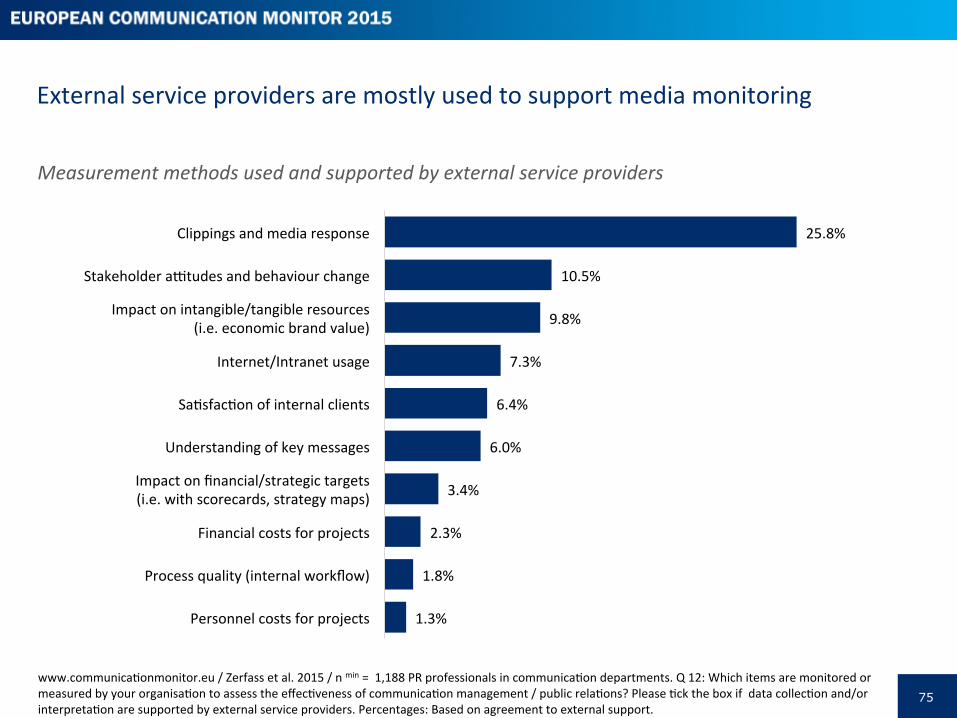
75
External service providers are mostly used to support media monitoring
www.communicaPonmonitor.eu / Zerfass et al. 2015 / n min = 1,188 PR professionals in communicaPon departments. Q 12: Which items are monitored or measured by your organisaPon to assess the effecPveness of communicaPon management / public relaPons? Please Pck the box if data collecPon and/or interpretaPon are supported by external service providers. Percentages: Based on agreement to external support.
25.8%
10.5%
9.8%
7.3%
6.4%
6.0%
3.4%
2.3%
1.8%
1.3%
Clippings and media response
Stakeholder a�tudes and behaviour change
Impact on intangible/tangible resources (i.e. economic brand value)
Internet/Intranet usage
SaPsfacPon of internal clients
Understanding of key messages
Impact on financial/strategic targets (i.e. with scorecards, strategy maps)
Financial costs for projects
Process quality (internal workflow)
Personnel costs for projects
Measurement methods used and supported by external service providers
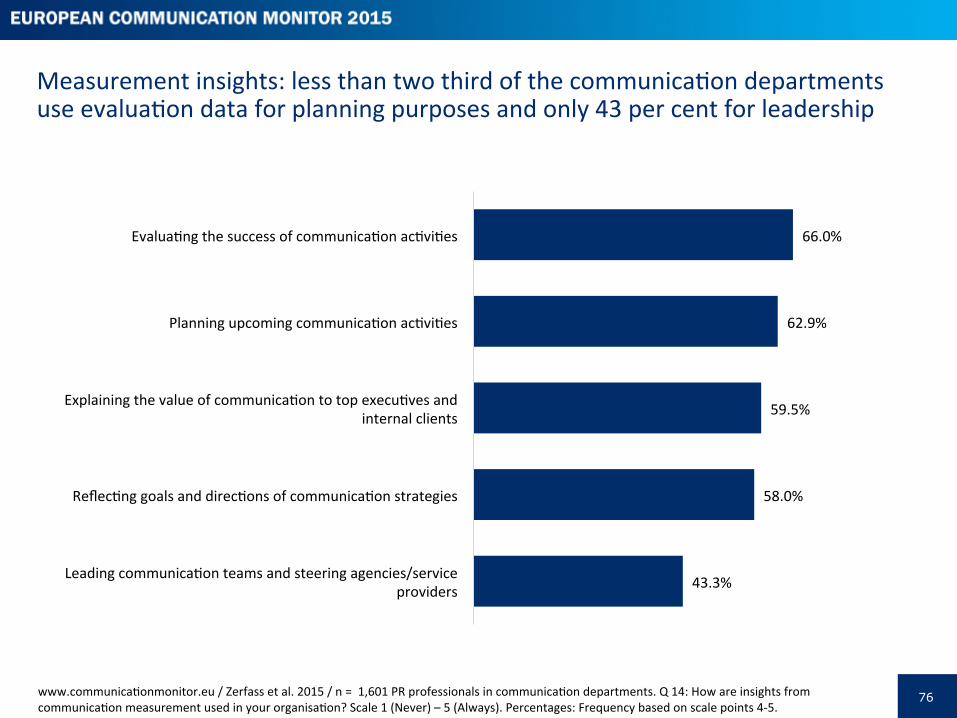
76
66.0%
62.9%
59.5%
58.0%
43.3%
EvaluaPng the success of communicaPon acPviPes
Planning upcoming communicaPon acPviPes
Explaining the value of communicaPon to top execuPves and internal clients
ReflecPng goals and direcPons of communicaPon strategies
Leading communicaPon teams and steering agencies/service providers
Measurement insights: less than two third of the communicaPon departments use evaluaPon data for planning purposes and only 43 per cent for leadership
www.communicaPonmonitor.eu / Zerfass et al. 2015 / n = 1,601 PR professionals in communicaPon departments. Q 14: How are insights from communicaPon measurement used in your organisaPon? Scale 1 (Never) – 5 (Always). Percentages: Frequency based on scale points 4-‐5.
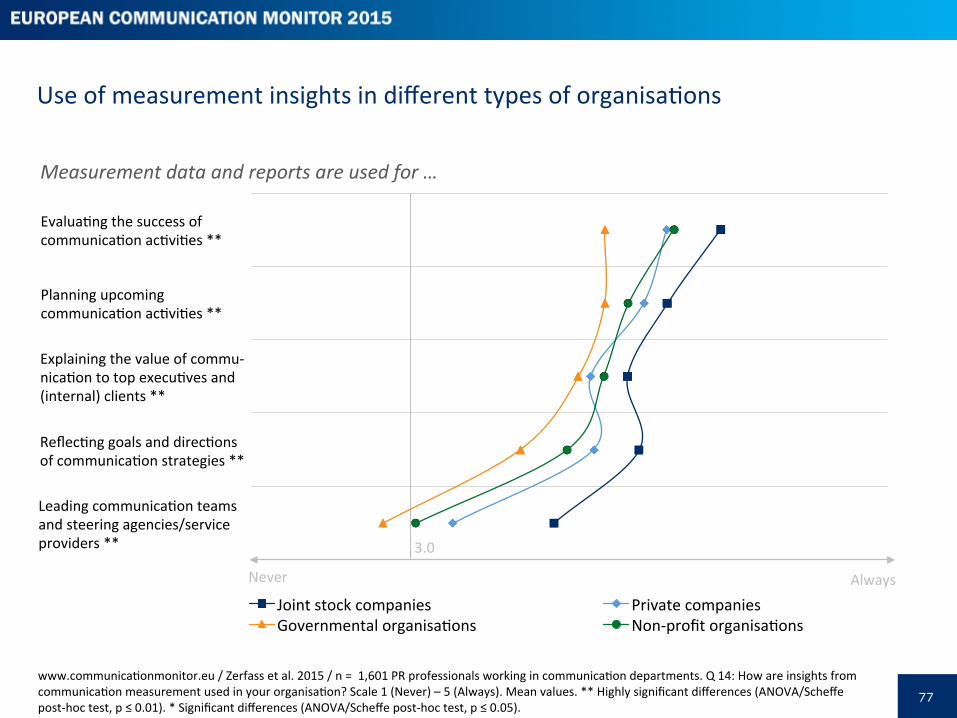
77
Measurement data and reports are used for …
Joint stock companies Private companies Governmental organisaPons Non-‐profit organisaPons
Explaining the value of commu-‐nicaPon to top execuPves and (internal) clients **
EvaluaPng the success of communicaPon acPviPes **
Planning upcoming communicaPon acPviPes **
ReflecPng goals and direcPons of communicaPon strategies **
Leading communicaPon teams and steering agencies/service providers **
Use of measurement insights in different types of organisaPons
Always Never
www.communicaPonmonitor.eu / Zerfass et al. 2015 / n = 1,601 PR professionals working in communicaPon departments. Q 14: How are insights from communicaPon measurement used in your organisaPon? Scale 1 (Never) – 5 (Always). Mean values. ** Highly significant differences (ANOVA/Scheffe post-‐hoc test, p ≤ 0.01). * Significant differences (ANOVA/Scheffe post-‐hoc test, p ≤ 0.05).
3.0
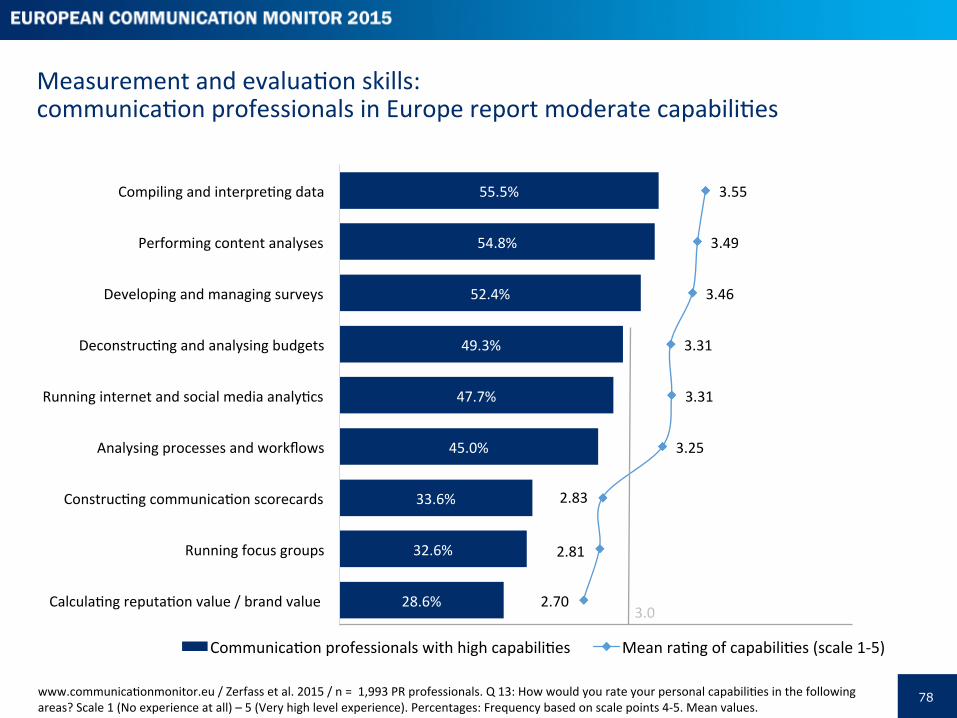
78
Measurement and evaluaPon skills: communicaPon professionals in Europe report moderate capabiliPes
www.communicaPonmonitor.eu / Zerfass et al. 2015 / n = 1,993 PR professionals. Q 13: How would you rate your personal capabiliPes in the following areas? Scale 1 (No experience at all) – 5 (Very high level experience). Percentages: Frequency based on scale points 4-‐5. Mean values.
55.5%
54.8%
52.4%
49.3%
47.7%
45.0%
33.6%
32.6%
28.6%
3.55
3.49
3.46
3.31
3.31
3.25
2.83
2.81
2.70
Compiling and interprePng data
Performing content analyses
Developing and managing surveys
DeconstrucPng and analysing budgets
Running internet and social media analyPcs
Analysing processes and workflows
ConstrucPng communicaPon scorecards
Running focus groups
CalculaPng reputaPon value / brand value
CommunicaPon professionals with high capabiliPes Mean raPng of capabiliPes (scale 1-‐5)
3.0
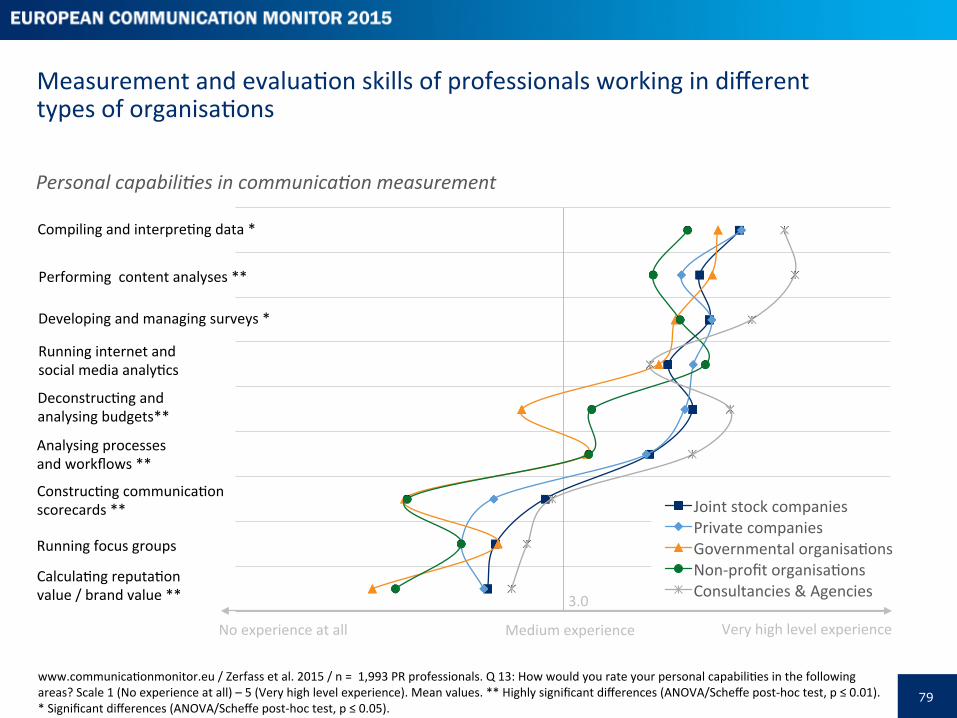
79
Measurement and evaluaPon skills of professionals working in different types of organisaPons
Joint stock companies Private companies Governmental organisaPons Non-‐profit organisaPons Consultancies & Agencies
Analysing processes and workflows **
Compiling and interprePng data *
Developing and managing surveys *
DeconstrucPng and analysing budgets**
Running focus groups
ConstrucPng communicaPon scorecards **
Running internet and social media analyPcs
Performing content analyses **
CalculaPng reputaPon value / brand value **
www.communicaPonmonitor.eu / Zerfass et al. 2015 / n = 1,993 PR professionals. Q 13: How would you rate your personal capabiliPes in the following areas? Scale 1 (No experience at all) – 5 (Very high level experience). Mean values. ** Highly significant differences (ANOVA/Scheffe post-‐hoc test, p ≤ 0.01). * Significant differences (ANOVA/Scheffe post-‐hoc test, p ≤ 0.05).
Very high level experience No experience at all Medium experience
3.0
Personal capabili0es in communica0on measurement
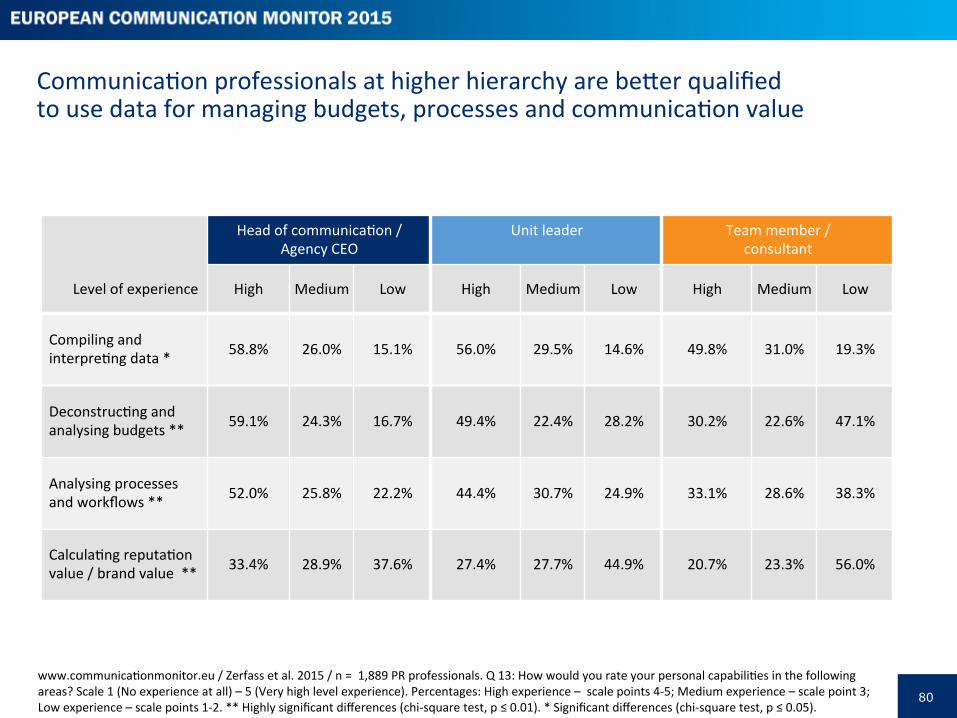
80
CommunicaPon professionals at higher hierarchy are bemer qualified to use data for managing budgets, processes and communicaPon value
Level of experience
Head of communicaPon / Agency CEO
Unit leader
Team member / consultant
High Medium Low High Medium Low High Medium Low
Compiling and interprePng data * 58.8% 26.0% 15.1% 56.0% 29.5% 14.6% 49.8% 31.0% 19.3%
DeconstrucPng and analysing budgets ** 59.1% 24.3% 16.7% 49.4% 22.4% 28.2% 30.2% 22.6% 47.1%
Analysing processes and workflows ** 52.0% 25.8% 22.2% 44.4% 30.7% 24.9% 33.1% 28.6% 38.3%
CalculaPng reputaPon value / brand value ** 33.4% 28.9% 37.6% 27.4% 27.7% 44.9% 20.7% 23.3% 56.0%
www.communicaPonmonitor.eu / Zerfass et al. 2015 / n = 1,889 PR professionals. Q 13: How would you rate your personal capabiliPes in the following areas? Scale 1 (No experience at all) – 5 (Very high level experience). Percentages: High experience – scale points 4-‐5; Medium experience – scale point 3; Low experience – scale points 1-‐2. ** Highly significant differences (chi-‐square test, p ≤ 0.01). * Significant differences (chi-‐square test, p ≤ 0.05).
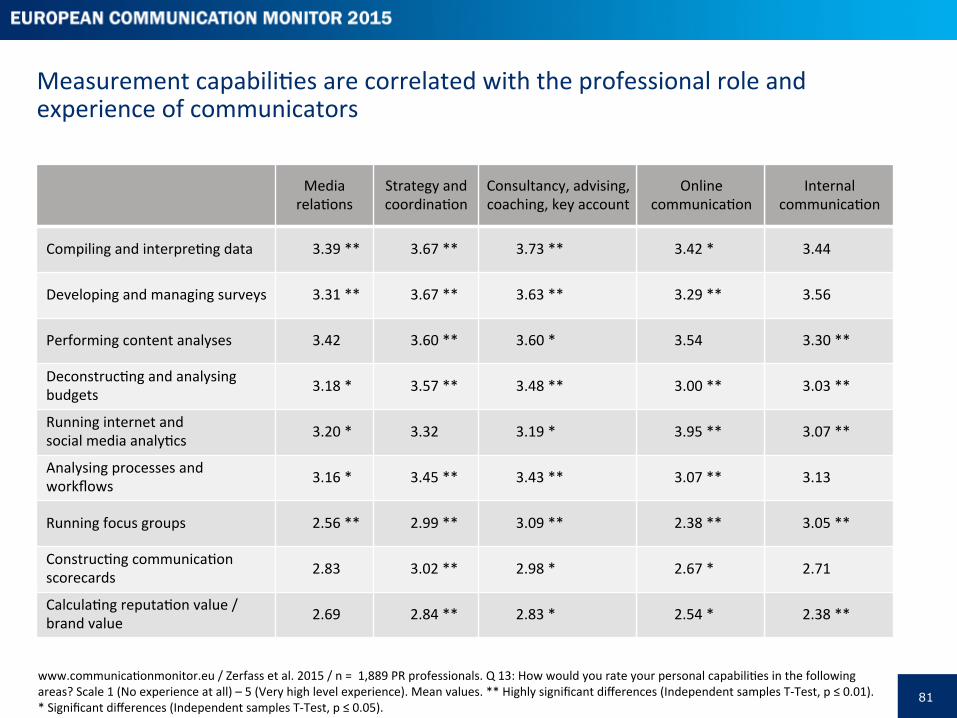
81
Measurement capabiliPes are correlated with the professional role and experience of communicators
Media relaPons
Strategy and coordinaPon
Consultancy, advising, coaching, key account
Online communicaPon
Internal communicaPon
Compiling and interprePng data 3.39 ** 3.67 ** 3.73 ** 3.42 * 3.44
Developing and managing surveys 3.31 ** 3.67 ** 3.63 ** 3.29 ** 3.56
Performing content analyses 3.42 3.60 ** 3.60 * 3.54 3.30 **
DeconstrucPng and analysing budgets 3.18 * 3.57 ** 3.48 ** 3.00 ** 3.03 **
Running internet and social media analyPcs 3.20 * 3.32 3.19 * 3.95 ** 3.07 **
Analysing processes and workflows 3.16 * 3.45 ** 3.43 ** 3.07 ** 3.13
Running focus groups 2.56 ** 2.99 ** 3.09 ** 2.38 ** 3.05 **
ConstrucPng communicaPon scorecards 2.83 3.02 ** 2.98 * 2.67 * 2.71
CalculaPng reputaPon value / brand value 2.69 2.84 ** 2.83 * 2.54 * 2.38 **
www.communicaPonmonitor.eu / Zerfass et al. 2015 / n = 1,889 PR professionals. Q 13: How would you rate your personal capabiliPes in the following areas? Scale 1 (No experience at all) – 5 (Very high level experience). Mean values. ** Highly significant differences (Independent samples T-‐Test, p ≤ 0.01). * Significant differences (Independent samples T-‐Test, p ≤ 0.05).

Rela=onship between agencies and clients

83
Chapter overview
The use of agencies, consultancies and freelance pracPPoners is a common pracPce in communicaPon management (Eagle et al., 2015: 123-‐238). The findings from this survey verify this pracPce across all types of organisaPons. They also demonstrate some interesPng diversificaPon in reasons for using this addiPonal resource as well as interpretaPons on what independent counsel brings to the organi-‐saPon as well as who or what is to blame when the relaPonship breaks down or goes wrong (Bourland, 1993; Murphy & Maynard, 1997). Most of all the communicaPon departments work on an ongoing basis with mulPple agencies. In fact only one in five organisaPons (20.7 per cent) do not work with outside agencies at all, and 13.8 per cent of organisaPons work on an ongoing basis with a single “agency of record”. There are fundamental differences between the four sectors reported in the ECM 2015 survey. Nearly 20 (19.5) per cent of joint stock companies work with a single “agency of record”, compared to 17.3 per cent of private companies. These figures are even lower for governmental organisaPons (7.9 per cent) and non-‐profit organisaPons (5.6 per cent). Only 10.6 per cent of joint stock companies do not work with agencies at all, with this figure rising to 21.8 per cent of private companies, 28.0 per cent of non-‐profit organisaPons and 29.5 per cent of governmental organisaPons.
It is interesPng to note differences in how clients and agencies see the reasons and explanaPons for why organisaPons employ agencies (Tench et al., 2002; Fielden et al., 2003). While both sides are close on the need to integrate creaPvity and use addiPonal “arms and legs”, there are wide mispercepPons on the side of agencies that they are more open employed for experPse; strategic insight; objecPve, independent counsel; their ability to understand and explain communicaPon trends and new instruments; and being able to support in explaining communicaPon strategies to top execuPves. In summary the agencies are more opPmisPc about their overall value and contribuPon to the client organisaPons when compared with the clients’ own responses.
There are also wide differences in assessing reasons for agency-‐client conflicts (Bourland, 1993; Murphy & Maynard, 1997). While clients see the main reason for conflicts originaPng in the lack of knowledge of the client’s business and processes (62.3 per cent), only one in five respondents on the agency side see this as a problem (21.0 per cent). On the other hand, nearly three quarters of agency respondents named unclear objecPves and expectaPons as the main reason for conflicts (73.0 per cent), while only a third of respondents from the client side see this as a major reason (33.3 per cent). Obviously each side blames the other one for conflicts.
Results clearly demonstrate that hiring agencies demands competencies on the side of communicaPon departments as well as a realisPc understanding of communicaPon in organisaPonal se�ngs by consultancies. To make good use of the money spent organisaPons have to educate and train in-‐house pracPPoners to understand what they can get from agencies and how to put that to proper use to add value. Agencies, on the other hand, have to align their business models to the outsourcing needs of clients in a changing business environment.
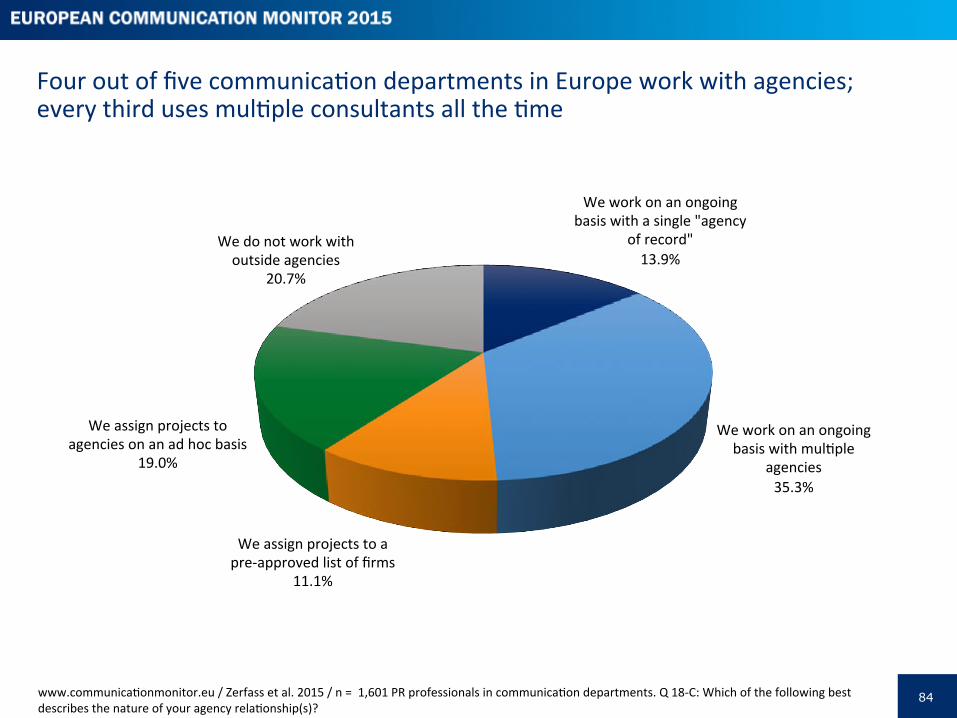
84
Four out of five communicaPon departments in Europe work with agencies; every third uses mulPple consultants all the Pme
We work on an ongoing basis with a single "agency
of record" 13.9%
We work on an ongoing basis with mulPple
agencies 35.3%
We assign projects to a pre-‐approved list of firms
11.1%
We assign projects to agencies on an ad hoc basis
19.0%
We do not work with outside agencies
20.7%
www.communicaPonmonitor.eu / Zerfass et al. 2015 / n = 1,601 PR professionals in communicaPon departments. Q 18-‐C: Which of the following best describes the nature of your agency relaPonship(s)?
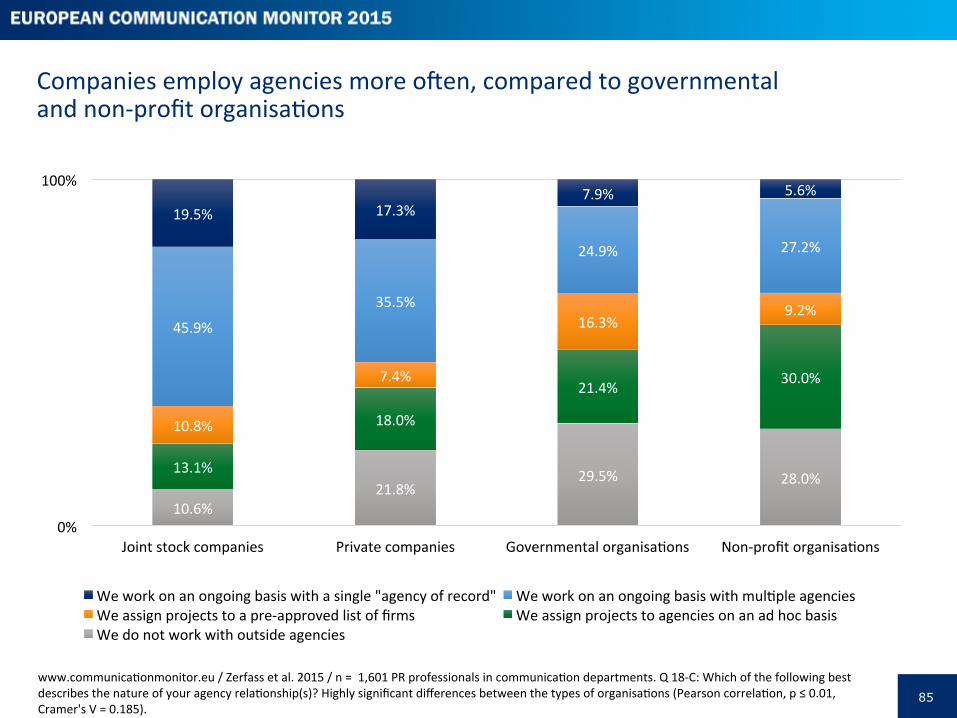
85
Companies employ agencies more open, compared to governmental and non-‐profit organisaPons
www.communicaPonmonitor.eu / Zerfass et al. 2015 / n = 1,601 PR professionals in communicaPon departments. Q 18-‐C: Which of the following best describes the nature of your agency relaPonship(s)? Highly significant differences between the types of organisaPons (Pearson correlaPon, p ≤ 0.01, Cramer's V = 0.185).
10.6% 21.8%
29.5% 28.0% 13.1%
18.0%
21.4% 30.0%
10.8%
7.4%
16.3% 9.2%
45.9%
35.5%
24.9% 27.2%
19.5% 17.3% 7.9% 5.6%
0%
100%
Joint stock companies Private companies Governmental organisaPons Non-‐profit organisaPons
We work on an ongoing basis with a single "agency of record" We work on an ongoing basis with mulPple agencies We assign projects to a pre-‐approved list of firms We assign projects to agencies on an ad hoc basis We do not work with outside agencies
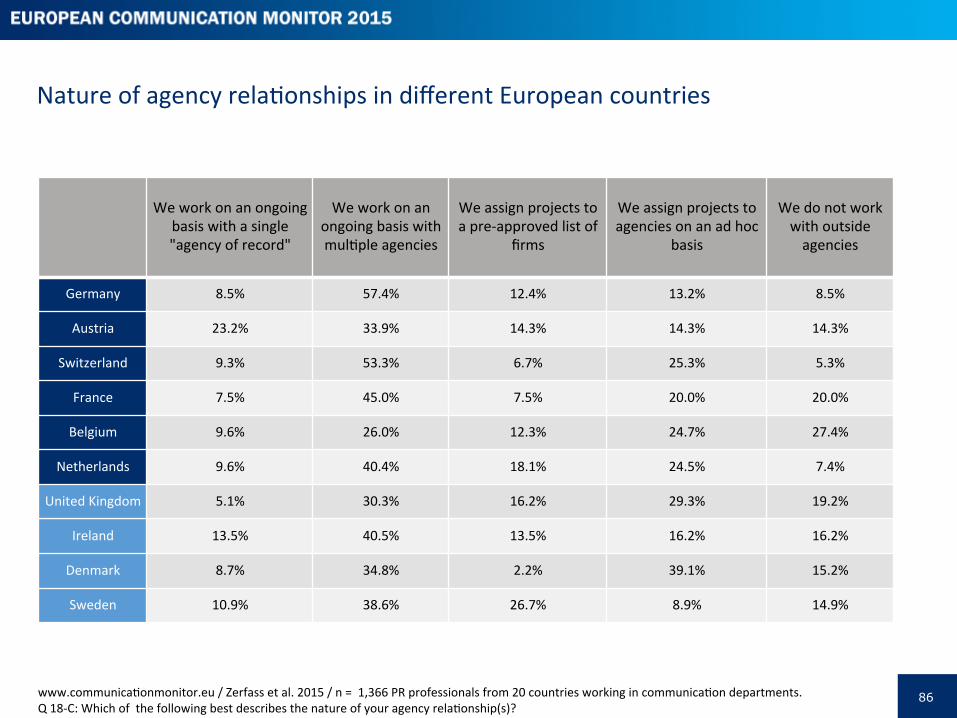
86
Nature of agency relaPonships in different European countries
We work on an ongoing basis with a single "agency of record"
We work on an ongoing basis with mulPple agencies
We assign projects to a pre-‐approved list of
firms
We assign projects to agencies on an ad hoc
basis
We do not work with outside agencies
Germany 8.5% 57.4% 12.4% 13.2% 8.5%
Austria 23.2% 33.9% 14.3% 14.3% 14.3%
Switzerland 9.3% 53.3% 6.7% 25.3% 5.3%
France 7.5% 45.0% 7.5% 20.0% 20.0%
Belgium 9.6% 26.0% 12.3% 24.7% 27.4%
Netherlands 9.6% 40.4% 18.1% 24.5% 7.4%
United Kingdom 5.1% 30.3% 16.2% 29.3% 19.2%
Ireland 13.5% 40.5% 13.5% 16.2% 16.2%
Denmark 8.7% 34.8% 2.2% 39.1% 15.2%
Sweden 10.9% 38.6% 26.7% 8.9% 14.9%
www.communicaPonmonitor.eu / Zerfass et al. 2015 / n = 1,366 PR professionals from 20 countries working in communicaPon departments. Q 18-‐C: Which of the following best describes the nature of your agency relaPonship(s)?

87
Nature of agency relaPonships in different European countries
We work on an ongoing basis with a single "agency of record"
We work on an ongoing basis with mulPple agencies
We assign projects to a pre-‐approved list of
firms
We assign projects to agencies on an ad hoc
basis
We do not work with outside agencies
Norway 13.6% 20.3% 13.6% 37.3% 15.3%
Finland 22.0% 44.0% 8.0% 14.0% 12.0%
Spain 20.5% 34.2% 2.7% 17.8% 24.7%
Portugal 30.0% 25.0% 10.0% 12.5% 22.5%
Italy 15.7% 33.7% 7.9% 28.1% 14.6%
Slovenia 10.7% 28.0% 6.7% 12.0% 42.7%
CroaPa 14.3% 18.2% 7.8% 16.9% 42.9%
Turkey 25.8% 45.2% 6.5% 3.2% 19.4%
Romania 13.9% 31.6% 11.4% 7.6% 35.4%
Ukraine 20.9% 25.6% 11.6% 18.6% 23.3%
www.communicaPonmonitor.eu / Zerfass et al. 2015 / n = 1,366 PR professionals from 20 countries working in communicaPon departments. Q 18-‐C: Which of the following best describes the nature of your agency relaPonship(s)?
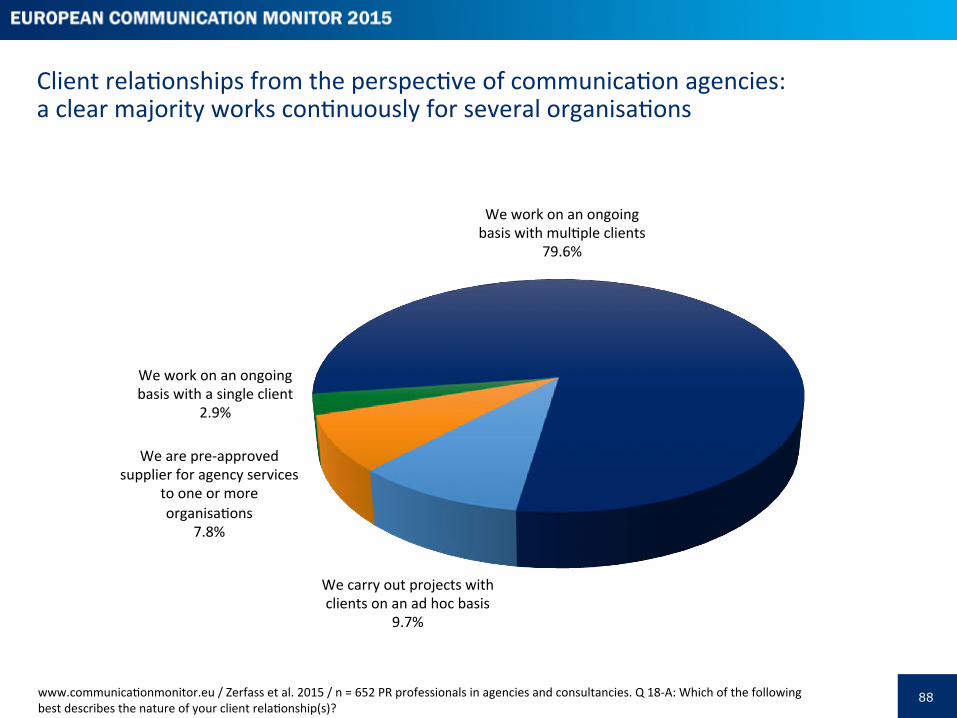
88
We work on an ongoing basis with mulPple clients
79.6%
We carry out projects with clients on an ad hoc basis
9.7%
We are pre-‐approved supplier for agency services
to one or more organisaPons
7.8%
We work on an ongoing basis with a single client
2.9%
Client relaPonships from the perspecPve of communicaPon agencies: a clear majority works conPnuously for several organisaPons
www.communicaPonmonitor.eu / Zerfass et al. 2015 / n = 652 PR professionals in agencies and consultancies. Q 18-‐A: Which of the following best describes the nature of your client relaPonship(s)?
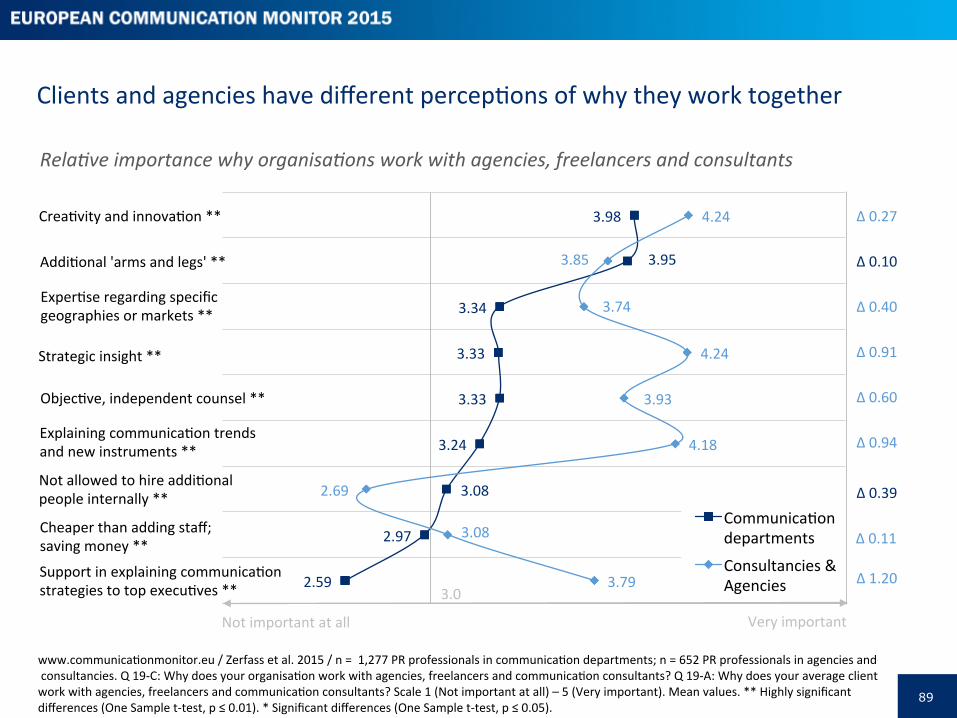
89
Clients and agencies have different percepPons of why they work together
3.98
3.95
3.34
3.33
3.33
3.24
3.08
2.97
2.59
4.24
3.85
3.74
4.24
3.93
4.18
2.69
3.08
3.79
CommunicaPon departments
Consultancies & Agencies
ObjecPve, independent counsel **
CreaPvity and innovaPon **
AddiPonal 'arms and legs' **
Strategic insight **
Cheaper than adding staff; saving money **
Very important
Explaining communicaPon trends and new instruments **
ExperPse regarding specific geographies or markets **
Support in explaining communicaPon strategies to top execuPves **
Not allowed to hire addiPonal people internally **
www.communicaPonmonitor.eu / Zerfass et al. 2015 / n = 1,277 PR professionals in communicaPon departments; n = 652 PR professionals in agencies and consultancies. Q 19-‐C: Why does your organisaPon work with agencies, freelancers and communicaPon consultants? Q 19-‐A: Why does your average client work with agencies, freelancers and communicaPon consultants? Scale 1 (Not important at all) – 5 (Very important). Mean values. ** Highly significant differences (One Sample t-‐test, p ≤ 0.01). * Significant differences (One Sample t-‐test, p ≤ 0.05).
Rela0ve importance why organisa0ons work with agencies, freelancers and consultants
Not important at all
3.0
Δ 0.27
Δ 0.10
Δ 0.40
Δ 0.91
Δ 0.60
Δ 0.94
Δ 0.39
Δ 0.11
Δ 1.20

90
Country-‐to-‐country analysis: Why communicaPon departments work with agencies
Strategic insight
CreaPvity and inno-‐vaPon
ObjecPve. indepen-‐dent
counsel
Cheaper than
adding staff; saving money
Not allowed to hire
addiPonal people
internally
AddiPonal 'arms and legs'
ExperPse regarding specific
geographies or markets
Support in explaining
communicaPon strategies to top
execuPves
Explaining / understanding communicaPon trends and new instruments
Germany 39.5% 78.2% 46.2% 38.7% 39.5% 79.8% 44.5% 18.5% 42.0%
Austria 29.2% 77.1% 41.7% 29.2% 37.5% 79.2% 47.9% 35.4% 50.0%
Switzerland 46.5% 67.6% 53.5% 42.3% 39.4% 71.8% 64.8% 25.4% 38.0%
France 46.9% 46.9% 40.6% 37.5% 50.0% 78.1% 46.9% 18.8% 43.8%
Belgium 38.9% 74.1% 33.3% 31.5% 59.3% 77.8% 33.3% 13.0% 35.2%
Netherlands 41.4% 81.6% 49.4% 32.2% 39.1% 81.6% 47.1% 19.5% 42.5%
United Kingdom 52.5% 71.3% 53.8% 26.3% 28.8% 76.3% 67.5% 17.5% 35.0%
Ireland 59.4% 40.6% 53.1% 18.8% 34.4% 53.1% 56.3% 31.3% 43.8%
Denmark 46.2% 76.9% 25.6% 38.5% 25.6% 59.0% 38.5% 28.2% 25.6%
Sweden 41.9% 73.3% 38.4% 33.7% 46.5% 74.4% 31.4% 22.1% 39.5%
www.communicaPonmonitor.eu / Zerfass et al. 2015 / n = 1,104 PR professionals from 20 countries working in communicaPon departments. Q 19-‐C: Why does your organisaPon work with agencies, freelancers and communicaPon consultants? Scale 1 (Not important at all) – 5 (Very important). Percentages: Importance based on scale points 4-‐5.
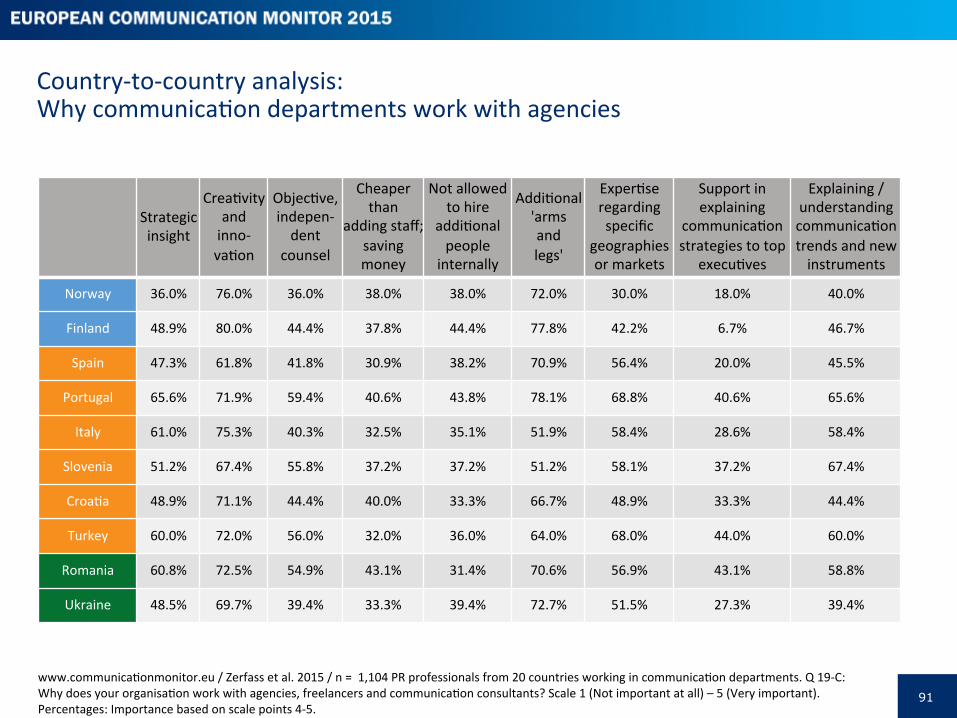
91
Strategic insight
CreaPvity and inno-‐vaPon
ObjecPve, indepen-‐dent
counsel
Cheaper than
adding staff; saving money
Not allowed to hire
addiPonal people
internally
AddiPonal 'arms and legs'
ExperPse regarding specific
geographies or markets
Support in explaining
communicaPon strategies to top
execuPves
Explaining / understanding communicaPon trends and new instruments
Norway 36.0% 76.0% 36.0% 38.0% 38.0% 72.0% 30.0% 18.0% 40.0%
Finland 48.9% 80.0% 44.4% 37.8% 44.4% 77.8% 42.2% 6.7% 46.7%
Spain 47.3% 61.8% 41.8% 30.9% 38.2% 70.9% 56.4% 20.0% 45.5%
Portugal 65.6% 71.9% 59.4% 40.6% 43.8% 78.1% 68.8% 40.6% 65.6%
Italy 61.0% 75.3% 40.3% 32.5% 35.1% 51.9% 58.4% 28.6% 58.4%
Slovenia 51.2% 67.4% 55.8% 37.2% 37.2% 51.2% 58.1% 37.2% 67.4%
CroaPa 48.9% 71.1% 44.4% 40.0% 33.3% 66.7% 48.9% 33.3% 44.4%
Turkey 60.0% 72.0% 56.0% 32.0% 36.0% 64.0% 68.0% 44.0% 60.0%
Romania 60.8% 72.5% 54.9% 43.1% 31.4% 70.6% 56.9% 43.1% 58.8%
Ukraine 48.5% 69.7% 39.4% 33.3% 39.4% 72.7% 51.5% 27.3% 39.4%
www.communicaPonmonitor.eu / Zerfass et al. 2015 / n = 1,104 PR professionals from 20 countries working in communicaPon departments. Q 19-‐C: Why does your organisaPon work with agencies, freelancers and communicaPon consultants? Scale 1 (Not important at all) – 5 (Very important). Percentages: Importance based on scale points 4-‐5.
Country-‐to-‐country analysis: Why communicaPon departments work with agencies
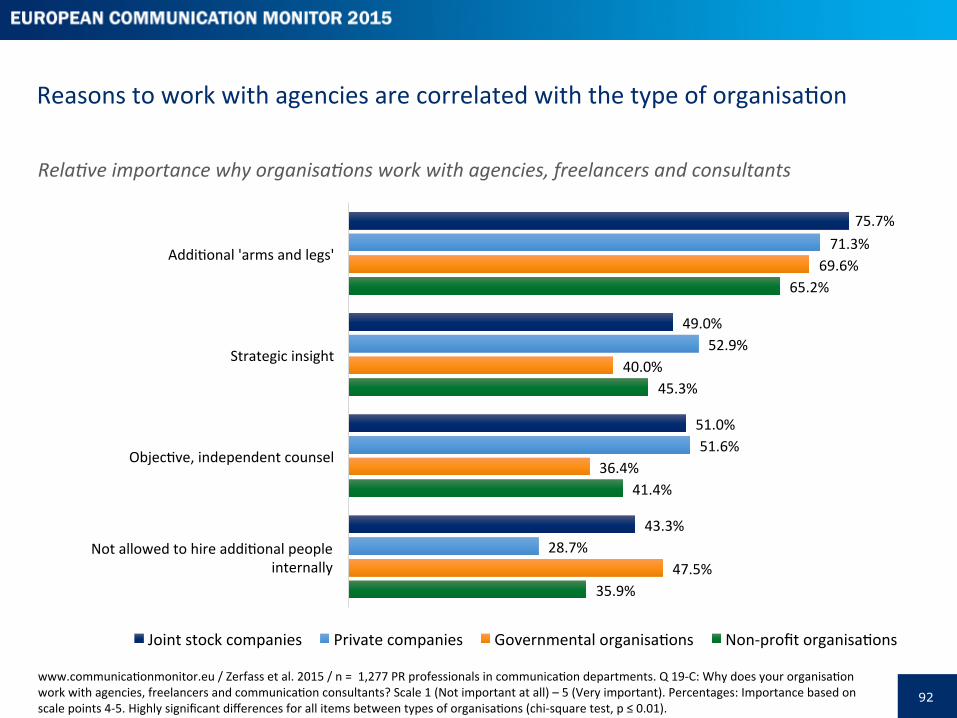
92
75.7%
49.0%
51.0%
43.3%
71.3%
52.9%
51.6%
28.7%
69.6%
40.0%
36.4%
47.5%
65.2%
45.3%
41.4%
35.9%
AddiPonal 'arms and legs'
Strategic insight
ObjecPve, independent counsel
Not allowed to hire addiPonal people internally
Joint stock companies Private companies Governmental organisaPons Non-‐profit organisaPons
Reasons to work with agencies are correlated with the type of organisaPon
www.communicaPonmonitor.eu / Zerfass et al. 2015 / n = 1,277 PR professionals in communicaPon departments. Q 19-‐C: Why does your organisaPon work with agencies, freelancers and communicaPon consultants? Scale 1 (Not important at all) – 5 (Very important). Percentages: Importance based on scale points 4-‐5. Highly significant differences for all items between types of organisaPons (chi-‐square test, p ≤ 0.01).
Rela0ve importance why organisa0ons work with agencies, freelancers and consultants
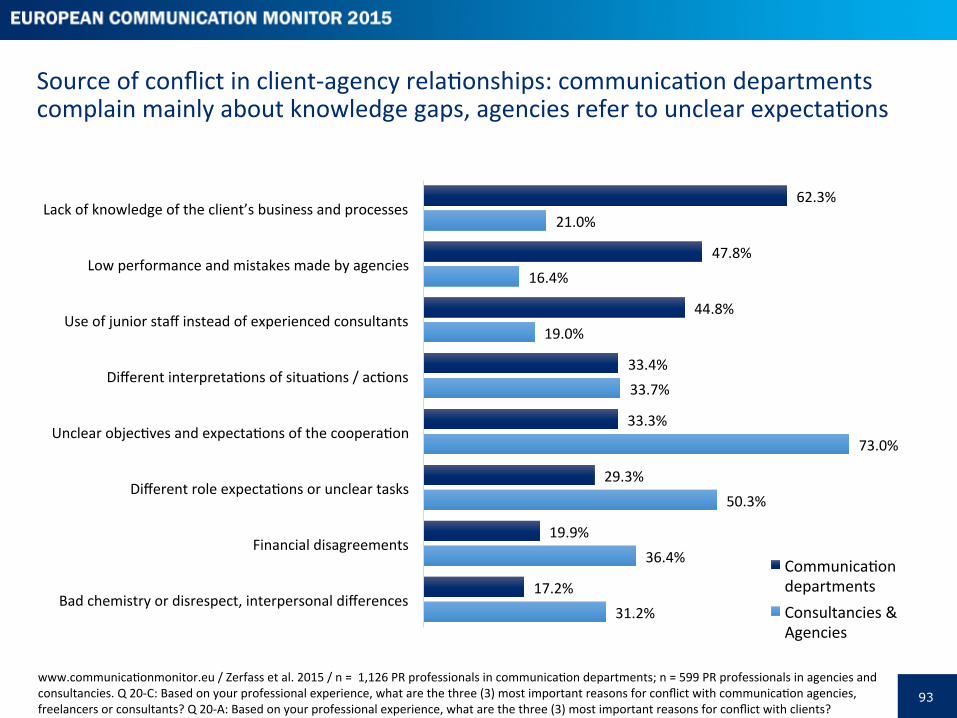
93
Source of conflict in client-‐agency relaPonships: communicaPon departments complain mainly about knowledge gaps, agencies refer to unclear expectaPons
www.communicaPonmonitor.eu / Zerfass et al. 2015 / n = 1,126 PR professionals in communicaPon departments; n = 599 PR professionals in agencies and consultancies. Q 20-‐C: Based on your professional experience, what are the three (3) most important reasons for conflict with communicaPon agencies, freelancers or consultants? Q 20-‐A: Based on your professional experience, what are the three (3) most important reasons for conflict with clients?
62.3%
47.8%
44.8%
33.4%
33.3%
29.3%
19.9%
17.2%
21.0%
16.4%
19.0%
33.7%
73.0%
50.3%
36.4%
31.2%
Lack of knowledge of the client’s business and processes
Low performance and mistakes made by agencies
Use of junior staff instead of experienced consultants
Different interpretaPons of situaPons / acPons
Unclear objecPves and expectaPons of the cooperaPon
Different role expectaPons or unclear tasks
Financial disagreements
Bad chemistry or disrespect, interpersonal differences
CommunicaPon departments Consultancies & Agencies
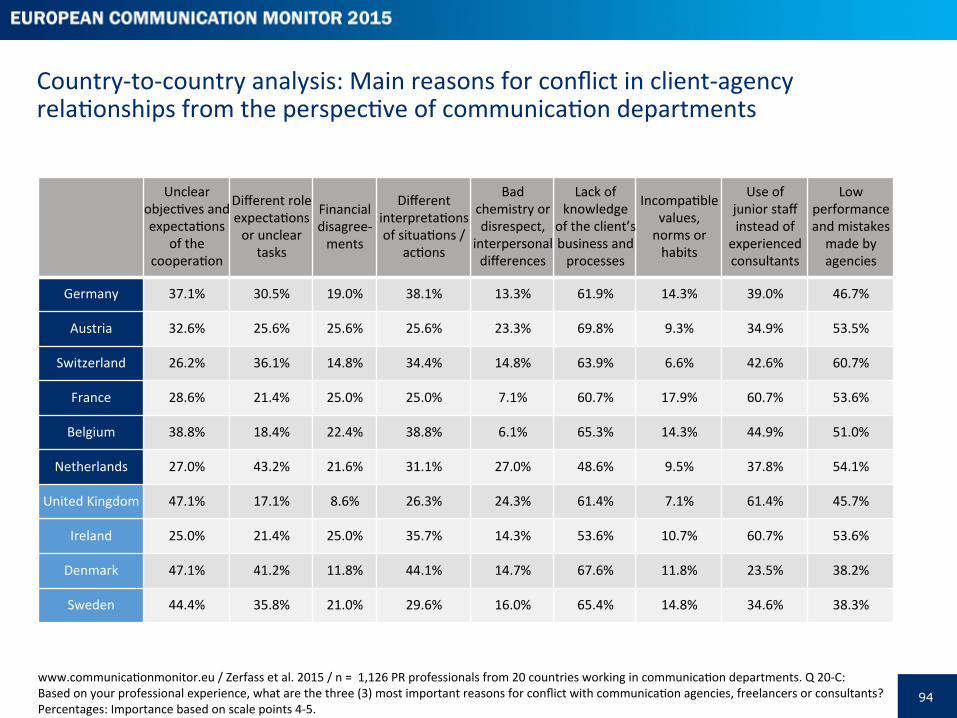
94
Country-‐to-‐country analysis: Main reasons for conflict in client-‐agency relaPonships from the perspecPve of communicaPon departments
Unclear objecPves and expectaPons
of the cooperaPon
Different role expectaPons or unclear
tasks
Financial disagree-‐ments
Different interpretaPons of situaPons /
acPons
Bad chemistry or disrespect,
interpersonal differences
Lack of knowledge
of the client’s business and processes
IncompaPble values, norms or habits
Use of junior staff instead of experienced consultants
Low performance and mistakes made by agencies
Germany 37.1% 30.5% 19.0% 38.1% 13.3% 61.9% 14.3% 39.0% 46.7%
Austria 32.6% 25.6% 25.6% 25.6% 23.3% 69.8% 9.3% 34.9% 53.5%
Switzerland 26.2% 36.1% 14.8% 34.4% 14.8% 63.9% 6.6% 42.6% 60.7%
France 28.6% 21.4% 25.0% 25.0% 7.1% 60.7% 17.9% 60.7% 53.6%
Belgium 38.8% 18.4% 22.4% 38.8% 6.1% 65.3% 14.3% 44.9% 51.0%
Netherlands 27.0% 43.2% 21.6% 31.1% 27.0% 48.6% 9.5% 37.8% 54.1%
United Kingdom 47.1% 17.1% 8.6% 26.3% 24.3% 61.4% 7.1% 61.4% 45.7%
Ireland 25.0% 21.4% 25.0% 35.7% 14.3% 53.6% 10.7% 60.7% 53.6%
Denmark 47.1% 41.2% 11.8% 44.1% 14.7% 67.6% 11.8% 23.5% 38.2%
Sweden 44.4% 35.8% 21.0% 29.6% 16.0% 65.4% 14.8% 34.6% 38.3%
www.communicaPonmonitor.eu / Zerfass et al. 2015 / n = 1,126 PR professionals from 20 countries working in communicaPon departments. Q 20-‐C: Based on your professional experience, what are the three (3) most important reasons for conflict with communicaPon agencies, freelancers or consultants? Percentages: Importance based on scale points 4-‐5.
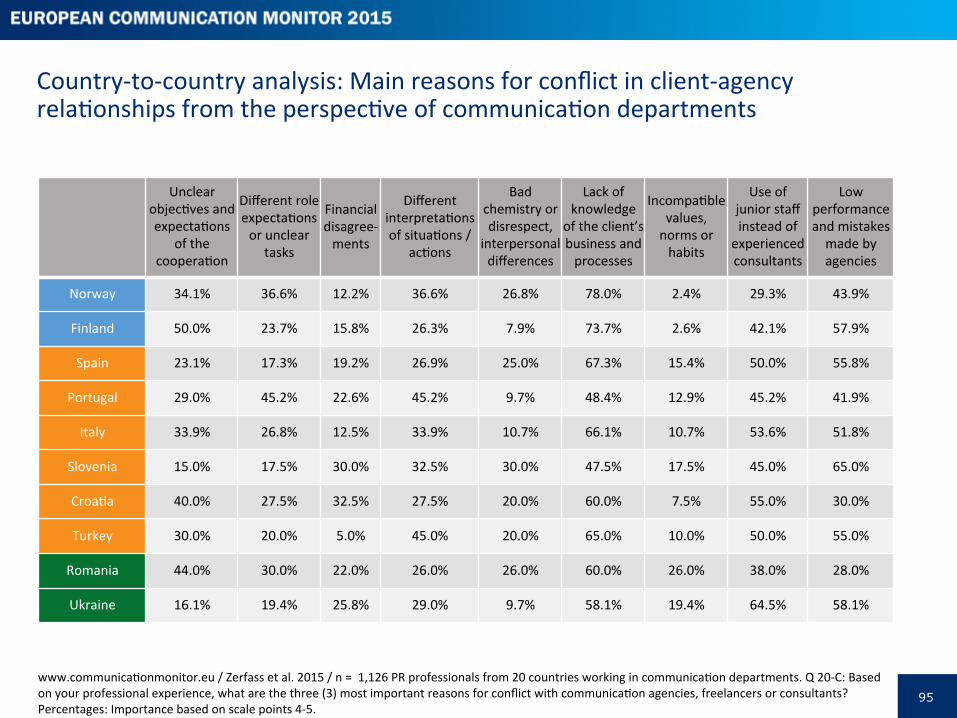
95
Unclear objecPves and expectaPons
of the cooperaPon
Different role expectaPons or unclear
tasks
Financial disagree-‐ments
Different interpretaPons of situaPons /
acPons
Bad chemistry or disrespect,
interpersonal differences
Lack of knowledge
of the client’s business and processes
IncompaPble values, norms or habits
Use of junior staff instead of experienced consultants
Low performance and mistakes made by agencies
Norway 34.1% 36.6% 12.2% 36.6% 26.8% 78.0% 2.4% 29.3% 43.9%
Finland 50.0% 23.7% 15.8% 26.3% 7.9% 73.7% 2.6% 42.1% 57.9%
Spain 23.1% 17.3% 19.2% 26.9% 25.0% 67.3% 15.4% 50.0% 55.8%
Portugal 29.0% 45.2% 22.6% 45.2% 9.7% 48.4% 12.9% 45.2% 41.9%
Italy 33.9% 26.8% 12.5% 33.9% 10.7% 66.1% 10.7% 53.6% 51.8%
Slovenia 15.0% 17.5% 30.0% 32.5% 30.0% 47.5% 17.5% 45.0% 65.0%
CroaPa 40.0% 27.5% 32.5% 27.5% 20.0% 60.0% 7.5% 55.0% 30.0%
Turkey 30.0% 20.0% 5.0% 45.0% 20.0% 65.0% 10.0% 50.0% 55.0%
Romania 44.0% 30.0% 22.0% 26.0% 26.0% 60.0% 26.0% 38.0% 28.0%
Ukraine 16.1% 19.4% 25.8% 29.0% 9.7% 58.1% 19.4% 64.5% 58.1%
Country-‐to-‐country analysis: Main reasons for conflict in client-‐agency relaPonships from the perspecPve of communicaPon departments
www.communicaPonmonitor.eu / Zerfass et al. 2015 / n = 1,126 PR professionals from 20 countries working in communicaPon departments. Q 20-‐C: Based on your professional experience, what are the three (3) most important reasons for conflict with communicaPon agencies, freelancers or consultants? Percentages: Importance based on scale points 4-‐5.
Salaries

97
Chapter overview
Each year the European CommunicaPon Monitor data report on the important demographic variables of age, gender, organisaPonal posiPon and type of organisaPon as well as the most easily compared figures on salary or rates of pay across the sample which, for this year, was 41 countries across Europe. However it has to be noted that variaPons in this secPon will be influenced by different composiPons of the sample in each ediPon of the survey.
In 2015 the majority of pracPPoners in Europe earn less than €60,000 per year (54.7 per cent) and a quarter (25.1 per cent) earn even less than €30,000 per year. In this last category are the majority of respondents from Romania, Ukraine, CroaPa and Slovenia. At the top end of the pay scales across the 41 countries the numbers are small and with sharp regional differences. For example only a fracPon of the top earning pracPPoners are making over €300,000 (1.6 per cent), followed by another small fracPon of pracPPoners whose pay is between €200,001 and €300,000 (2.2 per cent), and 4.3 per cent of pracPPoners are making between €150,001 and €200,000 per year.
Generally, joint stock companies pay bemer than agencies, private companies, non-‐profit and governmental organisaPons. There are, however, big differences between countries. While there are only 1.3 per cent of respondents from Switzerland that make less than €30,000, there are 40.0 per cent of respondents from that country with a salary of over €150,000 per year. At the top end of the salary scales and bandings, Switzerland is a clear outlier, with the next country showing nearly a fiph of their respondents at the top end being Germany with 18.0 per cent making over €150,00, followed by Norway with 17.2 per cent and the United Kingdom with 15.1 per cent of respondents.
As with previous years in the ECM survey there is a gender divide and the results demonstrate significant differences in the salaries recorded for male and female pracPPoners. Put simply and repeaPng past ediPons of this survey (Zerfass et al., 2010, 2011, 2014) men earn more than women. At the top side, there are nearly three Pmes more male heads of communicaPon who make more than €150,000 than female pracPPoners, 20.6 per cent of men against 7.1 per cent of women in these top roles. On the other hand there are nearly twice as many female heads of communicaPon who make less than €30,000 (20.7 per cent) when compared with their male counterparts as heads of communicaPon earning the lower level (10.5 per cent). When reviewing the other posiPons outside the top pracPPoner posiPons then the gender differences are smaller, but sPll significant. For example at all levels it is clear that male pracPPoners earn more than female pracPPoners. A trend that has consistently been recorded and reported in the ECM over past years and discussed in wider literature for the industry (Fielden et al., 2003; Grunig et al., 2001; Tench & Laville; 2014).
On the salary debate there is once again good news from this survey about membership of the European AssociaPon of Communi-‐caPon Directors (EACD) and its correlaPon with levels of pay. There are significantly more EACD members in the ranks of the bemer paid pracPPoners and more non-‐members among the least paid pracPPoners.
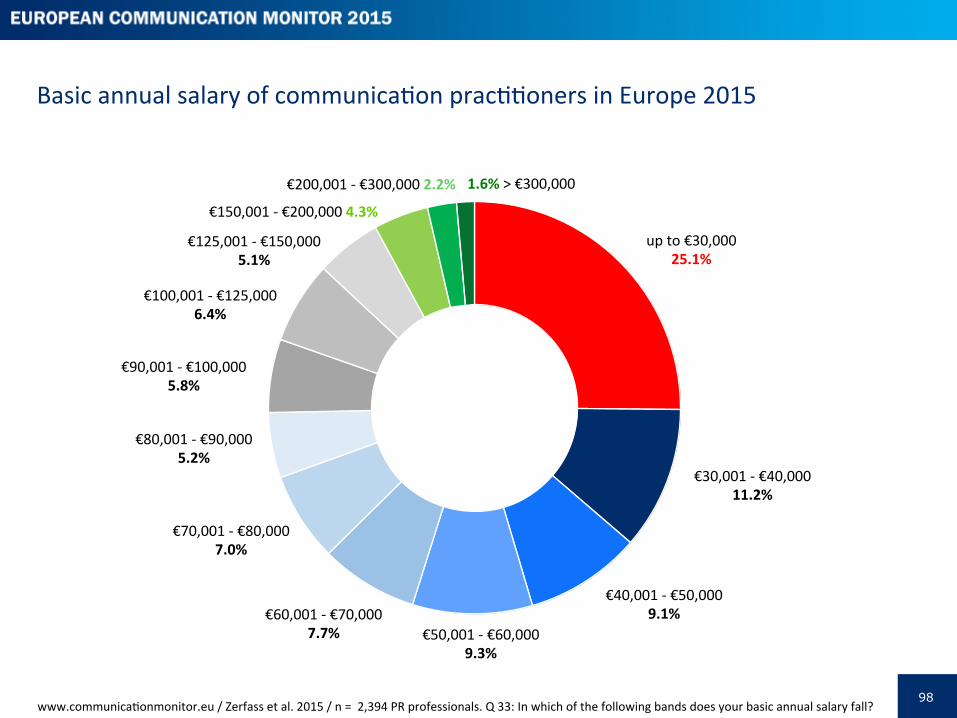
98
Basic annual salary of communicaPon pracPPoners in Europe 2015
www.communicaPonmonitor.eu / Zerfass et al. 2015 / n = 2,394 PR professionals. Q 33: In which of the following bands does your basic annual salary fall?
up to €30,000 25.1%
€30,001 -‐ €40,000 11.2%
€40,001 -‐ €50,000 9.1%
€50,001 -‐ €60,000 9.3%
€60,001 -‐ €70,000 7.7%
€70,001 -‐ €80,000 7.0%
€80,001 -‐ €90,000 5.2%
€90,001 -‐ €100,000 5.8%
€100,001 -‐ €125,000 6.4%
€125,001 -‐ €150,000 5.1%
€150,001 -‐ €200,000 4.3%
€200,001 -‐ €300,000 2.2% 1.6% > €300,000
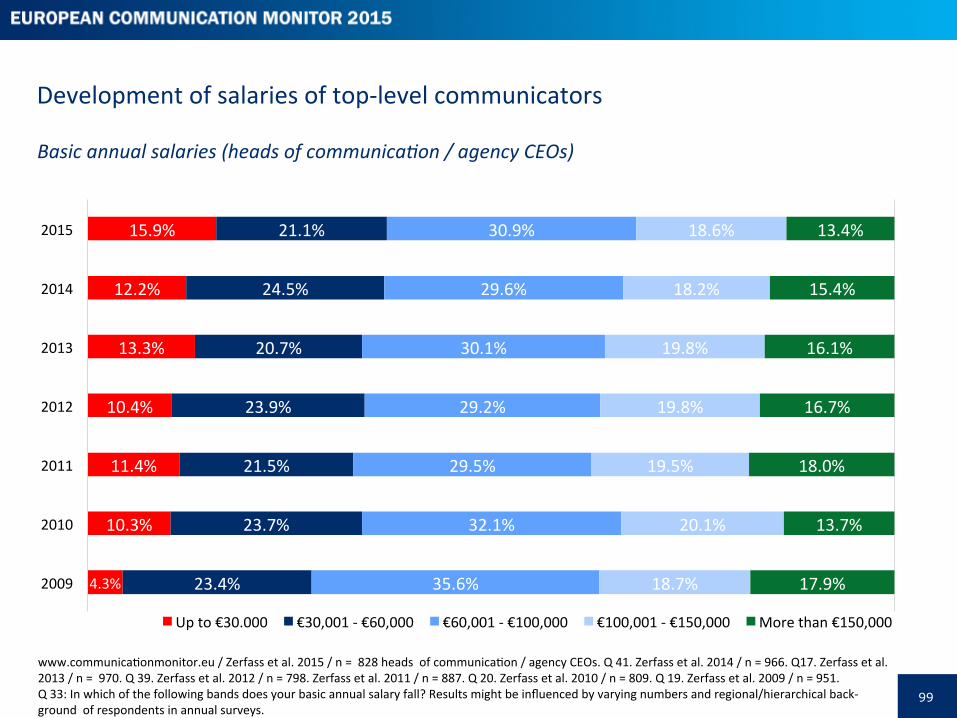
99
Development of salaries of top-‐level communicators
www.communicaPonmonitor.eu / Zerfass et al. 2015 / n = 828 heads of communicaPon / agency CEOs. Q 41. Zerfass et al. 2014 / n = 966. Q17. Zerfass et al. 2013 / n = 970. Q 39. Zerfass et al. 2012 / n = 798. Zerfass et al. 2011 / n = 887. Q 20. Zerfass et al. 2010 / n = 809. Q 19. Zerfass et al. 2009 / n = 951. Q 33: In which of the following bands does your basic annual salary fall? Results might be influenced by varying numbers and regional/hierarchical back-‐ ground of respondents in annual surveys.
4.3%
10.3%
11.4%
10.4%
13.3%
12.2%
15.9%
23.4%
23.7%
21.5%
23.9%
20.7%
24.5%
21.1%
35.6%
32.1%
29.5%
29.2%
30.1%
29.6%
30.9%
18.7%
20.1%
19.5%
19.8%
19.8%
18.2%
18.6%
17.9%
13.7%
18.0%
16.7%
16.1%
15.4%
13.4%
2009
2010
2011
2012
2013
2014
2015
Up to €30.000 €30,001 -‐ €60,000 €60,001 -‐ €100,000 €100,001 -‐ €150,000 More than €150,000
Basic annual salaries (heads of communica0on / agency CEOs)
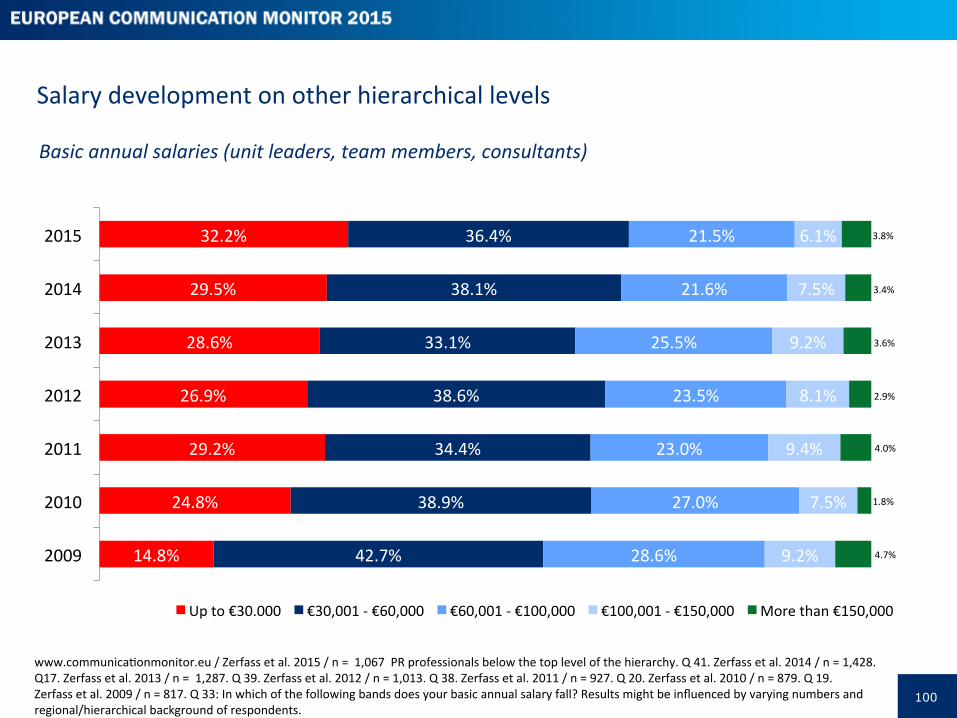
100
Salary development on other hierarchical levels
www.communicaPonmonitor.eu / Zerfass et al. 2015 / n = 1,067 PR professionals below the top level of the hierarchy. Q 41. Zerfass et al. 2014 / n = 1,428. Q17. Zerfass et al. 2013 / n = 1,287. Q 39. Zerfass et al. 2012 / n = 1,013. Q 38. Zerfass et al. 2011 / n = 927. Q 20. Zerfass et al. 2010 / n = 879. Q 19. Zerfass et al. 2009 / n = 817. Q 33: In which of the following bands does your basic annual salary fall? Results might be influenced by varying numbers and regional/hierarchical background of respondents.
Basic annual salaries (unit leaders, team members, consultants)
14.8%
24.8%
29.2%
26.9%
28.6%
29.5%
32.2%
42.7%
38.9%
34.4%
38.6%
33.1%
38.1%
36.4%
28.6%
27.0%
23.0%
23.5%
25.5%
21.6%
21.5%
9.2%
7.5%
9.4%
8.1%
9.2%
7.5%
6.1%
4.7%
1.8%
4.0%
2.9%
3.6%
3.4%
3.8%
2009
2010
2011
2012
2013
2014
2015
Up to €30.000 €30,001 -‐ €60,000 €60,001 -‐ €100,000 €100,001 -‐ €150,000 More than €150,000
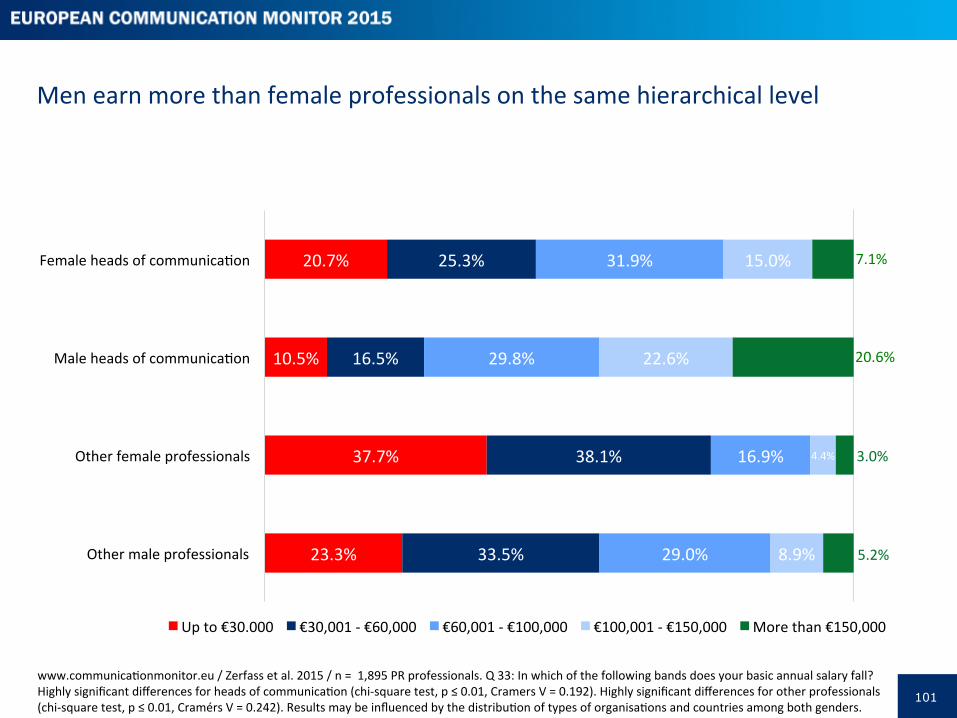
101
Men earn more than female professionals on the same hierarchical level
www.communicaPonmonitor.eu / Zerfass et al. 2015 / n = 1,895 PR professionals. Q 33: In which of the following bands does your basic annual salary fall? Highly significant differences for heads of communicaPon (chi-‐square test, p ≤ 0.01, Cramers V = 0.192). Highly significant differences for other professionals (chi-‐square test, p ≤ 0.01, Cramérs V = 0.242). Results may be influenced by the distribuPon of types of organisaPons and countries among both genders.
20.7%
10.5%
37.7%
23.3%
25.3%
16.5%
38.1%
33.5%
31.9%
29.8%
16.9%
29.0%
15.0%
22.6%
4.4%
8.9%
7.1%
20.6%
3.0%
5.2%
Female heads of communicaPon
Male heads of communicaPon
Other female professionals
Other male professionals
Up to €30.000 €30,001 -‐ €60,000 €60,001 -‐ €100,000 €100,001 -‐ €150,000 More than €150,000
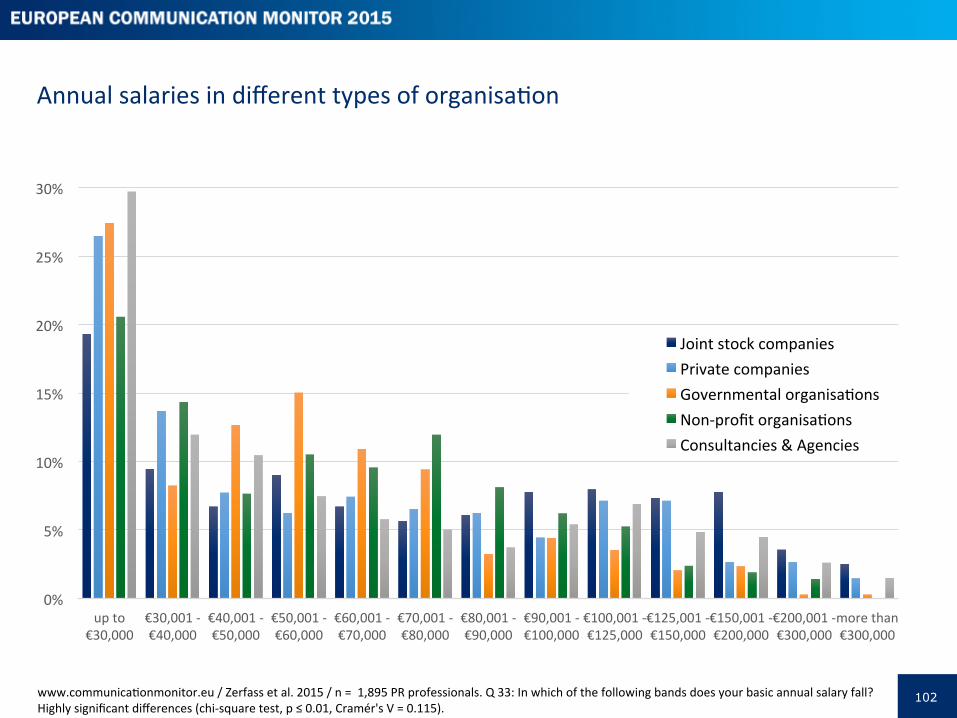
102
Annual salaries in different types of organisaPon
www.communicaPonmonitor.eu / Zerfass et al. 2015 / n = 1,895 PR professionals. Q 33: In which of the following bands does your basic annual salary fall? Highly significant differences (chi-‐square test, p ≤ 0.01, Cramér's V = 0.115).
0%
5%
10%
15%
20%
25%
30%
up to €30,000
€30,001 -‐ €40,000
€40,001 -‐ €50,000
€50,001 -‐ €60,000
€60,001 -‐ €70,000
€70,001 -‐ €80,000
€80,001 -‐ €90,000
€90,001 -‐ €100,000
€100,001 -‐ €125,000
€125,001 -‐ €150,000
€150,001 -‐ €200,000
€200,001 -‐ €300,000
more than €300,000
Joint stock companies Private companies Governmental organisaPons Non-‐profit organisaPons Consultancies & Agencies
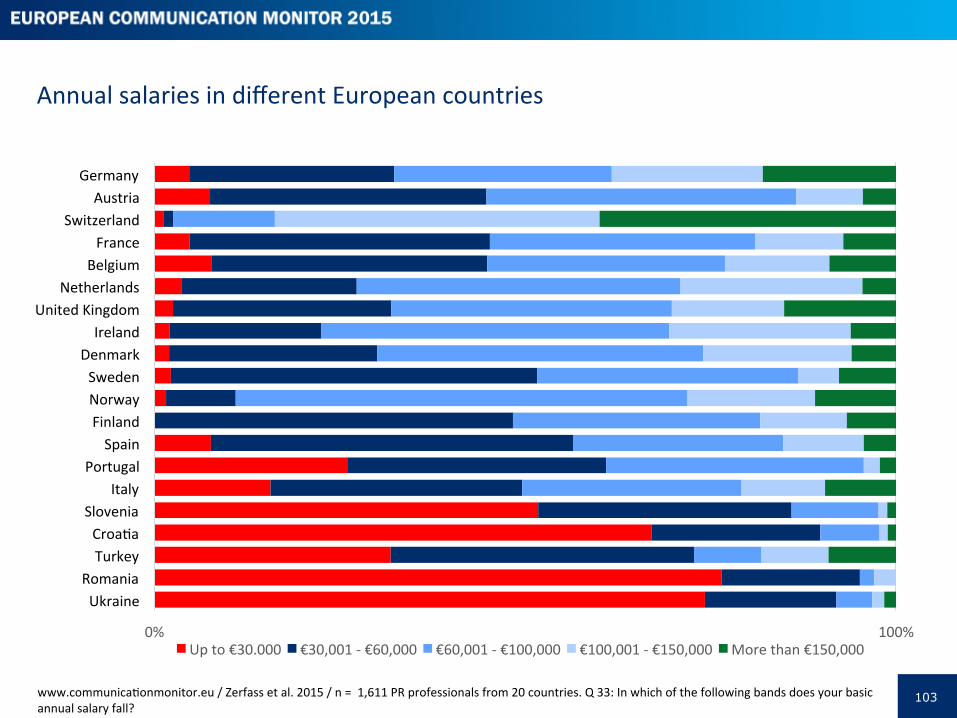
103
Annual salaries in different European countries
www.communicaPonmonitor.eu / Zerfass et al. 2015 / n = 1,611 PR professionals from 20 countries. Q 33: In which of the following bands does your basic annual salary fall?
0% 100%
Germany Austria
Switzerland France
Belgium Netherlands
United Kingdom Ireland
Denmark Sweden Norway Finland Spain
Portugal Italy
Slovenia CroaPa Turkey
Romania Ukraine
Up to €30.000 €30,001 -‐ €60,000 €60,001 -‐ €100,000 €100,001 -‐ €150,000 More than €150,000
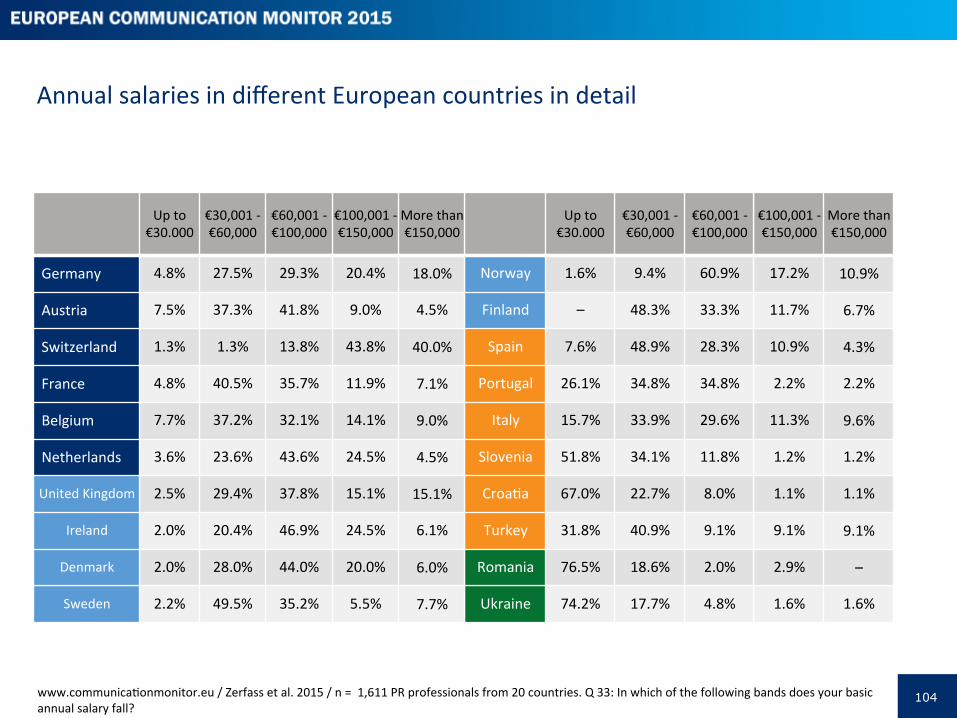
104
Annual salaries in different European countries in detail
Up to €30.000
€30,001 -‐ €60,000
€60,001 -‐ €100,000
€100,001 -‐ €150,000
More than €150,000
Up to €30.000
€30,001 -‐ €60,000
€60,001 -‐ €100,000
€100,001 -‐ €150,000
More than €150,000
Germany 4.8% 27.5% 29.3% 20.4% 18.0% Norway 1.6% 9.4% 60.9% 17.2% 10.9%
Austria 7.5% 37.3% 41.8% 9.0% 4.5% Finland – 48.3% 33.3% 11.7% 6.7%
Switzerland 1.3% 1.3% 13.8% 43.8% 40.0% Spain 7.6% 48.9% 28.3% 10.9% 4.3%
France 4.8% 40.5% 35.7% 11.9% 7.1% Portugal 26.1% 34.8% 34.8% 2.2% 2.2%
Belgium 7.7% 37.2% 32.1% 14.1% 9.0% Italy 15.7% 33.9% 29.6% 11.3% 9.6%
Netherlands 3.6% 23.6% 43.6% 24.5% 4.5% Slovenia 51.8% 34.1% 11.8% 1.2% 1.2%
United Kingdom 2.5% 29.4% 37.8% 15.1% 15.1% CroaPa 67.0% 22.7% 8.0% 1.1% 1.1%
Ireland 2.0% 20.4% 46.9% 24.5% 6.1% Turkey 31.8% 40.9% 9.1% 9.1% 9.1%
Denmark 2.0% 28.0% 44.0% 20.0% 6.0% Romania 76.5% 18.6% 2.0% 2.9% –
Sweden 2.2% 49.5% 35.2% 5.5% 7.7% Ukraine 74.2% 17.7% 4.8% 1.6% 1.6%
www.communicaPonmonitor.eu / Zerfass et al. 2015 / n = 1,611 PR professionals from 20 countries. Q 33: In which of the following bands does your basic annual salary fall?
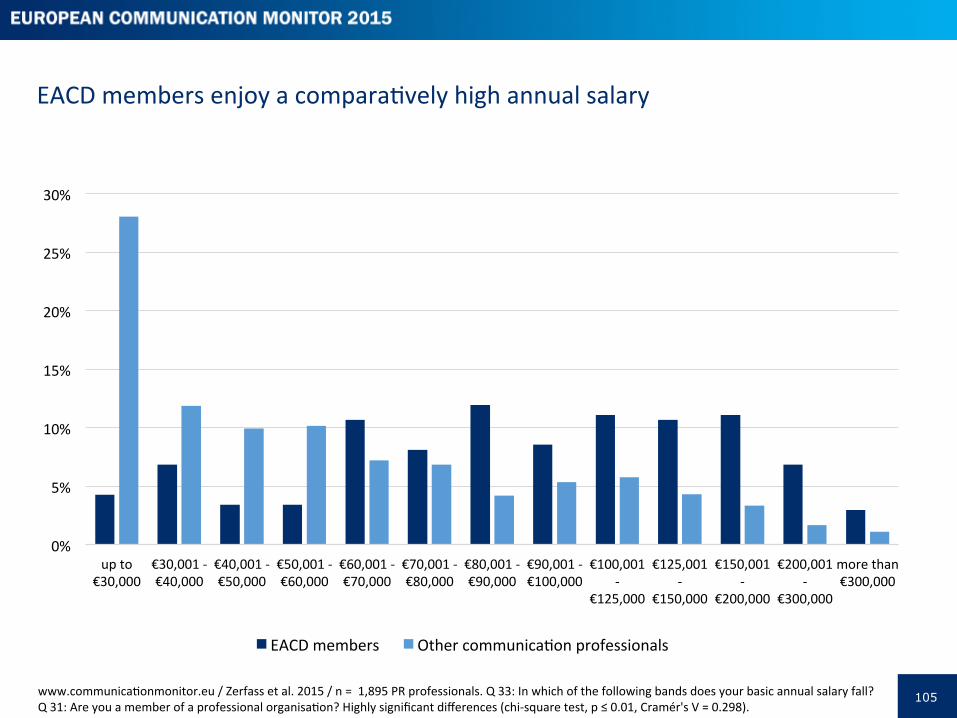
105
EACD members enjoy a comparaPvely high annual salary
www.communicaPonmonitor.eu / Zerfass et al. 2015 / n = 1,895 PR professionals. Q 33: In which of the following bands does your basic annual salary fall? Q 31: Are you a member of a professional organisaPon? Highly significant differences (chi-‐square test, p ≤ 0.01, Cramér's V = 0.298).
0%
5%
10%
15%
20%
25%
30%
up to €30,000
€30,001 -‐ €40,000
€40,001 -‐ €50,000
€50,001 -‐ €60,000
€60,001 -‐ €70,000
€70,001 -‐ €80,000
€80,001 -‐ €90,000
€90,001 -‐ €100,000
€100,001 -‐
€125,000
€125,001 -‐
€150,000
€150,001 -‐
€200,000
€200,001 -‐
€300,000
more than €300,000
EACD members Other communicaPon professionals
Characteris=cs of excellent communica=on func=ons

107
Chapter overview
The ECM 2014 introduced a new method to idenPfy excellent communicaPon funcPons (Zerfass et al., 2014: 132-‐149; Verčič & Zerfass, 2015), combining conceptual consideraPons with self-‐assessments of communicaPon professionals and staPsPcal analyses to idenPfy the characterisPcs which make a difference. The method was applied again this year to divide between organisaPons with excellent commu-‐nicaPon funcPons (Grunig, 1992; Grunig et al., 2002) and all other organisaPons. Excellence is based on the internal standing of the communicaPon funcPon within the organisaPon (influence) and external results of the communicaPon funcPon’s acPviPes as well as the funcPon’s basic qualificaPons (performance). Each of these two components were calculated on the basis of four dimensions, the first on advisory influence (where senior managers take the recommendaPons of the communicaPon funcPon seriously) and execuPve influence (where communicaPon will likely be invited to senior-‐level meePngs dealing with organisaPonal strategic planning), and the second on overall communicaPon success (where the communicaPon of the organisaPon is successful) and department competence (where the quality of the communicaPon funcPon is bemer compared to those of compePng organisaPons). Only organisaPons clearly outperforming in all four dimensions are considered as excellent in the benchmark exercise. This year we idenPfied nearly the same percentage of excellent communicaPons funcPons (23.0 per cent 2015) like in the 2014 monitor survey (21.2 per cent) (Zerfass et al., 2014: 135).
Excellent communicaPon departments use mass media and their products more frequently, they help to reach overall goals more open than other communicaPon funcPons/departments, they have professionals with higher levels of experience in evaluaPon pracPces, and they are more acPve in using insights from communicaPon measurement in their organisaPons. They are also more likely to, and will with increased frequency, collaborate with other funcPons and departments within the organisaPon.
InteresPngly, excellent communicaPon departments also hire agencies and consultancies for different reasons than other communi-‐caPon funcPons. They hire support more open for creaPvity and innovaPon, experPse regarding specific geographies or markets, strategic insight, objecPve counsel and for explaining / understanding communicaPon trends and new instruments. Other, non-‐excellent depart-‐ments more open hire agencies because they are not allowed to hire addiPonal staff internally, because agencies are cheaper than adding staff, so they are saving money. Excellent departments take the lead in organisaPonal listening within their organisaPons and they also engage with more techniques for listening. Excellent departments are more likely to have listening strategies (73.3 per cent) when compared with other communicaPon funcPons (50.1 per cent), and they use more advanced methods of listening and define listening objecPves.
Last but not least, an important amribute of excellence as idenPfied by this study is the ability to explain the value of communicaPon to top execuPves by using arguments related to economic success and the benefit of listening to stakeholders. While excellent depart-‐ments use all modes of explanaPon more intensively, they differenPate most in those two dimensions and in the recollecPon of threats caused by troubled relaPonships and crises. This indicates that communicaPon management has to be conceptualised as a strategic discipline, incorporaPng both messaging and listening, with a clear commitment to demonstrate and evaluate the contribuPon to overall organisaPonal goals.
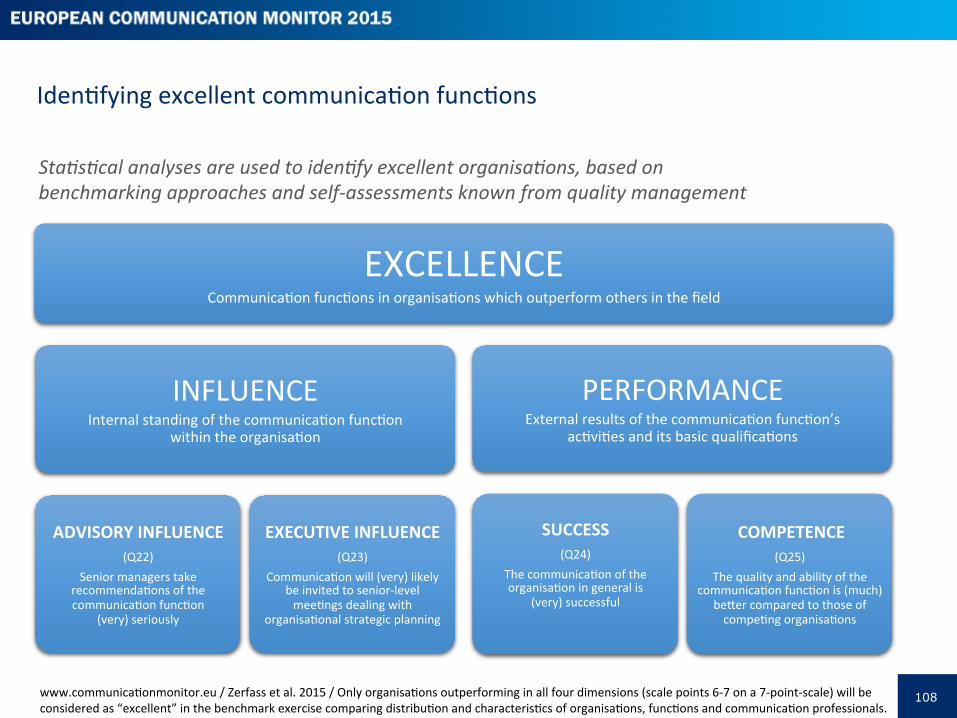
108
IdenPfying excellent communicaPon funcPons
EXCELLENCE CommunicaPon funcPons in organisaPons which outperform others in the field
INFLUENCE Internal standing of the communicaPon funcPon
within the organisaPon
ADVISORY INFLUENCE (Q22)
Senior managers take recommendaPons of the communicaPon funcPon
(very) seriously
EXECUTIVE INFLUENCE (Q23)
CommunicaPon will (very) likely be invited to senior-‐level meePngs dealing with
organisaPonal strategic planning
PERFORMANCE External results of the communicaPon funcPon’s
acPviPes and its basic qualificaPons
SUCCESS (Q24)
The communicaPon of the organisaPon in general is
(very) successful
COMPETENCE (Q25)
The quality and ability of the communicaPon funcPon is (much)
bemer compared to those of compePng organisaPons
Sta0s0cal analyses are used to iden0fy excellent organisa0ons, based on benchmarking approaches and self-‐assessments known from quality management
www.communicaPonmonitor.eu / Zerfass et al. 2015 / Only organisaPons outperforming in all four dimensions (scale points 6-‐7 on a 7-‐point-‐scale) will be considered as “excellent” in the benchmark exercise comparing distribuPon and characterisPcs of organisaPons, funcPons and communicaPon professionals.
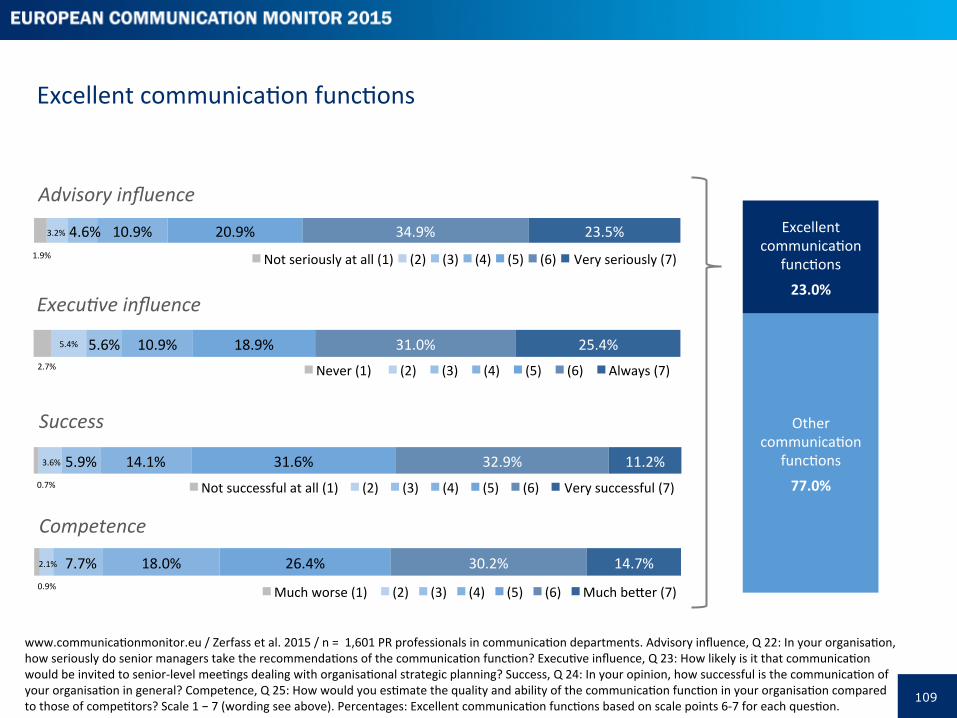
109
Excellent communicaPon funcPons
0.7%
3.6% 5.9% 14.1% 31.6% 32.9% 11.2%
Success
Not successful at all (1) (2) (3) (4) (5) (6) Very successful (7)
www.communicaPonmonitor.eu / Zerfass et al. 2015 / n = 1,601 PR professionals in communicaPon departments. Advisory influence, Q 22: In your organisaPon, how seriously do senior managers take the recommendaPons of the communicaPon funcPon? ExecuPve influence, Q 23: How likely is it that communicaPon would be invited to senior-‐level meePngs dealing with organisaPonal strategic planning? Success, Q 24: In your opinion, how successful is the communicaPon of your organisaPon in general? Competence, Q 25: How would you esPmate the quality and ability of the communicaPon funcPon in your organisaPon compared to those of compePtors? Scale 1 − 7 (wording see above). Percentages: Excellent communicaPon funcPons based on scale points 6-‐7 for each quesPon.
0.9%
2.1% 7.7% 18.0% 26.4% 30.2% 14.7%
Competence
Much worse (1) (2) (3) (4) (5) (6) Much bemer (7)
1.9%
3.2% 4.6% 10.9% 20.9% 34.9% 23.5%
Advisory influence
Not seriously at all (1) (2) (3) (4) (5) (6) Very seriously (7)
2.7%
5.4% 5.6% 10.9% 18.9% 31.0% 25.4%
Execu0ve influence
Never (1) (2) (3) (4) (5) (6) Always (7)
Excellent communicaPon
funcPons
23.0%
Other communicaPon
funcPons
77.0%
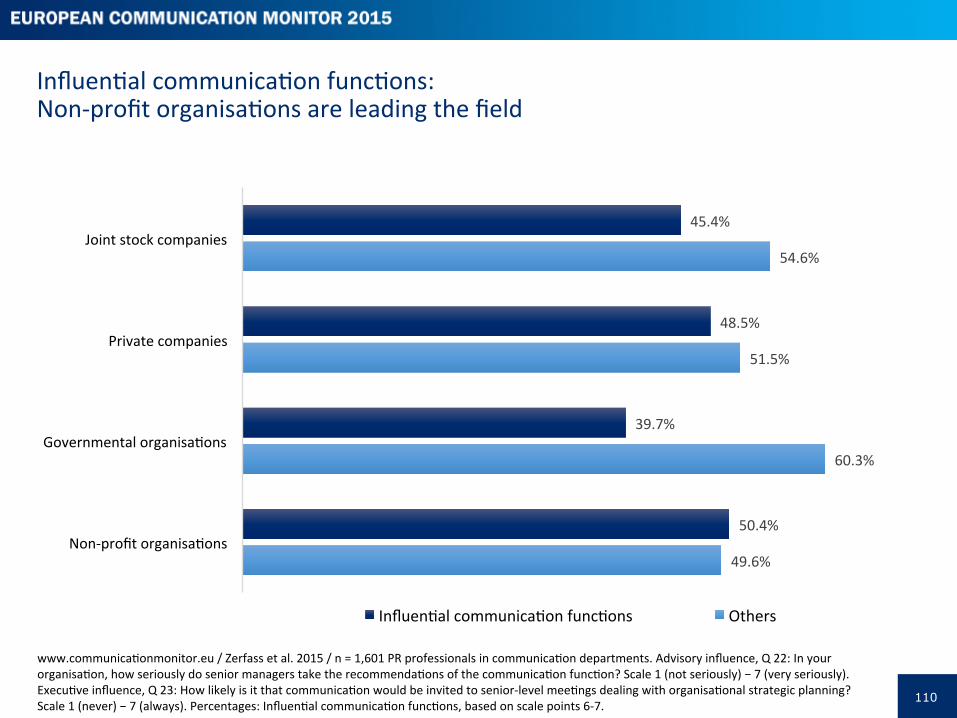
110
InfluenPal communicaPon funcPons: Non-‐profit organisaPons are leading the field
www.communicaPonmonitor.eu / Zerfass et al. 2015 / n = 1,601 PR professionals in communicaPon departments. Advisory influence, Q 22: In your organisaPon, how seriously do senior managers take the recommendaPons of the communicaPon funcPon? Scale 1 (not seriously) − 7 (very seriously). ExecuPve influence, Q 23: How likely is it that communicaPon would be invited to senior-‐level meePngs dealing with organisaPonal strategic planning? Scale 1 (never) − 7 (always). Percentages: InfluenPal communicaPon funcPons, based on scale points 6-‐7.
45.4%
48.5%
39.7%
50.4%
54.6%
51.5%
60.3%
49.6%
Joint stock companies
Private companies
Governmental organisaPons
Non-‐profit organisaPons
InfluenPal communicaPon funcPons Others
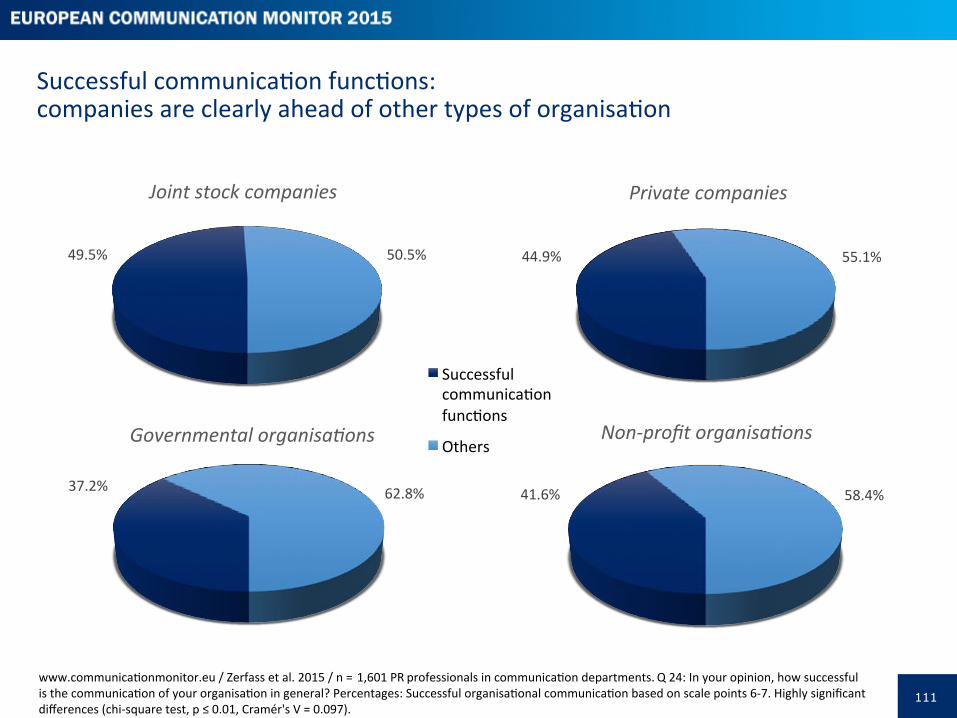
111
Successful communicaPon funcPons: companies are clearly ahead of other types of organisaPon
49.5% 50.5%
Joint stock companies
44.9% 55.1%
Private companies
41.6% 58.4%
Non-‐profit organisa0ons
Successful communicaPon funcPons
Others
www.communicaPonmonitor.eu / Zerfass et al. 2015 / n = 1,601 PR professionals in communicaPon departments. Q 24: In your opinion, how successful is the communicaPon of your organisaPon in general? Percentages: Successful organisaPonal communicaPon based on scale points 6-‐7. Highly significant differences (chi-‐square test, p ≤ 0.01, Cramér's V = 0.097).
37.2% 62.8%
Governmental organisa0ons
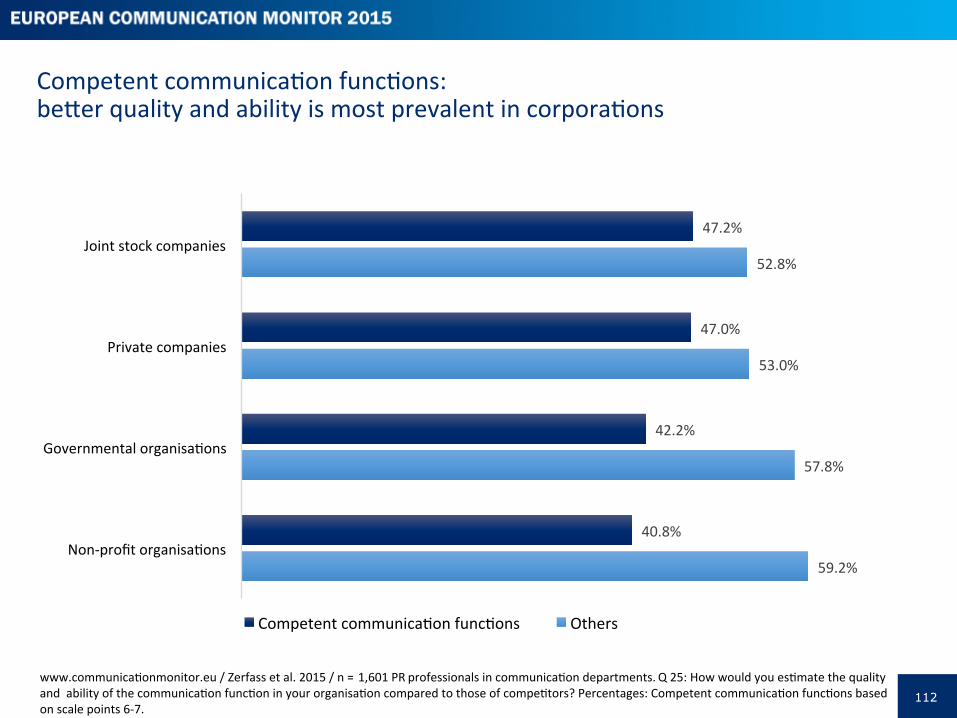
112
Competent communicaPon funcPons: bemer quality and ability is most prevalent in corporaPons
www.communicaPonmonitor.eu / Zerfass et al. 2015 / n = 1,601 PR professionals in communicaPon departments. Q 25: How would you esPmate the quality and ability of the communicaPon funcPon in your organisaPon compared to those of compePtors? Percentages: Competent communicaPon funcPons based on scale points 6-‐7.
47.2%
47.0%
42.2%
40.8%
52.8%
53.0%
57.8%
59.2%
Joint stock companies
Private companies
Governmental organisaPons
Non-‐profit organisaPons
Competent communicaPon funcPons Others
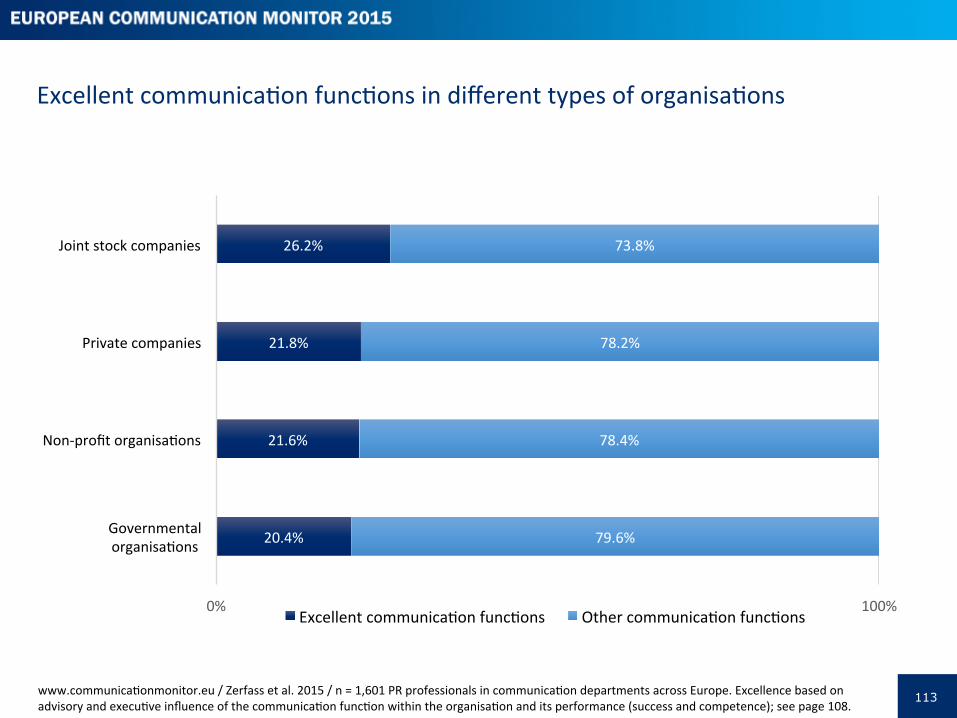
113
Excellent communicaPon funcPons in different types of organisaPons
www.communicaPonmonitor.eu / Zerfass et al. 2015 / n = 1,601 PR professionals in communicaPon departments across Europe. Excellence based on advisory and execuPve influence of the communicaPon funcPon within the organisaPon and its performance (success and competence); see page 108.
26.2%
21.8%
21.6%
20.4%
73.8%
78.2%
78.4%
79.6%
0% 100%
Joint stock companies
Private companies
Non-‐profit organisaPons
Governmental organisaPons
Excellent communicaPon funcPons Other communicaPon funcPons
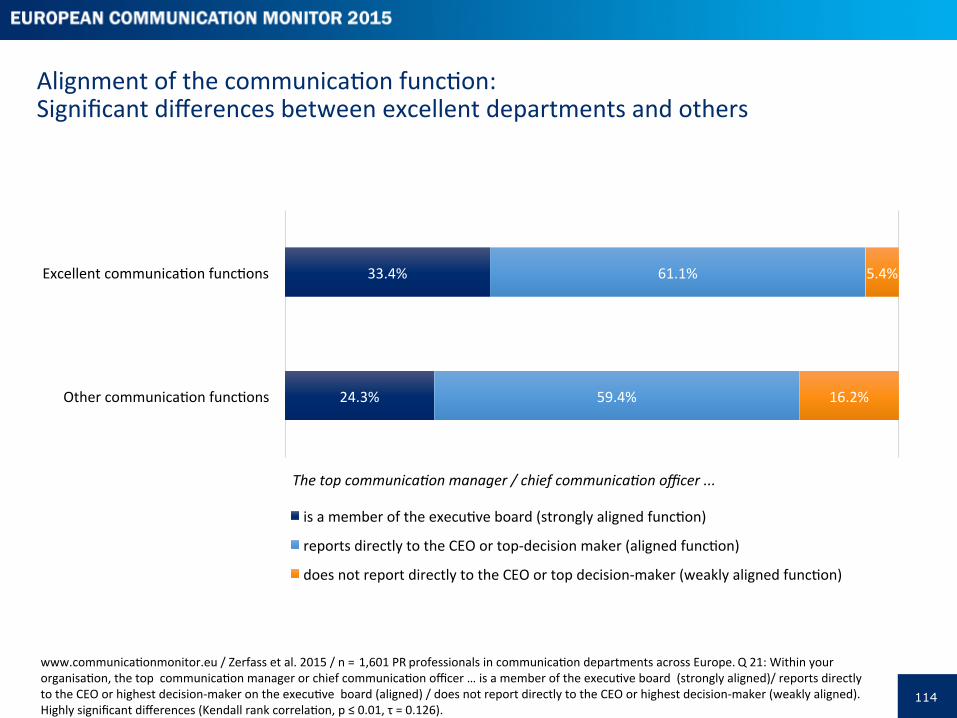
114
Alignment of the communicaPon funcPon: Significant differences between excellent departments and others
33.4%
24.3%
61.1%
59.4%
5.4%
16.2%
Excellent communicaPon funcPons
Other communicaPon funcPons
is a member of the execuPve board (strongly aligned funcPon)
reports directly to the CEO or top-‐decision maker (aligned funcPon)
does not report directly to the CEO or top decision-‐maker (weakly aligned funcPon)
The top communica0on manager / chief communica0on officer ...
www.communicaPonmonitor.eu / Zerfass et al. 2015 / n = 1,601 PR professionals in communicaPon departments across Europe. Q 21: Within your organisaPon, the top communicaPon manager or chief communicaPon officer … is a member of the execuPve board (strongly aligned)/ reports directly to the CEO or highest decision-‐maker on the execuPve board (aligned) / does not report directly to the CEO or highest decision-‐maker (weakly aligned). Highly significant differences (Kendall rank correlaPon, p ≤ 0.01, τ = 0.126).
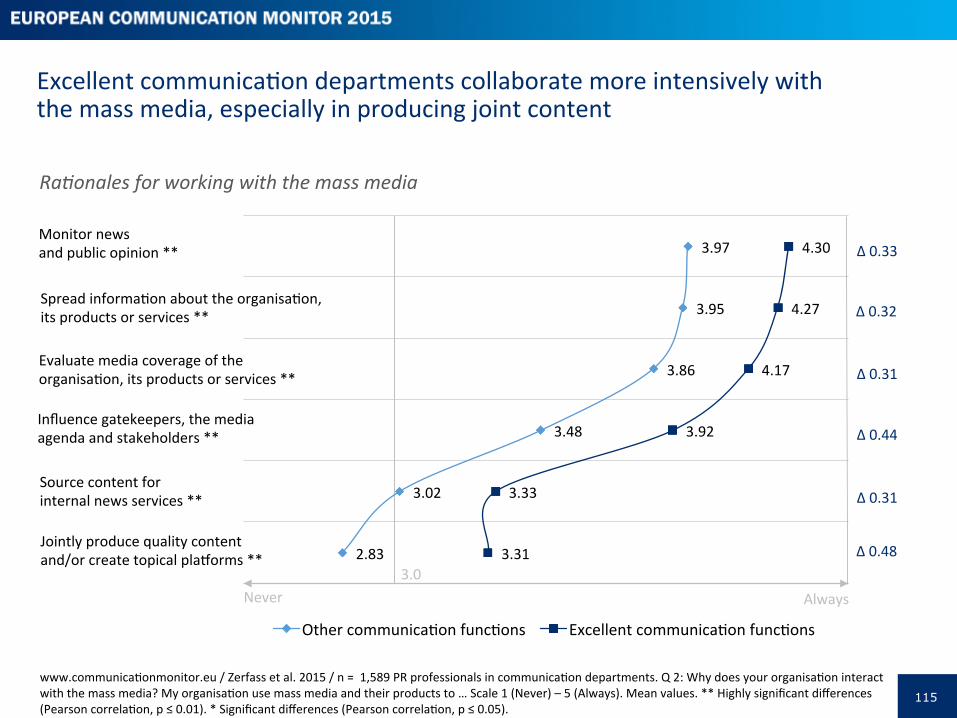
115
Excellent communicaPon departments collaborate more intensively with the mass media, especially in producing joint content
3.97
3.95
3.86
3.48
3.02
2.83
4.30
4.27
4.17
3.92
3.33
3.31
Other communicaPon funcPons Excellent communicaPon funcPons
Influence gatekeepers, the media agenda and stakeholders **
Monitor news and public opinion **
Spread informaPon about the organisaPon, its products or services **
Evaluate media coverage of the organisaPon, its products or services **
Source content for internal news services **
Never Always
Jointly produce quality content and/or create topical plaaorms **
www.communicaPonmonitor.eu / Zerfass et al. 2015 / n = 1,589 PR professionals in communicaPon departments. Q 2: Why does your organisaPon interact with the mass media? My organisaPon use mass media and their products to … Scale 1 (Never) – 5 (Always). Mean values. ** Highly significant differences (Pearson correlaPon, p ≤ 0.01). * Significant differences (Pearson correlaPon, p ≤ 0.05).
3.0
Δ 0.31
Δ 0.44
Δ 0.31
Δ 0.32
Δ 0.33
Δ 0.48
Ra0onales for working with the mass media
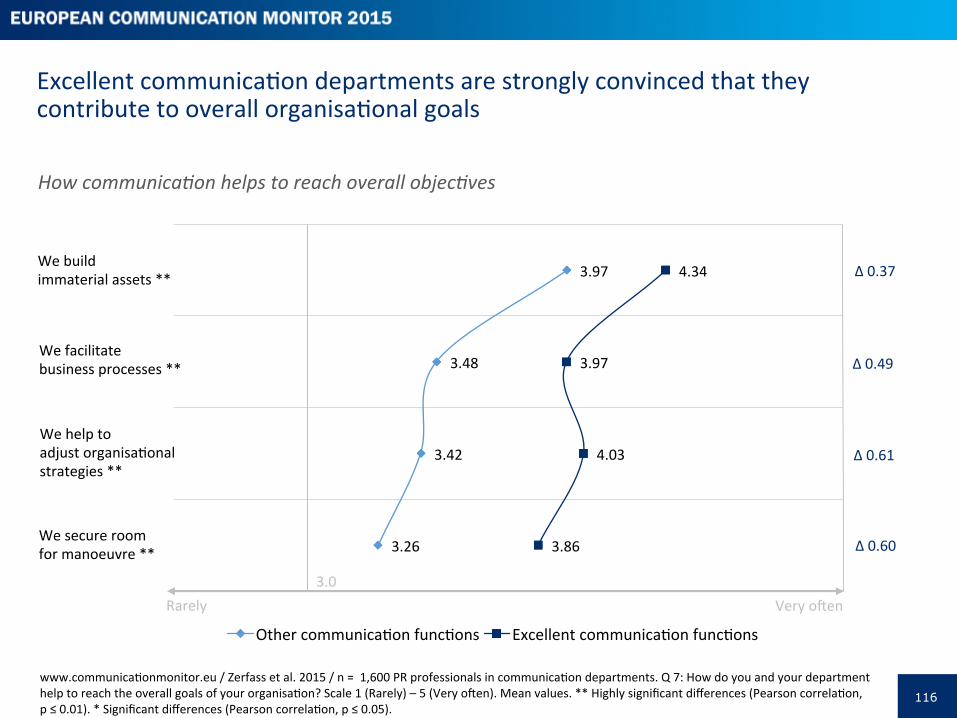
116
Excellent communicaPon departments are strongly convinced that they contribute to overall organisaPonal goals
www.communicaPonmonitor.eu / Zerfass et al. 2015 / n = 1,600 PR professionals in communicaPon departments. Q 7: How do you and your department help to reach the overall goals of your organisaPon? Scale 1 (Rarely) – 5 (Very open). Mean values. ** Highly significant differences (Pearson correlaPon, p ≤ 0.01). * Significant differences (Pearson correlaPon, p ≤ 0.05).
3.97
3.48
3.42
3.26
4.34
3.97
4.03
3.86
Other communicaPon funcPons Excellent communicaPon funcPons
We help to adjust organisaPonal strategies **
We build immaterial assets **
We facilitate business processes **
Rarely Very open
We secure room for manoeuvre **
3.0
Δ 0.37
Δ 0.49
Δ 0.61
Δ 0.60
How communica0on helps to reach overall objec0ves
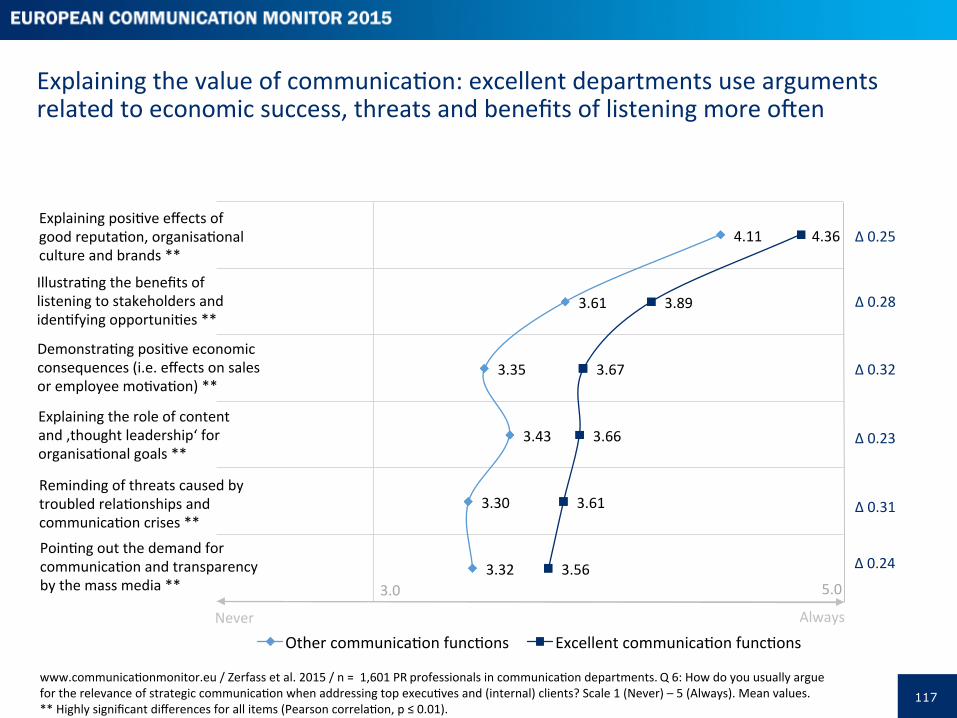
117
4.11
3.61
3.35
3.43
3.30
3.32
4.36
3.89
3.67
3.66
3.61
3.56
Other communicaPon funcPons Excellent communicaPon funcPons
Explaining the role of content and ‚thought leadership‘ for organisaPonal goals **
Explaining posiPve effects of good reputaPon, organisaPonal culture and brands **
IllustraPng the benefits of listening to stakeholders and idenPfying opportuniPes **
DemonstraPng posiPve economic consequences (i.e. effects on sales or employee moPvaPon) **
PoinPng out the demand for communicaPon and transparency by the mass media **
Reminding of threats caused by troubled relaPonships and communicaPon crises **
Explaining the value of communicaPon: excellent departments use arguments related to economic success, threats and benefits of listening more open
www.communicaPonmonitor.eu / Zerfass et al. 2015 / n = 1,601 PR professionals in communicaPon departments. Q 6: How do you usually argue for the relevance of strategic communicaPon when addressing top execuPves and (internal) clients? Scale 1 (Never) – 5 (Always). Mean values. ** Highly significant differences for all items (Pearson correlaPon, p ≤ 0.01).
Always Never
3.0 5.0
Δ 0.31
Δ 0.23
Δ 0.32
Δ 0.28
Δ 0.25
Δ 0.24
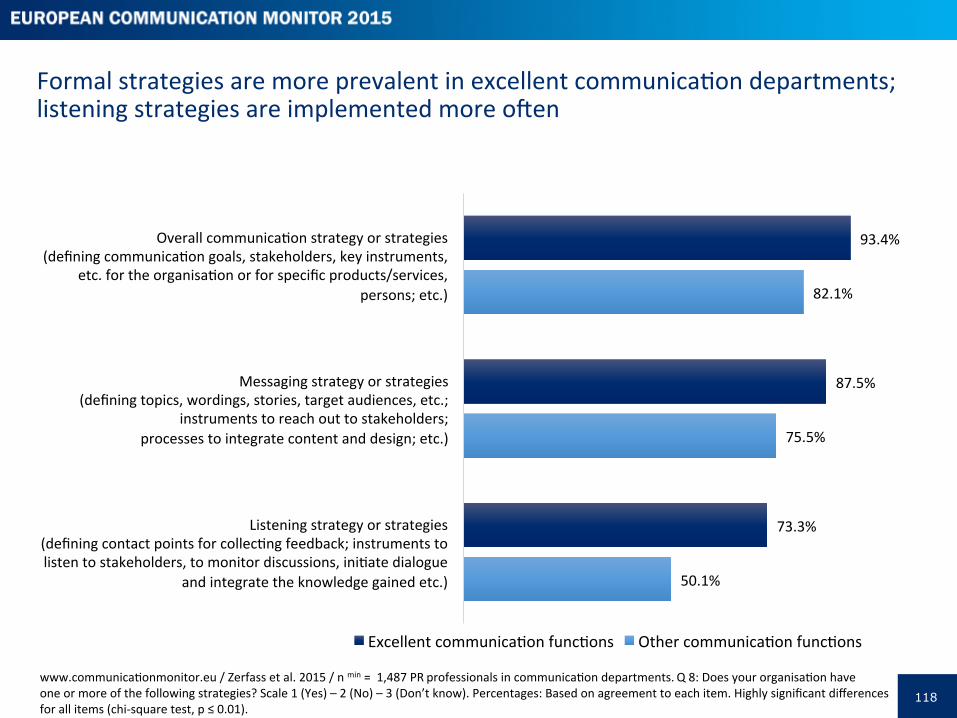
118
Formal strategies are more prevalent in excellent communicaPon departments; listening strategies are implemented more open
www.communicaPonmonitor.eu / Zerfass et al. 2015 / n min = 1,487 PR professionals in communicaPon departments. Q 8: Does your organisaPon have one or more of the following strategies? Scale 1 (Yes) – 2 (No) – 3 (Don’t know). Percentages: Based on agreement to each item. Highly significant differences for all items (chi-‐square test, p ≤ 0.01).
93.4%
87.5%
73.3%
82.1%
75.5%
50.1%
Overall communicaPon strategy or strategies (defining communicaPon goals, stakeholders, key instruments,
etc. for the organisaPon or for specific products/services, persons; etc.)
Messaging strategy or strategies (defining topics, wordings, stories, target audiences, etc.;
instruments to reach out to stakeholders; processes to integrate content and design; etc.)
Listening strategy or strategies (defining contact points for collecPng feedback; instruments to listen to stakeholders, to monitor discussions, iniPate dialogue
and integrate the knowledge gained etc.)
Excellent communicaPon funcPons Other communicaPon funcPons
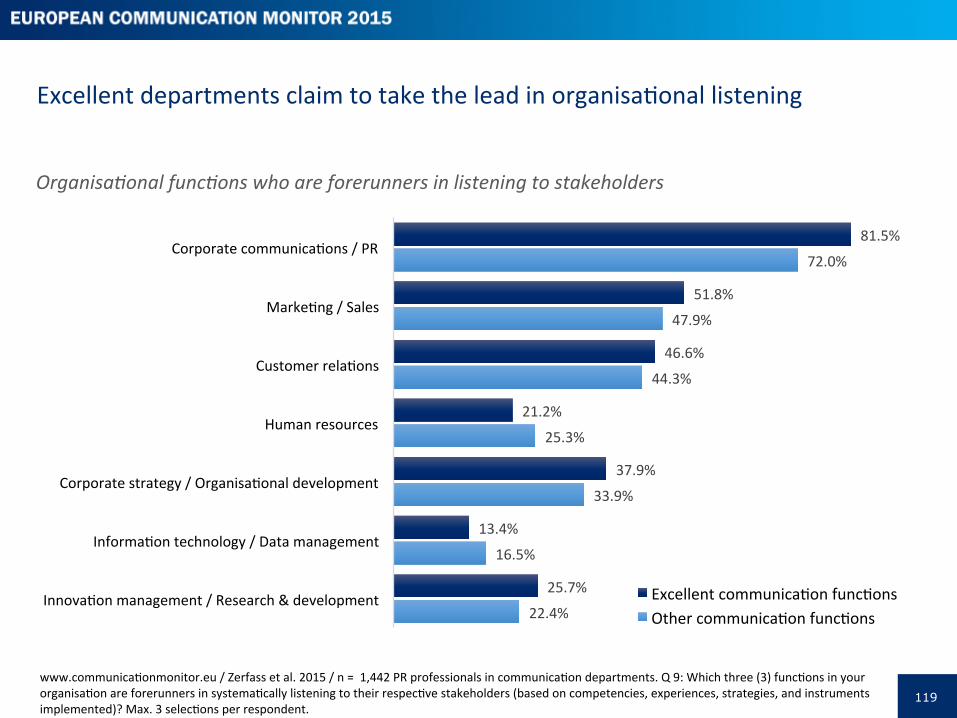
119
Excellent departments claim to take the lead in organisaPonal listening
www.communicaPonmonitor.eu / Zerfass et al. 2015 / n = 1,442 PR professionals in communicaPon departments. Q 9: Which three (3) funcPons in your organisaPon are forerunners in systemaPcally listening to their respecPve stakeholders (based on competencies, experiences, strategies, and instruments implemented)? Max. 3 selecPons per respondent.
81.5%
51.8%
46.6%
21.2%
37.9%
13.4%
25.7%
72.0%
47.9%
44.3%
25.3%
33.9%
16.5%
22.4%
Corporate communicaPons / PR
MarkePng / Sales
Customer relaPons
Human resources
Corporate strategy / OrganisaPonal development
InformaPon technology / Data management
InnovaPon management / Research & development Excellent communicaPon funcPons Other communicaPon funcPons
Organisa0onal func0ons who are forerunners in listening to stakeholders

120
OrganisaPonal listening: excellent departments use a greater number of techniques as well as applying more advanced modes of listening
www.communicaPonmonitor.eu / Zerfass et al. 2015 / n min = 1,406 PR professional in communicaPon departments. Q 10: Which of the following [listening objecPves and instruments] have been implemented in your organisaPon? Percentages: Based on agreement to each item. Highly significant differences for all items (Kendall rank correlaPon, p ≤ 0.01).
89.2%
76.6%
72.0%
68.6%
64.2%
54.1%
53.3%
55.0%
82.6%
65.8%
53.5%
54.8%
49.8%
34.8%
40.0%
32.3%
Media monitoring on a regular basis
Social media monitoring on a regular basis
Issues monitoring and management
Ad hoc listening acPviPes (monitoring, surveys, dialogues, etc.)
Stakeholder dialogues on a regular basis
Stakeholder research on a regular basis
Listening tasks as part of your personal job descripPon
Listening tasks as explicit objecPve for the communicaPon department or agency
Excellent communicaPon funcPons Other communicaPon funcPons
Structures and techniques implemented
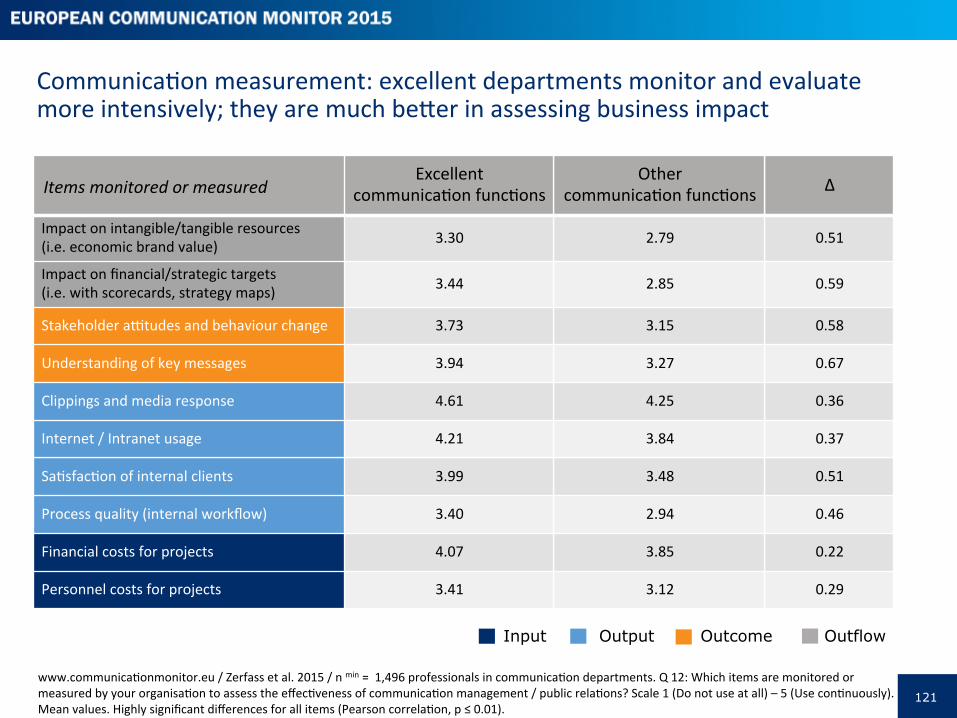
121
CommunicaPon measurement: excellent departments monitor and evaluate more intensively; they are much bemer in assessing business impact
Items monitored or measured Excellent
communicaPon funcPons Other
communicaPon funcPons Δ
Impact on intangible/tangible resources (i.e. economic brand value) 3.30 2.79 0.51
Impact on financial/strategic targets (i.e. with scorecards, strategy maps) 3.44 2.85 0.59
Stakeholder a�tudes and behaviour change 3.73 3.15 0.58
Understanding of key messages 3.94 3.27 0.67
Clippings and media response 4.61 4.25 0.36
Internet / Intranet usage 4.21 3.84 0.37
SaPsfacPon of internal clients 3.99 3.48 0.51
Process quality (internal workflow) 3.40 2.94 0.46
Financial costs for projects 4.07 3.85 0.22
Personnel costs for projects 3.41 3.12 0.29
www.communicaPonmonitor.eu / Zerfass et al. 2015 / n min = 1,496 professionals in communicaPon departments. Q 12: Which items are monitored or measured by your organisaPon to assess the effecPveness of communicaPon management / public relaPons? Scale 1 (Do not use at all) – 5 (Use conPnuously). Mean values. Highly significant differences for all items (Pearson correlaPon, p ≤ 0.01).
Input Output Outcome Outflow
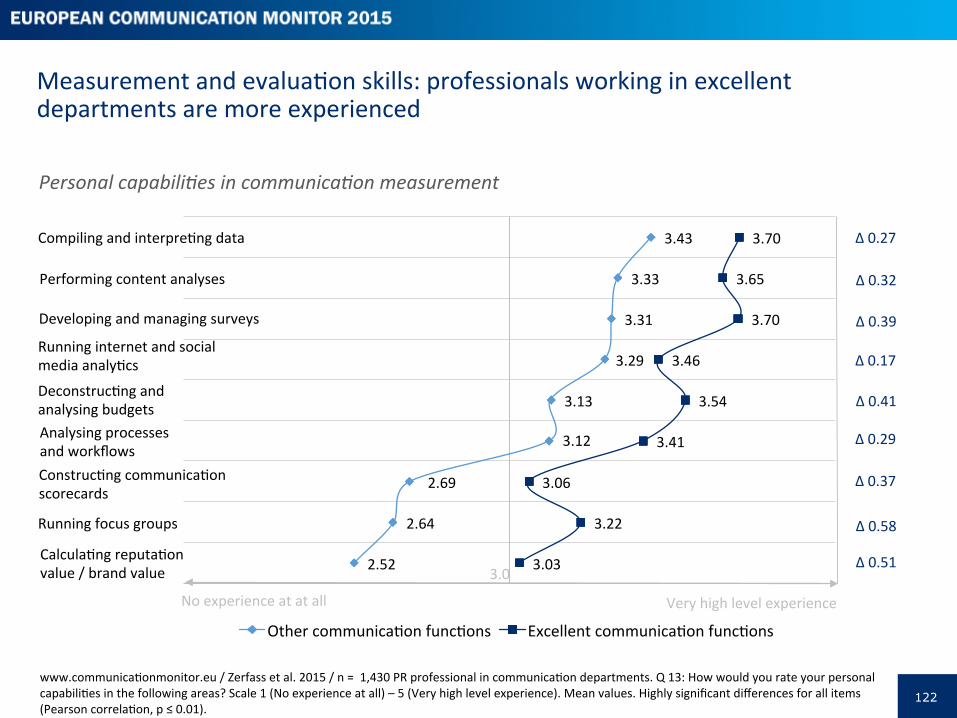
122
Measurement and evaluaPon skills: professionals working in excellent departments are more experienced
www.communicaPonmonitor.eu / Zerfass et al. 2015 / n = 1,430 PR professional in communicaPon departments. Q 13: How would you rate your personal capabiliPes in the following areas? Scale 1 (No experience at all) – 5 (Very high level experience). Mean values. Highly significant differences for all items (Pearson correlaPon, p ≤ 0.01).
3.43
3.33
3.31
3.29
3.13
3.12
2.69
2.64
2.52
3.70
3.65
3.70
3.46
3.54
3.41
3.06
3.22
3.03
Other communicaPon funcPons Excellent communicaPon funcPons
Analysing processes and workflows
Compiling and interprePng data
Developing and managing surveys
DeconstrucPng and analysing budgets
Running focus groups
No experience at at all Very high level experience
ConstrucPng communicaPon scorecards
Running internet and social media analyPcs
Performing content analyses
CalculaPng reputaPon value / brand value
Δ 0.27
Δ 0.32
Δ 0.39
Δ 0.17
Δ 0.41
Δ 0.29
Δ 0.37
Δ 0.58
Δ 0.51 3.0
Personal capabili0es in communica0on measurement
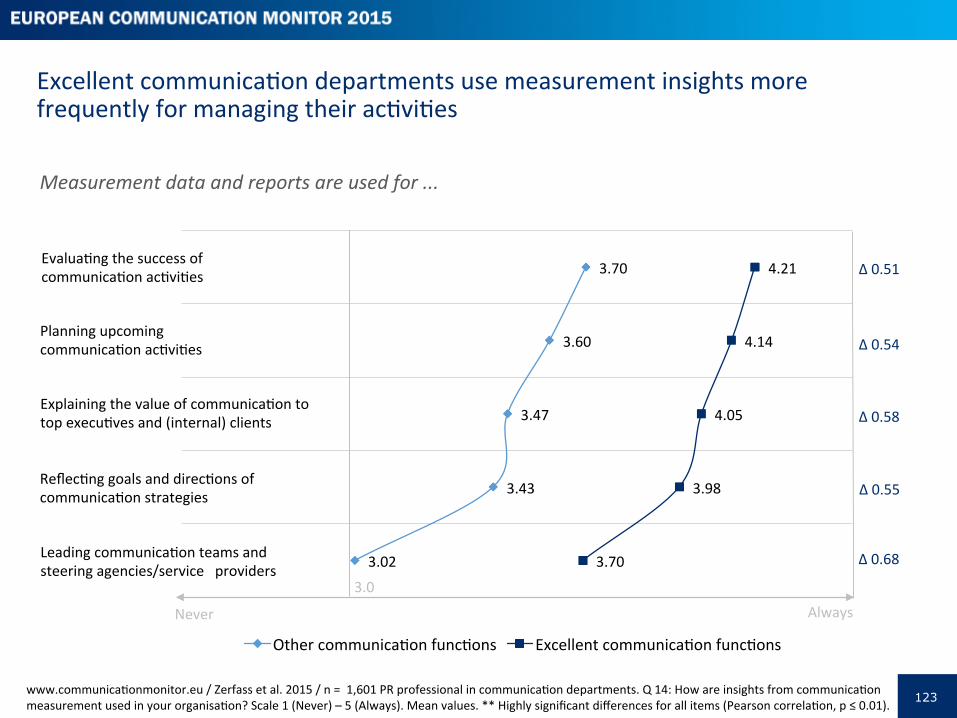
123
Excellent communicaPon departments use measurement insights more frequently for managing their acPviPes
www.communicaPonmonitor.eu / Zerfass et al. 2015 / n = 1,601 PR professional in communicaPon departments. Q 14: How are insights from communicaPon measurement used in your organisaPon? Scale 1 (Never) – 5 (Always). Mean values. ** Highly significant differences for all items (Pearson correlaPon, p ≤ 0.01).
3.70
3.60
3.47
3.43
3.02
4.21
4.14
4.05
3.98
3.70
Other communicaPon funcPons Excellent communicaPon funcPons
Explaining the value of communicaPon to top execuPves and (internal) clients
EvaluaPng the success of communicaPon acPviPes
Planning upcoming communicaPon acPviPes
Never Always
ReflecPng goals and direcPons of communicaPon strategies
Leading communicaPon teams and steering agencies/service providers
3.0
Δ 0.51
Δ 0.54
Δ 0.58
Δ 0.55
Δ 0.68
Measurement data and reports are used for ...
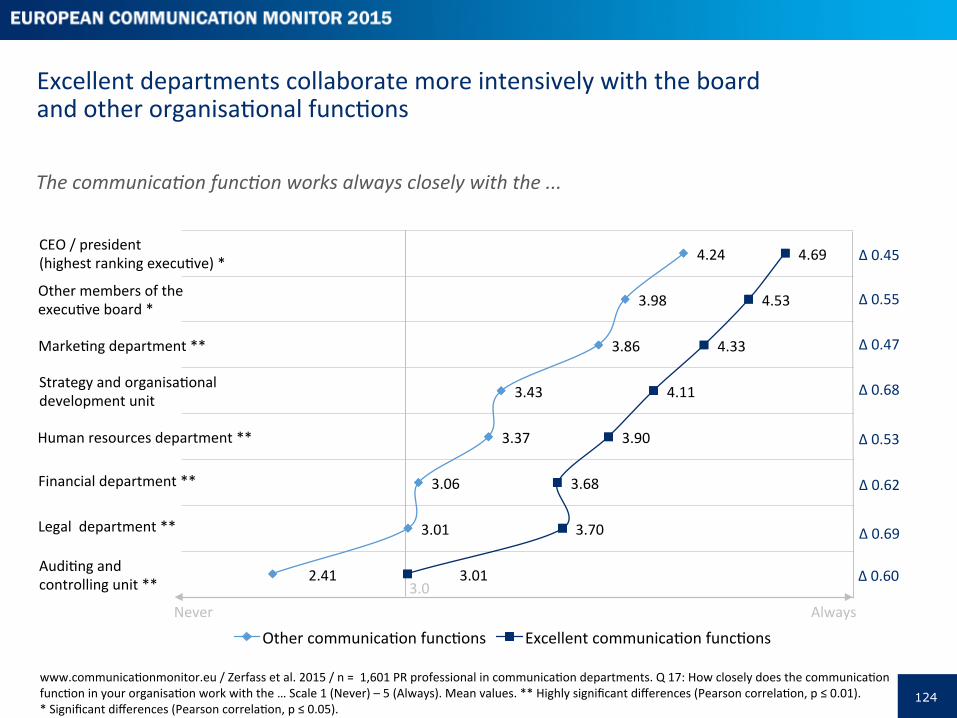
124
Excellent departments collaborate more intensively with the board and other organisaPonal funcPons
www.communicaPonmonitor.eu / Zerfass et al. 2015 / n = 1,601 PR professional in communicaPon departments. Q 17: How closely does the communicaPon funcPon in your organisaPon work with the … Scale 1 (Never) – 5 (Always). Mean values. ** Highly significant differences (Pearson correlaPon, p ≤ 0.01). * Significant differences (Pearson correlaPon, p ≤ 0.05).
4.24
3.98
3.86
3.43
3.37
3.06
3.01
2.41
4.69
4.53
4.33
4.11
3.90
3.68
3.70
3.01
Other communicaPon funcPons Excellent communicaPon funcPons
Human resources department **
CEO / president (highest ranking execuPve) *
Other members of the execuPve board *
Strategy and organisaPonal development unit
Legal department **
Financial department **
MarkePng department **
AudiPng and controlling unit **
Δ 0.45
Never Always 3.0
Δ 0.55
Δ 0.47
Δ 0.68
Δ 0.53
Δ 0.62
Δ 0.69
Δ 0.60
The communica0on func0on works always closely with the ...
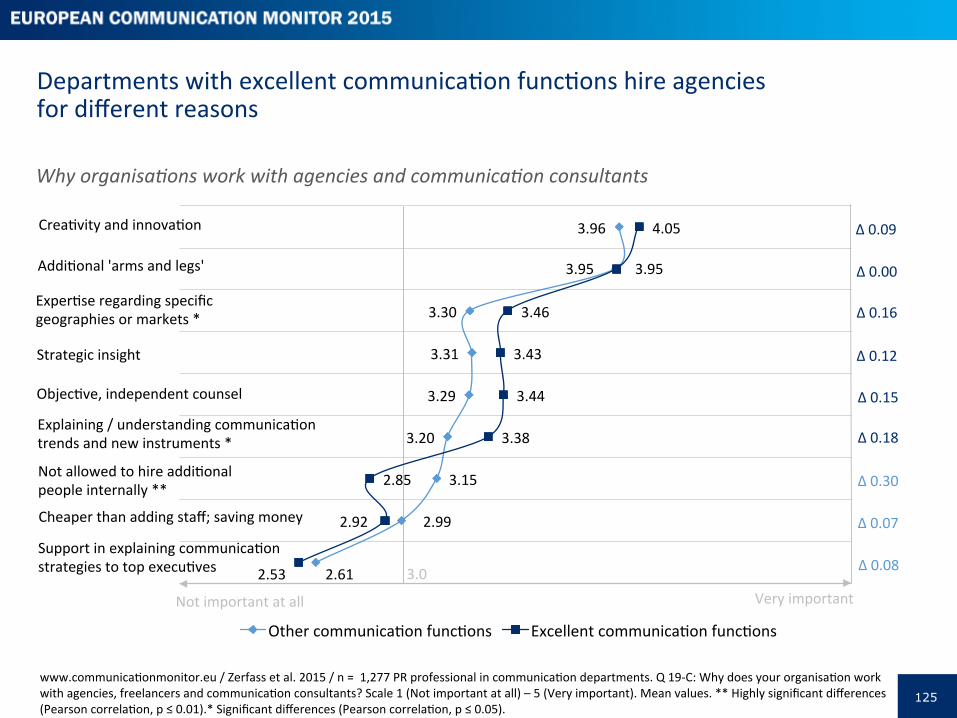
125
Departments with excellent communicaPon funcPons hire agencies for different reasons
www.communicaPonmonitor.eu / Zerfass et al. 2015 / n = 1,277 PR professional in communicaPon departments. Q 19-‐C: Why does your organisaPon work with agencies, freelancers and communicaPon consultants? Scale 1 (Not important at all) – 5 (Very important). Mean values. ** Highly significant differences (Pearson correlaPon, p ≤ 0.01).* Significant differences (Pearson correlaPon, p ≤ 0.05).
3.96
3.95
3.30
3.31
3.29
3.20
3.15
2.99
2.61
4.05
3.95
3.46
3.43
3.44
3.38
2.85
2.92
2.53
Other communicaPon funcPons Excellent communicaPon funcPons
ObjecPve, independent counsel
CreaPvity and innovaPon
AddiPonal 'arms and legs'
Strategic insight
Cheaper than adding staff; saving money
Not important at all Very important
Explaining / understanding communicaPon trends and new instruments *
ExperPse regarding specific geographies or markets *
Support in explaining communicaPon strategies to top execuPves
Not allowed to hire addiPonal people internally **
Δ 0.09
3.0
Δ 0.00
Δ 0.16
Δ 0.12
Δ 0.15
Δ 0.18
Δ 0.30
Δ 0.07
Δ 0.08
Why organisa0ons work with agencies and communica0on consultants
126
References
Bourland, P. G. (1993). The nature of conflict in firm-‐client relaPons: A content analysis of public relaPons journals 1980-‐1989. Public Rela0ons Review, 19(4), 385-‐398.
Bull, A. (2013). Brand journalism. New York, NY: Routledge. Cornelissen, J., van Bekkum, T., & van Ruler, B. (2013). Corporate CommunicaPons: A PracPce-‐based TheorePcal ConceptualizaPon. Corporate
Reputa0on Review, 9(2), 114-‐133. DPRG & ICV. (2011). Posi0on paper Communica0on Controlling – How to maximize and demonstrate the value crea0on through communica0on.
Bonn, GauPng: Deutsche Public RelaPons Gesellschap / InternaPonaler Controller-‐Verein. Eagle, L., Dahl, S., Czarnecka, B., & Lloyd, J. (2015). Marke0ng communica0ons. London: Routledge. Fielden, S. L., Tench, R., & Fawkes, J. (2003). Freelance communicaPons workers in the UK: The impact of gender on well-‐being. Corporate
Communica0ons: An Interna0onal Journal, 8(3), 187-‐196. Grunig, J. E. (Ed.). (1992). Excellence in public rela0ons and communica0on management. Hillsdale, NJ: Lawrence Erlbaum Associates. Grunig, L., Grunig, J., & Dozier, D. (2002). Excellent public rela0ons and effec0ve organiza0ons: A study of communica0on management in three
countries. Mahwah, NJ: Lawrence Erlbaum Associates. Grunig, L. A., Hon, L. C. & Toth, E. L. (2001). Women in public rela0ons: How gender influences prac0ce. New York, NY: Guilford Press. Hallahan, K. (2014). Publicity under siege: A criPcal comparison and analysis of content markePng, brand journalism, naPve adverPsing and user-‐
generated content as challenges to professional pracPce and transparency. In Y. G. Ji, J. H. Liu & Z. C. Li (Eds.), Public rela0ons in a more transparent age. 17th Interna0onal Public Rela0ons Research Conference (pp. 391-‐437). Miami, FL: IPRRC.
Hallahan, K., Holtzhausen, D., van Ruler, B., Verčic, D., & Sriramesh, K. (2007). Defining strategic communicaPon, Interna0onal Journal of Strategic Communica0on, 1(1), 3-‐35.
Halvorson, K., & Rach, M. (2012). Content strategy for the web (2nd ed.). Berkeley, CA: New Riders. Ihlen, Ø., & Pallas, J. (2014). MediaPzaPon of corporaPons. In K. Lundby (Ed.), Handbook on media0za0on of communica0on (pp. 423-‐441).
Berlin: De Gruyter Mouton. Kiesenbauer, J., & Zerfass, A. (2015). Today’s and tomorrow’s challenges in corporate communicaPons: Comparing the views of chief
communicaPon officers and next generaPon leaders. Public Rela0ons Review, in press. Light, L. (2014, July 21). Brand journalism is a modern markePng imperaPve. AdAge. Retrieved from hmp://adage.com/arPcle/guest-‐columnists/
brand-‐journalism-‐a-‐modern-‐markePng-‐imperaPve/294206/.
127
References
Macnamara, J. (2013). Beyond voice. Audience-‐making and the work and architecture of listening. Con0nuum: Journal of Media and Cultural Studies, 27(1), 160-‐175.
Macnamara, J. (2014a). Journalism and PR: Unpacking 'spin', stereotypes & media myths. New York, NY: Peter Lang. Macnamara, J. (2014b). Journalism-‐PR relaPons revisited: The good news, the bad news, and insights into tomorrow’s news. Public Rela0ons
Review, 40(5), 739-‐750. Macnamara, J. (2014c). OrganisaPonal listening: A vital missing element in public communicaPon and the public sphere. Asia Pacific Public
Rela0ons Journal, 15(1), 89-‐108. Murphy, P., & Maynard, M. (1997). Using decision profiles to analyse adverPsing agency and client conflict. Journal of Communica0on
Management, 1(3), 231-‐246. Pestana, R., & Daniels, M. (2011). Valid metrics workshop. Paper presented at the 3rd European Summit on Measurement, Lisbon, Portugal,
June 2011. Retrieved from hmp://amecorg.com/wp-‐content/uploads/2011/12/Lisbon-‐Summit-‐Vaild-‐Metrics-‐Workshop-‐3-‐June-‐2011.pdf Pulizzi, J. (2014). Epic content marke0ng: How to tell a different story, break through the cluner & win more customers by marke0ng less. New
York, NY: McGraw Hill. Rockley, A., & Cooper, C. (2012). Managing enterprise content: A unified content strategy (2nd ed.). Berkeley, CA: New Riders. Smith, B. G. (2012). CommunicaPon integraPon: An analysis of context and condiPons. Public Rela0ons Review, 38(4), 600-‐608. Steyn, B. (2007). ContribuPon of public relaPons to organizaPonal strategy formulaPon. In E. L. Toth (Ed.). The Future of Excellence in Public
Rela0ons and Communica0on Management (pp. 138-‐172). Mahwah, NJ: Lawrence Erlbaum Associates. Supa, D. (2014). The academic inquiry of media relaPons as both a tacPcal and strategic funcPon of public relaPons. Research Journal of The
Ins0tute for Public Rela0ons, 1(1). Retrieved from www.insPtuteforpr.org/research-‐journal/. Tench, R., Fawkes, J., & Palihawadana, D. (2002). Freelancing: issues and trends for public relaPons pracPce. Journal of Communica0on
Management, 6(4), 311-‐322. Tench, R. & Laville, L. (2014). Role of the public relaPons pracPPoner. In R. Tench & L. Yeomans, Exploring Public Rela0ons (3rd. ed., pp.
83-‐120). Harlow: FT Pearson. United Na=ons Sta=s=cs Division (2013). Composi0on of Macro Geographical (Con0nental) Regions, Geographical Sub Regions, and selected
Economic and other Groupings (revised 31 October 2013). New York, NY: United NaPons. Available at hmp://unstats.un.org/unsd/methods/m49/m49regin.htm#europe.
128
References
Verčič, D., & Grunig, J. E. (2002). The origins of public relaPons theory in economics and strategic management. In D. Moss, D. Verčič & G. Warnaby (Eds.), PerspecPves on public relaPons research (pp. 9-‐58). New York, NY: Routledge.
Verčič, D., & Tkalac Verčič, A. (2015). Reflexive MediaPsaPon and the Remaking of the Middleman. Public Rela0ons Review, in press. Verčič, D., Verhoeven, P., & Zerfass, A. (2014). Key issues of public relaPons of Europe: Findings from the European CommunicaPon Monitor
2007-‐2014. Revista Internacionales de Relaciones Públicas, 4(8), 5-‐26. Verčič, D., & Zerfass, A. (2015). The compara0ve excellence framework for communica0on management. Paper accepted for presentaPon at the
2015 Annual Conference of the European Public RelaPons EducaPon and Research AssociaPon (EUPRERA), Oslo, October 2015. Watson, T. (2012). The evoluPon of public relaPons measurement and evaluaPon. Public Rela0ons Review, 38(3), 390-‐398. Watson, T., & Noble, P. (2014). Evalua0ng Public Rela0ons. A guide to planning, research and measurement (3rd. ed.). London: Kogan Page. Willis, P. (2012). Engaging communiPes: Ostrom's economic commons, social capital and public relaPons. Public Rela0ons Review, 38(1),
116-‐122. Zerfass, A. (2010). Assuring raPonality and transparency in corporate communicaPons. TheorePcal foundaPons and empirical findings on
communicaPon controlling and communicaPon performance management. In M. D. Dodd & K. Yamamura (Eds.), Ethical Issues for Public Rela0ons Prac0ce in a Mul0cultural World, 13th Interna0onal Public Rela0ons Research Conference (pp. 947-‐966), Gainesville, FL: IPR.
Zerfass, A., & Dühring, L. (2012). Between convergence and power struggles: How public relaPons and markePng communicaPons professionals interact in corporate brand management. Public Rela0ons Journal, 6(5), 1-‐31.
Zerfass, A., Tench, R., Vercic, D., Verhoeven, P., & Moreno, A. (2014). European Communica0on Monitor 2014. Excellence in Strategic Communica0on – Key Issues, Leadership, Gender and Mobile Media. Results of a Survey in 42 Countries. Brussels: EACD/EUPRERA, Helios Media.
Zerfass, A., Tench, R., Verhoeven, P., Verčič, D., & Moreno, A. (2010). European Communica0on Monitor 2010. Status Quo and Challenges for Public Rela0ons in Europe. Results of an Empirical Survey in 46 Countries. Brussels: EACD, EUPRERA.
Zerfass, A., Verčič, D., Verhoeven, P., Moreno, A., & Tench, R. (2012). European Communica0on Monitor 2012. Challenges and Competencies for Strategic Communica0on. Results of an Empirical Survey in 42 Countries. Brussels: EACD, EUPRERA.
Zerfass, A., Verhoeven, P., Tench, R., Moreno, A., & Verčič, D. (2011). European Communica0on Monitor 2011. Empirical Insights into Strategic Communica0on in Europe. Results of an Empirical Survey in 43 Countries. Brussels: EACD, EUPRERA.
Zoch, L. M., & Molleda, J. C. (2006). Building a theorePcal model of media relaPons using framing, informaPon subsidies, and agenda building. In C. H. Botan & V. Hazleton (Eds.), Public Rela0ons Theory II (pp. 279-‐310). Mahwah, NJ: Lawrence Erlbaum Associates.
129
Survey organisers
European Public RelaPons EducaPon and Research AssociaPon (EUPRERA) The European Public RelaPons EducaPon and Research AssociaPon (EUPRERA) is an autonomous organisaPon with nearly 500 members from 40 countries interest-‐ed in advancing academic research and knowledge in strategic communicaPon. Several cross-‐naPonal and comparaPve research and educaPon projects are organised by affiliated universiPes, and a highly regarded academic congress is staged each autumn at varying locaPons.
www.euprera.org
European AssociaPon of CommunicaPon Directors (EACD) The EACD is the leading network for communicaPon professionals across Europe with more than 2,300 members. It brings in-‐house communicaPon experts together to exchange ideas and discuss the latest trends in internaPonal PR. Through Working Groups on specific communicaPons topics and diverse publicaPons, the EACD fosters ongoing professional qualificaPon and promotes the reputaPon of the profession.
www.eacd-‐online.eu
CommunicaPon Director CommunicaPon Director is a quarterly internaPonal magazine for Corporate CommunicaPons and Public RelaPons. It documents opinions on strategic quesPons in communicaPon, highlights transnaPonal developments and discusses them from an internaPonal perspecPve. The magazine is published by Helios Media, a specialist publishing house based in Berlin and Brussels.
www.communica0on-‐director.eu


131
A communicaPons research innovator, PRIME Research ranks among the largest global public relaPons research firms with operaPons in nine research hubs and serving clients in 35 countries in the Americas, Western and Eastern Europe, the Middle East, Africa, Australia and Asia. With fipeen industry pracPce areas as well as a complete array of public relaPons research, evaluaPon and consulPng services, PRIME leverages its corporate and brand reputaPon research experPse to foster bemer communicaPons and business decision-‐making.
www.prime-‐research.com
Partner
132
NaPonal contacts EUPRERA – Research collaborators Please contact the universiPes listed here for presentaPons, insights or addiPonal analyses in key countries.
Austria Prof. Dr. Ansgar Zerfass University of Leipzig zerfass@uni-‐leipzig.de Belgium Prof. Dr. Andrea Catellani Université Catholique de Louvain [email protected] Bulgaria Prof. Dr. Milko Petrov Sofia University St. Kliment Ohridski [email protected] CroaPa Prof. Dr. Dejan Verčič University of Ljubljana dejan.vercic@fdv-‐uni-‐lj.si Czech Republic Dr. Denisa Hejlová Charles University Prague [email protected] Denmark Prof. Finn Frandsen Aarhus University [email protected] Finland Prof. Dr. Vilma Luoma-‐aho University of Jyväskylä vilma.luoma-‐[email protected] France Prof. Dr. Valérie Carayol Université Bordeaux Montaigne valerie.carayol@u-‐bordeaux3.fr Germany Prof. Dr. Ansgar Zerfass University of Leipzig zerfass@uni-‐leipzig.de Greece Ass. Prof. Dr. Eleni Apospori Athens University of Economics and Business [email protected] Ireland Dr. John Gallagher Dublin InsPtute of Technology [email protected] Italy Prof. Dr. Emanuele Invernizzi IULM University Milan [email protected] Netherlands Assoc. Prof. Dr. Piet Verhoeven University of Amsterdam [email protected] Norway Prof. Dr. Øyvind Ihlen University of Oslo [email protected] Poland Assoc. Prof. Dr. Waldemar Rydzak Poznan University of Economics [email protected] Portugal Evandro Oliveira University of Minho, Braga evandro.oliveira@uni-‐leipzig.de Romania Assoc. Prof. Dr. Alexandra Craciun University of Bucharest [email protected] Russia Prof. Dr. Liudmila Minaeva Lomonosov Moscow State University [email protected] Serbia Prof. Dr. Dejan Verčič University of Ljubljana [email protected]‐lj.si Slovenia Prof. Dr. Dejan Verčič University of Ljubljana [email protected]‐lj.si Spain Prof. Dr. Ángeles Moreno Universidad Rey Juan Carlos, Madrid [email protected] Sweden Prof. Dr. Jesper Falkheimer Lund University, Campus Helsingborg [email protected] Switzerland Prof. Dr. Ansgar Zerfass University of Leipzig zerfass@uni-‐leipzig.de Turkey Prof. Dr. Ayla Okay Istanbul University [email protected] United Kingdom Prof. Ralph Tench, Dr. Leeds Metropolitan University [email protected]
EACD – Regional Coordinators Please contact Vanessa Eggert, EACD, Brussels, for details about EACD country representaPves vanessa.eggert@eacd-‐online.eu

133
§ Prof. Dr. Ansgar Zerfass | Lead researcher Professor and Chair in Strategic CommunicaPon, University of Leipzig, Germany Professor in CommunicaPon and Leadership, BI Norwegian Business School, Norway
§ Prof. Dr. Dejan Verčič Professor of Public RelaPons, University of Ljubljana, Slovenia
§ Prof. Dr. Piet Verhoeven Associate Professor of Corporate CommunicaPon, University of Amsterdam, Netherlands
§ Prof. Dr. Angeles Moreno Professor of Public RelaPons and CommunicaPon Management, University Rey Juan Carlos, Madrid, Spain
§ Prof. Ralph Tench, Dr. Professor of CommunicaPon, Leeds Beckem University, United Kingdom
StaPsPcal analysis and assistant researchers § Markus Wiesenberg M.A., University of Leipzig, Germany (Senior Project Manager)
§ Ronny Fechner M.A., University of Leipzig, Germany
Authors & Research Team
134
A large selecPon of reports, videos and publicaPons based on the European CommunicaPon Monitor (ECM) surveys from 2007 onwards are available on the internet. Similar surveys are conducted in other regions of the world – the LaPn American CommunicaPon Monitor and the Asia-‐Pacific CommunicaPon Monitor.
Visit www.communica0onmonitor.eu for updates and links.
More informaPon