Embed Size (px)
DESCRIPTION
Kroll - Global Fraud Report 2013-2014 The Annual Global Fraud Survey, commissioned by Kroll and carried out by the Economist Intelligence Unit, polled 901 senior executives worldwide from a broad range of industries and functions in July and August 2013. Where Economist Intelligence Unit analysis has been quoted in this report, it has been headlined as such. Kroll also undertook its own analysis of the results. As in previous years, these represented a wide range of industries, including notable participation from Financial Services and Professional Services as well as Retail and Wholesale; Technology, Media and Telecommunications; Healthcare and Pharmaceuticals; Travel, Leisure and Transportation; Consumer Goods; Construction, Engineering and Infrastructure; Natural Resources; and Manufacturing. Respondents were senior, with 53% at C-suite level. Almost half (49%) of participants represent companies with annual revenues of over $500m. Respondents this year included 25% from Europe, 24% from North America, 23% from the Asia-Pacific region, 14% from Latin America and 14% from the Middle East/Africa. This report brings together these survey results with the experience and expertise of Kroll and a selection of its affiliates. It includes content written by the Economist Intelligence Unit and other third parties. Kroll would like to thank the Economist Intelligence Unit, Dr. Paul Kielstra and all the authors for their contributions in producing this report. Values throughout the report are US dollars.
Citation preview
About the research
The Annual Global Fraud Survey, commissioned by Kroll and carried
out by the Economist Intelligence Unit, polled 901 senior executives
worldwide from a broad range of industries and functions in July
and August 2013. Where Economist Intelligence Unit analysis
has been quoted in this report, it has been headlined as such.
Kroll also undertook its own analysis of the results. As in previous
years, these represented a wide range of industries, including notable
participation from Financial Services and Professional Services
as well as Retail and Wholesale; Technology, Media and
Telecommunications; Healthcare and Pharmaceuticals; Travel, Leisure
and Transportation; Consumer Goods; Construction, Engineering and
Infrastructure; Natural Resources; and Manufacturing. Respondents
were senior, with 53% at C-suite level. Almost half (49%) of
participants represent companies with annual revenues of over
$500m. Respondents this year included 25% from Europe, 24% from
North America, 23% from the Asia-Pacific region, 14% from Latin
America and 14% from the Middle East/Africa.
This report brings together these survey results with the experience
and expertise of Kroll and a selection of its affiliates. It includes
content written by the Economist Intelligence Unit and other third
parties. Kroll would like to thank the Economist Intelligence Unit,
Dr. Paul Kielstra and all the authors for their contributions in
producing this report.
Values throughout the report are US dollars.
The information contained herein is based on currently available sources and analysis and should be understood to be information of a general nature only. The information is not intended to be taken as advice with respect to any individual situation and cannot be relied upon as such. Statements concerning financial, regulatory or legal matters should be understood to be general observations based solely on our experience as risk consultants and may not be relied upon as financial, regulatory or legal advice, which we are not authorized to provide. All such matters should be reviewed with appropriately qualified advisors in these areas. This document is owned by Kroll and the Economist Intelligence Unit Ltd, and its contents, or any portion thereof, may not be copied or reproduced in any form without the permission of Kroll. Clients may distribute for their own internal purposes only. Kroll is a business unit of the Altegrity family of companies.

fraud.kroll.com | 3
Contents
Introduction ..........................................................................................4
Economist Intelligence Unit overview – fraud on the rise ...............5
The human factor.................................................................................8
A geographical snapshot ...................................................................10
United States overview .....................................................................12
More people “in the know” spells big cyber troubles ...................13
Right-sizing your due diligence programs ......................................14
Independent monitors: Not just for enforcement actions anymore .....................................16
Canada overview ...............................................................................18
Brazil overview ..................................................................................19
Who controls the controllers? ...........................................................20
Mexico overview ................................................................................22
Colombia overview ............................................................................23
Anti-corruption efforts in Latin America: A changing landscape .......................................................................24
Latin America infrastructure projects Dealing with the risks .......................................................................26
China overview ..................................................................................28
Pre-empting fraud: Understanding the mind-set of the Chinese entrepreneur and how business is done in China ............29
India overview ...................................................................................31
Investigating procurement fraud in South and Southeast Asia .....32
Malaysia overview .............................................................................34
Infrastructure investment in developing Asia Perspectives on risk ...........................................................................35
Europe overview ................................................................................37
Are you working for a hacker? ..........................................................38
Organized crime infiltration in the supply chain .............................40
Africa overview ..................................................................................42
Investment in African infrastructure An opportunity for the private sector ..............................................43
Russia overview .................................................................................45
The Gulf States overview ..................................................................46
Summary of sector fraud profiles .....................................................47
Contact Kroll .........................................................................back cover
Global Fraud Report Contents
ECONOMIST INTELLIGENCE UNIT REPORT CARDS
TEChNOLOGy, MEDIA & TELECOMS .....................................................15
PROfESSIONAL SERvICES ....................................................................17
MANUfACTURING ...............................................................................21
NATURAL RESOURCES .........................................................................25
CONSTRUCTION, ENGINEERING & INfRASTRUCTURE .........................27
CONSUMER GOODS .............................................................................30
fINANCIAL SERvICES ...........................................................................33
RETAIL, WhOLESALE & DISTRIBUTION ................................................39
TRAvEL, LEISURE & TRANSPORTATION ...............................................41
hEALThCARE, PhARMACEUTICALS & BIOTEChNOLOGy .....................44
4 | 2013/2014 Kroll Global Fraud Report
IntroduCtIon
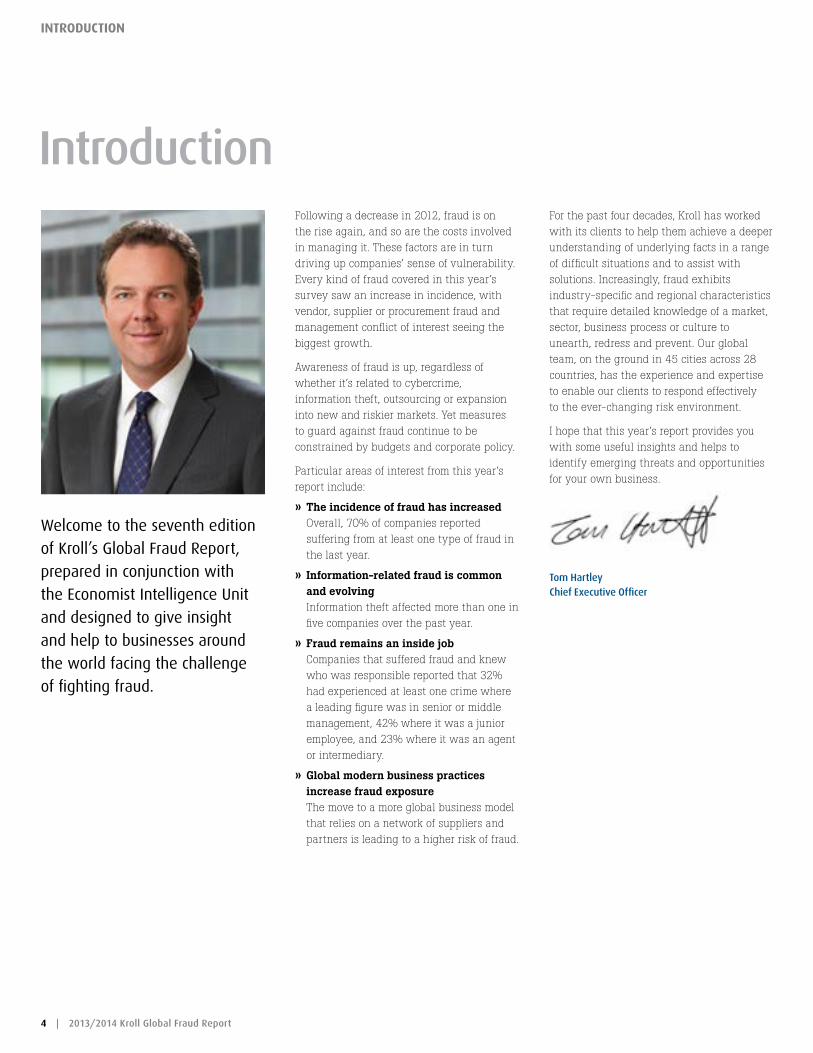
Following a decrease in 2012, fraud is on the rise again, and so are the costs involved in managing it. These factors are in turn driving up companies’ sense of vulnerability. Every kind of fraud covered in this year’s survey saw an increase in incidence, with vendor, supplier or procurement fraud and management conflict of interest seeing the biggest growth.
Awareness of fraud is up, regardless of whether it’s related to cybercrime, information theft, outsourcing or expansion into new and riskier markets. Yet measures to guard against fraud continue to be constrained by budgets and corporate policy.
Particular areas of interest from this year’s report include:
» The incidence of fraud has increased Overall, 70% of companies reported suffering from at least one type of fraud in the last year.
» Information-related fraud is common and evolving Information theft affected more than one in five companies over the past year.
» Fraud remains an inside job Companies that suffered fraud and knew who was responsible reported that 32% had experienced at least one crime where a leading figure was in senior or middle management, 42% where it was a junior employee, and 23% where it was an agent or intermediary.
» Global modern business practices increase fraud exposure The move to a more global business model that relies on a network of suppliers and partners is leading to a higher risk of fraud.
For the past four decades, Kroll has worked with its clients to help them achieve a deeper understanding of underlying facts in a range of difficult situations and to assist with solutions. Increasingly, fraud exhibits industry-specific and regional characteristics that require detailed knowledge of a market, sector, business process or culture to unearth, redress and prevent. Our global team, on the ground in 45 cities across 28 countries, has the experience and expertise to enable our clients to respond effectively to the ever-changing risk environment.
I hope that this year’s report provides you with some useful insights and helps to identify emerging threats and opportunities for your own business.
Tom Hartley Chief Executive Officer
Introduction
Welcome to the seventh edition
of Kroll’s Global fraud Report,
prepared in conjunction with
the Economist Intelligence Unit
and designed to give insight
and help to businesses around
the world facing the challenge
of fighting fraud.
fraud.kroll.com | 5
eConomIst IntellIgenCe unIt overvIew
economist Intelligence unit overvIew
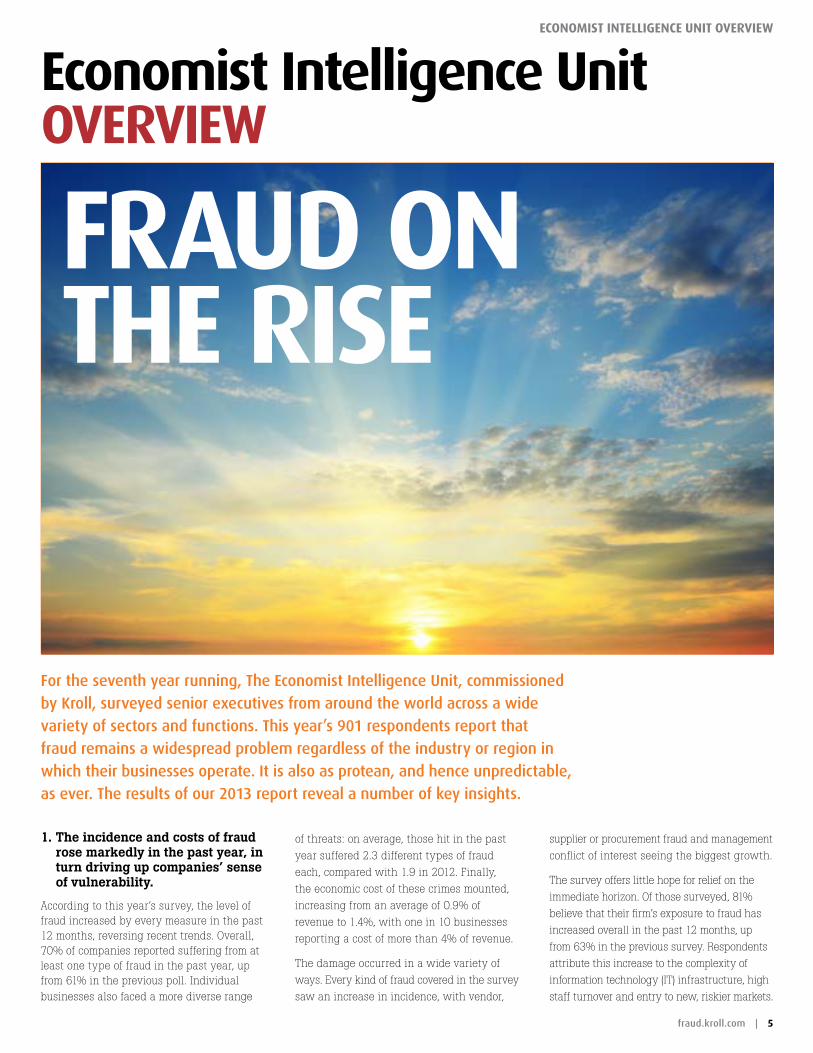
For the seventh year running, The Economist Intelligence Unit, commissioned by Kroll, surveyed senior executives from around the world across a wide variety of sectors and functions. This year’s 901 respondents report that fraud remains a widespread problem regardless of the industry or region in which their businesses operate. It is also as protean, and hence unpredictable, as ever. The results of our 2013 report reveal a number of key insights.
1. The incidence and costs of fraud rose markedly in the past year, in turn driving up companies’ sense of vulnerability.
According to this year’s survey, the level of fraud increased by every measure in the past 12 months, reversing recent trends. Overall, 70% of companies reported suffering from at least one type of fraud in the past year, up from 61% in the previous poll. Individual businesses also faced a more diverse range
of threats: on average, those hit in the past
year suffered 2.3 different types of fraud
each, compared with 1.9 in 2012. Finally,
the economic cost of these crimes mounted,
increasing from an average of 0.9% of
revenue to 1.4%, with one in 10 businesses
reporting a cost of more than 4% of revenue.
The damage occurred in a wide variety of
ways. Every kind of fraud covered in the survey
saw an increase in incidence, with vendor,
supplier or procurement fraud and management
conflict of interest seeing the biggest growth.
The survey offers little hope for relief on the
immediate horizon. Of those surveyed, 81%
believe that their firm’s exposure to fraud has
increased overall in the past 12 months, up
from 63% in the previous survey. Respondents
attribute this increase to the complexity of
information technology (IT) infrastructure, high
staff turnover and entry to new, riskier markets.
Fraud on the rIse
6 | 2013/2014 Kroll Global Fraud Report
eConomIst IntellIgenCe unIt overvIew
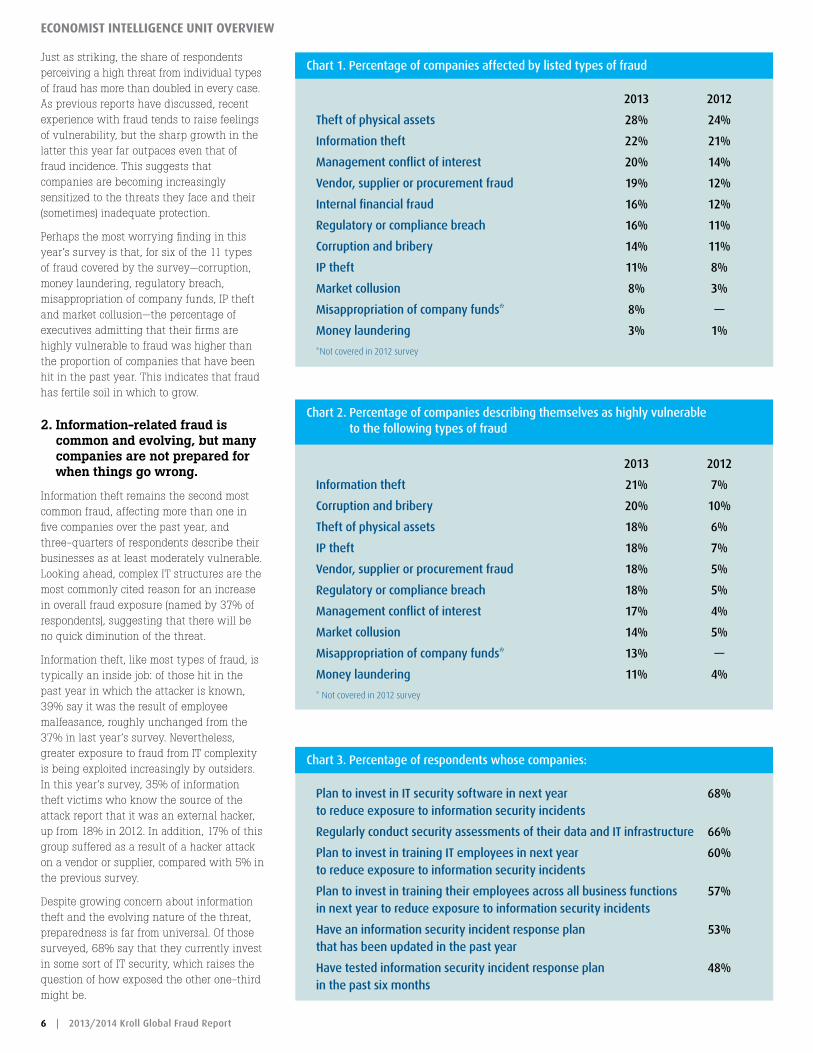
Chart 2. Percentage of companies describing themselves as highly vulnerable to the following types of fraud
2013 2012
Information theft 21% 7%
Corruption and bribery 20% 10%
Theft of physical assets 18% 6%
IP theft 18% 7%
Vendor, supplier or procurement fraud 18% 5%
Regulatory or compliance breach 18% 5%
Management conflict of interest 17% 4%
Market collusion 14% 5%
Misappropriation of company funds* 13% —
Money laundering 11% 4%
* Not covered in 2012 survey
Chart 1. Percentage of companies affected by listed types of fraud
2013 2012
Theft of physical assets 28% 24%
Information theft 22% 21%
Management conflict of interest 20% 14%
Vendor, supplier or procurement fraud 19% 12%
Internal financial fraud 16% 12%
Regulatory or compliance breach 16% 11%
Corruption and bribery 14% 11%
IP theft 11% 8%
Market collusion 8% 3%
Misappropriation of company funds* 8% —
Money laundering 3% 1%
*Not covered in 2012 survey
Chart 3. Percentage of respondents whose companies:
Plan to invest in IT security software in next year 68% to reduce exposure to information security incidents
Regularly conduct security assessments of their data and IT infrastructure 66%
Plan to invest in training IT employees in next year 60% to reduce exposure to information security incidents
Plan to invest in training their employees across all business functions 57% in next year to reduce exposure to information security incidents
Have an information security incident response plan 53% that has been updated in the past year
Have tested information security incident response plan 48% in the past six months
Just as striking, the share of respondents perceiving a high threat from individual types of fraud has more than doubled in every case. As previous reports have discussed, recent experience with fraud tends to raise feelings of vulnerability, but the sharp growth in the latter this year far outpaces even that of fraud incidence. This suggests that companies are becoming increasingly sensitized to the threats they face and their (sometimes) inadequate protection.
Perhaps the most worrying finding in this year’s survey is that, for six of the 11 types of fraud covered by the survey—corruption, money laundering, regulatory breach, misappropriation of company funds, IP theft and market collusion—the percentage of executives admitting that their firms are highly vulnerable to fraud was higher than the proportion of companies that have been hit in the past year. This indicates that fraud has fertile soil in which to grow.
2. Information-related fraud is common and evolving, but many companies are not prepared for when things go wrong.
Information theft remains the second most common fraud, affecting more than one in five companies over the past year, and three-quarters of respondents describe their businesses as at least moderately vulnerable. Looking ahead, complex IT structures are the most commonly cited reason for an increase in overall fraud exposure (named by 37% of respondents), suggesting that there will be no quick diminution of the threat.
Information theft, like most types of fraud, is typically an inside job: of those hit in the past year in which the attacker is known, 39% say it was the result of employee malfeasance, roughly unchanged from the 37% in last year’s survey. Nevertheless, greater exposure to fraud from IT complexity is being exploited increasingly by outsiders. In this year’s survey, 35% of information theft victims who know the source of the attack report that it was an external hacker, up from 18% in 2012. In addition, 17% of this group suffered as a result of a hacker attack on a vendor or supplier, compared with 5% in the previous survey.
Despite growing concern about information theft and the evolving nature of the threat, preparedness is far from universal. Of those surveyed, 68% say that they currently invest in some sort of IT security, which raises the question of how exposed the other one-third might be.
fraud.kroll.com | 7
eConomIst IntellIgenCe unIt overvIew
Less appreciated is that these shifts, however profitable, lead to a higher risk of fraud in a variety of ways. For example, 30% of respondents report that entering new, riskier markets has increased their exposure to fraud in the past year. In the same period, greater levels of outsourcing and offshoring raised fraud risk for 28% of those surveyed, and increased collaboration in the form of joint ventures and partnerships for 20%. Overall, 54% of respondents report increased exposure owing to at least one of these factors.
The dangers of new business norms are feeding into other fraud figures. Of the companies that were hit in the past year and where the perpetrator was known, 30% suffered at the hands of vendors or suppliers and 11% at those of their joint venture partners. Similarly, procurement fraud was the fourth most common type of those covered in the survey this year (19%) and saw the biggest increase compared with last year.
Given the high level of risk, a surprisingly small proportion of companies are taking action. Only 43% intend to invest in greater due diligence for partners or vendors over the next 12 months. One of the reasons may be that, in the search to reduce costs—a permanent feature of global competition—fraud prevention can get left to the side: 20% of respondents report that a lack of resources or an insufficient budget to support compliance infrastructure is increasing their exposure to fraud. Companies need to be prepared for the dangers of fraudsters operating in the same global marketplace as they do.
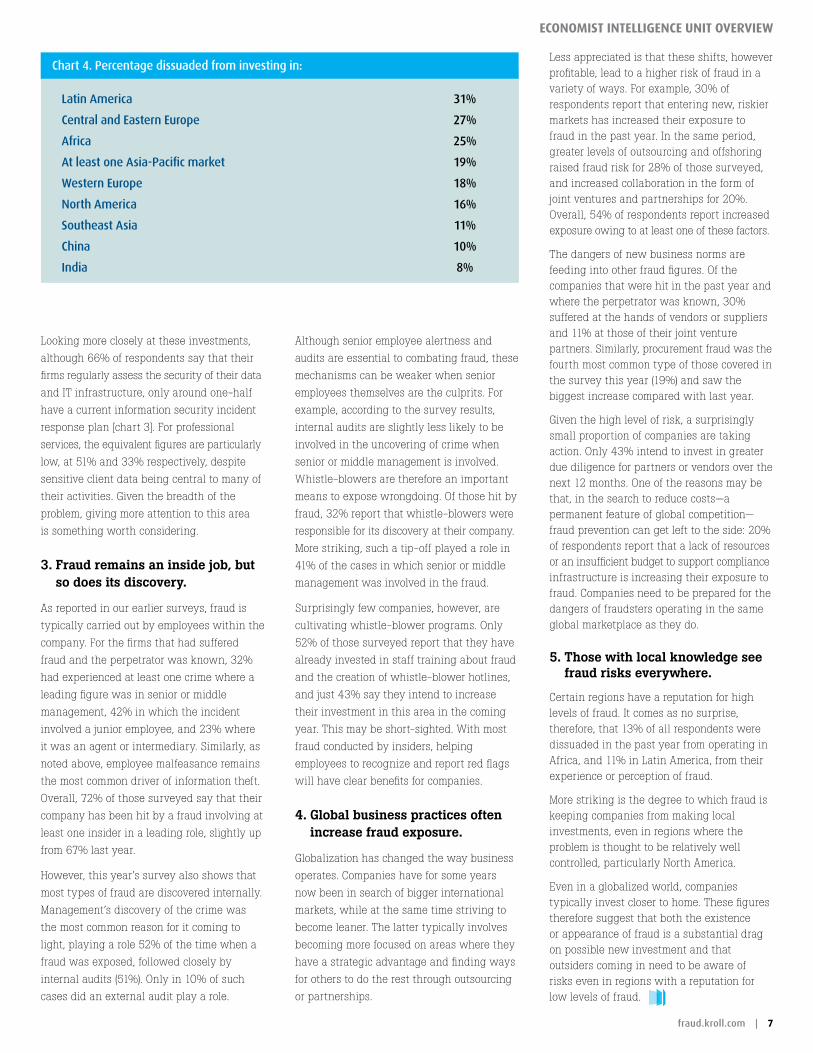
5. Those with local knowledge see fraud risks everywhere.
Certain regions have a reputation for high levels of fraud. It comes as no surprise, therefore, that 13% of all respondents were dissuaded in the past year from operating in Africa, and 11% in Latin America, from their experience or perception of fraud.
More striking is the degree to which fraud is keeping companies from making local investments, even in regions where the problem is thought to be relatively well controlled, particularly North America.
Even in a globalized world, companies typically invest closer to home. These figures therefore suggest that both the existence or appearance of fraud is a substantial drag on possible new investment and that outsiders coming in need to be aware of risks even in regions with a reputation for low levels of fraud.
Although senior employee alertness and
audits are essential to combating fraud, these
mechanisms can be weaker when senior
employees themselves are the culprits. For
example, according to the survey results,
internal audits are slightly less likely to be
involved in the uncovering of crime when
senior or middle management is involved.
Whistle-blowers are therefore an important
means to expose wrongdoing. Of those hit by
fraud, 32% report that whistle-blowers were
responsible for its discovery at their company.
More striking, such a tip-off played a role in
41% of the cases in which senior or middle
management was involved in the fraud.
Surprisingly few companies, however, are
cultivating whistle-blower programs. Only
52% of those surveyed report that they have
already invested in staff training about fraud
and the creation of whistle-blower hotlines,
and just 43% say they intend to increase
their investment in this area in the coming
year. This may be short-sighted. With most
fraud conducted by insiders, helping
employees to recognize and report red flags
will have clear benefits for companies.
4. Global business practices often increase fraud exposure.
Globalization has changed the way business
operates. Companies have for some years
now been in search of bigger international
markets, while at the same time striving to
become leaner. The latter typically involves
becoming more focused on areas where they
have a strategic advantage and finding ways
for others to do the rest through outsourcing
or partnerships.
Looking more closely at these investments,
although 66% of respondents say that their
firms regularly assess the security of their data
and IT infrastructure, only around one-half
have a current information security incident
response plan [chart 3]. For professional
services, the equivalent figures are particularly
low, at 51% and 33% respectively, despite
sensitive client data being central to many of
their activities. Given the breadth of the
problem, giving more attention to this area
is something worth considering.
3. Fraud remains an inside job, but so does its discovery.
As reported in our earlier surveys, fraud is
typically carried out by employees within the
company. For the firms that had suffered
fraud and the perpetrator was known, 32%
had experienced at least one crime where a
leading figure was in senior or middle
management, 42% in which the incident
involved a junior employee, and 23% where
it was an agent or intermediary. Similarly, as
noted above, employee malfeasance remains
the most common driver of information theft.
Overall, 72% of those surveyed say that their
company has been hit by a fraud involving at
least one insider in a leading role, slightly up
from 67% last year.
However, this year’s survey also shows that
most types of fraud are discovered internally.
Management’s discovery of the crime was
the most common reason for it coming to
light, playing a role 52% of the time when a
fraud was exposed, followed closely by
internal audits (51%). Only in 10% of such
cases did an external audit play a role.
Chart 4. Percentage dissuaded from investing in:
Latin America 31%
Central and Eastern Europe 27%
Africa 25%
At least one Asia-Pacific market 19%
Western Europe 18%
North America 16%
Southeast Asia 11%
China 10%
India 8%

8 | 2013/2014 Kroll Global Fraud Report
Fraud at a glanCe
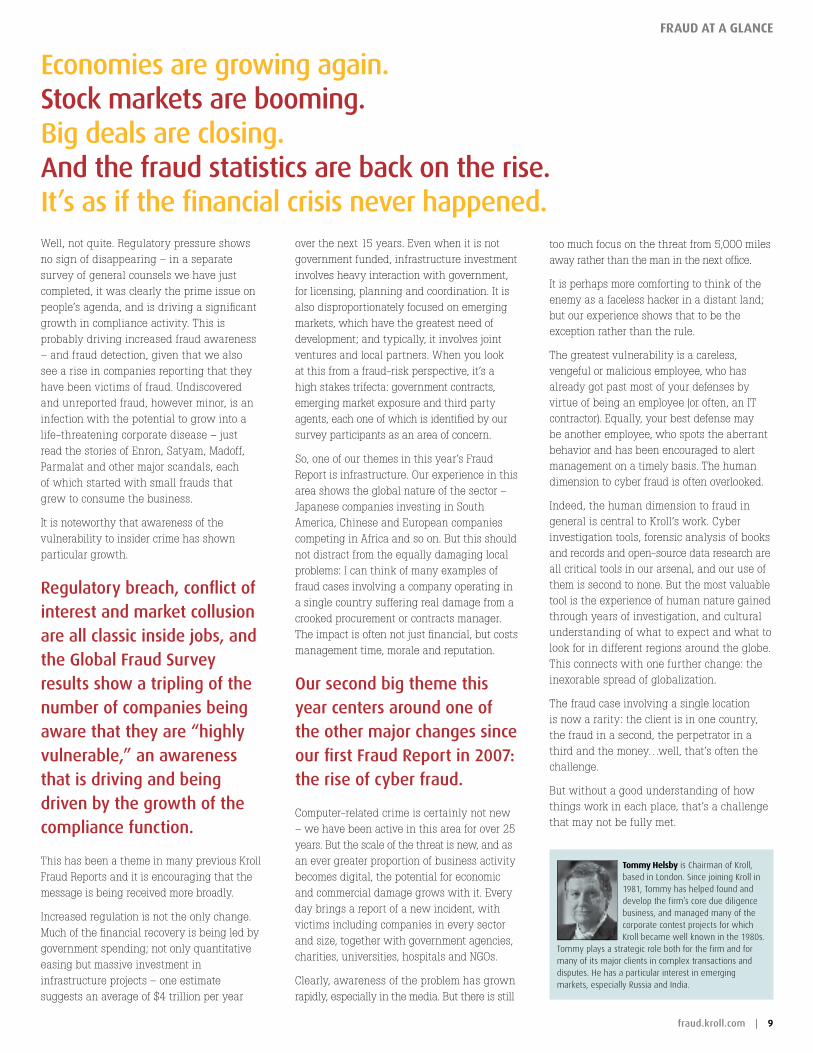
By tommy helsby
human FaCtorth
e
fraud.kroll.com | 9
Fraud at a glanCe
Well, not quite. Regulatory pressure shows no sign of disappearing – in a separate survey of general counsels we have just completed, it was clearly the prime issue on people’s agenda, and is driving a significant growth in compliance activity. This is probably driving increased fraud awareness – and fraud detection, given that we also see a rise in companies reporting that they have been victims of fraud. Undiscovered and unreported fraud, however minor, is an infection with the potential to grow into a life-threatening corporate disease – just read the stories of Enron, Satyam, Madoff, Parmalat and other major scandals, each of which started with small frauds that grew to consume the business.
It is noteworthy that awareness of the vulnerability to insider crime has shown particular growth.
Regulatory breach, conflict of interest and market collusion are all classic inside jobs, and the Global Fraud Survey results show a tripling of the number of companies being aware that they are “highly vulnerable,” an awareness that is driving and being driven by the growth of the compliance function.
This has been a theme in many previous Kroll Fraud Reports and it is encouraging that the message is being received more broadly.
Increased regulation is not the only change. Much of the financial recovery is being led by government spending; not only quantitative easing but massive investment in infrastructure projects – one estimate suggests an average of $4 trillion per year
over the next 15 years. Even when it is not government funded, infrastructure investment involves heavy interaction with government, for licensing, planning and coordination. It is also disproportionately focused on emerging markets, which have the greatest need of development; and typically, it involves joint ventures and local partners. When you look at this from a fraud-risk perspective, it’s a high stakes trifecta: government contracts, emerging market exposure and third party agents, each one of which is identified by our survey participants as an area of concern.
So, one of our themes in this year’s Fraud Report is infrastructure. Our experience in this area shows the global nature of the sector – Japanese companies investing in South America, Chinese and European companies competing in Africa and so on. But this should not distract from the equally damaging local problems: I can think of many examples of fraud cases involving a company operating in a single country suffering real damage from a crooked procurement or contracts manager. The impact is often not just financial, but costs management time, morale and reputation.
Our second big theme this year centers around one of the other major changes since our first Fraud Report in 2007: the rise of cyber fraud.
Computer-related crime is certainly not new – we have been active in this area for over 25 years. But the scale of the threat is new, and as an ever greater proportion of business activity becomes digital, the potential for economic and commercial damage grows with it. Every day brings a report of a new incident, with victims including companies in every sector and size, together with government agencies, charities, universities, hospitals and NGOs.
Clearly, awareness of the problem has grown rapidly, especially in the media. But there is still
too much focus on the threat from 5,000 miles away rather than the man in the next office.
It is perhaps more comforting to think of the enemy as a faceless hacker in a distant land; but our experience shows that to be the exception rather than the rule.
The greatest vulnerability is a careless, vengeful or malicious employee, who has already got past most of your defenses by virtue of being an employee (or often, an IT contractor). Equally, your best defense may be another employee, who spots the aberrant behavior and has been encouraged to alert management on a timely basis. The human dimension to cyber fraud is often overlooked.
Indeed, the human dimension to fraud in general is central to Kroll’s work. Cyber investigation tools, forensic analysis of books and records and open-source data research are all critical tools in our arsenal, and our use of them is second to none. But the most valuable tool is the experience of human nature gained through years of investigation, and cultural understanding of what to expect and what to look for in different regions around the globe. This connects with one further change: the inexorable spread of globalization.
The fraud case involving a single location is now a rarity: the client is in one country, the fraud in a second, the perpetrator in a third and the money…well, that’s often the challenge.
But without a good understanding of how things work in each place, that’s a challenge that may not be fully met.
tommy helsby is Chairman of Kroll, based in London. Since joining Kroll in 1981, Tommy has helped found and develop the firm’s core due diligence business, and managed many of the corporate contest projects for which Kroll became well known in the 1980s.
Tommy plays a strategic role both for the firm and for many of its major clients in complex transactions and disputes. He has a particular interest in emerging markets, especially Russia and India.
Economies are growing again. Stock markets are booming. Big deals are closing. And the fraud statistics are back on the rise. It’s as if the financial crisis never happened.
human FaCtor
9.0 - 10.0
8.0 - 8.9
7.0 - 7.9
6.0 - 6.9
5.0 - 5.9
4.0 - 4.9
3.0 - 3.9
2.0 -2.9
1.0 - 1.9
0.0 - 0.9
No data
90 - 100
80 - 89
70 - 79
60 - 69
50 - 59
40 - 49
30 - 39
20 -29
10 - 19
0 - 9
No data
ylhgiHCorrupt
Very Clean
2012 CPI Score
SCORE
0-9 10-19 20-29 30-39 40-49 50-59 60-69 70-79 80-89 90-100
Very Clean
Highly Corrupt
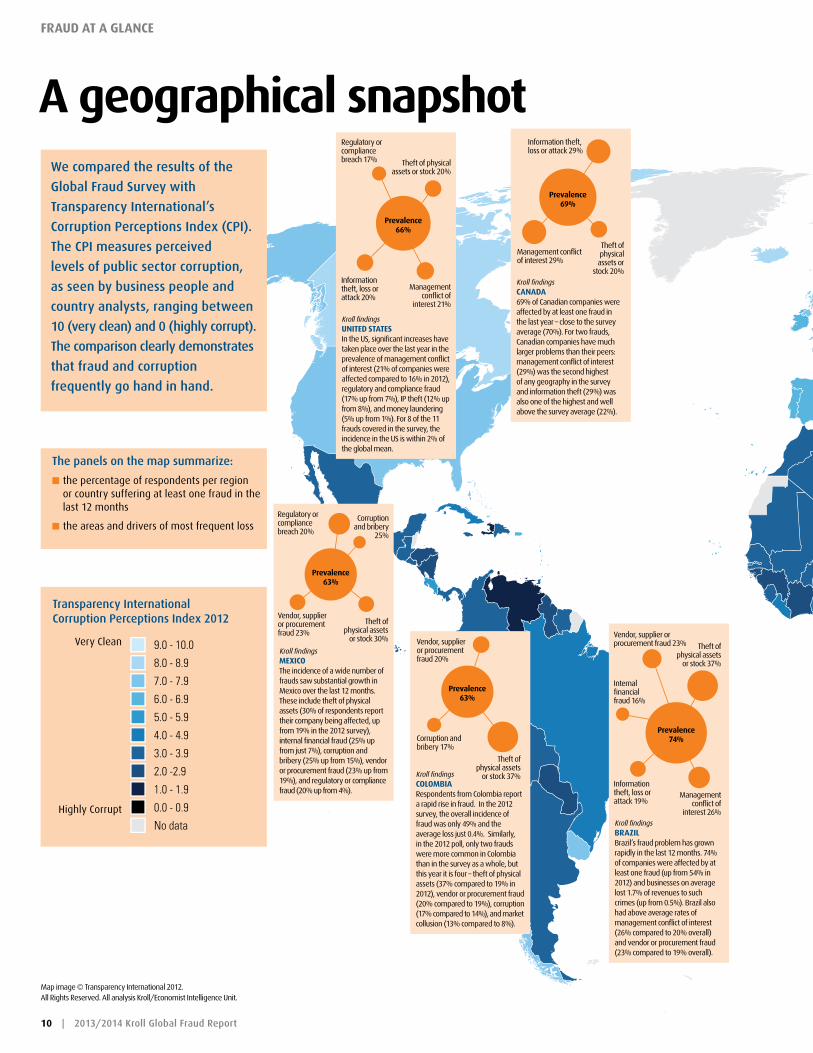
We compared the results of the
Global Fraud Survey with
Transparency International’s
Corruption Perceptions Index (CPI).
The CPI measures perceived
levels of public sector corruption,
as seen by business people and
country analysts, ranging between
10 (very clean) and 0 (highly corrupt).
The comparison clearly demonstrates
that fraud and corruption
frequently go hand in hand.
9.0 - 10.0
8.0 - 8.9
7.0 - 7.9
6.0 - 6.9
5.0 - 5.9
4.0 - 4.9
3.0 - 3.9
2.0 -2.9
1.0 - 1.9
0.0 - 0.9
No data
Map image © Transparency International 2012. All Rights Reserved. All analysis Kroll/Economist Intelligence Unit.
Transparency International Corruption Perceptions Index 2012
very Clean
highly Corrupt
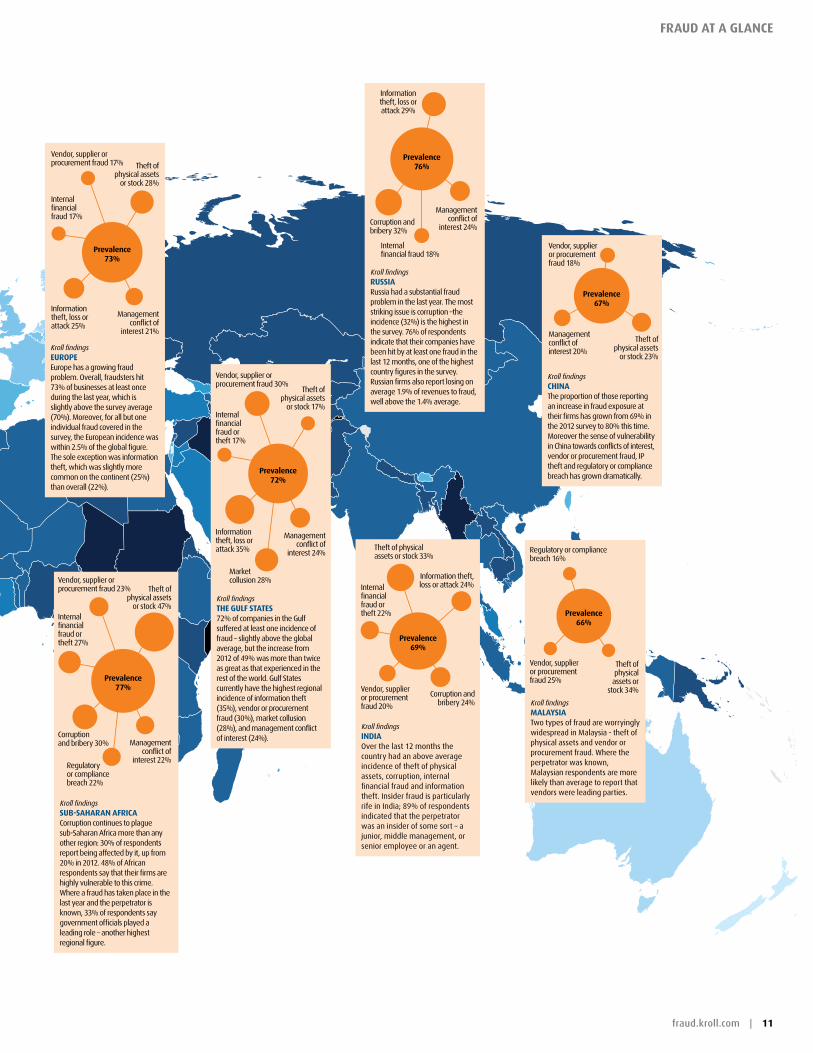
The panels on the map summarize:
K the percentage of respondents per region or country suffering at least one fraud in the last 12 months
K the areas and drivers of most frequent loss
Kroll findingsCanada69% of Canadian companies were affected by at least one fraud in the last year – close to the survey average (70%). for two frauds, Canadian companies have much larger problems than their peers: management conflict of interest (29%) was the second highest of any geography in the survey and information theft (29%) was also one of the highest and well above the survey average (22%).
Information theft, loss or attack 29%
Theft of physical assets or
stock 20%
Kroll findingsmexICoThe incidence of a wide number of frauds saw substantial growth in Mexico over the last 12 months. These include theft of physical assets (30% of respondents report their company being affected, up from 19% in the 2012 survey), internal financial fraud (25% up from just 7%), corruption and bribery (25% up from 15%), vendor or procurement fraud (23% up from 19%), and regulatory or compliance fraud (20% up from 4%).
Regulatory or compliance breach 20%
Corruption and bribery
25%
Theft of physical assets
or stock 30%
Prevalence 63%
Kroll findingsColomBIaRespondents from Colombia report a rapid rise in fraud. In the 2012 survey, the overall incidence of fraud was only 49% and the average loss just 0.4%. Similarly, in the 2012 poll, only two frauds were more common in Colombia than in the survey as a whole, but this year it is four – theft of physical assets (37% compared to 19% in 2012), vendor or procurement fraud (20% compared to 19%), corruption (17% compared to 14%), and market collusion (13% compared to 8%).
vendor, supplier or procurement fraud 20%
Corruption and bribery 17%
Theft of physical assets
or stock 37%
Prevalence 63%
vendor, supplier or procurement fraud 23%
Management conflict of interest 29%
Kroll findingsunIted statesIn the US, significant increases have taken place over the last year in the prevalence of management conflict of interest (21% of companies were affected compared to 16% in 2012), regulatory and compliance fraud (17% up from 7%), IP theft (12% up from 8%), and money laundering (5% up from 1%). for 8 of the 11 frauds covered in the survey, the incidence in the US is within 2% of the global mean.
Regulatory or compliance breach 17%
Information theft, loss or attack 20%
Management conflict of
interest 21%
Theft of physical assets or stock 20%
Prevalence 66%
Kroll findingsBrazIlBrazil’s fraud problem has grown rapidly in the last 12 months. 74% of companies were affected by at least one fraud (up from 54% in 2012) and businesses on average lost 1.7% of revenues to such crimes (up from 0.5%). Brazil also had above average rates of management conflict of interest (26% compared to 20% overall) and vendor or procurement fraud (23% compared to 19% overall).
vendor, supplier or procurement fraud 23%
Information theft, loss or attack 19%
Internal financial fraud 16%
Management conflict of
interest 26%
Theft of physical assets
or stock 37%
Prevalence 74%
Prevalence 69%
10 | 2013/2014 Kroll Global Fraud Report
Fraud at a glanCe
a geographical snapshot
9.0 - 10.0
8.0 - 8.9
7.0 - 7.9
6.0 - 6.9
5.0 - 5.9
4.0 - 4.9
3.0 - 3.9
2.0 -2.9
1.0 - 1.9
0.0 - 0.9
No data
90 - 100
80 - 89
70 - 79
60 - 69
50 - 59
40 - 49
30 - 39
20 -29
10 - 19
0 - 9
No data
ylhgiHCorrupt
Very Clean
2012 CPI Score
SCORE
0-9 10-19 20-29 30-39 40-49 50-59 60-69 70-79 80-89 90-100
Very Clean
Highly Corrupt
Kroll findingsmalaysIaTwo types of fraud are worryingly widespread in Malaysia - theft of physical assets and vendor or procurement fraud. Where the perpetrator was known, Malaysian respondents are more likely than average to report that vendors were leading parties.
Kroll findingssuB-saharan aFrICaCorruption continues to plague sub-Saharan Africa more than any other region: 30% of respondents report being affected by it, up from 20% in 2012. 48% of African respondents say that their firms are highly vulnerable to this crime. Where a fraud has taken place in the last year and the perpetrator is known, 33% of respondents say government officials played a leading role – another highest regional figure.
vendor, supplier or procurement fraud 23%
Corruption and bribery 30% Management
conflict of interest 22%
Internal financial fraud or theft 27%
Theft of physical assets
or stock 47%
Prevalence 77%
Kroll findingsIndIaOver the last 12 months the country had an above average incidence of theft of physical assets, corruption, internal financial fraud and information theft. Insider fraud is particularly rife in India; 89% of respondents indicated that the perpetrator was an insider of some sort – a junior, middle management, or senior employee or an agent.
Theft of physical assets or stock 33%
vendor, supplier or procurement fraud 20%
Corruption and bribery 24%
Internal financial fraud or theft 22%
Information theft, loss or attack 24%
Prevalence 69%
Regulatory or compliance breach 16%
vendor, supplier or procurement fraud 25%
Theft of physical assets or
stock 34%
Prevalence 66%
Kroll findingseuroPeEurope has a growing fraud problem. Overall, fraudsters hit 73% of businesses at least once during the last year, which is slightly above the survey average (70%). Moreover, for all but one individual fraud covered in the survey, the European incidence was within 2.5% of the global figure. The sole exception was information theft, which was slightly more common on the continent (25%) than overall (22%).
Kroll findingsChInaThe proportion of those reporting an increase in fraud exposure at their firms has grown from 69% in the 2012 survey to 80% this time. Moreover the sense of vulnerability in China towards conflicts of interest, vendor or procurement fraud, IP theft and regulatory or compliance breach has grown dramatically.
vendor, supplier or procurement fraud 18%
Management conflict of interest 20%
Theft of physical assets
or stock 23%
Prevalence 67%
Kroll findingsrussIaRussia had a substantial fraud problem in the last year. The most striking issue is corruption –the incidence (32%) is the highest in the survey. 76% of respondents indicate that their companies have been hit by at least one fraud in the last 12 months, one of the highest country figures in the survey. Russian firms also report losing on average 1.9% of revenues to fraud, well above the 1.4% average.
Information theft, loss or attack 29%
Corruption and bribery 32%
Management conflict of
interest 24%
Regulatory or compliance breach 22%
vendor, supplier or procurement fraud 17%
Information theft, loss or attack 25%
Management conflict of
interest 21%
Internal financial fraud 17%
Theft of physical assets
or stock 28%
Prevalence 73%
Kroll findingsthe gulF states72% of companies in the Gulf suffered at least one incidence of fraud – slightly above the global average, but the increase from 2012 of 49% was more than twice as great as that experienced in the rest of the world. Gulf States currently have the highest regional incidence of information theft (35%), vendor or procurement fraud (30%), market collusion (28%), and management conflict of interest (24%).
vendor, supplier or procurement fraud 30%
Information theft, loss or attack 35%
Management conflict of
interest 24%
Internal financial fraud or theft 17%
Theft of physical assets
or stock 17%
Prevalence 72%
Market collusion 28%
Internal financial fraud 18%
Prevalence 76%
fraud.kroll.com | 11
Fraud at a glanCe
12 | 2013/2014 Kroll Global Fraud Report
regIonal analysIs americas
unIted states overvIew
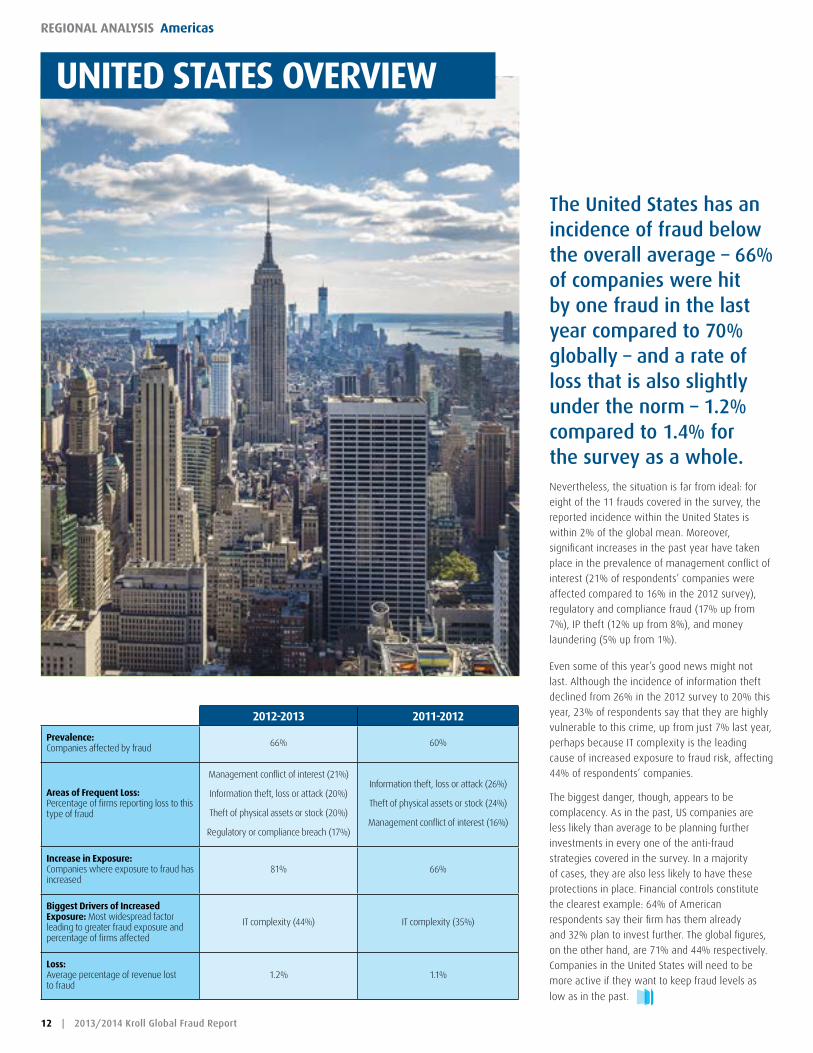
2012-2013 2011-2012
Prevalence: Companies affected by fraud 66% 60%
areas of Frequent loss: Percentage of firms reporting loss to this type of fraud
Management conflict of interest (21%)
Information theft, loss or attack (20%)
Theft of physical assets or stock (20%)
Regulatory or compliance breach (17%)
Information theft, loss or attack (26%)
Theft of physical assets or stock (24%)
Management conflict of interest (16%)
Increase in exposure: Companies where exposure to fraud has increased
81% 66%
Biggest drivers of Increased exposure: Most widespread factor leading to greater fraud exposure and percentage of firms affected
IT complexity (44%) IT complexity (35%)
loss: Average percentage of revenue lost to fraud
1.2% 1.1%
The United States has an incidence of fraud below the overall average – 66% of companies were hit by one fraud in the last year compared to 70% globally – and a rate of loss that is also slightly under the norm – 1.2% compared to 1.4% for the survey as a whole. Nevertheless, the situation is far from ideal: for
eight of the 11 frauds covered in the survey, the
reported incidence within the United States is
within 2% of the global mean. Moreover,
significant increases in the past year have taken
place in the prevalence of management conflict of
interest (21% of respondents’ companies were
affected compared to 16% in the 2012 survey),
regulatory and compliance fraud (17% up from
7%), IP theft (12% up from 8%), and money
laundering (5% up from 1%).
Even some of this year’s good news might not
last. Although the incidence of information theft
declined from 26% in the 2012 survey to 20% this
year, 23% of respondents say that they are highly
vulnerable to this crime, up from just 7% last year,
perhaps because IT complexity is the leading
cause of increased exposure to fraud risk, affecting
44% of respondents’ companies.
The biggest danger, though, appears to be
complacency. As in the past, US companies are
less likely than average to be planning further
investments in every one of the anti-fraud
strategies covered in the survey. In a majority
of cases, they are also less likely to have these
protections in place. Financial controls constitute
the clearest example: 64% of American
respondents say their firm has them already
and 32% plan to invest further. The global figures,
on the other hand, are 71% and 44% respectively.
Companies in the United States will need to be
more active if they want to keep fraud levels as
low as in the past.
fraud.kroll.com | 13
americas regIonal analysIs
Knowledge is the fuel that drives much in today’s global economies – from industrial formulas and know-how, to science pushing both nano and stellar frontiers, to the specialized expertise of diverse professional services firms for virtually every human endeavor.
For many companies, success in a number of areas hinges on continually expanding and sharing that knowledge within the enterprise, not to mention employing the most efficient ways to facilitate that sharing. However, this does not bode well when it comes to cyber security. In Kroll’s experience assisting clients across diverse industries, the greatest threat to an organization’s cyber security is the insider.
As companies allow their people to be “in the know,” with access to intellectual property (IP), confidential information and client-specific data, they inherently leave themselves open to theft by these same insiders. While the threat is pervasive, Kroll has found that companies are most vulnerable in three particular areas.
1. H1B visa workers: When they go back, what will they take with them?
In the pursuit for technically trained professionals to work on their projects, many organizations turn to non-citizen workers on H1B visas to fill knowledge gaps in their employee workforce. The practice is well-established in the industrial and technology sectors, which often derive the added benefit of an outsider’s culturally different perspective. Visas are for a finite duration, however, and companies must be prepared for two eventualities: When workers return to their native countries, what might they take with them? And if they do, what practical recourse does an employer really have?
If companies perform any background checks on these workers, and we find that many do not, checks are often limited in scope to educational verifications. Compounding the problem is that customary legal instruments and remedies that can be enforced domestically, such as nondisclosure and non-compete agreements, are effectively
meaningless once a worker has returned to his or her native land. If litigation is even a possibility, it is sure to be a protracted and expensive fight, with no guarantees that damages can actually be collected.
2. Independent contractors and temps: Here today, gone tomorrow with your IP?
Like their H1B visa worker counterparts, independent contractors and temporary employees are increasingly being used by companies for strategic staffing purposes. Whether a company needs to supplement a short-term need for expertise or deal with fluctuating business volumes, the use of these workers has delivered both operational and financial efficiencies. Once again, however, a company should be prepared for a two-fold risk.
First, contractors and temps must often be exposed to valuable business information and given access to company systems. Second, and a much more difficult and thorny dilemma to contend with, is that an independent contractor’s most valuable competitive advantage is the knowledge and experience that he or she is able to bring to a client. The ability to rely on and access data or processes that were developed on a previous engagement may prove the deciding factor in landing a new client.
Which brings up another similarity with H1B workers – all these workers usually know exactly when an engagement or project will be over. Impending stressors, e.g., the loss of a job, have long been recognized as triggers for both physical and cyber thefts. It’s not surprising, then, why these categories of workers can be problematic elements in any cyber security equation.
3. Remote employees: What’s accessed at home stays at home?
Technological advancements in both software and hardware have vastly multiplied how and where employees can carry out their responsibilities. From an employer’s perspective, the sea change has proved a boon in several ways, both tangible and intangible. Aside from lowering their capital
costs, companies have seen improvements not only in worker productivity but also in being able to recruit top candidates and/or retain high-performing employees virtually anywhere in the world. However, the same technology that facilitates access from multiple devices to a company’s systems and data can leave the door open for at best, misguided efforts to back up work, and at worst, malicious tampering or outright theft. For all intents and purposes, not only are remote workers not subject to the multiple layers of security measures that might be enforced in a physical location – they also often do not encounter significant impediments in how they access, retain, and store company data on their personal devices.
more people “in the know” spells big cyber troubles
Recognize the risk from those in the know and manage accordingly
If knowledge is the lifeblood of many businesses today, h1B workers, independent contractors and temps, and remote employees can be the source of internal losses that go undetected until it’s too late. however, the risks posed by each of these groups can be managed. from our experience, Kroll recommends these best practices:
1. Identify and contain sensitive data.
2. Screen independent contractors and temporary workers the same as you do employees.
3. Encrypt or limit the use of remote devices.
4. Establish and enforce consequences for security violations.
5. Engage conflict-free examiners to conduct investigations on malicious insiders who abuse IT systems.
6. Centralize and safeguard computer logs of important IT systems in a restricted-access location.
7. Establish thorough employee termination procedures.
8. Restrict the use of removable media.
9. Run and require acceptance of terms on privacy banners.
10. Back up data.
timothy P. ryan is a Managing Director with Kroll’s Cyber Investigations practice based in New York. An expert in responding to all forms of computer crime, attacks and abuse, Tim previously was a Supervisory Special Agent with the Federal Bureau of Investigation, where he supervised the largest Cyber Squad in the United States. Tim has led complex cyber investigations involving corporate espionage, advanced computer intrusions, denial of service, insider attacks, malware outbreaks, Internet fraud and theft of trade secrets.
By timothy P. ryan
14 | 2013/2014 Kroll Global Fraud Report
regIonal analysIs americas
This year’s survey findings justify their concerns. For companies actually affected by fraud, the category with the biggest jump was in vendor/supplier/procurement relationships – up from last year’s 12% to 19% now. When nearly one in five companies is experiencing fraud in this area, investing in the right due diligence can save millions of dollars and countless management man-hours negotiating opportunities and avoiding pitfalls.
While the problem is widespread, and depending on the jurisdiction seemingly intractable, many of Kroll’s clients are experiencing positive results with a three-pronged approach:
» Management setting the tone from the top with a commitment to a strong compliance ethic
» Creating and maintaining a robust compliance program
» Conducting appropriate levels of due diligence that are commensurate with the scope of the transaction and jurisdictional transparency
Commitment to compliance must come
from the top. A strong commitment to
compliance, driven by the company’s senior
management, is key for reinforcing an
environment that helps employees stay
focused on operating ethically. It also creates
the expectation that all new ventures receive
an appropriate level of due diligence review.
Robust compliance programs standardize
procedures. In addition to setting the tone
from the top, organizations also need a
robust compliance program that ensures a
standardized process is undertaken at all
levels and subsidiaries of the company.
This is especially critical for when new
agents, joint venture partners, vendors,
suppliers or other third parties are brought
into the corporate fold. At a bare minimum,
the program should encompass some basic
due diligence as well as components that
confirm each relevant person’s awareness
and assurance of a commitment to follow the
company’s ethics and compliance policies
and procedures.
Right-sizing due diligence efforts can pay
off in the long-term. For significant
commitments to new ventures, however,
more comprehensive investigative due
diligence may be necessary. This is often
true in jurisdictions where corruption and
bribery are prevalent in the conduct of
business. Exactly whom is the company
interacting with to get the deal done? Are
there government officials involved and in
what capacity? This has been a particular
area of SEC and DOJ interest over the last
couple of years, with sizeable fines for
payments of bribes by subsidiaries to
government officials. Just in 2013, these fines
have topped $400 million. Particularly in
countries where the availability of public
records is thin, boots-on-the-ground
reputational inquiries are often the only way
to ascertain relationships held by the agents/
third parties and their ability to bring the
deal to fruition as they claim, in an
appropriate manner.
How much due diligence is needed?
That is the million-dollar, unanswered
question. The short answer is: It depends.
The US Securities Act of 1933, the Foreign
Corrupt Practices Act, UK Bribery Act and
other regulatory acts don’t specifically define
the level of due diligence required. Instead,
they use words like “robust,” “appropriate,”
“enhanced” and “adequate.” In essence,
regulators seem to want to ensure that
parties find any potential problem. For
example, if a material issue is not identified,
the authorities could arguably question
whether the level of due diligence was
appropriate.
By Peter turecek
right-sizing your due diligence programs
Risk consultants receive calls daily from clients seeking to do business in overseas jurisdictions; in many cases, it is the first time they are contemplating operations in those countries. Whether it’s a product of their own internal compliance guidelines, the threat of increased Securities and Exchange Commission (SEC) and Department of Justice (DOJ) enforcement of the Foreign Corrupt Practices Act, a previous experience or just a fear of not getting the right structure in place for a new venture, they’re asking the right questions and seeking professional assistance before jumping into the new marketplace.
eConomIst IntellIgenCe unIt rePort CardteChnology, medIa & teleComs
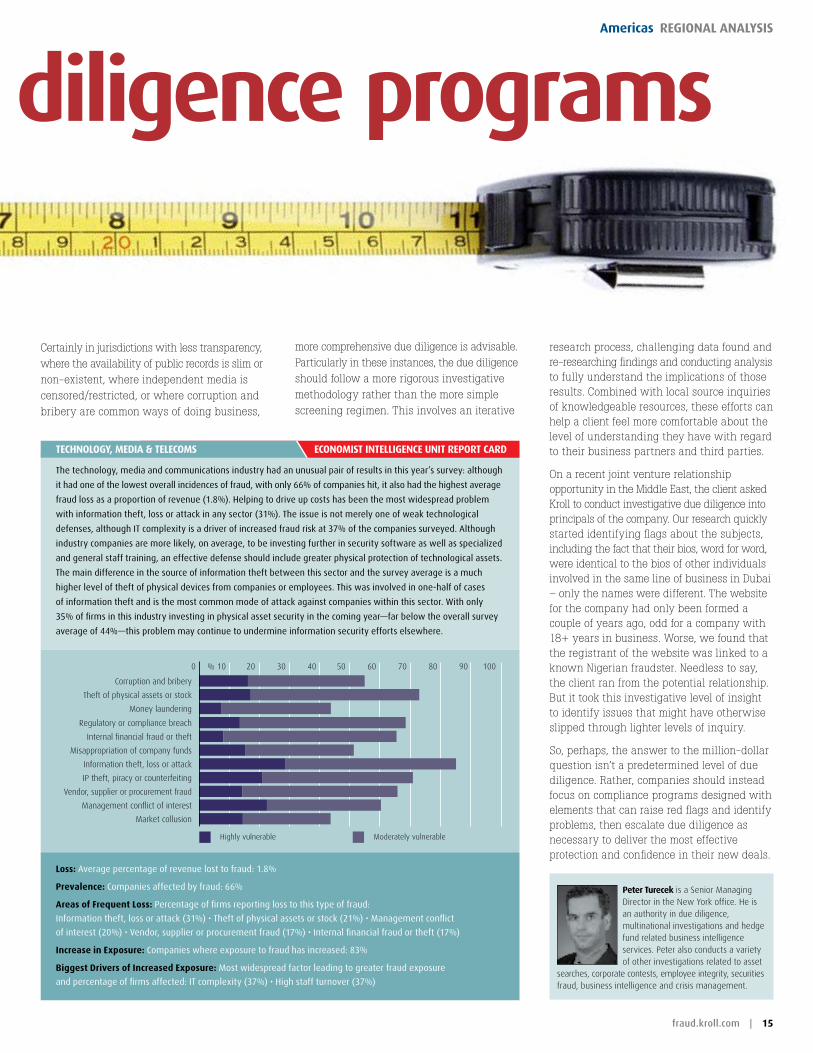
The technology, media and communications industry had an unusual pair of results in this year’s survey: although
it had one of the lowest overall incidences of fraud, with only 66% of companies hit, it also had the highest average
fraud loss as a proportion of revenue (1.8%). helping to drive up costs has been the most widespread problem
with information theft, loss or attack in any sector (31%). The issue is not merely one of weak technological
defenses, although IT complexity is a driver of increased fraud risk at 37% of the companies surveyed. Although
industry companies are more likely, on average, to be investing further in security software as well as specialized
and general staff training, an effective defense should include greater physical protection of technological assets.
The main difference in the source of information theft between this sector and the survey average is a much
higher level of theft of physical devices from companies or employees. This was involved in one-half of cases
of information theft and is the most common mode of attack against companies within this sector. With only
35% of firms in this industry investing in physical asset security in the coming year—far below the overall survey
average of 44%—this problem may continue to undermine information security efforts elsewhere.
Highly vulnerable Moderately vulnerable
0 10 20 30 40 50 60 70 80 90 100 %
Corruption and bribery
Theft of physical assets or stock
Money laundering
Regulatory or compliance breach
Internal financial fraud or theft
Misappropriation of company funds
Information theft, loss or attack
IP theft, piracy or counterfeiting
Vendor, supplier or procurement fraud
Management conflict of interest
Market collusion
loss: Average percentage of revenue lost to fraud: 1.8%
Prevalence: Companies affected by fraud: 66%
areas of Frequent loss: Percentage of firms reporting loss to this type of fraud:
Information theft, loss or attack (31%) • Theft of physical assets or stock (21%) • Management conflict
of interest (20%) • vendor, supplier or procurement fraud (17%) • Internal financial fraud or theft (17%)
Increase in exposure: Companies where exposure to fraud has increased: 83%
Biggest drivers of Increased exposure: Most widespread factor leading to greater fraud exposure
and percentage of firms affected: IT complexity (37%) • high staff turnover (37%)
fraud.kroll.com | 15
americas regIonal analysIs
research process, challenging data found and re-researching findings and conducting analysis to fully understand the implications of those results. Combined with local source inquiries of knowledgeable resources, these efforts can help a client feel more comfortable about the level of understanding they have with regard to their business partners and third parties.
On a recent joint venture relationship opportunity in the Middle East, the client asked Kroll to conduct investigative due diligence into principals of the company. Our research quickly started identifying flags about the subjects, including the fact that their bios, word for word, were identical to the bios of other individuals involved in the same line of business in Dubai – only the names were different. The website for the company had only been formed a couple of years ago, odd for a company with 18+ years in business. Worse, we found that the registrant of the website was linked to a known Nigerian fraudster. Needless to say, the client ran from the potential relationship. But it took this investigative level of insight to identify issues that might have otherwise slipped through lighter levels of inquiry.
So, perhaps, the answer to the million-dollar question isn’t a predetermined level of due diligence. Rather, companies should instead focus on compliance programs designed with elements that can raise red flags and identify problems, then escalate due diligence as necessary to deliver the most effective protection and confidence in their new deals.
Peter turecek is a Senior Managing Director in the New York office. He is an authority in due diligence, multinational investigations and hedge fund related business intelligence services. Peter also conducts a variety of other investigations related to asset
searches, corporate contests, employee integrity, securities fraud, business intelligence and crisis management.
more comprehensive due diligence is advisable. Particularly in these instances, the due diligence should follow a more rigorous investigative methodology rather than the more simple screening regimen. This involves an iterative
Certainly in jurisdictions with less transparency, where the availability of public records is slim or non-existent, where independent media is censored/restricted, or where corruption and bribery are common ways of doing business,
right-sizing your due diligence programs
16 | 2013/2014 Kroll Global Fraud Report
regIonal analysIs americas
FCPA enforcement actions are usually resolved through deferred prosecution agreements and non-prosecution agreements, which often impose an independent monitor to ensure the company’s previous failures are not repeated and that adequate safeguards are put in place to ensure compliance with Bank Secrecy Act (“BSA”) and anti-money laundering requirements. Such monitors are becoming increasingly utilized at the federal, state and even local level of government.
Effective compliance requires focus on implementation and enforcement
Although companies may have a compliance structure in place, such existing intended safeguards are often inadequate: Employees need to be trained on compliance with the FCPA,
reporting structures must be properly aligned, and the system of internal financial controls needs to be audited and periodically re-assessed and re-evaluated. FCPA anti-bribery provisions, as well as the books and records and internal control requirements, necessitate very specific training. An appropriate external monitor already has the team infrastructure, skills and expertise to provide education; track expense reports and transactions; audit financials; and impose controls necessary to prevent, deter and detect improper payments.
Companies frequently do not have adequate internal controls to ensure compliance with applicable policies, procedures and practices. Even if such controls do exist, they are often unenforced. According to a separate survey conducted for Kroll’s recent Anti-Bribery and
By dan schorr and emily low
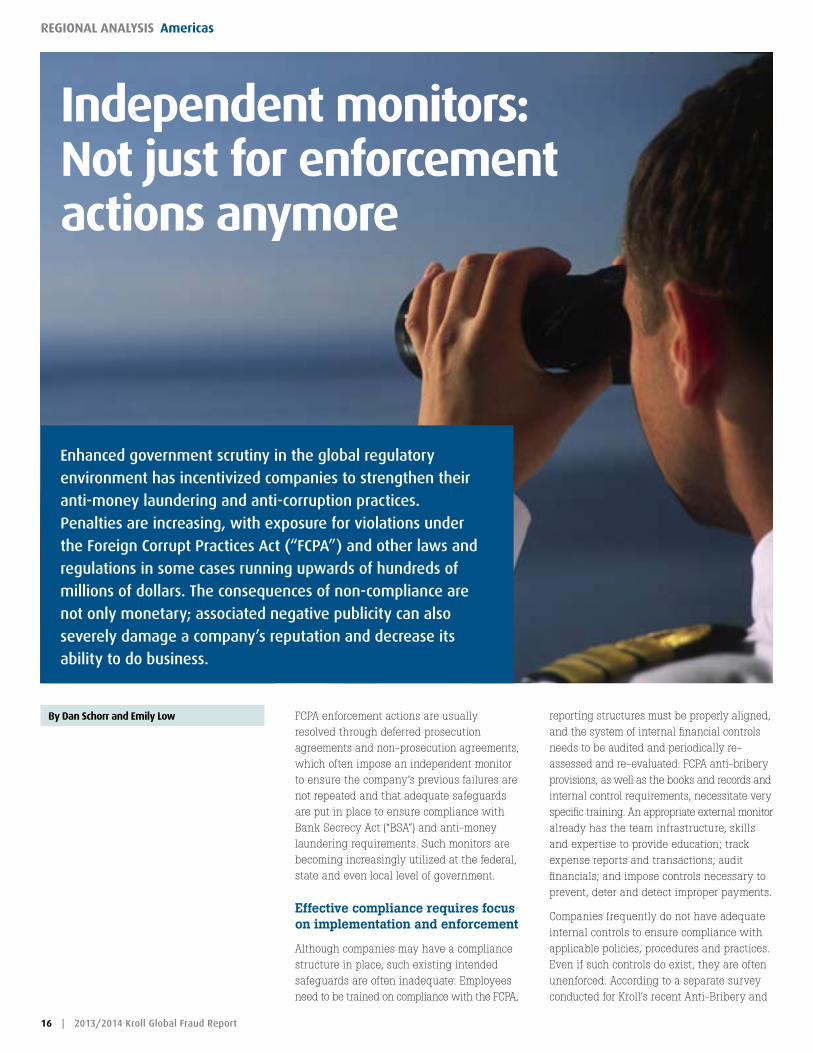
Independent monitors: not just for enforcement actions anymore
Enhanced government scrutiny in the global regulatory environment has incentivized companies to strengthen their anti-money laundering and anti-corruption practices. Penalties are increasing, with exposure for violations under the Foreign Corrupt Practices Act (“FCPA”) and other laws and regulations in some cases running upwards of hundreds of millions of dollars. The consequences of non-compliance are not only monetary; associated negative publicity can also severely damage a company’s reputation and decrease its ability to do business.
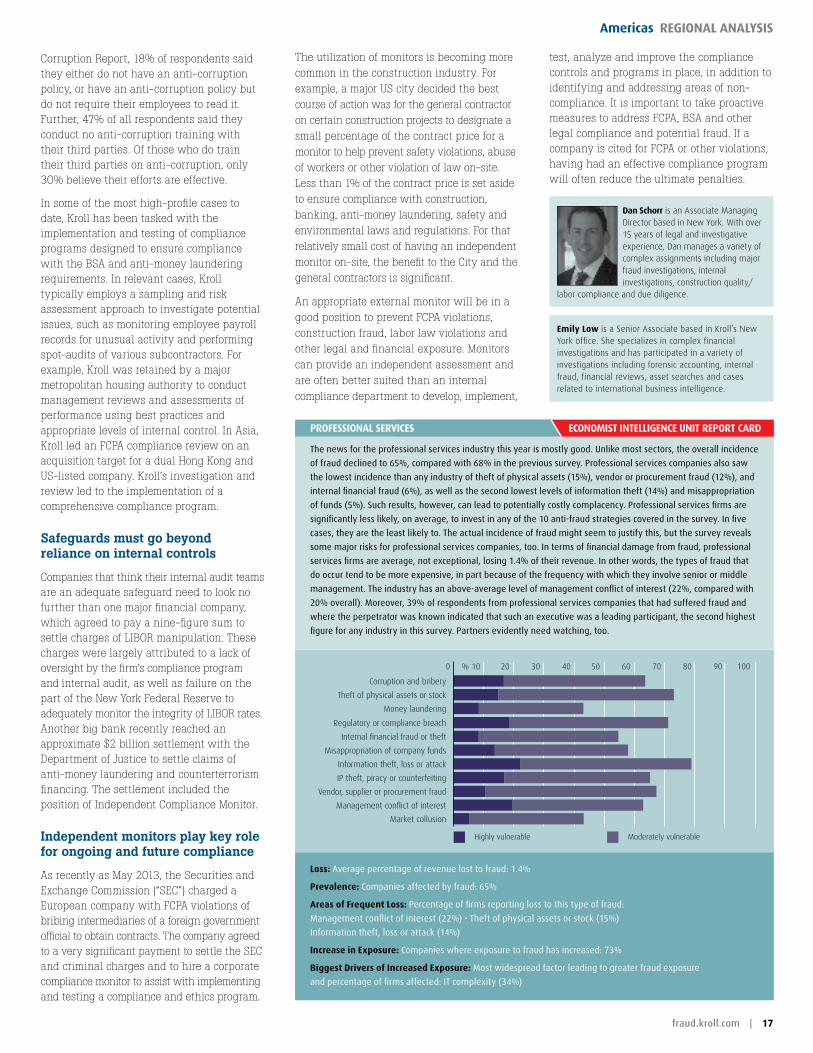
eConomIst IntellIgenCe unIt rePort CardProFessIonal servICes
The news for the professional services industry this year is mostly good. Unlike most sectors, the overall incidence
of fraud declined to 65%, compared with 68% in the previous survey. Professional services companies also saw
the lowest incidence than any industry of theft of physical assets (15%), vendor or procurement fraud (12%), and
internal financial fraud (6%), as well as the second lowest levels of information theft (14%) and misappropriation
of funds (5%). Such results, however, can lead to potentially costly complacency. Professional services firms are
significantly less likely, on average, to invest in any of the 10 anti-fraud strategies covered in the survey. In five
cases, they are the least likely to. The actual incidence of fraud might seem to justify this, but the survey reveals
some major risks for professional services companies, too. In terms of financial damage from fraud, professional
services firms are average, not exceptional, losing 1.4% of their revenue. In other words, the types of fraud that
do occur tend to be more expensive, in part because of the frequency with which they involve senior or middle
management. The industry has an above-average level of management conflict of interest (22%, compared with
20% overall). Moreover, 39% of respondents from professional services companies that had suffered fraud and
where the perpetrator was known indicated that such an executive was a leading participant, the second highest
figure for any industry in this survey. Partners evidently need watching, too.
Highly vulnerable Moderately vulnerable
0 10 20 30 40 50 60 70 80 90 100 %
Corruption and bribery
Theft of physical assets or stock
Money laundering
Regulatory or compliance breach
Internal financial fraud or theft
Misappropriation of company funds
Information theft, loss or attack
IP theft, piracy or counterfeiting
Vendor, supplier or procurement fraud
Management conflict of interest
Market collusion
loss: Average percentage of revenue lost to fraud: 1.4%
Prevalence: Companies affected by fraud: 65%
areas of Frequent loss: Percentage of firms reporting loss to this type of fraud:
Management conflict of interest (22%) • Theft of physical assets or stock (15%)
Information theft, loss or attack (14%)
Increase in exposure: Companies where exposure to fraud has increased: 73%
Biggest drivers of Increased exposure: Most widespread factor leading to greater fraud exposure
and percentage of firms affected: IT complexity (34%)
fraud.kroll.com | 17
americas regIonal analysIs
The utilization of monitors is becoming more common in the construction industry. For example, a major US city decided the best course of action was for the general contractor on certain construction projects to designate a small percentage of the contract price for a monitor to help prevent safety violations, abuse of workers or other violation of law on-site. Less than 1% of the contract price is set aside to ensure compliance with construction, banking, anti-money laundering, safety and environmental laws and regulations. For that relatively small cost of having an independent monitor on-site, the benefit to the City and the general contractors is significant.
An appropriate external monitor will be in a good position to prevent FCPA violations, construction fraud, labor law violations and other legal and financial exposure. Monitors can provide an independent assessment and are often better suited than an internal compliance department to develop, implement,
Corruption Report, 18% of respondents said they either do not have an anti-corruption policy, or have an anti-corruption policy but do not require their employees to read it. Further, 47% of all respondents said they conduct no anti-corruption training with their third parties. Of those who do train their third parties on anti-corruption, only 30% believe their efforts are effective.
In some of the most high-profile cases to date, Kroll has been tasked with the implementation and testing of compliance programs designed to ensure compliance with the BSA and anti-money laundering requirements. In relevant cases, Kroll typically employs a sampling and risk assessment approach to investigate potential issues, such as monitoring employee payroll records for unusual activity and performing spot-audits of various subcontractors. For example, Kroll was retained by a major metropolitan housing authority to conduct management reviews and assessments of performance using best practices and appropriate levels of internal control. In Asia, Kroll led an FCPA compliance review on an acquisition target for a dual Hong Kong and US-listed company. Kroll’s investigation and review led to the implementation of a comprehensive compliance program.
Safeguards must go beyond reliance on internal controls
Companies that think their internal audit teams are an adequate safeguard need to look no further than one major financial company, which agreed to pay a nine-figure sum to settle charges of LIBOR manipulation. These charges were largely attributed to a lack of oversight by the firm’s compliance program and internal audit, as well as failure on the part of the New York Federal Reserve to adequately monitor the integrity of LIBOR rates. Another big bank recently reached an approximate $2 billion settlement with the Department of Justice to settle claims of anti-money laundering and counterterrorism financing. The settlement included the position of Independent Compliance Monitor.
Independent monitors play key role for ongoing and future compliance
As recently as May 2013, the Securities and Exchange Commission (“SEC”) charged a European company with FCPA violations of bribing intermediaries of a foreign government official to obtain contracts. The company agreed to a very significant payment to settle the SEC and criminal charges and to hire a corporate compliance monitor to assist with implementing and testing a compliance and ethics program.
test, analyze and improve the compliance controls and programs in place, in addition to identifying and addressing areas of non-compliance. It is important to take proactive measures to address FCPA, BSA and other legal compliance and potential fraud. If a company is cited for FCPA or other violations, having had an effective compliance program will often reduce the ultimate penalties.
dan schorr is an Associate Managing Director based in New York. With over 15 years of legal and investigative experience, Dan manages a variety of complex assignments including major fraud investigations, internal investigations, construction quality/
labor compliance and due diligence.
emily low is a Senior Associate based in Kroll’s New York office. She specializes in complex financial investigations and has participated in a variety of investigations including forensic accounting, internal fraud, financial reviews, asset searches and cases related to international business intelligence.
18 | 2013/2014 Kroll Global Fraud Report
regIonal analysIs americas
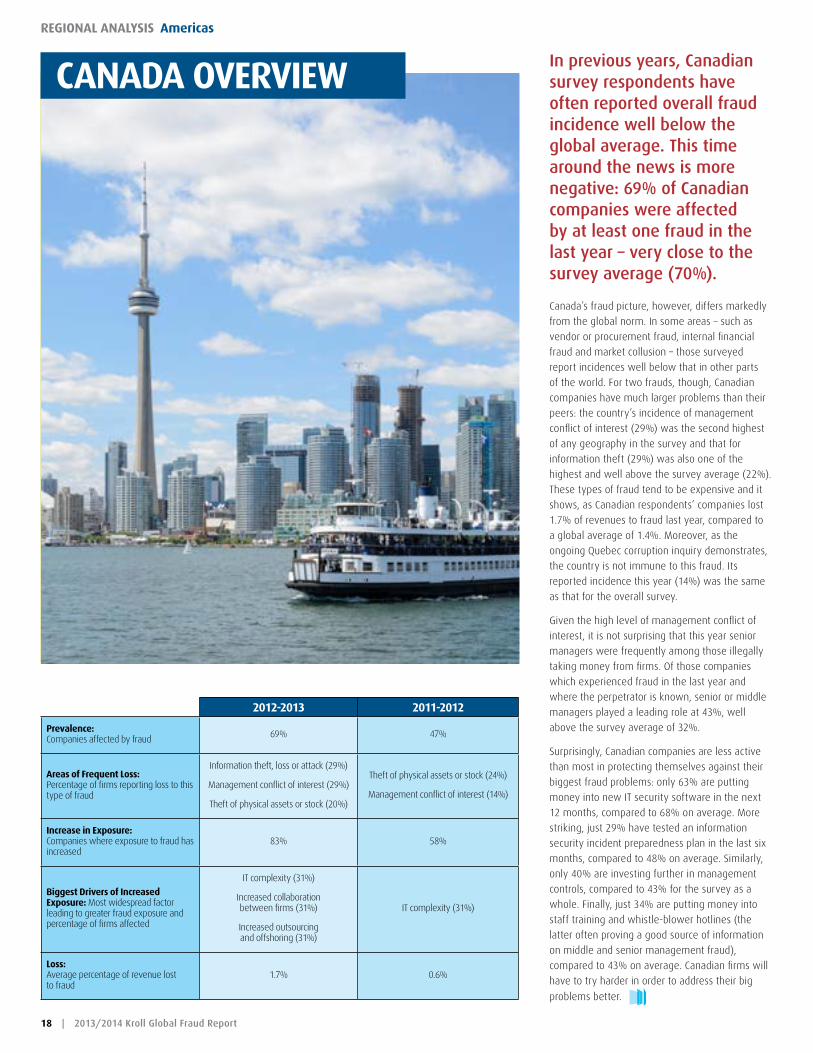
In previous years, Canadian survey respondents have often reported overall fraud incidence well below the global average. This time around the news is more negative: 69% of Canadian companies were affected by at least one fraud in the last year – very close to the survey average (70%).
Canada’s fraud picture, however, differs markedly
from the global norm. In some areas – such as
vendor or procurement fraud, internal financial
fraud and market collusion – those surveyed
report incidences well below that in other parts
of the world. For two frauds, though, Canadian
companies have much larger problems than their
peers: the country’s incidence of management
conflict of interest (29%) was the second highest
of any geography in the survey and that for
information theft (29%) was also one of the
highest and well above the survey average (22%).
These types of fraud tend to be expensive and it
shows, as Canadian respondents’ companies lost
1.7% of revenues to fraud last year, compared to
a global average of 1.4%. Moreover, as the
ongoing Quebec corruption inquiry demonstrates,
the country is not immune to this fraud. Its
reported incidence this year (14%) was the same
as that for the overall survey.
Given the high level of management conflict of
interest, it is not surprising that this year senior
managers were frequently among those illegally
taking money from firms. Of those companies
which experienced fraud in the last year and
where the perpetrator is known, senior or middle
managers played a leading role at 43%, well
above the survey average of 32%.
Surprisingly, Canadian companies are less active
than most in protecting themselves against their
biggest fraud problems: only 63% are putting
money into new IT security software in the next
12 months, compared to 68% on average. More
striking, just 29% have tested an information
security incident preparedness plan in the last six
months, compared to 48% on average. Similarly,
only 40% are investing further in management
controls, compared to 43% for the survey as a
whole. Finally, just 34% are putting money into
staff training and whistle-blower hotlines (the
latter often proving a good source of information
on middle and senior management fraud),
compared to 43% on average. Canadian firms will
have to try harder in order to address their big
problems better.
Canada overvIew
2012-2013 2011-2012
Prevalence: Companies affected by fraud 69% 47%
areas of Frequent loss: Percentage of firms reporting loss to this type of fraud
Information theft, loss or attack (29%)
Management conflict of interest (29%)
Theft of physical assets or stock (20%)
Theft of physical assets or stock (24%)
Management conflict of interest (14%)
Increase in exposure: Companies where exposure to fraud has increased
83% 58%
Biggest drivers of Increased exposure: Most widespread factor leading to greater fraud exposure and percentage of firms affected
IT complexity (31%)
Increased collaboration between firms (31%)
Increased outsourcing and offshoring (31%)
IT complexity (31%)
loss: Average percentage of revenue lost to fraud
1.7% 0.6%
fraud.kroll.com | 19
americas regIonal analysIs
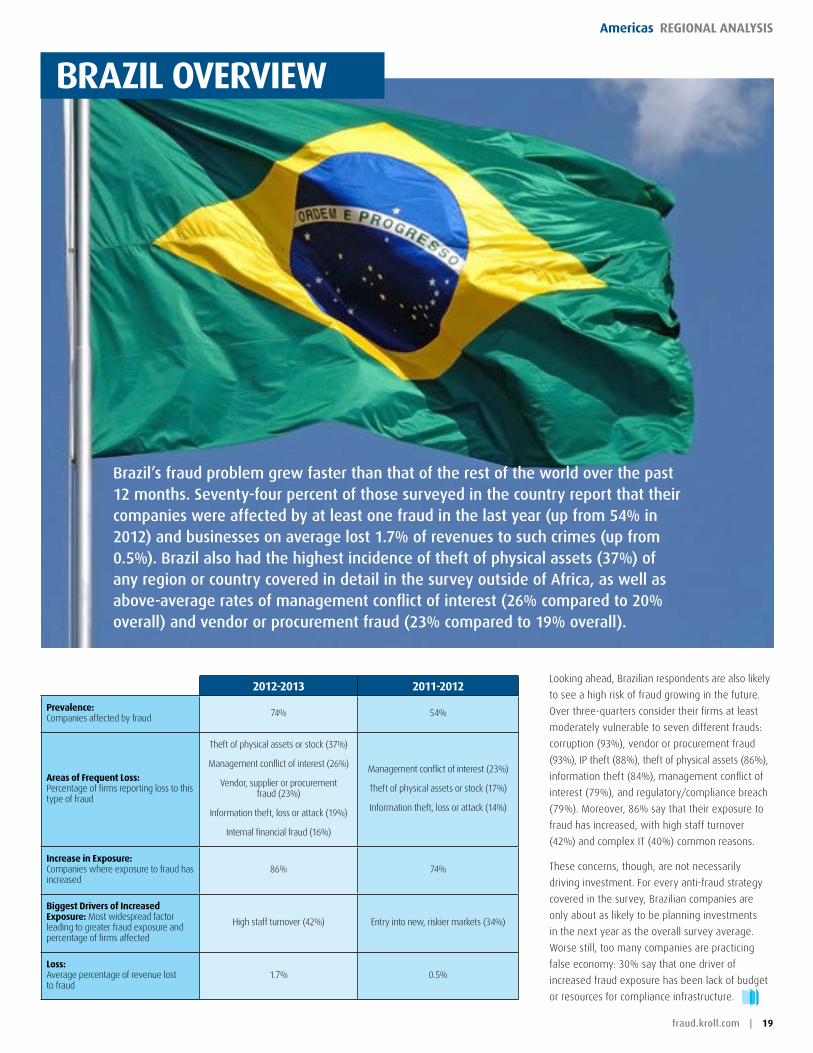
Looking ahead, Brazilian respondents are also likely
to see a high risk of fraud growing in the future.
Over three-quarters consider their firms at least
moderately vulnerable to seven different frauds:
corruption (93%), vendor or procurement fraud
(93%), IP theft (88%), theft of physical assets (86%),
information theft (84%), management conflict of
interest (79%), and regulatory/compliance breach
(79%). Moreover, 86% say that their exposure to
fraud has increased, with high staff turnover
(42%) and complex IT (40%) common reasons.
These concerns, though, are not necessarily
driving investment. For every anti-fraud strategy
covered in the survey, Brazilian companies are
only about as likely to be planning investments
in the next year as the overall survey average.
Worse still, too many companies are practicing
false economy: 30% say that one driver of
increased fraud exposure has been lack of budget
or resources for compliance infrastructure.
BrazIl overvIew
2012-2013 2011-2012
Prevalence: Companies affected by fraud 74% 54%
areas of Frequent loss: Percentage of firms reporting loss to this type of fraud
Theft of physical assets or stock (37%)
Management conflict of interest (26%)
Vendor, supplier or procurement fraud (23%)
Information theft, loss or attack (19%)
Internal financial fraud (16%)
Management conflict of interest (23%)
Theft of physical assets or stock (17%)
Information theft, loss or attack (14%)
Increase in exposure: Companies where exposure to fraud has increased
86% 74%
Biggest drivers of Increased exposure: Most widespread factor leading to greater fraud exposure and percentage of firms affected
High staff turnover (42%) Entry into new, riskier markets (34%)
loss: Average percentage of revenue lost to fraud
1.7% 0.5%
Brazil’s fraud problem grew faster than that of the rest of the world over the past 12 months. Seventy-four percent of those surveyed in the country report that their companies were affected by at least one fraud in the last year (up from 54% in 2012) and businesses on average lost 1.7% of revenues to such crimes (up from 0.5%). Brazil also had the highest incidence of theft of physical assets (37%) of any region or country covered in detail in the survey outside of Africa, as well as above-average rates of management conflict of interest (26% compared to 20% overall) and vendor or procurement fraud (23% compared to 19% overall).
20 | 2013/2014 Kroll Global Fraud Report
regIonal analysIs americas
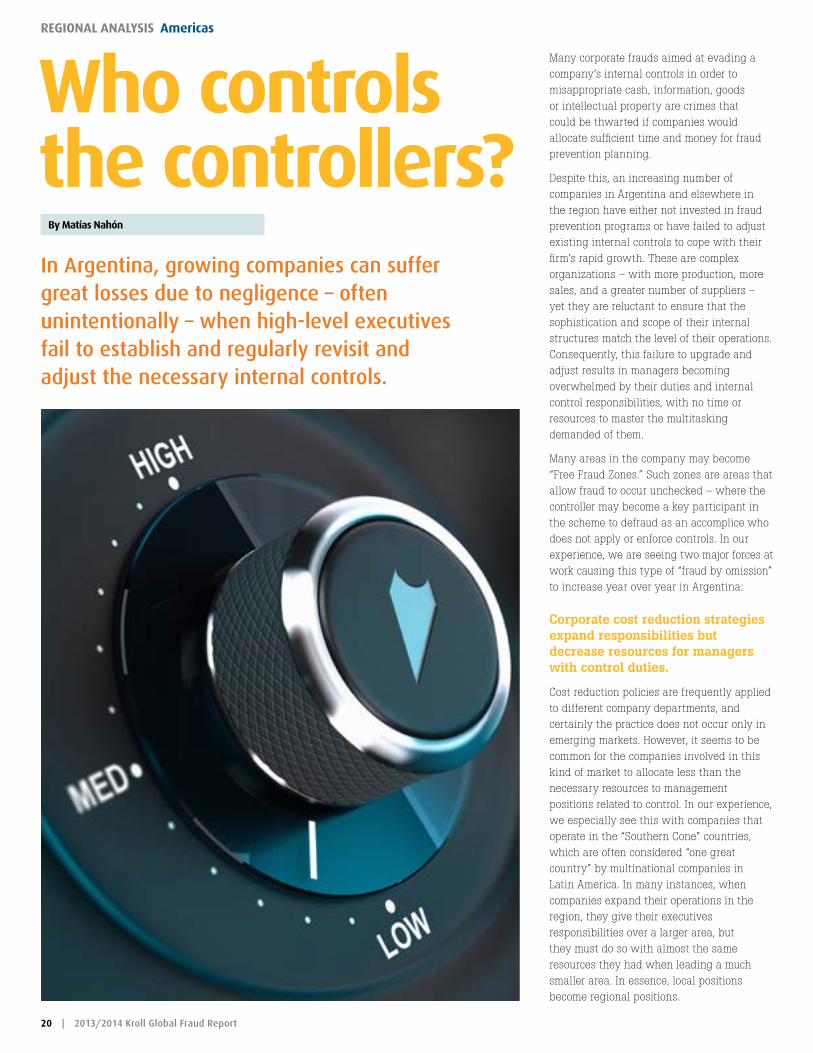
In Argentina, growing companies can suffer great losses due to negligence – often unintentionally – when high-level executives fail to establish and regularly revisit and adjust the necessary internal controls.
Many corporate frauds aimed at evading a company’s internal controls in order to misappropriate cash, information, goods or intellectual property are crimes that could be thwarted if companies would allocate sufficient time and money for fraud prevention planning.
Despite this, an increasing number of companies in Argentina and elsewhere in the region have either not invested in fraud prevention programs or have failed to adjust existing internal controls to cope with their firm’s rapid growth. These are complex organizations – with more production, more sales, and a greater number of suppliers – yet they are reluctant to ensure that the sophistication and scope of their internal structures match the level of their operations. Consequently, this failure to upgrade and adjust results in managers becoming overwhelmed by their duties and internal control responsibilities, with no time or resources to master the multitasking demanded of them.
Many areas in the company may become “Free Fraud Zones.” Such zones are areas that allow fraud to occur unchecked – where the controller may become a key participant in the scheme to defraud as an accomplice who does not apply or enforce controls. In our experience, we are seeing two major forces at work causing this type of “fraud by omission” to increase year over year in Argentina:
Corporate cost reduction strategies expand responsibilities but decrease resources for managers with control duties.
Cost reduction policies are frequently applied to different company departments, and certainly the practice does not occur only in emerging markets. However, it seems to be common for the companies involved in this kind of market to allocate less than the necessary resources to management positions related to control. In our experience, we especially see this with companies that operate in the “Southern Cone” countries, which are often considered “one great country” by multinational companies in Latin America. In many instances, when companies expand their operations in the region, they give their executives responsibilities over a larger area, but they must do so with almost the same resources they had when leading a much smaller area. In essence, local positions become regional positions.
who controls the controllers?
By matías nahón
eConomIst IntellIgenCe unIt rePort CardmanuFaCturIng
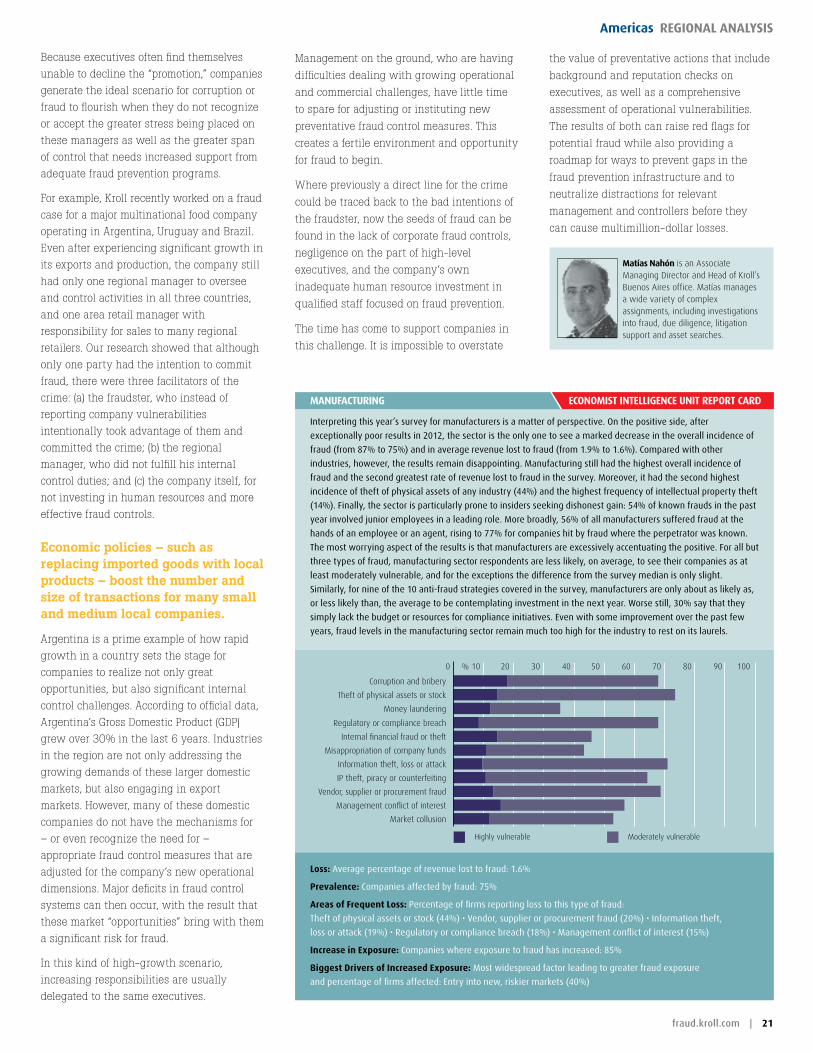
Interpreting this year’s survey for manufacturers is a matter of perspective. On the positive side, after
exceptionally poor results in 2012, the sector is the only one to see a marked decrease in the overall incidence of
fraud (from 87% to 75%) and in average revenue lost to fraud (from 1.9% to 1.6%). Compared with other
industries, however, the results remain disappointing. Manufacturing still had the highest overall incidence of
fraud and the second greatest rate of revenue lost to fraud in the survey. Moreover, it had the second highest
incidence of theft of physical assets of any industry (44%) and the highest frequency of intellectual property theft
(14%). finally, the sector is particularly prone to insiders seeking dishonest gain: 54% of known frauds in the past
year involved junior employees in a leading role. More broadly, 56% of all manufacturers suffered fraud at the
hands of an employee or an agent, rising to 77% for companies hit by fraud where the perpetrator was known.
The most worrying aspect of the results is that manufacturers are excessively accentuating the positive. for all but
three types of fraud, manufacturing sector respondents are less likely, on average, to see their companies as at
least moderately vulnerable, and for the exceptions the difference from the survey median is only slight.
Similarly, for nine of the 10 anti-fraud strategies covered in the survey, manufacturers are only about as likely as,
or less likely than, the average to be contemplating investment in the next year. Worse still, 30% say that they
simply lack the budget or resources for compliance initiatives. Even with some improvement over the past few
years, fraud levels in the manufacturing sector remain much too high for the industry to rest on its laurels.
Highly vulnerable Moderately vulnerable
0 10 20 30 40 50 60 70 80 90 100 %
Corruption and bribery
Theft of physical assets or stock
Money laundering
Regulatory or compliance breach
Internal financial fraud or theft
Misappropriation of company funds
Information theft, loss or attack
IP theft, piracy or counterfeiting
Vendor, supplier or procurement fraud
Management conflict of interest
Market collusion
loss: Average percentage of revenue lost to fraud: 1.6%
Prevalence: Companies affected by fraud: 75%
areas of Frequent loss: Percentage of firms reporting loss to this type of fraud:
Theft of physical assets or stock (44%) • vendor, supplier or procurement fraud (20%) • Information theft,
loss or attack (19%) • Regulatory or compliance breach (18%) • Management conflict of interest (15%)
Increase in exposure: Companies where exposure to fraud has increased: 85%
Biggest drivers of Increased exposure: Most widespread factor leading to greater fraud exposure
and percentage of firms affected: Entry into new, riskier markets (40%)
fraud.kroll.com | 21
americas regIonal analysIs
the value of preventative actions that include
background and reputation checks on
executives, as well as a comprehensive
assessment of operational vulnerabilities.
The results of both can raise red flags for
potential fraud while also providing a
roadmap for ways to prevent gaps in the
fraud prevention infrastructure and to
neutralize distractions for relevant
management and controllers before they
can cause multimillion-dollar losses.
matías nahón is an Associate Managing Director and Head of Kroll’s Buenos Aires office. Matías manages a wide variety of complex assignments, including investigations into fraud, due diligence, litigation support and asset searches.
Management on the ground, who are having
difficulties dealing with growing operational
and commercial challenges, have little time
to spare for adjusting or instituting new
preventative fraud control measures. This
creates a fertile environment and opportunity
for fraud to begin.
Where previously a direct line for the crime
could be traced back to the bad intentions of
the fraudster, now the seeds of fraud can be
found in the lack of corporate fraud controls,
negligence on the part of high-level
executives, and the company’s own
inadequate human resource investment in
qualified staff focused on fraud prevention.
The time has come to support companies in
this challenge. It is impossible to overstate
Because executives often find themselves
unable to decline the “promotion,” companies
generate the ideal scenario for corruption or
fraud to flourish when they do not recognize
or accept the greater stress being placed on
these managers as well as the greater span
of control that needs increased support from
adequate fraud prevention programs.
For example, Kroll recently worked on a fraud
case for a major multinational food company
operating in Argentina, Uruguay and Brazil.
Even after experiencing significant growth in
its exports and production, the company still
had only one regional manager to oversee
and control activities in all three countries,
and one area retail manager with
responsibility for sales to many regional
retailers. Our research showed that although
only one party had the intention to commit
fraud, there were three facilitators of the
crime: (a) the fraudster, who instead of
reporting company vulnerabilities
intentionally took advantage of them and
committed the crime; (b) the regional
manager, who did not fulfill his internal
control duties; and (c) the company itself, for
not investing in human resources and more
effective fraud controls.
Economic policies – such as replacing imported goods with local products – boost the number and size of transactions for many small and medium local companies.
Argentina is a prime example of how rapid
growth in a country sets the stage for
companies to realize not only great
opportunities, but also significant internal
control challenges. According to official data,
Argentina’s Gross Domestic Product (GDP)
grew over 30% in the last 6 years. Industries
in the region are not only addressing the
growing demands of these larger domestic
markets, but also engaging in export
markets. However, many of these domestic
companies do not have the mechanisms for
– or even recognize the need for –
appropriate fraud control measures that are
adjusted for the company’s new operational
dimensions. Major deficits in fraud control
systems can then occur, with the result that
these market “opportunities” bring with them
a significant risk for fraud.
In this kind of high-growth scenario,
increasing responsibilities are usually
delegated to the same executives.
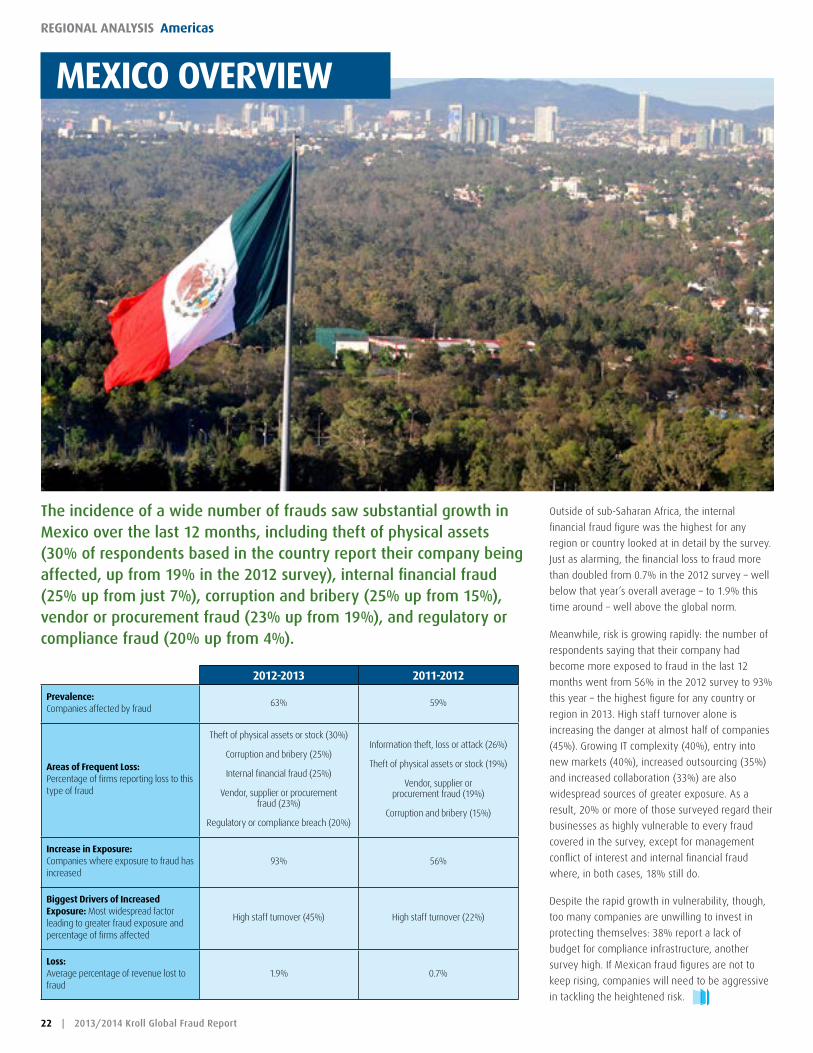
22 | 2013/2014 Kroll Global Fraud Report
regIonal analysIs americas
Outside of sub-Saharan Africa, the internal
financial fraud figure was the highest for any
region or country looked at in detail by the survey.
Just as alarming, the financial loss to fraud more
than doubled from 0.7% in the 2012 survey – well
below that year’s overall average – to 1.9% this
time around – well above the global norm.
Meanwhile, risk is growing rapidly: the number of
respondents saying that their company had
become more exposed to fraud in the last 12
months went from 56% in the 2012 survey to 93%
this year – the highest figure for any country or
region in 2013. High staff turnover alone is
increasing the danger at almost half of companies
(45%). Growing IT complexity (40%), entry into
new markets (40%), increased outsourcing (35%)
and increased collaboration (33%) are also
widespread sources of greater exposure. As a
result, 20% or more of those surveyed regard their
businesses as highly vulnerable to every fraud
covered in the survey, except for management
conflict of interest and internal financial fraud
where, in both cases, 18% still do.
Despite the rapid growth in vulnerability, though,
too many companies are unwilling to invest in
protecting themselves: 38% report a lack of
budget for compliance infrastructure, another
survey high. If Mexican fraud figures are not to
keep rising, companies will need to be aggressive
in tackling the heightened risk.
mexICo overvIew
2012-2013 2011-2012
Prevalence: Companies affected by fraud
63% 59%
areas of Frequent loss: Percentage of firms reporting loss to this type of fraud
Theft of physical assets or stock (30%)
Corruption and bribery (25%)
Internal financial fraud (25%)
Vendor, supplier or procurement fraud (23%)
Regulatory or compliance breach (20%)
Information theft, loss or attack (26%)
Theft of physical assets or stock (19%)
Vendor, supplier or procurement fraud (19%)
Corruption and bribery (15%)
Increase in exposure: Companies where exposure to fraud has increased
93% 56%
Biggest drivers of Increased exposure: Most widespread factor leading to greater fraud exposure and percentage of firms affected
High staff turnover (45%) High staff turnover (22%)
loss: Average percentage of revenue lost to fraud
1.9% 0.7%
The incidence of a wide number of frauds saw substantial growth in Mexico over the last 12 months, including theft of physical assets (30% of respondents based in the country report their company being affected, up from 19% in the 2012 survey), internal financial fraud (25% up from just 7%), corruption and bribery (25% up from 15%), vendor or procurement fraud (23% up from 19%), and regulatory or compliance fraud (20% up from 4%).

fraud.kroll.com | 23
americas regIonal analysIs
On the other hand, the figures show a rapid rise in fraud. In the 2012 survey, the overall incidence of fraud was only 49% and the average loss just 0.4%. Similarly, in the 2012 poll, only two frauds were more common in Colombia than in the survey as a whole, but this year it is four – theft of physical assets (37% compared to 19%); vendor or procurement fraud (20% compared to 19%), corruption (17% compared to 14%), and market collusion (13% compared to 8%).
Looking ahead, things have the potential to grow worse: a striking 90% of respondents say that their exposure to fraud has increased in the last year, roughly double the 46% who reported this in the 2012 survey. Nearly half of those surveyed in Colombia this year (47%) say that high staff turnover is a driver of higher fraud risk, and the same number say the same thing about entry into new markets.
The data show that a substantial number of Colombian firms will be making additional investments in a range of anti-fraud strategies, but also indicate that at 27% a lack of budget is constraining this in at least some cases. In the current environment, these companies cannot rely on the previously low incidence of fraud to keep
them safe.
ColomBIa overvIew
2012-2013 2011-2012
Prevalence: Companies affected by fraud
63% 49%
areas of Frequent loss: Percentage of firms reporting loss to this type of fraud
Theft of physical assets or stock (37%)Vendor, supplier or procurement
fraud (20%) Corruption and bribery (17%)
Vendor, supplier or procurement fraud (19%)
Theft of physical assets or stock (19%)Regulatory or compliance breach (14%)
Increase in exposure: Companies where exposure to fraud has increased
90% 46%
Biggest drivers of Increased exposure: Most widespread factor leading to greater fraud exposure and percentage of firms affected
Entry into new, riskier markets (47%)High staff turnover (47%)
IT complexity (24%)
loss: Average percentage of revenue lost to fraud
0.7% 0.4%
Like last year, 2013 survey respondents from Colombia report that the country’s fraud problem is smaller than the global norm: just 63% of businesses were affected by at least one fraud in the last 12 months and the average loss to fraud (0.7%) is well below the survey mean (1.4%).
24 | 2013/2014 Kroll Global Fraud Report
regIonal analysIs americas
The passage of these regional laws coincides
with increased scrutiny on business
transactions in Latin America by the US DOJ
and the US SEC. In recent months, actions
concerning Foreign Corrupt Practices Act
(FCPA) violations have been brought against
companies and individuals doing business
in Argentina, Brazil, Mexico, Panama, and
Venezuela. Moreover, an increase in future
Latin American-focused FCPA cases is likely,
as the risk and prevalence of corruption
remains high, and the new local anti-bribery
laws set the expectation for more effective
judicial cooperation between the US and
Latin America.
Brazil After millions took to the streets in more than
100 Brazilian cities in June-July 2013 to
express discontent over their government’s
massive public spending and lack of
institutional transparency, Brazilian politicians
were spurred into passing a landmark
anti-corruption bill that had previously
stalled in Congress for over three years.
Known as the “Clean Company Law (Lei
Anticorrupção Empresarial),” the legislation
establishes direct civil and administrative
liability for companies found guilty of foreign
and domestic bribery and takes effect in
January 2014. The new law includes harsh
penalties for violations, and gives the
government authority, among several
remedies, to seize a company’s assets or
blacklist it from future contracts.
Colombia Colombia, the Andean region’s most populous
country, has undertaken significant efforts to
fight corruption. The new Anti-Corruption
Statute (Law No. 1474 of 2011) criminalizes
the bribery of both local and foreign public
officials, includes imprisonment penalties of
up to 15 years and, like the UK Bribery Act,
specifically addresses commercial bribery.
A significant development is the launch by
President Juan Manuel Santos of the world’s
first “High Level Reporting Mechanism”
(HLRM) in April 2013. The HLRM is a
preventive mechanism designed to address
corruption in public procurement and the
public sector, to issue early warnings and
allow the government to take necessary
corrective measures but, at the same time
and to the extent possible, ensure that the
bidding procedure is successfully carried out.
anti-corruption efforts in latin america:
By recaredo romero
Latin America’s long-awaited broad-scale mobilization against
corruption has started to materialize, and is expected to
continue. Due to popular demands from a growing middle class
as well as pressure from international development
organizations, countries such as Brazil, Colombia and Mexico have
recently enacted anti-corruption frameworks that place strict
penalties on individuals and corporations found guilty
of acts of bribery, fraud in public procurement and bid rigging.
a ChangIng landsCaPe
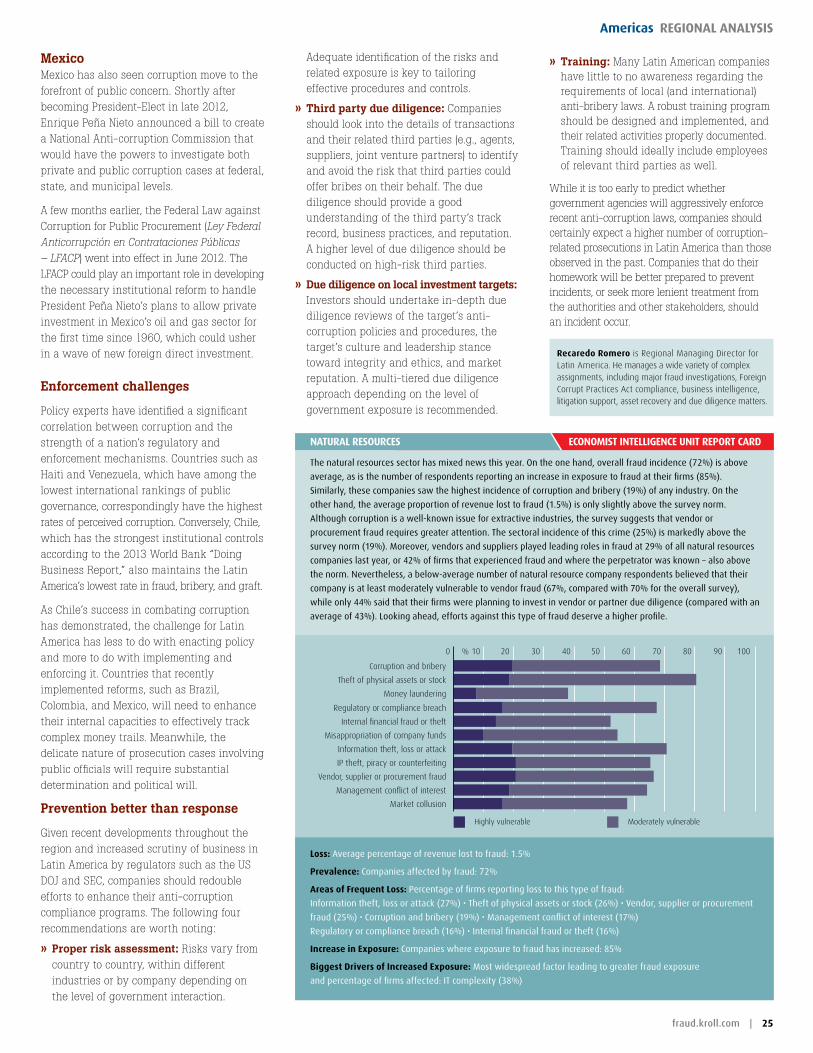
eConomIst IntellIgenCe unIt rePort Cardnatural resourCes
The natural resources sector has mixed news this year. On the one hand, overall fraud incidence (72%) is above
average, as is the number of respondents reporting an increase in exposure to fraud at their firms (85%).
Similarly, these companies saw the highest incidence of corruption and bribery (19%) of any industry. On the
other hand, the average proportion of revenue lost to fraud (1.5%) is only slightly above the survey norm.
Although corruption is a well-known issue for extractive industries, the survey suggests that vendor or
procurement fraud requires greater attention. The sectoral incidence of this crime (25%) is markedly above the
survey norm (19%). Moreover, vendors and suppliers played leading roles in fraud at 29% of all natural resources
companies last year, or 42% of firms that experienced fraud and where the perpetrator was known – also above
the norm. Nevertheless, a below-average number of natural resource company respondents believed that their
company is at least moderately vulnerable to vendor fraud (67%, compared with 70% for the overall survey),
while only 44% said that their firms were planning to invest in vendor or partner due diligence (compared with an
average of 43%). Looking ahead, efforts against this type of fraud deserve a higher profile.
Highly vulnerable Moderately vulnerable
0 10 20 30 40 50 60 70 80 90 100 %
Corruption and bribery
Theft of physical assets or stock
Money laundering
Regulatory or compliance breach
Internal financial fraud or theft
Misappropriation of company funds
Information theft, loss or attack
IP theft, piracy or counterfeiting
Vendor, supplier or procurement fraud
Management conflict of interest
Market collusion
loss: Average percentage of revenue lost to fraud: 1.5%
Prevalence: Companies affected by fraud: 72%
areas of Frequent loss: Percentage of firms reporting loss to this type of fraud:
Information theft, loss or attack (27%) • Theft of physical assets or stock (26%) • vendor, supplier or procurement
fraud (25%) • Corruption and bribery (19%) • Management conflict of interest (17%)
Regulatory or compliance breach (16%) • Internal financial fraud or theft (16%)
Increase in exposure: Companies where exposure to fraud has increased: 85%
Biggest drivers of Increased exposure: Most widespread factor leading to greater fraud exposure
and percentage of firms affected: IT complexity (38%)
fraud.kroll.com | 25
americas regIonal analysIs
» Training: Many Latin American companies have little to no awareness regarding the requirements of local (and international) anti-bribery laws. A robust training program should be designed and implemented, and their related activities properly documented. Training should ideally include employees of relevant third parties as well.
While it is too early to predict whether government agencies will aggressively enforce recent anti-corruption laws, companies should certainly expect a higher number of corruption-related prosecutions in Latin America than those observed in the past. Companies that do their homework will be better prepared to prevent incidents, or seek more lenient treatment from the authorities and other stakeholders, should an incident occur.
recaredo romero is Regional Managing Director for Latin America. He manages a wide variety of complex assignments, including major fraud investigations, Foreign Corrupt Practices Act compliance, business intelligence, litigation support, asset recovery and due diligence matters.
Adequate identification of the risks and related exposure is key to tailoring effective procedures and controls.
» Third party due diligence: Companies should look into the details of transactions and their related third parties (e.g., agents, suppliers, joint venture partners) to identify and avoid the risk that third parties could offer bribes on their behalf. The due diligence should provide a good understanding of the third party’s track record, business practices, and reputation. A higher level of due diligence should be conducted on high-risk third parties.
» Due diligence on local investment targets: Investors should undertake in-depth due diligence reviews of the target’s anti-corruption policies and procedures, the target’s culture and leadership stance toward integrity and ethics, and market reputation. A multi-tiered due diligence approach depending on the level of government exposure is recommended.
Mexico Mexico has also seen corruption move to the forefront of public concern. Shortly after becoming President-Elect in late 2012, Enrique Peña Nieto announced a bill to create a National Anti-corruption Commission that would have the powers to investigate both private and public corruption cases at federal, state, and municipal levels.
A few months earlier, the Federal Law against Corruption for Public Procurement (Ley Federal Anticorrupción en Contrataciones Públicas – LFACP) went into effect in June 2012. The LFACP could play an important role in developing the necessary institutional reform to handle President Peña Nieto’s plans to allow private investment in Mexico’s oil and gas sector for the first time since 1960, which could usher in a wave of new foreign direct investment.
Enforcement challenges
Policy experts have identified a significant correlation between corruption and the strength of a nation’s regulatory and enforcement mechanisms. Countries such as Haiti and Venezuela, which have among the lowest international rankings of public governance, correspondingly have the highest rates of perceived corruption. Conversely, Chile, which has the strongest institutional controls according to the 2013 World Bank “Doing Business Report,” also maintains the Latin America’s lowest rate in fraud, bribery, and graft.
As Chile’s success in combating corruption has demonstrated, the challenge for Latin America has less to do with enacting policy and more to do with implementing and enforcing it. Countries that recently implemented reforms, such as Brazil, Colombia, and Mexico, will need to enhance their internal capacities to effectively track complex money trails. Meanwhile, the delicate nature of prosecution cases involving public officials will require substantial determination and political will.
Prevention better than response
Given recent developments throughout the region and increased scrutiny of business in Latin America by regulators such as the US DOJ and SEC, companies should redouble efforts to enhance their anti-corruption compliance programs. The following four recommendations are worth noting:
» Proper risk assessment: Risks vary from country to country, within different industries or by company depending on the level of government interaction.
26 | 2013/2014 Kroll Global Fraud Report
regIonal analysIs americas
Notwithstanding these ambitious growth projections, the region has a critical challenge in infrastructure development, caused by a variety of underlying factors. For example, advances in commodity production that occurred in the 1990s have generated a large gap between production systems and increased demand. This disparity is up against an inefficient logistics flow and deficits in energy production—struggling to meet growing industrial activity. Many Latin American governments are aware of the problem and realize that, without significant
infrastructure development, their nations will fail to meet internal and external growth expectations. Among others, key areas to address include road transportation networks; hydroelectric and thermoelectric power plants; port modernizations; amplification of railway; increased depth, length, and width of navigable waterways; sporting venues; water sanitation and filtration; petrochemical plants; and oil and gas exploration, production, and refining. The following represent a small sample of the countless projects currently being
undertaken in Latin America to help bridge
the infrastructure gap:
» Chile is building a water conveyance
system called Aquatacama;
» Mexico is constructing the Bicentennial
Refinery;
» Brazil plans to build a high-speed rail system;
» Colombia is undertaking a massive
transportation project called Highways for
Prosperity;
» Argentina is constructing the Truncado
transmission power line;
» Uruguay is building the Punta Sayago
Liquefied Natural Gas Plant;
» The Dominican Republic is building a
corridor to Santo Domingo;
» Ecuador is developing the Dodo Sinclair
Hydroelectric plant;
» Panama is developing a major metro line;
» Costa Rica is constructing the Reventazon
Hydroelectric project; and,
» Jamaica is expanding its Kingston port.
latIn amerICa InFrastruCture ProjeCts
By vander giordano
In the last few years, Latin America has seen a significant uptick in the number of large-scale infrastructure projects, although these rates are still below the 4% to 5% investment that the World Bank estimates is necessary to support expectations of growth in the region.
dealing with the risks
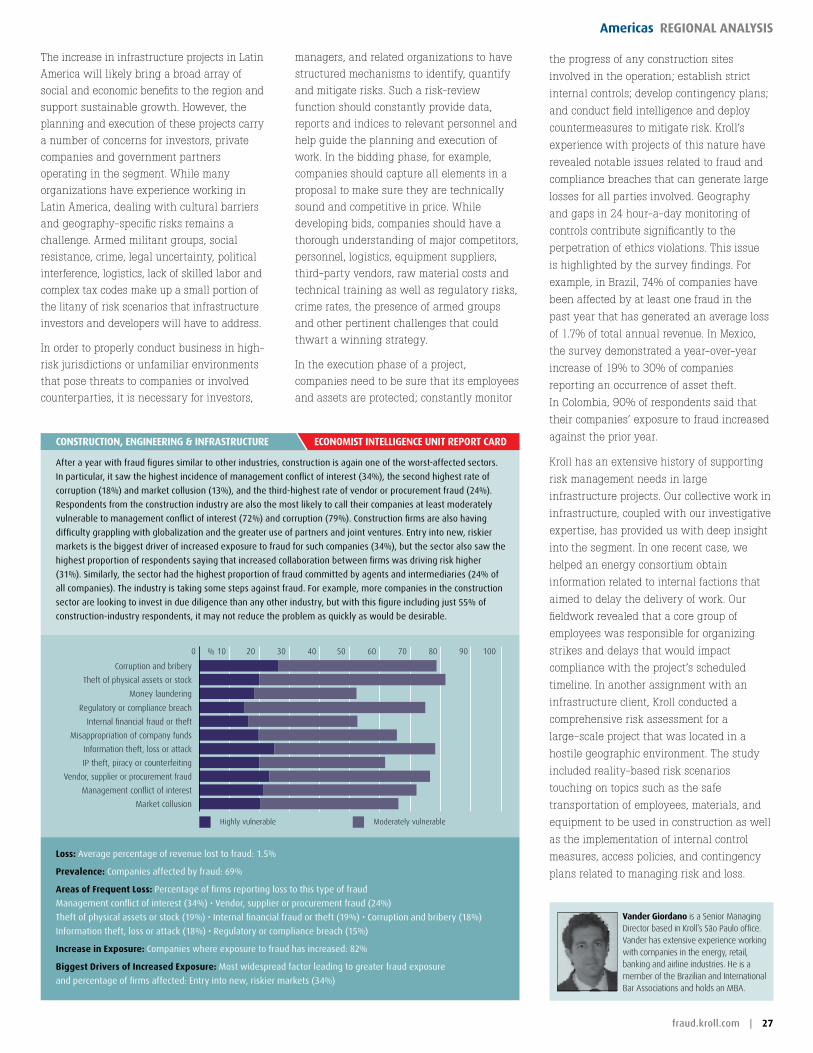
eConomIst IntellIgenCe unIt rePort CardConstruCtIon, engIneerIng & InFrastruCture
After a year with fraud figures similar to other industries, construction is again one of the worst-affected sectors.
In particular, it saw the highest incidence of management conflict of interest (34%), the second highest rate of
corruption (18%) and market collusion (13%), and the third-highest rate of vendor or procurement fraud (24%).
Respondents from the construction industry are also the most likely to call their companies at least moderately
vulnerable to management conflict of interest (72%) and corruption (79%). Construction firms are also having
difficulty grappling with globalization and the greater use of partners and joint ventures. Entry into new, riskier
markets is the biggest driver of increased exposure to fraud for such companies (34%), but the sector also saw the
highest proportion of respondents saying that increased collaboration between firms was driving risk higher
(31%). Similarly, the sector had the highest proportion of fraud committed by agents and intermediaries (24% of
all companies). The industry is taking some steps against fraud. for example, more companies in the construction
sector are looking to invest in due diligence than any other industry, but with this figure including just 55% of
construction-industry respondents, it may not reduce the problem as quickly as would be desirable.
Highly vulnerable Moderately vulnerable
0 10 20 30 40 50 60 70 80 90 100 %
Corruption and bribery
Theft of physical assets or stock
Money laundering
Regulatory or compliance breach
Internal financial fraud or theft
Misappropriation of company funds
Information theft, loss or attack
IP theft, piracy or counterfeiting
Vendor, supplier or procurement fraud
Management conflict of interest
Market collusion
loss: Average percentage of revenue lost to fraud: 1.5%
Prevalence: Companies affected by fraud: 69%
areas of Frequent loss: Percentage of firms reporting loss to this type of fraud
Management conflict of interest (34%) • vendor, supplier or procurement fraud (24%)
Theft of physical assets or stock (19%) • Internal financial fraud or theft (19%) • Corruption and bribery (18%)
Information theft, loss or attack (18%) • Regulatory or compliance breach (15%)
Increase in exposure: Companies where exposure to fraud has increased: 82%
Biggest drivers of Increased exposure: Most widespread factor leading to greater fraud exposure
and percentage of firms affected: Entry into new, riskier markets (34%)
fraud.kroll.com | 27
americas regIonal analysIs
the progress of any construction sites
involved in the operation; establish strict
internal controls; develop contingency plans;
and conduct field intelligence and deploy
countermeasures to mitigate risk. Kroll’s
experience with projects of this nature have
revealed notable issues related to fraud and
compliance breaches that can generate large
losses for all parties involved. Geography
and gaps in 24 hour-a-day monitoring of
controls contribute significantly to the
perpetration of ethics violations. This issue
is highlighted by the survey findings. For
example, in Brazil, 74% of companies have
been affected by at least one fraud in the
past year that has generated an average loss
of 1.7% of total annual revenue. In Mexico,
the survey demonstrated a year-over-year
increase of 19% to 30% of companies
reporting an occurrence of asset theft.
In Colombia, 90% of respondents said that
their companies’ exposure to fraud increased
against the prior year.
Kroll has an extensive history of supporting
risk management needs in large
infrastructure projects. Our collective work in
infrastructure, coupled with our investigative
expertise, has provided us with deep insight
into the segment. In one recent case, we
helped an energy consortium obtain
information related to internal factions that
aimed to delay the delivery of work. Our
fieldwork revealed that a core group of
employees was responsible for organizing
strikes and delays that would impact
compliance with the project’s scheduled
timeline. In another assignment with an
infrastructure client, Kroll conducted a
comprehensive risk assessment for a
large-scale project that was located in a
hostile geographic environment. The study
included reality-based risk scenarios
touching on topics such as the safe
transportation of employees, materials, and
equipment to be used in construction as well
as the implementation of internal control
measures, access policies, and contingency
plans related to managing risk and loss.
vander giordano is a Senior Managing Director based in Kroll’s São Paulo office. Vander has extensive experience working with companies in the energy, retail, banking and airline industries. He is a member of the Brazilian and International Bar Associations and holds an MBA.
managers, and related organizations to have
structured mechanisms to identify, quantify
and mitigate risks. Such a risk-review
function should constantly provide data,
reports and indices to relevant personnel and
help guide the planning and execution of
work. In the bidding phase, for example,
companies should capture all elements in a
proposal to make sure they are technically
sound and competitive in price. While
developing bids, companies should have a
thorough understanding of major competitors,
personnel, logistics, equipment suppliers,
third-party vendors, raw material costs and
technical training as well as regulatory risks,
crime rates, the presence of armed groups
and other pertinent challenges that could
thwart a winning strategy.
In the execution phase of a project,
companies need to be sure that its employees
and assets are protected; constantly monitor
The increase in infrastructure projects in Latin
America will likely bring a broad array of
social and economic benefits to the region and
support sustainable growth. However, the
planning and execution of these projects carry
a number of concerns for investors, private
companies and government partners
operating in the segment. While many
organizations have experience working in
Latin America, dealing with cultural barriers
and geography-specific risks remains a
challenge. Armed militant groups, social
resistance, crime, legal uncertainty, political
interference, logistics, lack of skilled labor and
complex tax codes make up a small portion of
the litany of risk scenarios that infrastructure
investors and developers will have to address.
In order to properly conduct business in high-
risk jurisdictions or unfamiliar environments
that pose threats to companies or involved
counterparties, it is necessary for investors,
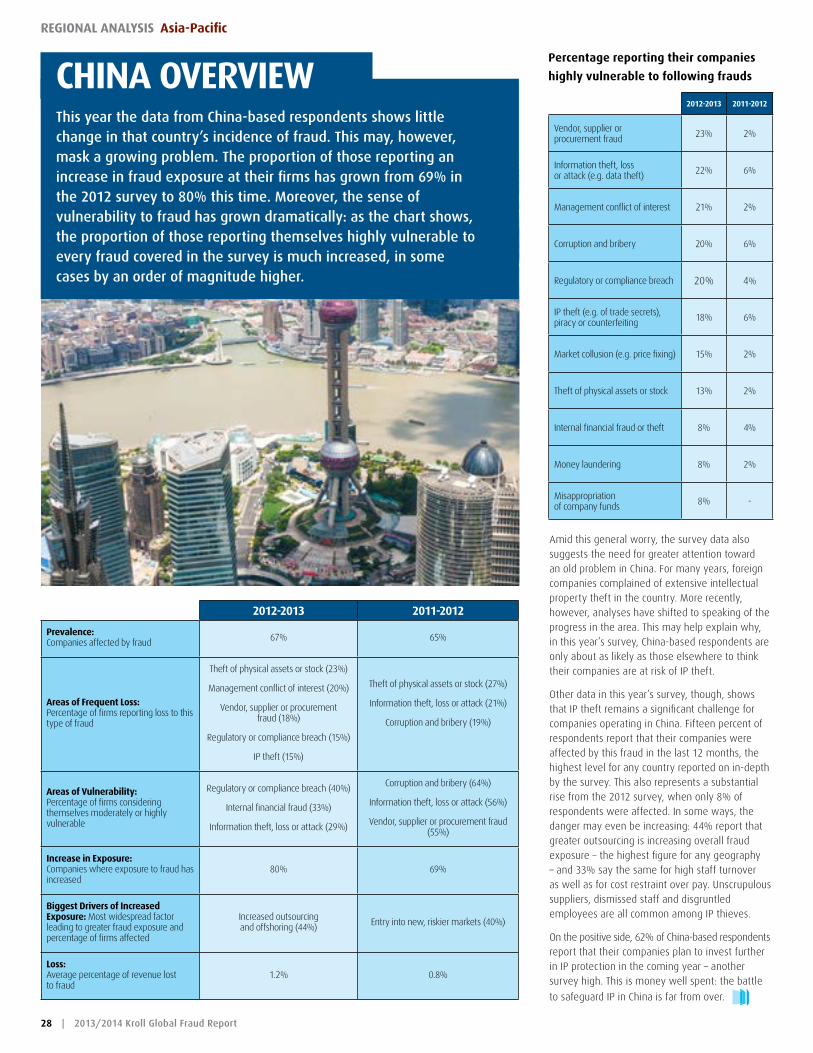
28 | 2013/2014 Kroll Global Fraud Report
regIonal analysIs asia-Pacific
2012-2013 2011-2012
Prevalence: Companies affected by fraud 67% 65%
areas of Frequent loss: Percentage of firms reporting loss to this type of fraud
Theft of physical assets or stock (23%)
Management conflict of interest (20%)
Vendor, supplier or procurement fraud (18%)
Regulatory or compliance breach (15%)
IP theft (15%)
Theft of physical assets or stock (27%)
Information theft, loss or attack (21%)
Corruption and bribery (19%)
areas of vulnerability: Percentage of firms considering themselves moderately or highly vulnerable
Regulatory or compliance breach (40%)
Internal financial fraud (33%)
Information theft, loss or attack (29%)
Corruption and bribery (64%)
Information theft, loss or attack (56%)
Vendor, supplier or procurement fraud (55%)
Increase in exposure: Companies where exposure to fraud has increased
80% 69%
Biggest drivers of Increased exposure: Most widespread factor leading to greater fraud exposure and percentage of firms affected
Increased outsourcing and offshoring (44%) Entry into new, riskier markets (40%)
loss: Average percentage of revenue lost to fraud
1.2% 0.8%
Amid this general worry, the survey data also suggests the need for greater attention toward an old problem in China. For many years, foreign companies complained of extensive intellectual property theft in the country. More recently, however, analyses have shifted to speaking of the progress in the area. This may help explain why, in this year’s survey, China-based respondents are only about as likely as those elsewhere to think their companies are at risk of IP theft.
Other data in this year’s survey, though, shows that IP theft remains a significant challenge for companies operating in China. Fifteen percent of respondents report that their companies were affected by this fraud in the last 12 months, the highest level for any country reported on in-depth by the survey. This also represents a substantial rise from the 2012 survey, when only 8% of respondents were affected. In some ways, the danger may even be increasing: 44% report that greater outsourcing is increasing overall fraud exposure – the highest figure for any geography – and 33% say the same for high staff turnover as well as for cost restraint over pay. Unscrupulous suppliers, dismissed staff and disgruntled employees are all common among IP thieves.
On the positive side, 62% of China-based respondents report that their companies plan to invest further in IP protection in the coming year – another survey high. This is money well spent: the battle
to safeguard IP in China is far from over.
ChIna overvIewThis year the data from China-based respondents shows little change in that country’s incidence of fraud. This may, however, mask a growing problem. The proportion of those reporting an increase in fraud exposure at their firms has grown from 69% in the 2012 survey to 80% this time. Moreover, the sense of vulnerability to fraud has grown dramatically: as the chart shows, the proportion of those reporting themselves highly vulnerable to every fraud covered in the survey is much increased, in some cases by an order of magnitude higher.
2012-2013 2011-2012
Vendor, supplier or procurement fraud 23% 2%
Information theft, loss or attack (e.g. data theft) 22% 6%
Management conflict of interest 21% 2%
Corruption and bribery 20% 6%
Regulatory or compliance breach 20% 4%
IP theft (e.g. of trade secrets), piracy or counterfeiting 18% 6%
Market collusion (e.g. price fixing) 15% 2%
Theft of physical assets or stock 13% 2%
Internal financial fraud or theft 8% 4%
Money laundering 8% 2%
Misappropriation of company funds 8% -
Percentage reporting their companies
highly vulnerable to following frauds
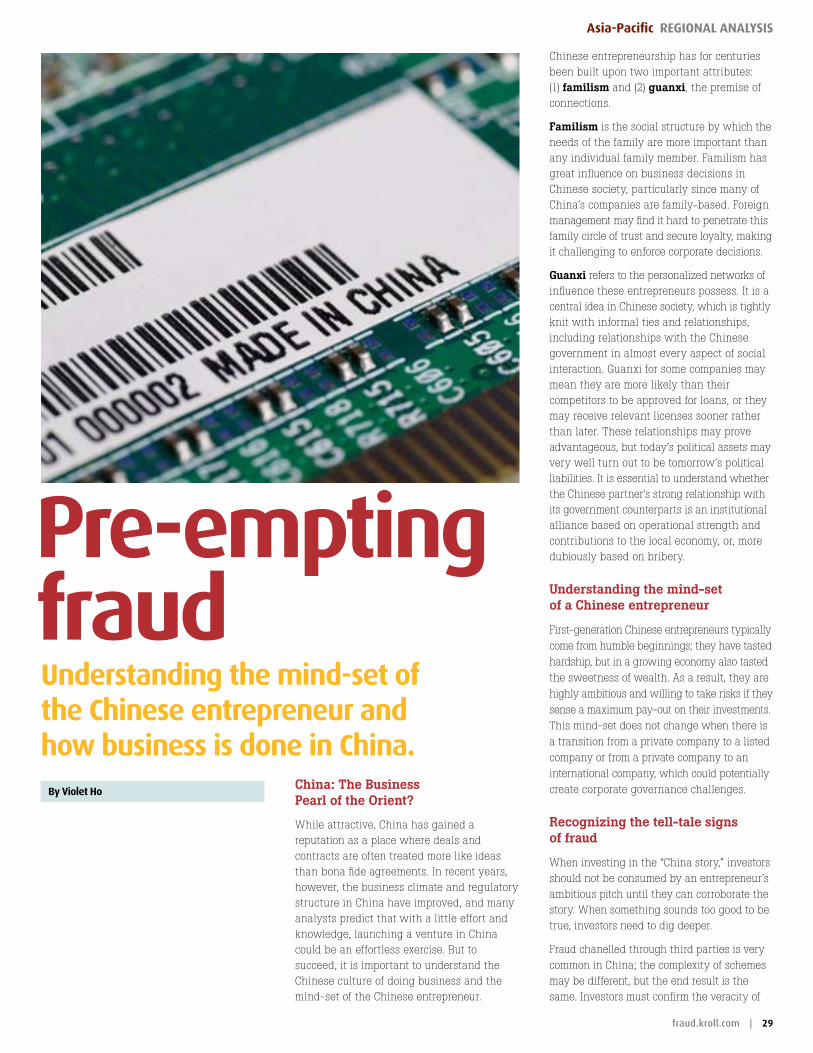
fraud.kroll.com | 29
asia-Pacific regIonal analysIs
China: The Business Pearl of the Orient?
While attractive, China has gained a reputation as a place where deals and contracts are often treated more like ideas than bona fide agreements. In recent years, however, the business climate and regulatory structure in China have improved, and many analysts predict that with a little effort and knowledge, launching a venture in China could be an effortless exercise. But to succeed, it is important to understand the Chinese culture of doing business and the mind-set of the Chinese entrepreneur.
Chinese entrepreneurship has for centuries been built upon two important attributes: (1) familism and (2) guanxi, the premise of connections.
Familism is the social structure by which the needs of the family are more important than any individual family member. Familism has great influence on business decisions in Chinese society, particularly since many of China’s companies are family-based. Foreign management may find it hard to penetrate this family circle of trust and secure loyalty, making it challenging to enforce corporate decisions.
Guanxi refers to the personalized networks of influence these entrepreneurs possess. It is a central idea in Chinese society, which is tightly knit with informal ties and relationships, including relationships with the Chinese government in almost every aspect of social interaction. Guanxi for some companies may mean they are more likely than their competitors to be approved for loans, or they may receive relevant licenses sooner rather than later. These relationships may prove advantageous, but today’s political assets may very well turn out to be tomorrow’s political liabilities. It is essential to understand whether the Chinese partner’s strong relationship with its government counterparts is an institutional alliance based on operational strength and contributions to the local economy, or, more dubiously based on bribery.
Understanding the mind-set of a Chinese entrepreneur
First-generation Chinese entrepreneurs typically come from humble beginnings; they have tasted hardship, but in a growing economy also tasted the sweetness of wealth. As a result, they are highly ambitious and willing to take risks if they sense a maximum pay-out on their investments. This mind-set does not change when there is a transition from a private company to a listed company or from a private company to an international company, which could potentially create corporate governance challenges.
Recognizing the tell-tale signs of fraud
When investing in the “China story,” investors should not be consumed by an entrepreneur’s ambitious pitch until they can corroborate the story. When something sounds too good to be true, investors need to dig deeper.
Fraud chanelled through third parties is very common in China; the complexity of schemes may be different, but the end result is the same. Investors must confirm the veracity of
understanding the mind-set of the Chinese entrepreneur and how business is done in China.
Pre-empting fraud
By violet ho
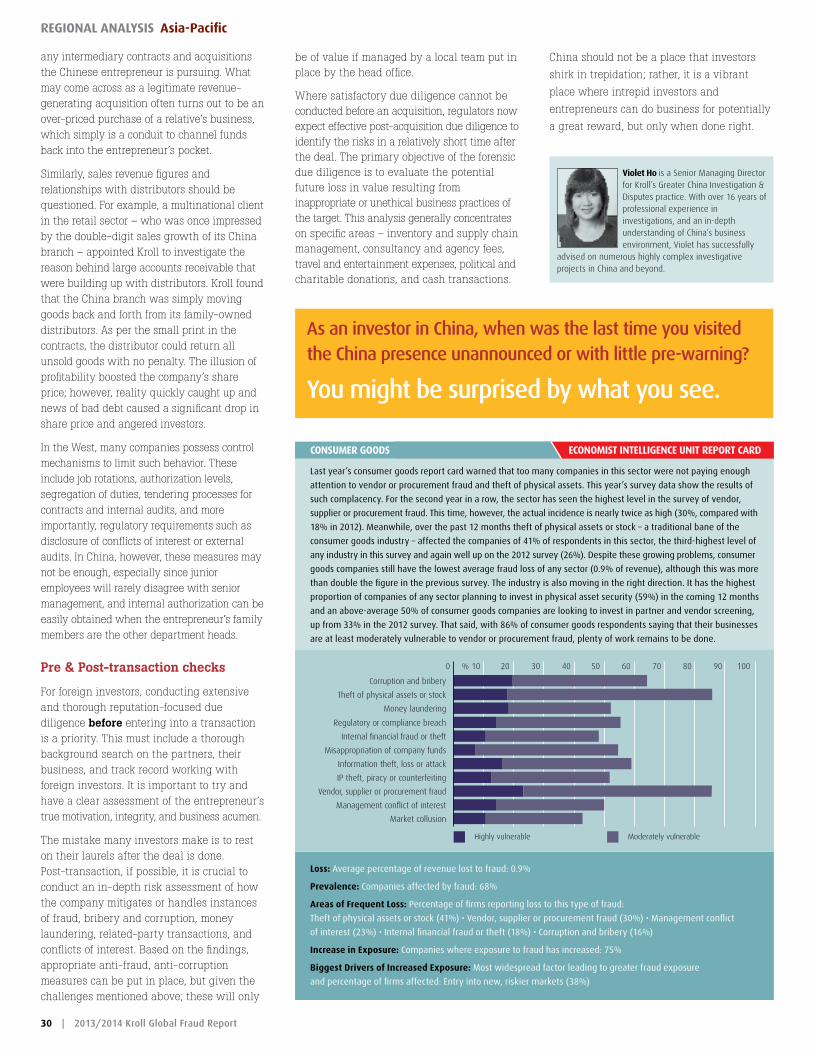
eConomIst IntellIgenCe unIt rePort CardConsumer goods
Last year’s consumer goods report card warned that too many companies in this sector were not paying enough
attention to vendor or procurement fraud and theft of physical assets. This year’s survey data show the results of
such complacency. for the second year in a row, the sector has seen the highest level in the survey of vendor,
supplier or procurement fraud. This time, however, the actual incidence is nearly twice as high (30%, compared with
18% in 2012). Meanwhile, over the past 12 months theft of physical assets or stock – a traditional bane of the
consumer goods industry – affected the companies of 41% of respondents in this sector, the third-highest level of
any industry in this survey and again well up on the 2012 survey (26%). Despite these growing problems, consumer
goods companies still have the lowest average fraud loss of any sector (0.9% of revenue), although this was more
than double the figure in the previous survey. The industry is also moving in the right direction. It has the highest
proportion of companies of any sector planning to invest in physical asset security (59%) in the coming 12 months
and an above-average 50% of consumer goods companies are looking to invest in partner and vendor screening,
up from 33% in the 2012 survey. That said, with 86% of consumer goods respondents saying that their businesses
are at least moderately vulnerable to vendor or procurement fraud, plenty of work remains to be done.
Highly vulnerable Moderately vulnerable
0 10 20 30 40 50 60 70 80 90 100 %
Corruption and bribery
Theft of physical assets or stock
Money laundering
Regulatory or compliance breach
Internal financial fraud or theft
Misappropriation of company funds
Information theft, loss or attack
IP theft, piracy or counterfeiting
Vendor, supplier or procurement fraud
Management conflict of interest
Market collusion
loss: Average percentage of revenue lost to fraud: 0.9%
Prevalence: Companies affected by fraud: 68%
areas of Frequent loss: Percentage of firms reporting loss to this type of fraud:
Theft of physical assets or stock (41%) • vendor, supplier or procurement fraud (30%) • Management conflict
of interest (23%) • Internal financial fraud or theft (18%) • Corruption and bribery (16%)
Increase in exposure: Companies where exposure to fraud has increased: 75%
Biggest drivers of Increased exposure: Most widespread factor leading to greater fraud exposure
and percentage of firms affected: Entry into new, riskier markets (38%)
30 | 2013/2014 Kroll Global Fraud Report
regIonal analysIs asia-Pacific
China should not be a place that investors
shirk in trepidation; rather, it is a vibrant
place where intrepid investors and
entrepreneurs can do business for potentially
a great reward, but only when done right.
violet ho is a Senior Managing Director for Kroll’s Greater China Investigation & Disputes practice. With over 16 years of professional experience in investigations, and an in-depth understanding of China’s business environment, Violet has successfully
advised on numerous highly complex investigative projects in China and beyond.
be of value if managed by a local team put in place by the head office.
Where satisfactory due diligence cannot be conducted before an acquisition, regulators now expect effective post-acquisition due diligence to identify the risks in a relatively short time after the deal. The primary objective of the forensic due diligence is to evaluate the potential future loss in value resulting from inappropriate or unethical business practices of the target. This analysis generally concentrates on specific areas – inventory and supply chain management, consultancy and agency fees, travel and entertainment expenses, political and charitable donations, and cash transactions.
any intermediary contracts and acquisitions the Chinese entrepreneur is pursuing. What may come across as a legitimate revenue-generating acquisition often turns out to be an over-priced purchase of a relative’s business, which simply is a conduit to channel funds back into the entrepreneur’s pocket.
Similarly, sales revenue figures and relationships with distributors should be questioned. For example, a multinational client in the retail sector – who was once impressed by the double-digit sales growth of its China branch – appointed Kroll to investigate the reason behind large accounts receivable that were building up with distributors. Kroll found that the China branch was simply moving goods back and forth from its family-owned distributors. As per the small print in the contracts, the distributor could return all unsold goods with no penalty. The illusion of profitability boosted the company’s share price; however, reality quickly caught up and news of bad debt caused a significant drop in share price and angered investors.
In the West, many companies possess control mechanisms to limit such behavior. These include job rotations, authorization levels, segregation of duties, tendering processes for contracts and internal audits, and more importantly, regulatory requirements such as disclosure of conflicts of interest or external audits. In China, however, these measures may not be enough, especially since junior employees will rarely disagree with senior management, and internal authorization can be easily obtained when the entrepreneur’s family members are the other department heads.
Pre & Post-transaction checks
For foreign investors, conducting extensive and thorough reputation-focused due diligence before entering into a transaction is a priority. This must include a thorough background search on the partners, their business, and track record working with foreign investors. It is important to try and have a clear assessment of the entrepreneur’s true motivation, integrity, and business acumen.
The mistake many investors make is to rest on their laurels after the deal is done. Post-transaction, if possible, it is crucial to conduct an in-depth risk assessment of how the company mitigates or handles instances of fraud, bribery and corruption, money laundering, related-party transactions, and conflicts of interest. Based on the findings, appropriate anti-fraud, anti-corruption measures can be put in place, but given the challenges mentioned above; these will only
As an investor in China, when was the last time you visited the China presence unannounced or with little pre-warning?
You might be surprised by what you see.
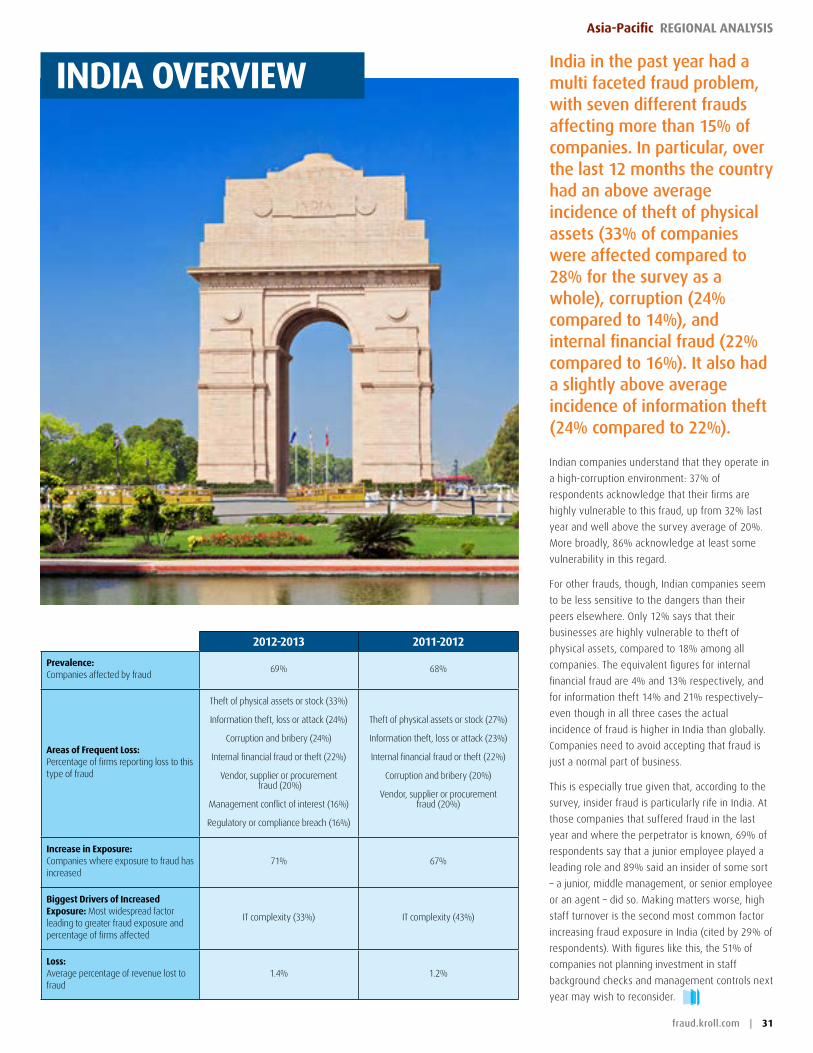
fraud.kroll.com | 31
asia-Pacific regIonal analysIs
India in the past year had a multi faceted fraud problem, with seven different frauds affecting more than 15% of companies. In particular, over the last 12 months the country had an above average incidence of theft of physical assets (33% of companies were affected compared to 28% for the survey as a whole), corruption (24% compared to 14%), and internal financial fraud (22% compared to 16%). It also had a slightly above average incidence of information theft (24% compared to 22%).
Indian companies understand that they operate in
a high-corruption environment: 37% of
respondents acknowledge that their firms are
highly vulnerable to this fraud, up from 32% last
year and well above the survey average of 20%.
More broadly, 86% acknowledge at least some
vulnerability in this regard.
For other frauds, though, Indian companies seem
to be less sensitive to the dangers than their
peers elsewhere. Only 12% says that their
businesses are highly vulnerable to theft of
physical assets, compared to 18% among all
companies. The equivalent figures for internal
financial fraud are 4% and 13% respectively, and
for information theft 14% and 21% respectively–
even though in all three cases the actual
incidence of fraud is higher in India than globally.
Companies need to avoid accepting that fraud is
just a normal part of business.
This is especially true given that, according to the
survey, insider fraud is particularly rife in India. At
those companies that suffered fraud in the last
year and where the perpetrator is known, 69% of
respondents say that a junior employee played a
leading role and 89% said an insider of some sort
– a junior, middle management, or senior employee
or an agent – did so. Making matters worse, high
staff turnover is the second most common factor
increasing fraud exposure in India (cited by 29% of
respondents). With figures like this, the 51% of
companies not planning investment in staff
background checks and management controls next
year may wish to reconsider.
IndIa overvIew
2012-2013 2011-2012
Prevalence: Companies affected by fraud
69% 68%
areas of Frequent loss: Percentage of firms reporting loss to this type of fraud
Theft of physical assets or stock (33%)
Information theft, loss or attack (24%)
Corruption and bribery (24%)
Internal financial fraud or theft (22%)
Vendor, supplier or procurement fraud (20%)
Management conflict of interest (16%)
Regulatory or compliance breach (16%)
Theft of physical assets or stock (27%)
Information theft, loss or attack (23%)
Internal financial fraud or theft (22%)
Corruption and bribery (20%)
Vendor, supplier or procurement fraud (20%)
Increase in exposure: Companies where exposure to fraud has increased
71% 67%
Biggest drivers of Increased exposure: Most widespread factor leading to greater fraud exposure and percentage of firms affected
IT complexity (33%) IT complexity (43%)
loss: Average percentage of revenue lost to fraud
1.4% 1.2%
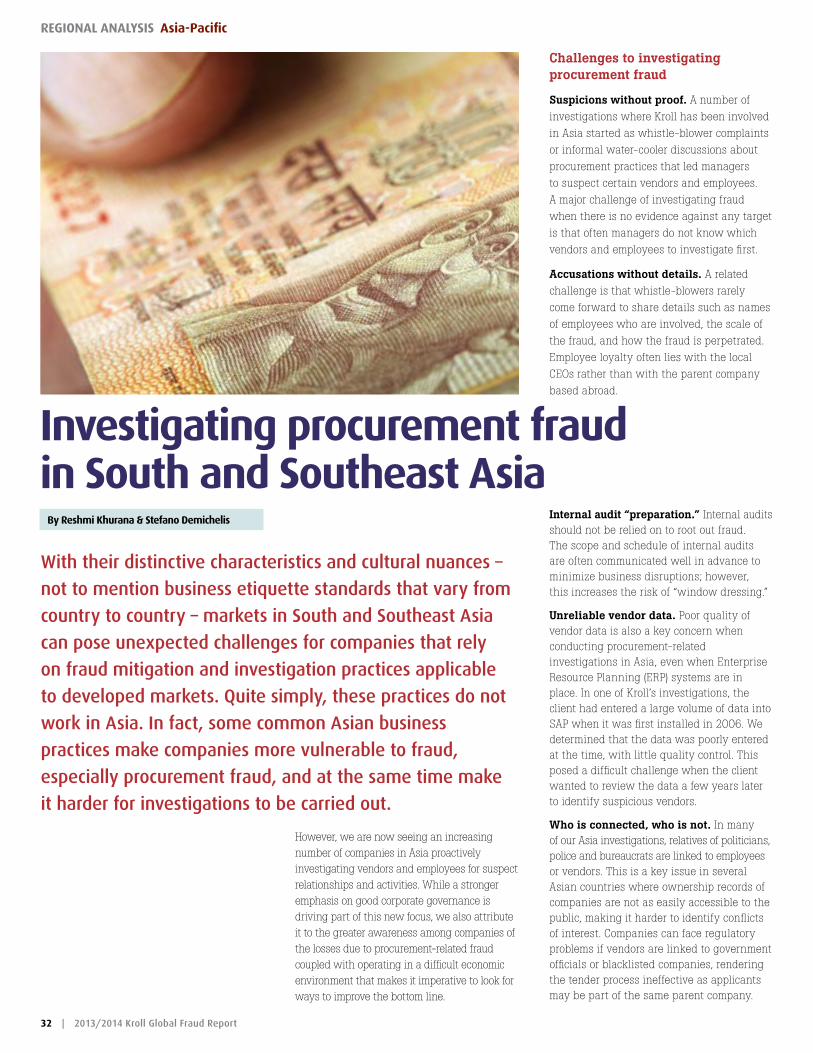
32 | 2013/2014 Kroll Global Fraud Report
regIonal analysIs asia-Pacific
However, we are now seeing an increasing number of companies in Asia proactively investigating vendors and employees for suspect relationships and activities. While a stronger emphasis on good corporate governance is driving part of this new focus, we also attribute it to the greater awareness among companies of the losses due to procurement-related fraud coupled with operating in a difficult economic environment that makes it imperative to look for ways to improve the bottom line.
By reshmi Khurana & stefano demichelis
Challenges to investigating procurement fraud
Suspicions without proof. A number of
investigations where Kroll has been involved
in Asia started as whistle-blower complaints
or informal water-cooler discussions about
procurement practices that led managers
to suspect certain vendors and employees.
A major challenge of investigating fraud
when there is no evidence against any target
is that often managers do not know which
vendors and employees to investigate first.
Accusations without details. A related
challenge is that whistle-blowers rarely
come forward to share details such as names
of employees who are involved, the scale of
the fraud, and how the fraud is perpetrated.
Employee loyalty often lies with the local
CEOs rather than with the parent company
based abroad.
Internal audit “preparation.” Internal audits should not be relied on to root out fraud. The scope and schedule of internal audits are often communicated well in advance to minimize business disruptions; however, this increases the risk of “window dressing.”
Unreliable vendor data. Poor quality of vendor data is also a key concern when conducting procurement-related investigations in Asia, even when Enterprise Resource Planning (ERP) systems are in place. In one of Kroll’s investigations, the client had entered a large volume of data into SAP when it was first installed in 2006. We determined that the data was poorly entered at the time, with little quality control. This posed a difficult challenge when the client wanted to review the data a few years later to identify suspicious vendors.
Who is connected, who is not. In many of our Asia investigations, relatives of politicians, police and bureaucrats are linked to employees or vendors. This is a key issue in several Asian countries where ownership records of companies are not as easily accessible to the public, making it harder to identify conflicts of interest. Companies can face regulatory problems if vendors are linked to government officials or blacklisted companies, rendering the tender process ineffective as applicants may be part of the same parent company.
Investigating procurement fraud in south and southeast asia
With their distinctive characteristics and cultural nuances –
not to mention business etiquette standards that vary from
country to country – markets in South and Southeast Asia
can pose unexpected challenges for companies that rely
on fraud mitigation and investigation practices applicable
to developed markets. Quite simply, these practices do not
work in Asia. In fact, some common Asian business
practices make companies more vulnerable to fraud,
especially procurement fraud, and at the same time make
it harder for investigations to be carried out.
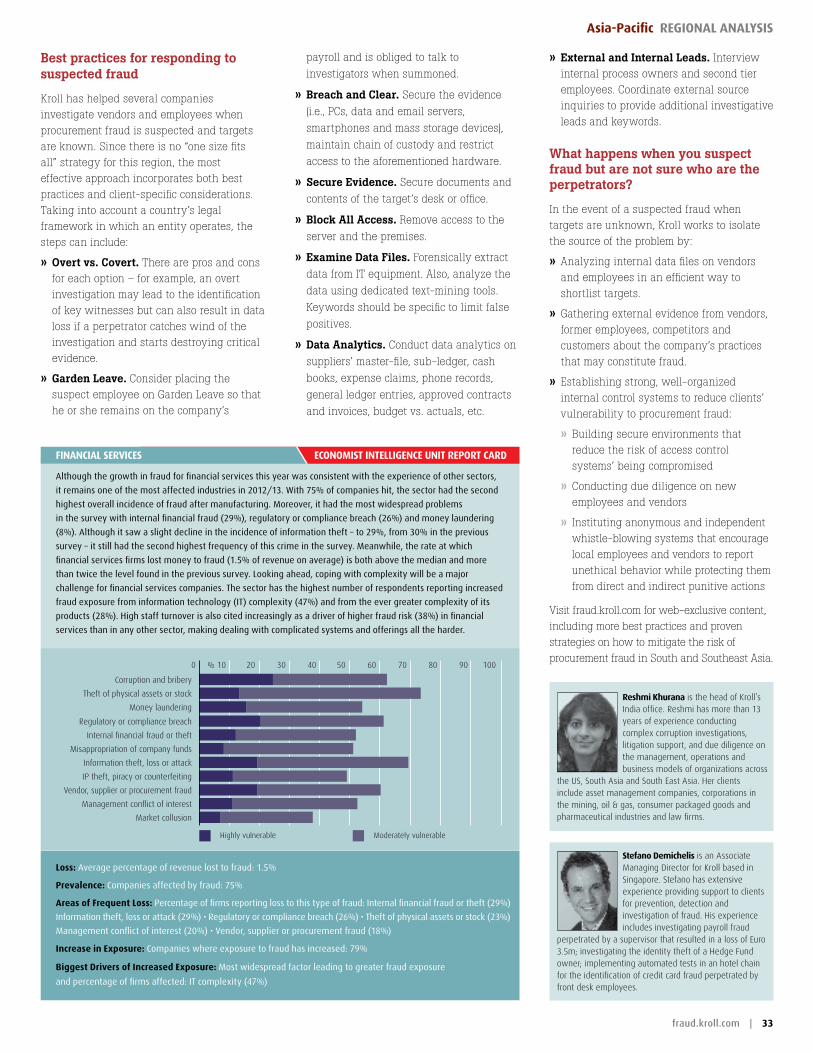
eConomIst IntellIgenCe unIt rePort CardFInanCIal servICes
Although the growth in fraud for financial services this year was consistent with the experience of other sectors,
it remains one of the most affected industries in 2012/13. With 75% of companies hit, the sector had the second
highest overall incidence of fraud after manufacturing. Moreover, it had the most widespread problems
in the survey with internal financial fraud (29%), regulatory or compliance breach (26%) and money laundering
(8%). Although it saw a slight decline in the incidence of information theft – to 29%, from 30% in the previous
survey – it still had the second highest frequency of this crime in the survey. Meanwhile, the rate at which
financial services firms lost money to fraud (1.5% of revenue on average) is both above the median and more
than twice the level found in the previous survey. Looking ahead, coping with complexity will be a major
challenge for financial services companies. The sector has the highest number of respondents reporting increased
fraud exposure from information technology (IT) complexity (47%) and from the ever greater complexity of its
products (28%). high staff turnover is also cited increasingly as a driver of higher fraud risk (38%) in financial
services than in any other sector, making dealing with complicated systems and offerings all the harder.
Highly vulnerable Moderately vulnerable
0 10 20 30 40 50 60 70 80 90 100 %
Corruption and bribery
Theft of physical assets or stock
Money laundering
Regulatory or compliance breach
Internal financial fraud or theft
Misappropriation of company funds
Information theft, loss or attack
IP theft, piracy or counterfeiting
Vendor, supplier or procurement fraud
Management conflict of interest
Market collusion
loss: Average percentage of revenue lost to fraud: 1.5%
Prevalence: Companies affected by fraud: 75%
areas of Frequent loss: Percentage of firms reporting loss to this type of fraud: Internal financial fraud or theft (29%)
Information theft, loss or attack (29%) • Regulatory or compliance breach (26%) • Theft of physical assets or stock (23%)
Management conflict of interest (20%) • vendor, supplier or procurement fraud (18%)
Increase in exposure: Companies where exposure to fraud has increased: 79%
Biggest drivers of Increased exposure: Most widespread factor leading to greater fraud exposure
and percentage of firms affected: IT complexity (47%)
fraud.kroll.com | 33
asia-Pacific regIonal analysIs
payroll and is obliged to talk to
investigators when summoned.
» Breach and Clear. Secure the evidence
(i.e., PCs, data and email servers,
smartphones and mass storage devices),
maintain chain of custody and restrict
access to the aforementioned hardware.
» Secure Evidence. Secure documents and
contents of the target’s desk or office.
» Block All Access. Remove access to the
server and the premises.
» Examine Data Files. Forensically extract
data from IT equipment. Also, analyze the
data using dedicated text-mining tools.
Keywords should be specific to limit false
positives.
» Data Analytics. Conduct data analytics on
suppliers’ master-file, sub-ledger, cash
books, expense claims, phone records,
general ledger entries, approved contracts
and invoices, budget vs. actuals, etc.
» External and Internal Leads. Interview internal process owners and second tier employees. Coordinate external source inquiries to provide additional investigative leads and keywords.
What happens when you suspect fraud but are not sure who are the perpetrators?
In the event of a suspected fraud when targets are unknown, Kroll works to isolate the source of the problem by:
» Analyzing internal data files on vendors and employees in an efficient way to shortlist targets.
» Gathering external evidence from vendors, former employees, competitors and customers about the company’s practices that may constitute fraud.
» Establishing strong, well-organized internal control systems to reduce clients’ vulnerability to procurement fraud:
» Building secure environments that reduce the risk of access control systems’ being compromised
» Conducting due diligence on new employees and vendors
» Instituting anonymous and independent whistle-blowing systems that encourage local employees and vendors to report unethical behavior while protecting them from direct and indirect punitive actions
Visit fraud.kroll.com for web-exclusive content, including more best practices and proven strategies on how to mitigate the risk of procurement fraud in South and Southeast Asia.
reshmi Khurana is the head of Kroll’s India office. Reshmi has more than 13 years of experience conducting complex corruption investigations, litigation support, and due diligence on the management, operations and business models of organizations across
the US, South Asia and South East Asia. Her clients include asset management companies, corporations in the mining, oil & gas, consumer packaged goods and pharmaceutical industries and law firms.
stefano demichelis is an Associate Managing Director for Kroll based in Singapore. Stefano has extensive experience providing support to clients for prevention, detection and investigation of fraud. His experience includes investigating payroll fraud
perpetrated by a supervisor that resulted in a loss of Euro 3.5m; investigating the identity theft of a Hedge Fund owner; implementing automated tests in an hotel chain for the identification of credit card fraud perpetrated by front desk employees.
Best practices for responding to suspected fraud
Kroll has helped several companies investigate vendors and employees when procurement fraud is suspected and targets are known. Since there is no “one size fits all” strategy for this region, the most effective approach incorporates both best practices and client-specific considerations. Taking into account a country’s legal framework in which an entity operates, the steps can include:
» Overt vs. Covert. There are pros and cons for each option – for example, an overt investigation may lead to the identification of key witnesses but can also result in data loss if a perpetrator catches wind of the investigation and starts destroying critical evidence.
» Garden Leave. Consider placing the suspect employee on Garden Leave so that he or she remains on the company’s
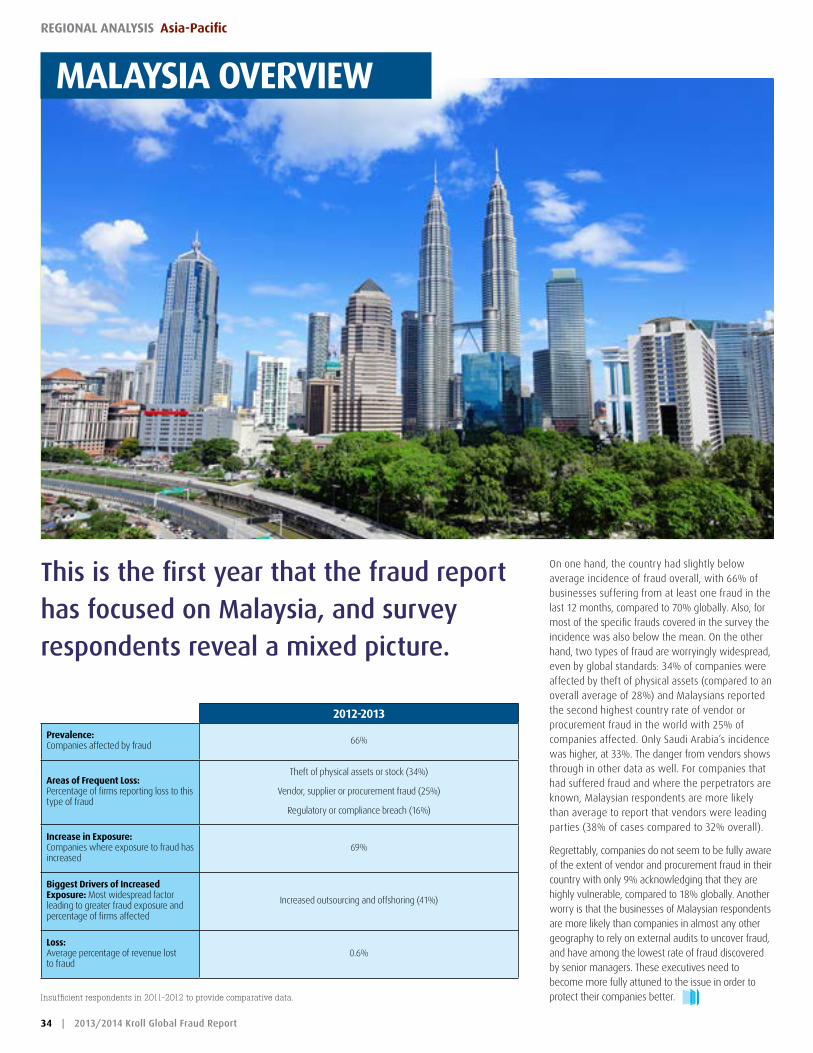
34 | 2013/2014 Kroll Global Fraud Report
regIonal analysIs asia-Pacific
On one hand, the country had slightly below average incidence of fraud overall, with 66% of businesses suffering from at least one fraud in the last 12 months, compared to 70% globally. Also, for most of the specific frauds covered in the survey the incidence was also below the mean. On the other hand, two types of fraud are worryingly widespread, even by global standards: 34% of companies were affected by theft of physical assets (compared to an overall average of 28%) and Malaysians reported the second highest country rate of vendor or procurement fraud in the world with 25% of companies affected. Only Saudi Arabia’s incidence was higher, at 33%. The danger from vendors shows through in other data as well. For companies that had suffered fraud and where the perpetrators are known, Malaysian respondents are more likely than average to report that vendors were leading parties (38% of cases compared to 32% overall).
Regrettably, companies do not seem to be fully aware of the extent of vendor and procurement fraud in their country with only 9% acknowledging that they are highly vulnerable, compared to 18% globally. Another worry is that the businesses of Malaysian respondents are more likely than companies in almost any other geography to rely on external audits to uncover fraud, and have among the lowest rate of fraud discovered by senior managers. These executives need to become more fully attuned to the issue in order to protect their companies better.
malaysIa overvIew
2012-2013
Prevalence: Companies affected by fraud 66%
areas of Frequent loss: Percentage of firms reporting loss to this type of fraud
Theft of physical assets or stock (34%)
Vendor, supplier or procurement fraud (25%)
Regulatory or compliance breach (16%)
Increase in exposure: Companies where exposure to fraud has increased
69%
Biggest drivers of Increased exposure: Most widespread factor leading to greater fraud exposure and percentage of firms affected
Increased outsourcing and offshoring (41%)
loss: Average percentage of revenue lost to fraud
0.6%
This is the first year that the fraud report has focused on Malaysia, and survey respondents reveal a mixed picture.
Insufficient respondents in 2011-2012 to provide comparative data.
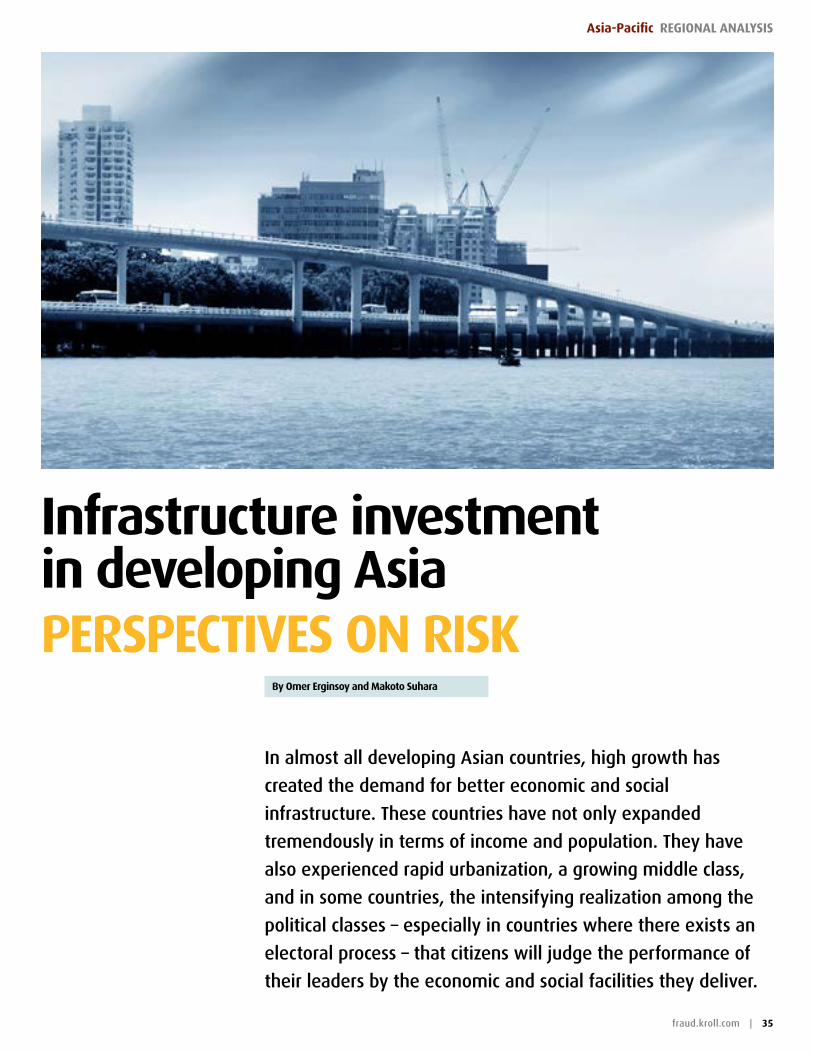
fraud.kroll.com | 35
asia-Pacific regIonal analysIs
In almost all developing Asian countries, high growth has
created the demand for better economic and social
infrastructure. These countries have not only expanded
tremendously in terms of income and population. They have
also experienced rapid urbanization, a growing middle class,
and in some countries, the intensifying realization among the
political classes – especially in countries where there exists an
electoral process – that citizens will judge the performance of
their leaders by the economic and social facilities they deliver.
Infrastructure investment in developing asiaPersPeCtIves on rIsK
By omer erginsoy and makoto suhara
36 | 2013/2014 Kroll Global Fraud Report
regIonal analysIs asia-Pacific
High absolute demand for better
infrastructure in South and Southeast Asia
occurs at a time when experts claim there is
a marked increase in infrastructure
investment globally. Conventional wisdom is
that economic infrastructure assets are
inherently monopolistic and therefore less
sensitive to spells of economic weakness.
This probably holds true more in developed
countries than in developing ones where the
risks of political instability, currency
depreciation and indeed, the expropriation of
an asset could swiftly eradicate the promise
of high returns from a monopoly situation.
Many foreign investors who were forced to
renegotiate contracts or had them canceled
in the aftermath of the 1997 Asian crisis
would appropriately remind us of this fact.
But there are enduring signs of change since
that time: there is greater political stability in
most Asian countries, currencies are flexible
and the public-private partnership model has
made wholesale seizure of assets in the
infrastructure sector less likely. There are
also other factors driving infrastructure
investment in Asia:
» Despite inconsistencies in execution,
improvements in the business and
regulatory environment are reducing
barriers to entry. Legislative reforms
passed or slated in Indonesia (e.g.,
amendments to the law on public-private
partnerships and land acquisition),
Thailand, Philippines and even Myanmar,
have coupled with relatively favorable
concessions offered to foreign investors by
governments looking to attract
infrastructure investment.
» The hunger for natural resources;
exploration, development, production,
transportation and distribution of
resources requires good infrastructure.
This has been one of the drivers of
Chinese infrastructure investment in
Southeast Asia (and elsewhere).
» Overcapacity on the part of Japanese and
Malaysian companies has forced them to
look for new investment opportunities in
“near-abroad” markets. These countries,
alongside China, have deeper domestic
capital markets and therefore able to fund
infrastructure investments led by their
blue-chip companies. Telecommunication
investments in India and recently in
Myanmar have also benefited from a similar
driver (in these cases, Russian and Middle
Eastern petrodollars funded the investments).
» Long-term, open-end infrastructure investment funds have given global investors a new way to bet on emerging markets growth. Allocations are increasing annually. This is not “hot money” that flees the moment that US monetary policy changes. Investors are aware that their capital will be tied up for a long time. Moreover, with the development of regional financial and offshore centers such as Hong Kong and Singapore, funds are finding innovative ways to reduce the impact of foreign exchange risk and to some extent, sovereign risk.
These factors have brought private financing into countries historically unable to fund infrastructure projects.
Risk Mitigation Strategies
There are also negative factors underlying the prospects for infrastructure investment in developing Asia. Based on our conversations with clients, the recent slowdown in China and India, Asia’s two largest growth markets, is not top of their list of concerns – investing in a country’s infrastructure involves betting on long-term growth and the continued demand for services in these countries.
Investors are more concerned about stalled reforms in India and bureaucratic delays in approving projects (Mumbai’s Sea Link famously took 20 years to be approved). Lack of transparency in Indonesia, the prevalence of corruption in Philippines and populist changes to policy all present serious challenges. A political and regulatory risk assessment should be conducted at the outset of infrastructure projects to understand and mitigate these risks. Taking a macro view on probable political scenarios is not enough. It is critical to understand the relative positions of all stakeholders, covering policymakers at the central government level, administrators at the provincial level (or even at the sub-provincial level), local residents, organized labor, and environmental NGOs as well as undisclosed stakeholders such as local businesses with hidden agendas who can alter the outcome of a project.
For example, in 2012, spurred by legislative reform, a Japanese-led consortium won the bid to build a new power plant in Central Java that would provide electricity for 8 million people. However, this year certain landowners refused to sell a portion of land accounting for 20% of the planned construction site. If the dispute is not resolved in time, the consortium faces losing the concession. An in-depth market entry assessment conducted at the outset of the investment cycle may have identified this risk.
It is also important to conduct benchmarking of competitors at the tender stage. This exercise will not only inform a more effective bid, but could also mitigate the risk of competitors seeking annulment of a concession after the tender is closed.
In the construction phase of the investment cycle, supply chain issues always surface. This is not just a matter of performance risk. Fraudulent collusion between suppliers and local managers (or managers of JV partners) can give rise to large financial losses and cause delays in the project, heightening completion risk. If bribery and corruption issues emerge, the project can be embroiled in debilitating controversy and serious legal problems, locally and internationally. Over and above the initial due diligence of subcontractors and partners, Kroll is frequently asked to conduct regular fraud reviews to mitigate the risk of corruption and theft as well as contract audits to reduce the risk of overpaying. Such assignments require the deployment of investigators with experience working in the locality supported by forensic accountants and data analytics experts.
Companies in the infrastructure sector are accustomed to assessing market conditions before making massive upfront investments. They may have a history of studiously considering political and regulatory risk before stepping into an environment of multiple competing interests, where pricing policies or tax regimes can suddenly change at any point in the long investment cycle. All these risks can be managed, especially against the backdrop of favorable politico-economic trends. But infrastructure is ultimately an investment in an operating business, and the realities of operating in South and Southeast Asian countries may present risks with which many companies are unfamiliar.
omer erginsoy is a Senior Managing Director for Kroll based in Singapore. Omer has extensive experience in conducting corporate and regulatory investigations and in providing dispute advisory and litigation support services to clients. His areas of expertise include
emerging markets, special situation investments, complex multi-jurisdictional commercial disputes and hostile takeovers. He also has a long track record of advising high net worth individuals on reputational and regulatory issues and in leading confidential reputation audit assignments for emerging market business owners.
makoto suhara is a Managing Director based in Tokyo, specializing in business intelligence, fraud investigation, corporate governance and risk consulting services for multi national corporations and government agencies. Makoto has helped clients respond and
mitigate risks in the areas of financial fraud, legal dispute, regulatory and compliance, and computer security.
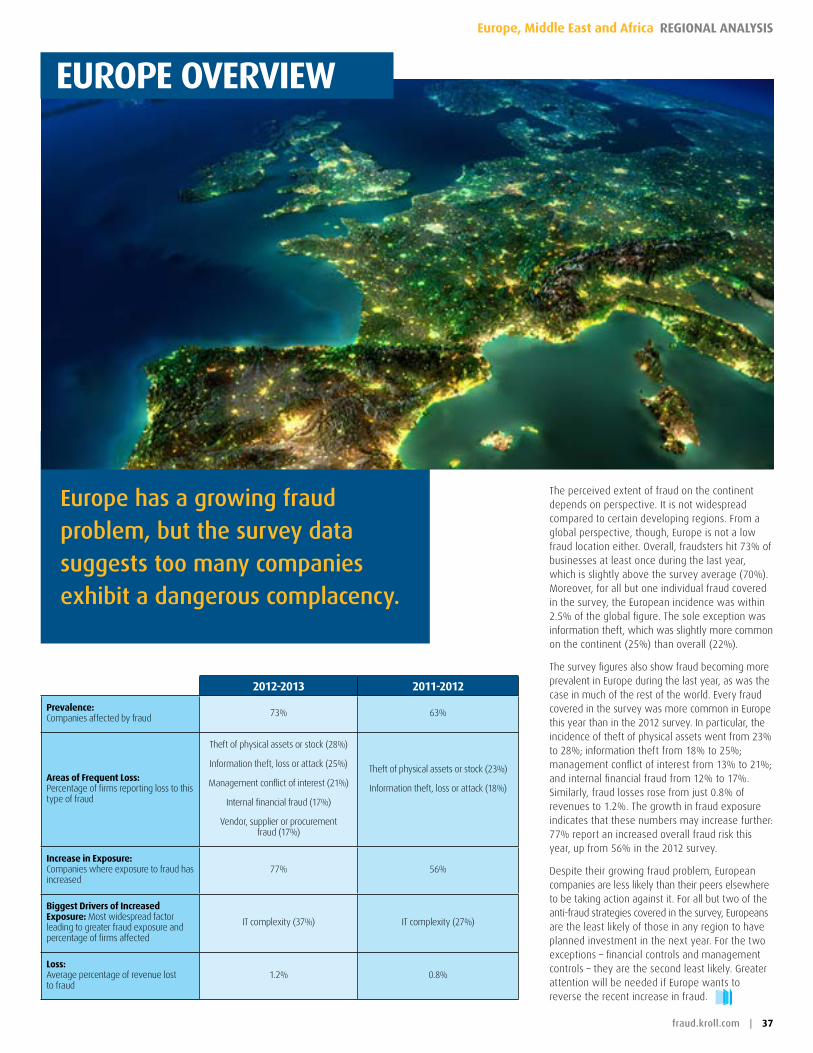
fraud.kroll.com | 37
Europe, Middle East and Africa REgionAl AnAlysis
The perceived extent of fraud on the continent depends on perspective. It is not widespread compared to certain developing regions. From a global perspective, though, Europe is not a low fraud location either. Overall, fraudsters hit 73% of businesses at least once during the last year, which is slightly above the survey average (70%). Moreover, for all but one individual fraud covered in the survey, the European incidence was within 2.5% of the global figure. The sole exception was information theft, which was slightly more common on the continent (25%) than overall (22%).
The survey figures also show fraud becoming more prevalent in Europe during the last year, as was the case in much of the rest of the world. Every fraud covered in the survey was more common in Europe this year than in the 2012 survey. In particular, the incidence of theft of physical assets went from 23% to 28%; information theft from 18% to 25%; management conflict of interest from 13% to 21%; and internal financial fraud from 12% to 17%. Similarly, fraud losses rose from just 0.8% of revenues to 1.2%. The growth in fraud exposure indicates that these numbers may increase further: 77% report an increased overall fraud risk this year, up from 56% in the 2012 survey.
Despite their growing fraud problem, European companies are less likely than their peers elsewhere to be taking action against it. For all but two of the anti-fraud strategies covered in the survey, Europeans are the least likely of those in any region to have planned investment in the next year. For the two exceptions – financial controls and management controls – they are the second least likely. Greater attention will be needed if Europe wants to reverse the recent increase in fraud.
euroPe overvIew
2012-2013 2011-2012
Prevalence: Companies affected by fraud 73% 63%
areas of Frequent loss: Percentage of firms reporting loss to this type of fraud
Theft of physical assets or stock (28%)
Information theft, loss or attack (25%)
Management conflict of interest (21%)
Internal financial fraud (17%)
Vendor, supplier or procurement fraud (17%)
Theft of physical assets or stock (23%)
Information theft, loss or attack (18%)
Increase in exposure: Companies where exposure to fraud has increased
77% 56%
Biggest drivers of Increased exposure: Most widespread factor leading to greater fraud exposure and percentage of firms affected
IT complexity (37%) IT complexity (27%)
loss: Average percentage of revenue lost to fraud
1.2% 0.8%
Europe has a growing fraud problem, but the survey data suggests too many companies exhibit a dangerous complacency.
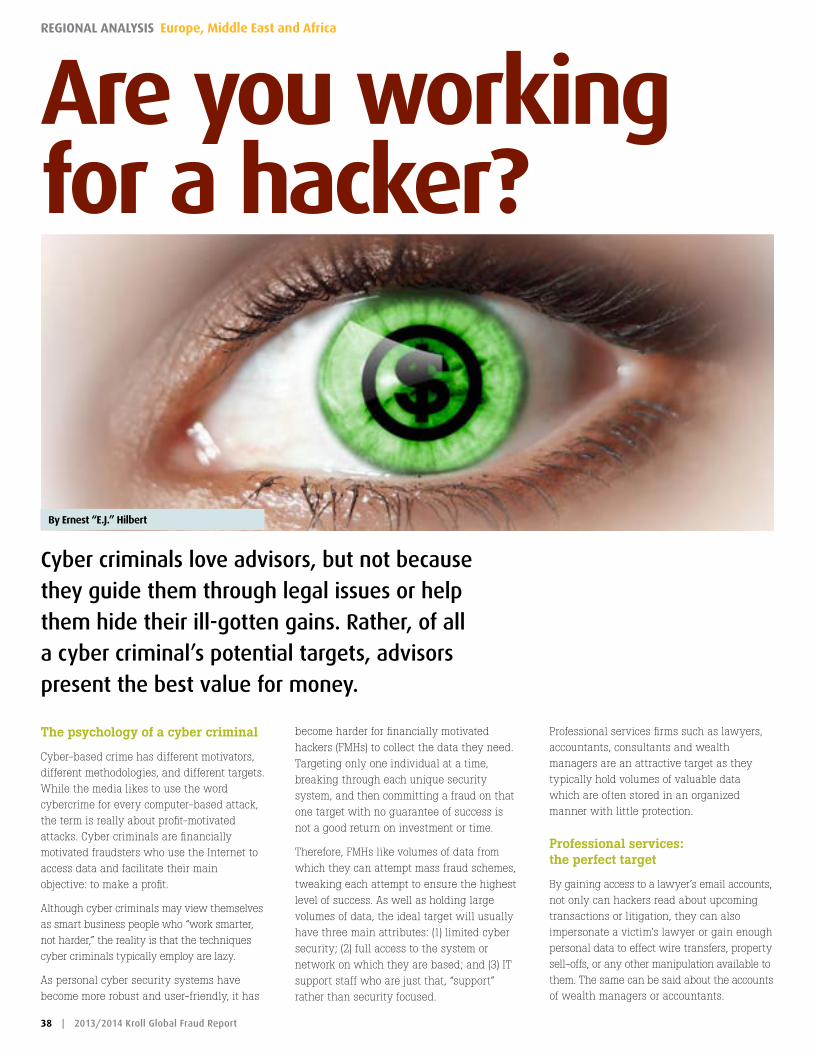
38 | 2013/2014 Kroll Global Fraud Report
Regional analysis europe, Middle east and africa
Cyber criminals love advisors, but not because they guide them through legal issues or help them hide their ill-gotten gains. Rather, of all a cyber criminal’s potential targets, advisors present the best value for money.
are you working for a hacker?
By ernest “e.j.” hilbert
The psychology of a cyber criminal
Cyber-based crime has different motivators, different methodologies, and different targets. While the media likes to use the word cybercrime for every computer-based attack, the term is really about profit-motivated attacks. Cyber criminals are financially motivated fraudsters who use the Internet to access data and facilitate their main objective: to make a profit.
Although cyber criminals may view themselves as smart business people who “work smarter, not harder,” the reality is that the techniques cyber criminals typically employ are lazy.
As personal cyber security systems have become more robust and user-friendly, it has
become harder for financially motivated
hackers (FMHs) to collect the data they need.
Targeting only one individual at a time,
breaking through each unique security
system, and then committing a fraud on that
one target with no guarantee of success is
not a good return on investment or time.
Therefore, FMHs like volumes of data from
which they can attempt mass fraud schemes,
tweaking each attempt to ensure the highest
level of success. As well as holding large
volumes of data, the ideal target will usually
have three main attributes: (1) limited cyber
security; (2) full access to the system or
network on which they are based; and (3) IT
support staff who are just that, “support”
rather than security focused.
Professional services firms such as lawyers, accountants, consultants and wealth managers are an attractive target as they typically hold volumes of valuable data which are often stored in an organized manner with little protection.
Professional services: the perfect target
By gaining access to a lawyer’s email accounts, not only can hackers read about upcoming transactions or litigation, they can also impersonate a victim’s lawyer or gain enough personal data to effect wire transfers, property sell-offs, or any other manipulation available to them. The same can be said about the accounts of wealth managers or accountants.
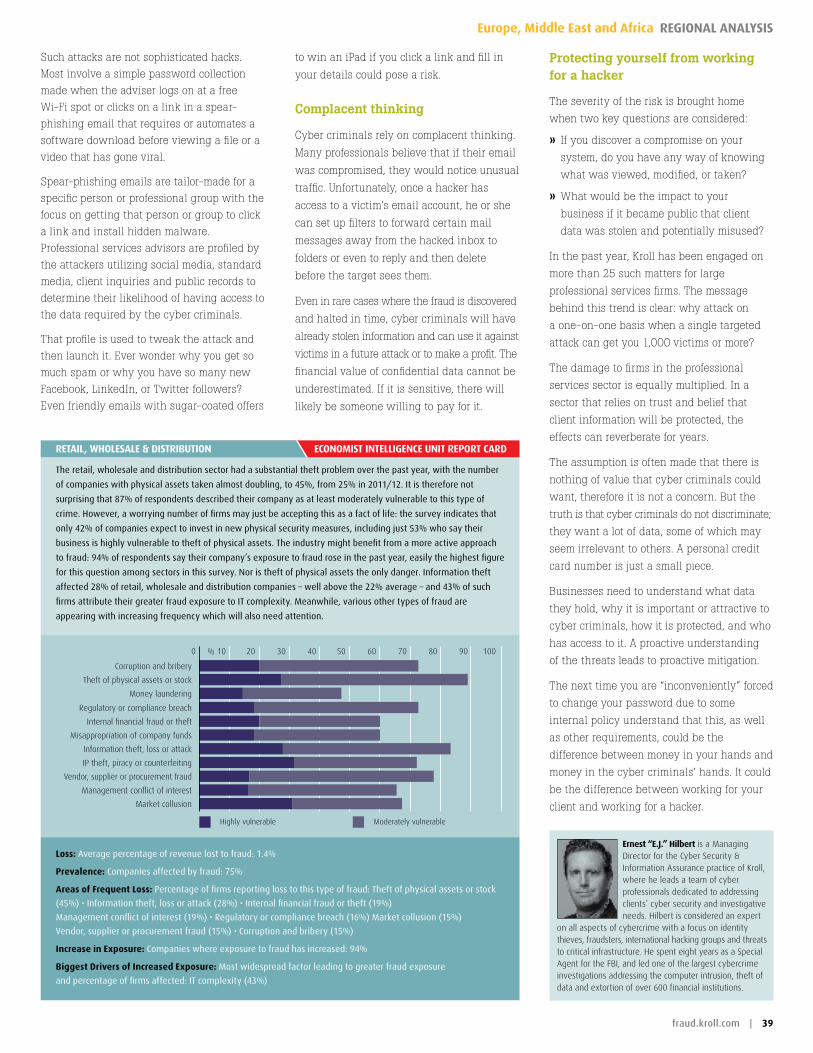
eConomIst IntellIgenCe unIt rePort CardretaIl, wholesale & dIstrIButIon
The retail, wholesale and distribution sector had a substantial theft problem over the past year, with the number
of companies with physical assets taken almost doubling, to 45%, from 25% in 2011/12. It is therefore not
surprising that 87% of respondents described their company as at least moderately vulnerable to this type of
crime. however, a worrying number of firms may just be accepting this as a fact of life: the survey indicates that
only 42% of companies expect to invest in new physical security measures, including just 53% who say their
business is highly vulnerable to theft of physical assets. The industry might benefit from a more active approach
to fraud: 94% of respondents say their company’s exposure to fraud rose in the past year, easily the highest figure
for this question among sectors in this survey. Nor is theft of physical assets the only danger. Information theft
affected 28% of retail, wholesale and distribution companies – well above the 22% average – and 43% of such
firms attribute their greater fraud exposure to IT complexity. Meanwhile, various other types of fraud are
appearing with increasing frequency which will also need attention.
Highly vulnerable Moderately vulnerable
0 10 20 30 40 50 60 70 80 90 100 %
Corruption and bribery
Theft of physical assets or stock
Money laundering
Regulatory or compliance breach
Internal financial fraud or theft
Misappropriation of company funds
Information theft, loss or attack
IP theft, piracy or counterfeiting
Vendor, supplier or procurement fraud
Management conflict of interest
Market collusion
loss: Average percentage of revenue lost to fraud: 1.4%
Prevalence: Companies affected by fraud: 75%
areas of Frequent loss: Percentage of firms reporting loss to this type of fraud: Theft of physical assets or stock
(45%) • Information theft, loss or attack (28%) • Internal financial fraud or theft (19%)
Management conflict of interest (19%) • Regulatory or compliance breach (16%) Market collusion (15%)
vendor, supplier or procurement fraud (15%) • Corruption and bribery (15%)
Increase in exposure: Companies where exposure to fraud has increased: 94%
Biggest drivers of Increased exposure: Most widespread factor leading to greater fraud exposure
and percentage of firms affected: IT complexity (43%)
fraud.kroll.com | 39
Europe, Middle East and Africa REgionAl AnAlysis
Protecting yourself from working for a hacker
The severity of the risk is brought home
when two key questions are considered:
» If you discover a compromise on your
system, do you have any way of knowing
what was viewed, modified, or taken?
» What would be the impact to your
business if it became public that client
data was stolen and potentially misused?
In the past year, Kroll has been engaged on
more than 25 such matters for large
professional services firms. The message
behind this trend is clear: why attack on
a one-on-one basis when a single targeted
attack can get you 1,000 victims or more?
The damage to firms in the professional
services sector is equally multiplied. In a
sector that relies on trust and belief that
client information will be protected, the
effects can reverberate for years.
The assumption is often made that there is
nothing of value that cyber criminals could
want, therefore it is not a concern. But the
truth is that cyber criminals do not discriminate;
they want a lot of data, some of which may
seem irrelevant to others. A personal credit
card number is just a small piece.
Businesses need to understand what data
they hold, why it is important or attractive to
cyber criminals, how it is protected, and who
has access to it. A proactive understanding
of the threats leads to proactive mitigation.
The next time you are “inconveniently” forced
to change your password due to some
internal policy understand that this, as well
as other requirements, could be the
difference between money in your hands and
money in the cyber criminals’ hands. It could
be the difference between working for your
client and working for a hacker.
ernest “e.j.” hilbert is a Managing Director for the Cyber Security & Information Assurance practice of Kroll, where he leads a team of cyber professionals dedicated to addressing clients’ cyber security and investigative needs. Hilbert is considered an expert
on all aspects of cybercrime with a focus on identity thieves, fraudsters, international hacking groups and threats to critical infrastructure. He spent eight years as a Special Agent for the FBI, and led one of the largest cybercrime investigations addressing the computer intrusion, theft of data and extortion of over 600 financial institutions.
to win an iPad if you click a link and fill in
your details could pose a risk.
Complacent thinking
Cyber criminals rely on complacent thinking.
Many professionals believe that if their email
was compromised, they would notice unusual
traffic. Unfortunately, once a hacker has
access to a victim’s email account, he or she
can set up filters to forward certain mail
messages away from the hacked inbox to
folders or even to reply and then delete
before the target sees them.
Even in rare cases where the fraud is discovered
and halted in time, cyber criminals will have
already stolen information and can use it against
victims in a future attack or to make a profit. The
financial value of confidential data cannot be
underestimated. If it is sensitive, there will
likely be someone willing to pay for it.
Such attacks are not sophisticated hacks.
Most involve a simple password collection
made when the adviser logs on at a free
Wi-Fi spot or clicks on a link in a spear-
phishing email that requires or automates a
software download before viewing a file or a
video that has gone viral.
Spear-phishing emails are tailor-made for a
specific person or professional group with the
focus on getting that person or group to click
a link and install hidden malware.
Professional services advisors are profiled by
the attackers utilizing social media, standard
media, client inquiries and public records to
determine their likelihood of having access to
the data required by the cyber criminals.
That profile is used to tweak the attack and
then launch it. Ever wonder why you get so
much spam or why you have so many new
Facebook, LinkedIn, or Twitter followers?
Even friendly emails with sugar-coated offers
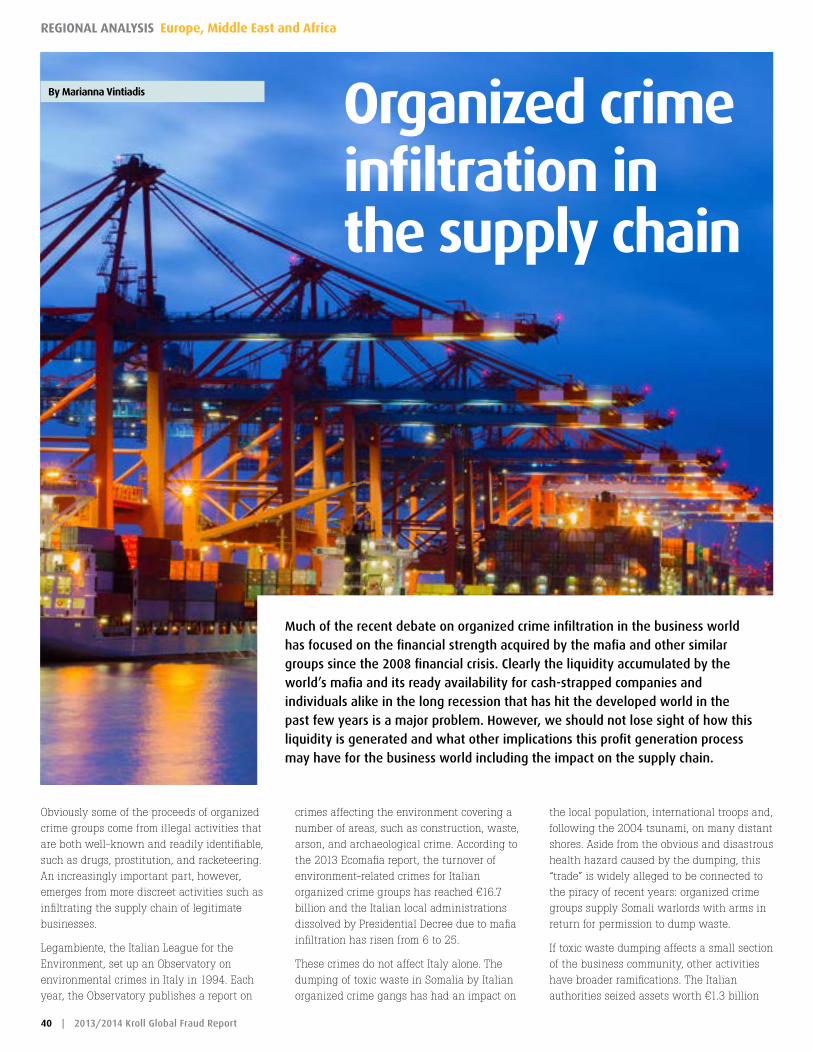
40 | 2013/2014 Kroll Global Fraud Report
Regional analysis europe, Middle east and africa
organized crime infiltration in the supply chain
By marianna vintiadis
Obviously some of the proceeds of organized crime groups come from illegal activities that are both well-known and readily identifiable, such as drugs, prostitution, and racketeering. An increasingly important part, however, emerges from more discreet activities such as infiltrating the supply chain of legitimate businesses.
Legambiente, the Italian League for the Environment, set up an Observatory on environmental crimes in Italy in 1994. Each year, the Observatory publishes a report on
crimes affecting the environment covering a number of areas, such as construction, waste, arson, and archaeological crime. According to the 2013 Ecomafia report, the turnover of environment-related crimes for Italian organized crime groups has reached €16.7 billion and the Italian local administrations dissolved by Presidential Decree due to mafia infiltration has risen from 6 to 25.
These crimes do not affect Italy alone. The dumping of toxic waste in Somalia by Italian organized crime gangs has had an impact on
the local population, international troops and, following the 2004 tsunami, on many distant shores. Aside from the obvious and disastrous health hazard caused by the dumping, this “trade” is widely alleged to be connected to the piracy of recent years: organized crime groups supply Somali warlords with arms in return for permission to dump waste.
If toxic waste dumping affects a small section of the business community, other activities have broader ramifications. The Italian authorities seized assets worth €1.3 billion
Much of the recent debate on organized crime infiltration in the business world has focused on the financial strength acquired by the mafia and other similar groups since the 2008 financial crisis. Clearly the liquidity accumulated by the world’s mafia and its ready availability for cash-strapped companies and individuals alike in the long recession that has hit the developed world in the past few years is a major problem. However, we should not lose sight of how this liquidity is generated and what other implications this profit generation process may have for the business world including the impact on the supply chain.
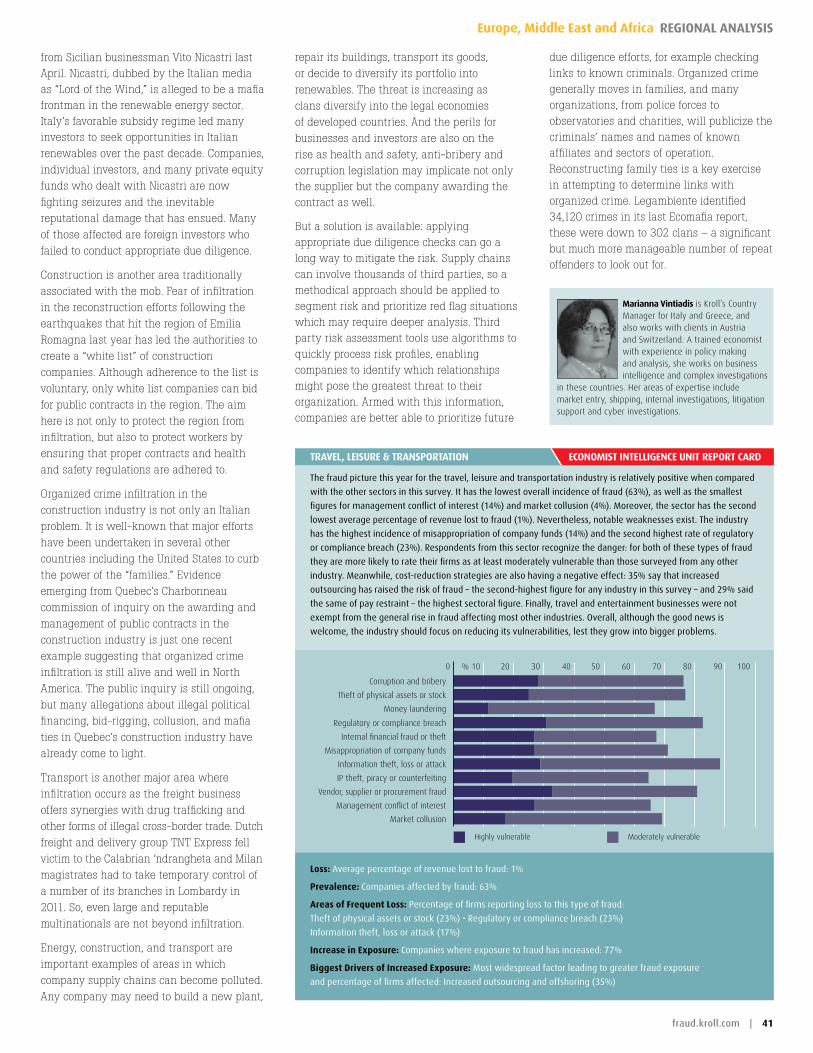
eConomIst IntellIgenCe unIt rePort Cardtravel, leIsure & transPortatIon
The fraud picture this year for the travel, leisure and transportation industry is relatively positive when compared
with the other sectors in this survey. It has the lowest overall incidence of fraud (63%), as well as the smallest
figures for management conflict of interest (14%) and market collusion (4%). Moreover, the sector has the second
lowest average percentage of revenue lost to fraud (1%). Nevertheless, notable weaknesses exist. The industry
has the highest incidence of misappropriation of company funds (14%) and the second highest rate of regulatory
or compliance breach (23%). Respondents from this sector recognize the danger: for both of these types of fraud
they are more likely to rate their firms as at least moderately vulnerable than those surveyed from any other
industry. Meanwhile, cost-reduction strategies are also having a negative effect: 35% say that increased
outsourcing has raised the risk of fraud – the second-highest figure for any industry in this survey – and 29% said
the same of pay restraint – the highest sectoral figure. finally, travel and entertainment businesses were not
exempt from the general rise in fraud affecting most other industries. Overall, although the good news is
welcome, the industry should focus on reducing its vulnerabilities, lest they grow into bigger problems.
Highly vulnerable Moderately vulnerable
0 10 20 30 40 50 60 70 80 90 100 %
Corruption and bribery
Theft of physical assets or stock
Money laundering
Regulatory or compliance breach
Internal financial fraud or theft
Misappropriation of company funds
Information theft, loss or attack
IP theft, piracy or counterfeiting
Vendor, supplier or procurement fraud
Management conflict of interest
Market collusion
loss: Average percentage of revenue lost to fraud: 1%
Prevalence: Companies affected by fraud: 63%
areas of Frequent loss: Percentage of firms reporting loss to this type of fraud:
Theft of physical assets or stock (23%) • Regulatory or compliance breach (23%)
Information theft, loss or attack (17%)
Increase in exposure: Companies where exposure to fraud has increased: 77%
Biggest drivers of Increased exposure: Most widespread factor leading to greater fraud exposure
and percentage of firms affected: Increased outsourcing and offshoring (35%)
fraud.kroll.com | 41
Europe, Middle East and Africa REgionAl AnAlysis
due diligence efforts, for example checking links to known criminals. Organized crime generally moves in families, and many organizations, from police forces to observatories and charities, will publicize the criminals’ names and names of known affiliates and sectors of operation. Reconstructing family ties is a key exercise in attempting to determine links with organized crime. Legambiente identified 34,120 crimes in its last Ecomafia report, these were down to 302 clans – a significant but much more manageable number of repeat offenders to look out for.
marianna vintiadis is Kroll’s Country Manager for Italy and Greece, and also works with clients in Austria and Switzerland. A trained economist with experience in policy making and analysis, she works on business intelligence and complex investigations
in these countries. Her areas of expertise include market entry, shipping, internal investigations, litigation support and cyber investigations.
repair its buildings, transport its goods,
or decide to diversify its portfolio into
renewables. The threat is increasing as
clans diversify into the legal economies
of developed countries. And the perils for
businesses and investors are also on the
rise as health and safety, anti-bribery and corruption legislation may implicate not only the supplier but the company awarding the contract as well.
But a solution is available: applying appropriate due diligence checks can go a long way to mitigate the risk. Supply chains can involve thousands of third parties, so a methodical approach should be applied to segment risk and prioritize red flag situations which may require deeper analysis. Third party risk assessment tools use algorithms to quickly process risk profiles, enabling companies to identify which relationships might pose the greatest threat to their organization. Armed with this information, companies are better able to prioritize future
from Sicilian businessman Vito Nicastri last April. Nicastri, dubbed by the Italian media as “Lord of the Wind,” is alleged to be a mafia frontman in the renewable energy sector. Italy’s favorable subsidy regime led many investors to seek opportunities in Italian
renewables over the past decade. Companies,
individual investors, and many private equity
funds who dealt with Nicastri are now
fighting seizures and the inevitable
reputational damage that has ensued. Many
of those affected are foreign investors who
failed to conduct appropriate due diligence.
Construction is another area traditionally
associated with the mob. Fear of infiltration
in the reconstruction efforts following the
earthquakes that hit the region of Emilia
Romagna last year has led the authorities to
create a “white list” of construction
companies. Although adherence to the list is
voluntary, only white list companies can bid
for public contracts in the region. The aim
here is not only to protect the region from
infiltration, but also to protect workers by
ensuring that proper contracts and health
and safety regulations are adhered to.
Organized crime infiltration in the
construction industry is not only an Italian
problem. It is well-known that major efforts
have been undertaken in several other
countries including the United States to curb
the power of the “families.” Evidence
emerging from Quebec’s Charbonneau
commission of inquiry on the awarding and
management of public contracts in the
construction industry is just one recent
example suggesting that organized crime
infiltration is still alive and well in North
America. The public inquiry is still ongoing,
but many allegations about illegal political
financing, bid-rigging, collusion, and mafia
ties in Quebec’s construction industry have
already come to light.
Transport is another major area where
infiltration occurs as the freight business
offers synergies with drug trafficking and
other forms of illegal cross-border trade. Dutch
freight and delivery group TNT Express fell
victim to the Calabrian ‘ndrangheta and Milan
magistrates had to take temporary control of
a number of its branches in Lombardy in
2011. So, even large and reputable
multinationals are not beyond infiltration.
Energy, construction, and transport are
important examples of areas in which
company supply chains can become polluted.
Any company may need to build a new plant,
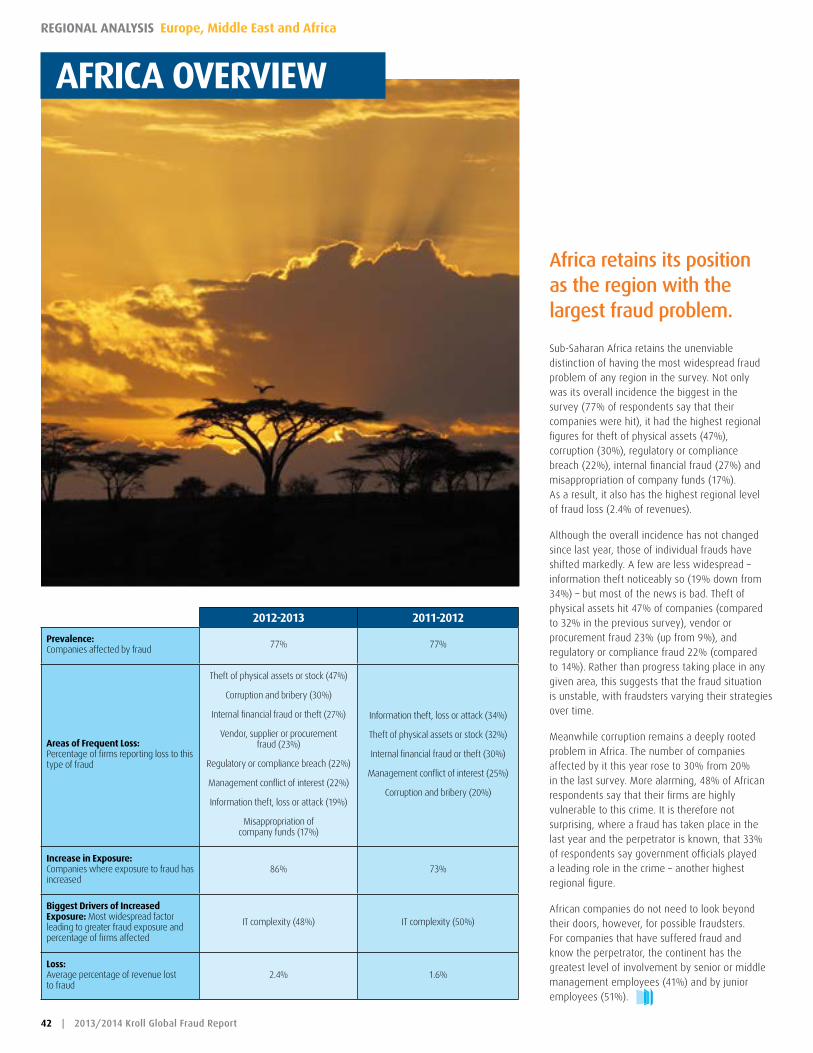
42 | 2013/2014 Kroll Global Fraud Report
Regional analysis europe, Middle east and africa
Africa retains its position as the region with the largest fraud problem.
Sub-Saharan Africa retains the unenviable distinction of having the most widespread fraud problem of any region in the survey. Not only was its overall incidence the biggest in the survey (77% of respondents say that their companies were hit), it had the highest regional figures for theft of physical assets (47%), corruption (30%), regulatory or compliance breach (22%), internal financial fraud (27%) and misappropriation of company funds (17%). As a result, it also has the highest regional level of fraud loss (2.4% of revenues).
Although the overall incidence has not changed since last year, those of individual frauds have shifted markedly. A few are less widespread – information theft noticeably so (19% down from 34%) – but most of the news is bad. Theft of physical assets hit 47% of companies (compared to 32% in the previous survey), vendor or procurement fraud 23% (up from 9%), and regulatory or compliance fraud 22% (compared to 14%). Rather than progress taking place in any given area, this suggests that the fraud situation is unstable, with fraudsters varying their strategies over time.
Meanwhile corruption remains a deeply rooted problem in Africa. The number of companies affected by it this year rose to 30% from 20% in the last survey. More alarming, 48% of African respondents say that their firms are highly vulnerable to this crime. It is therefore not surprising, where a fraud has taken place in the last year and the perpetrator is known, that 33% of respondents say government officials played a leading role in the crime – another highest regional figure.
African companies do not need to look beyond their doors, however, for possible fraudsters. For companies that have suffered fraud and know the perpetrator, the continent has the greatest level of involvement by senior or middle management employees (41%) and by junior employees (51%).
aFrICa overvIew
2012-2013 2011-2012
Prevalence: Companies affected by fraud 77% 77%
areas of Frequent loss: Percentage of firms reporting loss to this type of fraud
Theft of physical assets or stock (47%)
Corruption and bribery (30%)
Internal financial fraud or theft (27%)
Vendor, supplier or procurement fraud (23%)
Regulatory or compliance breach (22%)
Management conflict of interest (22%)
Information theft, loss or attack (19%)
Misappropriation of company funds (17%)
Information theft, loss or attack (34%)
Theft of physical assets or stock (32%)
Internal financial fraud or theft (30%)
Management conflict of interest (25%)
Corruption and bribery (20%)
Increase in exposure: Companies where exposure to fraud has increased
86% 73%
Biggest drivers of Increased exposure: Most widespread factor leading to greater fraud exposure and percentage of firms affected
IT complexity (48%) IT complexity (50%)
loss: Average percentage of revenue lost to fraud
2.4% 1.6%

fraud.kroll.com | 43
Europe, Middle East and Africa REgionAl AnAlysis
Economic performance over the past decade has outstripped any previous period, and current forecasts are that the regional African market will grow at about 5.5% this year. Armed conflict is significantly reduced, providing the stability required for economic growth and development. Many state-owned enterprises have been privatized, and legal and regulatory systems are being strengthened. Inflation is being brought under control, and foreign debt and budget deficits are being reduced. Across the continent, African economies have opened up to international trade.
But while in recent years the African investment narrative has been dominated by success in the natural resources and telecoms sectors, today it is the infrastructure sector – which has been estimated to require investments by non-government entities of US$100 billion each year until 2020 – that is most likely to rouse interest and generate returns.
Current infrastructure provision varies among all African countries, but all (except South Africa) fall short of the global average. The deficits are far from uniform, however. In Nigeria, for example, Internet usage is at 90% of global average, while Mozambique is
at a mere 12%, a disparity partly explained by the different levels of access to undersea fibre optic cables on the east/west coasts. In contrast, Gabon has a comparatively high per capita spending on health compared to Nigeria, and indeed to China and India, explained partly by its high oil revenues and small population.
By far the greatest infrastructure challenge facing Africa is reliable power provision. Only 16% of the sub-Saharan African population has access to electricity (compared to 50% in Asia and 80% in Latin America). Moreover, some 30 African countries face regular power shortages, forcing many to pay high premiums for emergency power. In some countries, this is becoming a political issue. It was a recurring theme in the 2011 elections in Nigeria, and for many Nigerians it will be an issue as they consider whether to re-elect President Goodluck Jonathan in 2015.
Perhaps the second biggest infrastructure challenge is inadequate transport links. Defunct or poorly maintained rail networks put an added burden on roads, which are frequently starved of investment, in poor condition, and organized more in accordance
Investment in african infrastructurean oPPortunIty For the PrIvate seCtor
By alexander Booth
As the bleak outlook for domestic growth drives many Western companies to consider expanding overseas into unfamiliar markets, sub-Saharan Africa is an increasingly attractive prospect.
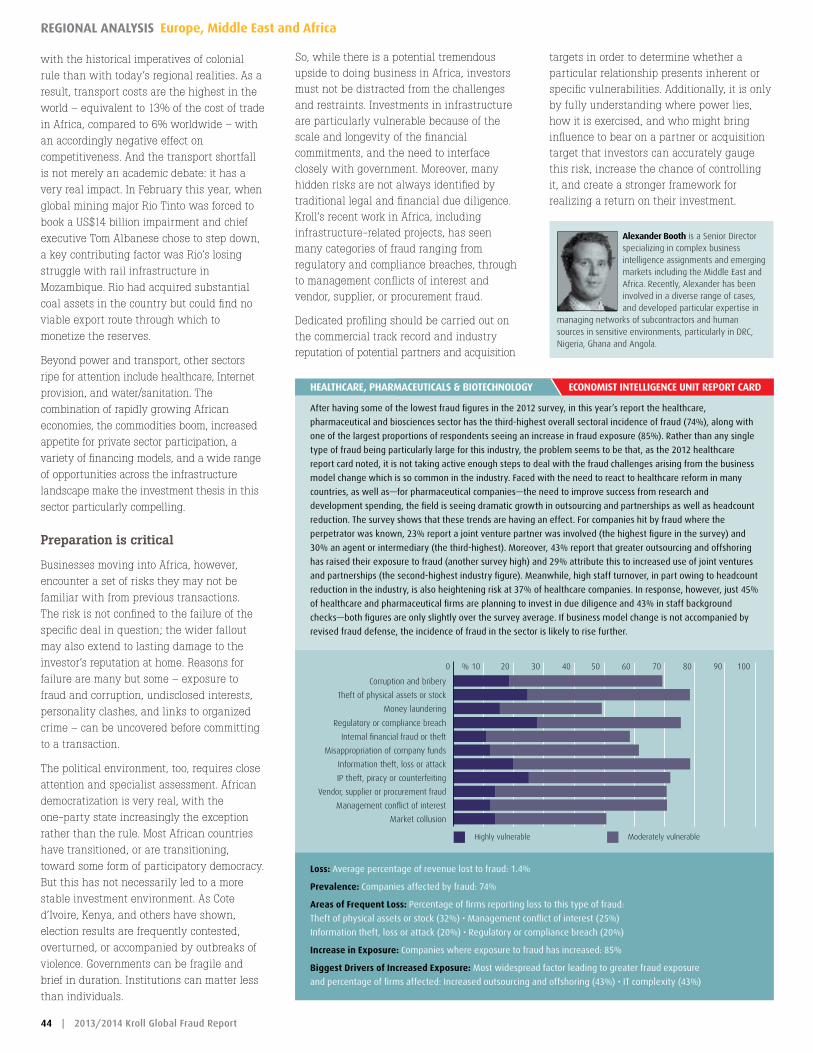
44 | 2013/2014 Kroll Global Fraud Report
Regional analysis europe, Middle east and africa
eConomIst IntellIgenCe unIt rePort CardhealthCare, PharmaCeutICals & BIoteChnology
Highly vulnerable Moderately vulnerable
0 10 20 30 40 50 60 70 80 90 100 %
Corruption and bribery
Theft of physical assets or stock
Money laundering
Regulatory or compliance breach
Internal financial fraud or theft
Misappropriation of company funds
Information theft, loss or attack
IP theft, piracy or counterfeiting
Vendor, supplier or procurement fraud
Management conflict of interest
Market collusion
loss: Average percentage of revenue lost to fraud: 1.4%
Prevalence: Companies affected by fraud: 74%
areas of Frequent loss: Percentage of firms reporting loss to this type of fraud:
Theft of physical assets or stock (32%) • Management conflict of interest (25%)
Information theft, loss or attack (20%) • Regulatory or compliance breach (20%)
Increase in exposure: Companies where exposure to fraud has increased: 85%
Biggest drivers of Increased exposure: Most widespread factor leading to greater fraud exposure
and percentage of firms affected: Increased outsourcing and offshoring (43%) • IT complexity (43%)
After having some of the lowest fraud figures in the 2012 survey, in this year’s report the healthcare,
pharmaceutical and biosciences sector has the third-highest overall sectoral incidence of fraud (74%), along with
one of the largest proportions of respondents seeing an increase in fraud exposure (85%). Rather than any single
type of fraud being particularly large for this industry, the problem seems to be that, as the 2012 healthcare
report card noted, it is not taking active enough steps to deal with the fraud challenges arising from the business
model change which is so common in the industry. faced with the need to react to healthcare reform in many
countries, as well as—for pharmaceutical companies—the need to improve success from research and
development spending, the field is seeing dramatic growth in outsourcing and partnerships as well as headcount
reduction. The survey shows that these trends are having an effect. for companies hit by fraud where the
perpetrator was known, 23% report a joint venture partner was involved (the highest figure in the survey) and
30% an agent or intermediary (the third-highest). Moreover, 43% report that greater outsourcing and offshoring
has raised their exposure to fraud (another survey high) and 29% attribute this to increased use of joint ventures
and partnerships (the second-highest industry figure). Meanwhile, high staff turnover, in part owing to headcount
reduction in the industry, is also heightening risk at 37% of healthcare companies. In response, however, just 45%
of healthcare and pharmaceutical firms are planning to invest in due diligence and 43% in staff background
checks—both figures are only slightly over the survey average. If business model change is not accompanied by
revised fraud defense, the incidence of fraud in the sector is likely to rise further.
targets in order to determine whether a particular relationship presents inherent or specific vulnerabilities. Additionally, it is only by fully understanding where power lies, how it is exercised, and who might bring influence to bear on a partner or acquisition target that investors can accurately gauge this risk, increase the chance of controlling it, and create a stronger framework for realizing a return on their investment.
alexander Booth is a Senior Director specializing in complex business intelligence assignments and emerging markets including the Middle East and Africa. Recently, Alexander has been involved in a diverse range of cases, and developed particular expertise in
managing networks of subcontractors and human sources in sensitive environments, particularly in DRC, Nigeria, Ghana and Angola.
with the historical imperatives of colonial
rule than with today’s regional realities. As a
result, transport costs are the highest in the
world – equivalent to 13% of the cost of trade
in Africa, compared to 6% worldwide – with
an accordingly negative effect on
competitiveness. And the transport shortfall
is not merely an academic debate: it has a
very real impact. In February this year, when
global mining major Rio Tinto was forced to
book a US$14 billion impairment and chief
executive Tom Albanese chose to step down,
a key contributing factor was Rio’s losing
struggle with rail infrastructure in
Mozambique. Rio had acquired substantial
coal assets in the country but could find no
viable export route through which to
monetize the reserves.
Beyond power and transport, other sectors
ripe for attention include healthcare, Internet
provision, and water/sanitation. The
combination of rapidly growing African
economies, the commodities boom, increased
appetite for private sector participation, a
variety of financing models, and a wide range
of opportunities across the infrastructure
landscape make the investment thesis in this
sector particularly compelling.
Preparation is critical
Businesses moving into Africa, however,
encounter a set of risks they may not be
familiar with from previous transactions.
The risk is not confined to the failure of the
specific deal in question; the wider fallout
may also extend to lasting damage to the
investor’s reputation at home. Reasons for
failure are many but some – exposure to
fraud and corruption, undisclosed interests,
personality clashes, and links to organized
crime – can be uncovered before committing
to a transaction.
The political environment, too, requires close
attention and specialist assessment. African
democratization is very real, with the
one-party state increasingly the exception
rather than the rule. Most African countries
have transitioned, or are transitioning,
toward some form of participatory democracy.
But this has not necessarily led to a more
stable investment environment. As Cote
d’Ivoire, Kenya, and others have shown,
election results are frequently contested,
overturned, or accompanied by outbreaks of
violence. Governments can be fragile and
brief in duration. Institutions can matter less
than individuals.
So, while there is a potential tremendous upside to doing business in Africa, investors must not be distracted from the challenges and restraints. Investments in infrastructure are particularly vulnerable because of the scale and longevity of the financial commitments, and the need to interface closely with government. Moreover, many hidden risks are not always identified by traditional legal and financial due diligence. Kroll’s recent work in Africa, including infrastructure-related projects, has seen many categories of fraud ranging from regulatory and compliance breaches, through to management conflicts of interest and vendor, supplier, or procurement fraud.
Dedicated profiling should be carried out on the commercial track record and industry reputation of potential partners and acquisition
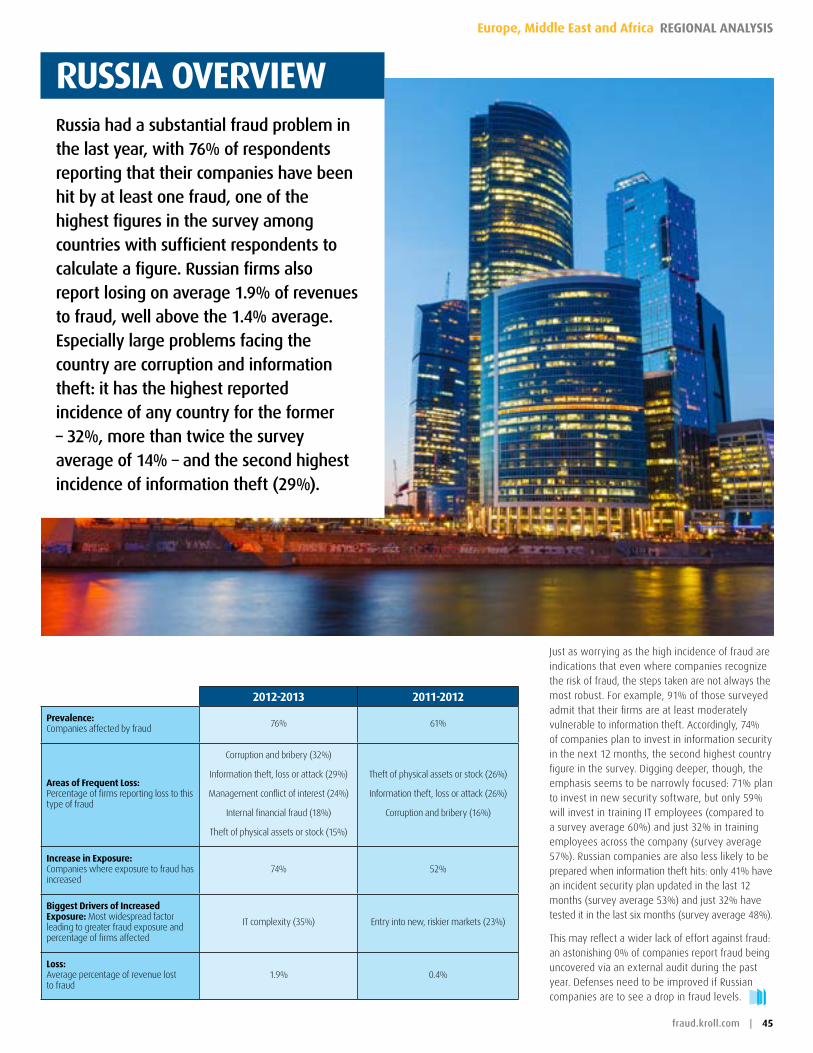
fraud.kroll.com | 45
Europe, Middle East and Africa REgionAl AnAlysis
Just as worrying as the high incidence of fraud are indications that even where companies recognize the risk of fraud, the steps taken are not always the most robust. For example, 91% of those surveyed admit that their firms are at least moderately vulnerable to information theft. Accordingly, 74% of companies plan to invest in information security in the next 12 months, the second highest country figure in the survey. Digging deeper, though, the emphasis seems to be narrowly focused: 71% plan to invest in new security software, but only 59% will invest in training IT employees (compared to a survey average 60%) and just 32% in training employees across the company (survey average 57%). Russian companies are also less likely to be prepared when information theft hits: only 41% have an incident security plan updated in the last 12 months (survey average 53%) and just 32% have tested it in the last six months (survey average 48%).
This may reflect a wider lack of effort against fraud: an astonishing 0% of companies report fraud being uncovered via an external audit during the past year. Defenses need to be improved if Russian companies are to see a drop in fraud levels.
russIa overvIewRussia had a substantial fraud problem in the last year, with 76% of respondents reporting that their companies have been hit by at least one fraud, one of the highest figures in the survey among countries with sufficient respondents to calculate a figure. Russian firms also report losing on average 1.9% of revenues to fraud, well above the 1.4% average. Especially large problems facing the country are corruption and information theft: it has the highest reported incidence of any country for the former – 32%, more than twice the survey average of 14% – and the second highest incidence of information theft (29%).
2012-2013 2011-2012
Prevalence: Companies affected by fraud 76% 61%
areas of Frequent loss: Percentage of firms reporting loss to this type of fraud
Corruption and bribery (32%)
Information theft, loss or attack (29%)
Management conflict of interest (24%)
Internal financial fraud (18%)
Theft of physical assets or stock (15%)
Theft of physical assets or stock (26%)
Information theft, loss or attack (26%)
Corruption and bribery (16%)
Increase in exposure: Companies where exposure to fraud has increased
74% 52%
Biggest drivers of Increased exposure: Most widespread factor leading to greater fraud exposure and percentage of firms affected
IT complexity (35%) Entry into new, riskier markets (23%)
loss: Average percentage of revenue lost to fraud
1.9% 0.4%
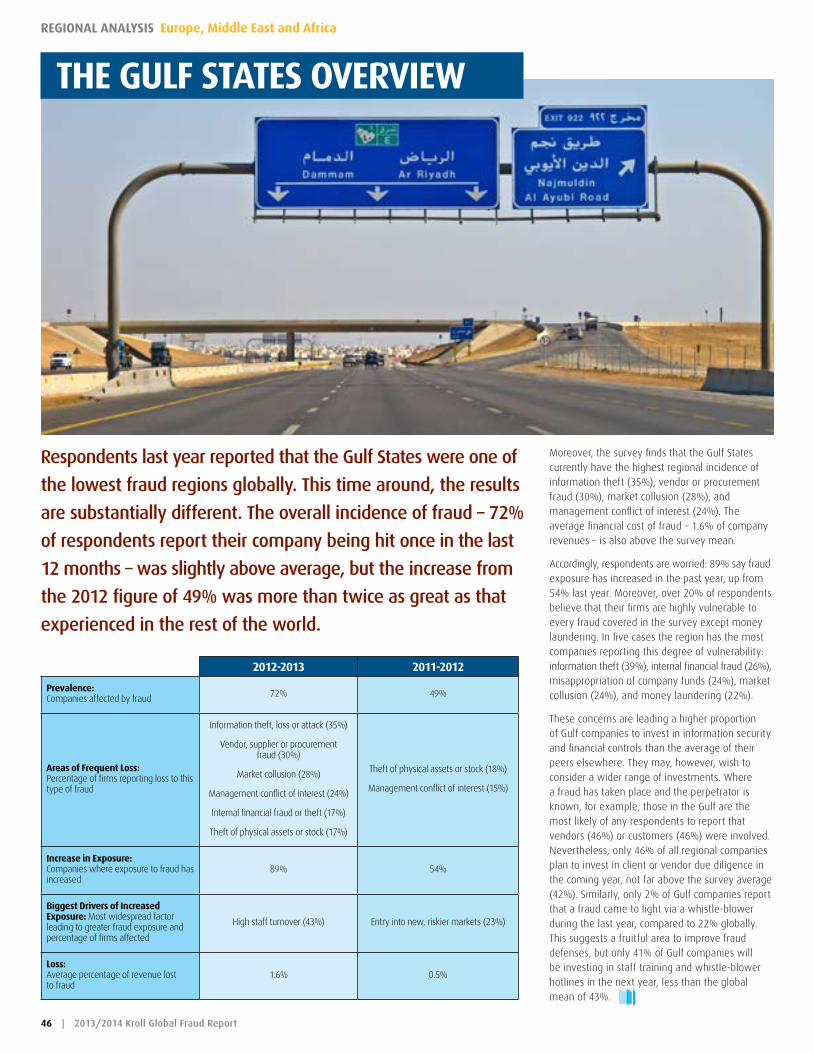
46 | 2013/2014 Kroll Global Fraud Report
Regional analysis europe, Middle east and africa
Moreover, the survey finds that the Gulf States currently have the highest regional incidence of information theft (35%), vendor or procurement fraud (30%), market collusion (28%), and management conflict of interest (24%). The average financial cost of fraud – 1.6% of company revenues – is also above the survey mean.
Accordingly, respondents are worried: 89% say fraud exposure has increased in the past year, up from 54% last year. Moreover, over 20% of respondents believe that their firms are highly vulnerable to every fraud covered in the survey except money laundering. In five cases the region has the most companies reporting this degree of vulnerability: information theft (39%), internal financial fraud (26%), misappropriation of company funds (24%), market collusion (24%), and money laundering (22%).
These concerns are leading a higher proportion of Gulf companies to invest in information security and financial controls than the average of their peers elsewhere. They may, however, wish to consider a wider range of investments. Where a fraud has taken place and the perpetrator is known, for example, those in the Gulf are the most likely of any respondents to report that vendors (46%) or customers (46%) were involved. Nevertheless, only 46% of all regional companies plan to invest in client or vendor due diligence in the coming year, not far above the survey average (42%). Similarly, only 2% of Gulf companies report that a fraud came to light via a whistle-blower during the last year, compared to 22% globally. This suggests a fruitful area to improve fraud defenses, but only 41% of Gulf companies will be investing in staff training and whistle-blower hotlines in the next year, less than the global mean of 43%.
the gulF states overvIew
2012-2013 2011-2012
Prevalence: Companies affected by fraud 72% 49%
areas of Frequent loss: Percentage of firms reporting loss to this type of fraud
Information theft, loss or attack (35%)
Vendor, supplier or procurement fraud (30%)
Market collusion (28%)
Management conflict of interest (24%)
Internal financial fraud or theft (17%)
Theft of physical assets or stock (17%)
Theft of physical assets or stock (18%)
Management conflict of interest (15%)
Increase in exposure: Companies where exposure to fraud has increased
89% 54%
Biggest drivers of Increased exposure: Most widespread factor leading to greater fraud exposure and percentage of firms affected
High staff turnover (43%) Entry into new, riskier markets (23%)
loss: Average percentage of revenue lost to fraud
1.6% 0.5%
Respondents last year reported that the Gulf States were one of
the lowest fraud regions globally. This time around, the results
are substantially different. The overall incidence of fraud – 72%
of respondents report their company being hit once in the last
12 months – was slightly above average, but the increase from
the 2012 figure of 49% was more than twice as great as that
experienced in the rest of the world.
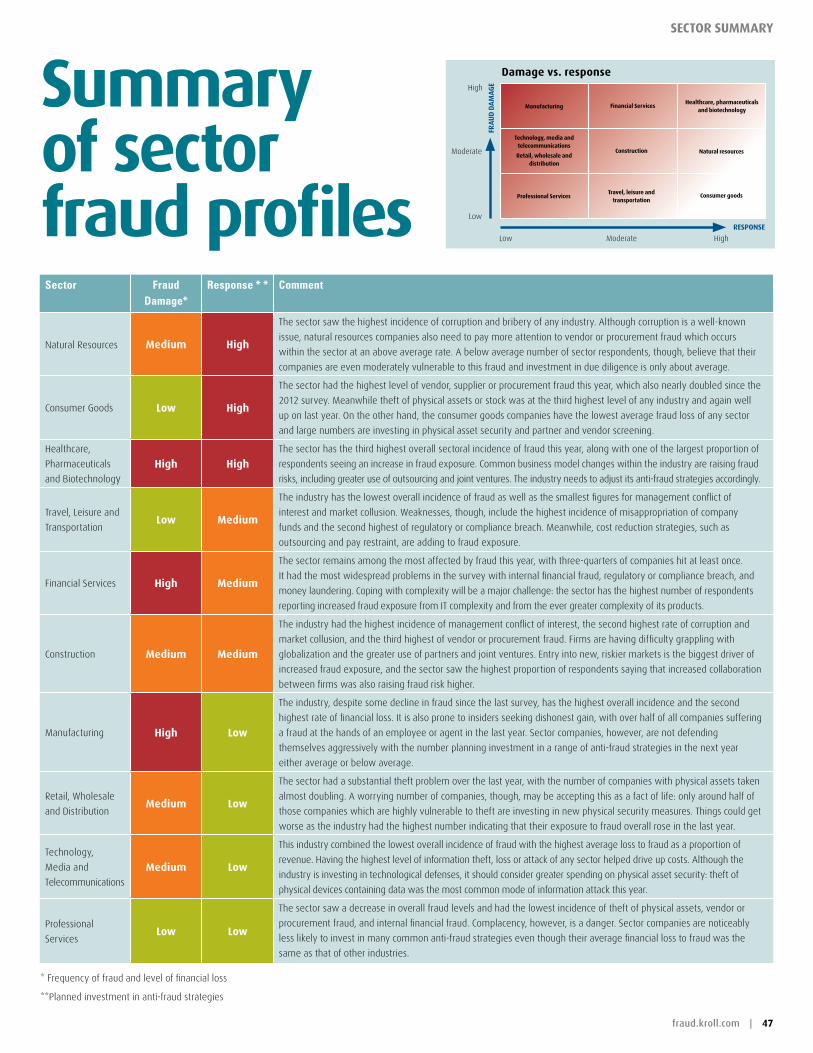
fraud.kroll.com | 47
seCtor summary
Sector Fraud Damage*
Response * * Comment
Natural Resources medium high
The sector saw the highest incidence of corruption and bribery of any industry. Although corruption is a well-known
issue, natural resources companies also need to pay more attention to vendor or procurement fraud which occurs
within the sector at an above average rate. A below average number of sector respondents, though, believe that their
companies are even moderately vulnerable to this fraud and investment in due diligence is only about average.
Consumer Goods low high
The sector had the highest level of vendor, supplier or procurement fraud this year, which also nearly doubled since the
2012 survey. Meanwhile theft of physical assets or stock was at the third highest level of any industry and again well
up on last year. On the other hand, the consumer goods companies have the lowest average fraud loss of any sector
and large numbers are investing in physical asset security and partner and vendor screening.
Healthcare,
Pharmaceuticals
and Biotechnologyhigh high
The sector has the third highest overall sectoral incidence of fraud this year, along with one of the largest proportion of
respondents seeing an increase in fraud exposure. Common business model changes within the industry are raising fraud
risks, including greater use of outsourcing and joint ventures. The industry needs to adjust its anti-fraud strategies accordingly.
Travel, Leisure and
Transportationlow medium
The industry has the lowest overall incidence of fraud as well as the smallest figures for management conflict of
interest and market collusion. Weaknesses, though, include the highest incidence of misappropriation of company
funds and the second highest of regulatory or compliance breach. Meanwhile, cost reduction strategies, such as
outsourcing and pay restraint, are adding to fraud exposure.
Financial Services high medium
The sector remains among the most affected by fraud this year, with three-quarters of companies hit at least once.
It had the most widespread problems in the survey with internal financial fraud, regulatory or compliance breach, and
money laundering. Coping with complexity will be a major challenge: the sector has the highest number of respondents
reporting increased fraud exposure from IT complexity and from the ever greater complexity of its products.
Construction medium medium
The industry had the highest incidence of management conflict of interest, the second highest rate of corruption and
market collusion, and the third highest of vendor or procurement fraud. Firms are having difficulty grappling with
globalization and the greater use of partners and joint ventures. Entry into new, riskier markets is the biggest driver of
increased fraud exposure, and the sector saw the highest proportion of respondents saying that increased collaboration
between firms was also raising fraud risk higher.
Manufacturing high low
The industry, despite some decline in fraud since the last survey, has the highest overall incidence and the second
highest rate of financial loss. It is also prone to insiders seeking dishonest gain, with over half of all companies suffering
a fraud at the hands of an employee or agent in the last year. Sector companies, however, are not defending
themselves aggressively with the number planning investment in a range of anti-fraud strategies in the next year
either average or below average.
Retail, Wholesale
and Distributionmedium low
The sector had a substantial theft problem over the last year, with the number of companies with physical assets taken
almost doubling. A worrying number of companies, though, may be accepting this as a fact of life: only around half of
those companies which are highly vulnerable to theft are investing in new physical security measures. Things could get
worse as the industry had the highest number indicating that their exposure to fraud overall rose in the last year.
Technology,
Media and
Telecommunications
medium low
This industry combined the lowest overall incidence of fraud with the highest average loss to fraud as a proportion of
revenue. Having the highest level of information theft, loss or attack of any sector helped drive up costs. Although the
industry is investing in technological defenses, it should consider greater spending on physical asset security: theft of
physical devices containing data was the most common mode of information attack this year.
Professional
Serviceslow low
The sector saw a decrease in overall fraud levels and had the lowest incidence of theft of physical assets, vendor or
procurement fraud, and internal financial fraud. Complacency, however, is a danger. Sector companies are noticeably
less likely to invest in many common anti-fraud strategies even though their average financial loss to fraud was the
same as that of other industries.
summary of sector fraud profiles
Fra
ud
da
ma
ge
resPonse
HighLow Moderate
High
Low
Moderate
damage vs. response
Financial services
technology, media and telecommunications retail, wholesale and
distribution
healthcare, pharmaceuticals and biotechnology
Professional services
manufacturing
travel, leisure and transportation
Consumer goods
* Frequency of fraud and level of financial loss
** Planned investment in anti-fraud strategies
natural resourcesConstruction
Contact Krollfor information about any of Kroll’s services, please contact a representative in one of our offices below or visit www.kroll.com
CorPorate headquarters600 Third Avenue New York, NY 10016
North America
Robert Brenner New York 1 212 833 3334 [email protected]
Latin America
Recaredo Romero Bogotá 57 1 742 5556 [email protected]
Europe, Middle East & Africa
Tom Everett-Heath London 44 207 029 5067 [email protected]
Asia
Tadashi Kageyama Hong Kong 852 2884 7788 [email protected]
loCal oFFICes
Bob Viteretti New York 1 212 833 3211 [email protected]
Ray Blackwell Bastrop 1 512 321 4421 [email protected]
David Holley Boston 1 617 210 7466 [email protected]
Jeff Cramer Chicago 1 312 345 2750 [email protected]
Melvin Glapion Los Angeles 213 443 1142 [email protected]
Brian Lapidus Nashville 1 866 419 2052 [email protected]
Bill Nugent Philadelphia 1 215 568 2440 [email protected]
James McWeeney Reston 1 703 860 0190 [email protected]
Betsy Blumenthal San Francisco 1 415 743 4800 [email protected]
Peter McFarlane Toronto 1 416 682 2784 [email protected]
Simone Maini Washington D.C. 1 571 521 6192 [email protected]
Dan Karson Miami 1 305 789 7100 [email protected]
Recaredo Romero Bogotá 57 1 742 5556 [email protected]
Matias Nahon Buenos Aires 54 11 4706 6000 [email protected]
Brian Weihs Mexico City 52 55 5279 7250 [email protected]
Snezana Petreska Sao Paulo 55 11 3897 0900 [email protected]
Colum Bancroft Hong Kong 852 2884 7788 [email protected]
Violet Ho Beijing 86 10 5964 7600 [email protected]
Reshmi Khurana Mumbai 91 22 6724 0500 [email protected]
Violet Ho Shanghai 86 21 6156 1700 [email protected]
Penelope Lepeudry Singapore 65 6645 4520 [email protected]
Makoto Suhara Tokyo 81 3 3509 7100 [email protected]
Zoe Newman London 44 207 029 5154 [email protected].
Yaser Dajani Dubai 971 4 449 6714 [email protected]
Javier Cortés Madrid 34 91 310 6720 [email protected]
Marianna Vintiadis Milan 39 02 8699 8088 [email protected]
Alex Volcic Moscow 7 495 969 2898 [email protected]
Bechir Mana Paris 33 1 42 67 81 46 [email protected]
Europe, Middle East & Africa
Asia
Latin America
North America
gloBal rePresentatIves
© 2013
scan the code to read more web-exclusive content or visit fraud.kroll.com