Embed Size (px)
Citation preview

ENSURING PEACE OF MIND WHEN USING TEMP WORKERS | PAGE 19

“NOTE FROM THE EDITOR
INSIDE THIS ISSUE
Can you believe it’s already the end of the second quarter? As we rush into the second half of 2014, the editorial staff at DCR TrendLine is eager to share our in-depth research and insight into developments in the staffing industry.
By analyzing supply and demand trends of the contingent labor market, the DCR National Temp Wage Index provides you with insight into the relative movement of temporary wage rates in the U.S. economy. This month, we look at the hiring plans of small- and mid-sized businesses for the remainder of the year.
Recently the U.S. Department of Homeland Security released a report that found that Indians account for the largest number of non-immigrants residing in the U.S and working in temporary jobs. In this article we discuss the demographic trends for non-immigrant temp workers in the United States.
Our next article examines how temporary employment has become the new normal of the U.S. labor market. We also take an international perspective by looking at how the top companies in South Korea are turning towards temp workers to bolster their workforces.
HR executives point to efficiency in recruiting as a top priority in 2014. We consider why incorporating transparency in recruiting is valuable and necessary to attract top talent.
In last month’s edition, we introduced a new monthly feature that focuses on industry-based temp employment. In this edition, we share with you the DCR TrendLine Manufacturing Employment Index, which shows you trends in the manufacturing industry and our insights into wages.
Our feature article this month focuses on an issue that arises when employing temporary workers – compliance. We discuss some of the areas of compliance that need to be addressed to offer managers peace of mind, and share with you some ideas on how to overcome this challenge.
June is the month of graduations. As the class of 2014 enters the workforce, we shall take a look at how the job prospects are for the new grads.
Ammu WarrierAmmu Warrier, President
“The job market is gaining strength. After a tough winter employers are expanding payrolls across nearly all industries and company sizes. The recent pickup in job growth at mid-sized companies may signal better business confidence. Job market prospects are steadily improving” ~Mark Zandi, Chief Economist at Moody’s Analytics
1
Note from the Editor...............................................................................................................................................page 1Over One-Third of Resident Non-Immigrant Temp Workers are from India.........................................page 6Temp Employment Becoming the New Norm.................................................................................................page 10Top South Korean Companies Turning to Temp Workers............................................................................page 11The Value of Transparency to Recruiting..........................................................................................................page 13Industry Highlight: Manufacturing Index..........................................................................................................page 16Ensuring Peace of Mind when Using Temp Workers.....................................................................................page 19Job Prospects for 2014 College Grads...............................................................................................................page 23Methodology.............................................................................................................................................page 25References.................................................................................................................................................page 26About DCR..................................................................................................................................................page 27

DCR NATIONAL TEMP WAGE INDEX
“In April 2014, temporary workers’ wages increased by 30 cents, which is the second highest month-over-month increment in the past year. The highest increase so far this year was seen in January. The Bureau of Labor Statistic (BLS) reports that the average weekly pay of temp jobs is $554.
Temp employment increased by 24,000 jobs in April 2014, with a temp penetration rate at a high of 2.065 percent. The unemployment rate fell to 6.3 percent from 6.7 percent in the previous month. ADP’s national employment report shows that private sector employment rose by 220,000 jobs in April from March. Of these jobs, small firms were the largest contributors with 82,000 jobs.
U.S. Labor Department data indicates that more than one-tenth of jobs created since 2009 have been temporary. CareerBuilder says that more than half of jobs created since the recession in cities such as Cincinnati and Milwaukee are temporary or contract work. Almost 40 percent of all temp jobs are in manufacturing.
The American Staffing Association estimates that at some point in the last year, about 11 million people held a temp position.
2
“There’s a supply and demand aspect to it. The employers see it as a quick way to easily be able to downsize without an impact to their core workforce” ~Jennifer Little, Director of Career Services at Spartanburg Community College.

DCR NATIONAL TEMP WAGE INDEX
3
The SMB Job Generation Outlook Survey by Lucas Group found that 45 percent of small to mid-sized businesses (SMB) plan to hire in the next quarter of
2014. Thirty-six percent plan to hire a combination of permanent and temporary workers, while just 7 percent are considering hiring only temp workers.
Of the over 1,100 companies surveyed, 84 percent agreed or strongly agreed with the statement that small and medium businesses are the job generators
of the U.S. economy. While the majority plans to hire in the coming months, almost 60 percent reported difficulty or extreme difficulty in finding qualified
professional or management talent for open positions.
SMALL- AND MID-SIZED BUSINESSES PLANS TO HIRE TEMP WORKERS
Temporary Employment Growth vs. Total Nonfarm Employment Growth
Source: The Wall Street Journal

DCR NATIONAL TEMP WAGE INDEX
4
A large number, 37 percent, of SMBs reported healthcare costs as their chief concern, with 24 percent of all businesses saying that the Affordable Care Act
would have a large impact on their business plans. The minimum wage debate was another concern for SMB executives, with 26 percent reporting that a
wage raise would have a negative impact on their operations, with effects including reducing current hiring plans, reducing current workforce, eliminating
new hiring, or going out of business. When SMB executives were asked at what range they would like to see the minimum hourly wage set at, 34 percent
responded with $7.25 to $8.20, followed by 24% preferring at $9.16 to $10.10.
According to the Bloomberg BNA Wage Trend IndicatorTM (WTI), private industry workers’ annual wages are expected to increase slightly in 2014. Kathryn
Kobe, a consultant who helps develop the WTI database, expects the rate of annual wage growth to be slightly over 2.1 percent.
The WTI relies on seven components to make its predictions on the accelerations and decelerations in the rate of increase in private wages, of which five
are based on economical statistical series, and two are derived from BNA’s Employment Outlook survey. In the latest reading, positive contributors were
the unemployment rate, job losers as a share of the labor force, forecasters’ expectations for the inflation rate, the share of employers planning to hire
production and service workers, and the reported difficulty in filling professional and technical positions.
MODEST INCREASE FORECASTED FOR WAGES
Source: SMB Job Generation Outlook, Lucas Group
Type of Workforce Additions
““The labor market is making steady progress, and employers are showing more interest in hiring new workers.” ~Kathryn Kobe, Consultant with Bloomberg BNA’s WTI

A new survey of approximately 7,000 U.S. workers by Monster.com, found that 42 percent of employees had purposely left a position due to stress. A separate survey of more than 900 workers found that the most common cause of workplace stress is an employee’s relationship with their boss, followed by workload, work-life balance, and relationships with co-workers.
Almost half of employees surveyed reported missing time at work due to work-related stress, and 61 percent said that workplace stress caused them actual physical illness such as insomnia and depression. Increased family issues were also cited as a result of workplace stress. Seven percent of employees report having been hospitalized due to work-related stress.
5
DCR NATIONAL TEMP WAGE INDEX
“People feel stressed out because there’s that continuing pressure to do more with less. Workers feel pressure to get more accomplished.” ~Mary Ellen Slayter, Career Advice Expert at Monster.com
STRESS CAUSING EMPLOYEES TO QUIT“

OVER ONE-THIRD OF RESIDENT NON-IMMIGRANT TEMP WORKERS ARE FROM INDIA
A report by the U.S. Department of Homeland Security (DHS) released in April 2014 revealed that in 2012 Indians accounted for more than one-third of workers with a temporary visa in the United States.
Indians constituted the largest resident non-immigrants in the U.S, a category that excludes tourists, business travelers and permanent residents. The report defines the term resident non-immigrants as “foreign nationals who are legally admitted into the United States for specific, temporary purposes and whose classes of admission are associated with residency (e.g. students and temporary workers) as opposed to tourists and business travellers.”
Of the 1.87 million non-immigrant residents in the U.S. in 2012, India accounted for the largest share with 430,000 residents. This was followed by China and South Korea with 210,000 and 140,000 residents respectively. The largest admission categories for all non-immigrant residents were temporary workers at 45 percent and students at 38 percent.
“Among temporary workers, 38 percent were citizens of India and 45 percent were between ages 25-34.” ~U.S. Department of Homeland Security
6
“Source: U.S. DHS
Share of Indian Resident Non-Immigrant Temp Workers

About 38 percent of the resident non-immigrant population was under the age of 25, and another 710,000 were in the 25-34 age group.
7
OVER ONE-THIRD OF RESIDENT NON-IMMIGRANT TEMP WORKERS ARE FROM INDIA
Of the 840,000 resident non-immigrant temporary workers, 38 percent were from India. Mexico, which accounts for the largest number of illegal migratory workers in the U.S. had only 100,000 resident non-immigrants.
Among the nearly 720,000 foreign students registered with the DHS, nearly 50 percent were Chinese citizens, and approximately 14 percent were from India.
Looking at it from another perspective, of the 430,000 resident non-immigrant Indians, 74 percent were temporary workers, and 23 percent were students, with the remaining 3 percent entering as exchange visitors or diplomats and representatives.
The Department of Homeland Security says that half of the resident non-immigrants were citizens of Asian countries. Europe and North America comprised 26 percent, led by Canada at 6 percent and Mexico at 5 percent.
Resident Non-Immigrant Population by Country of Citizenship and Category
Source: U.S. Department of Homeland Security

OVER ONE-THIRD OF RESIDENT NON-IMMIGRANT TEMP WORKERS ARE FROM INDIA
8
Rank
1
2
3
4
5
6
7
8
9
10
State
California
New York
Texas
Florida
Massachusetts
New Jersey
Illinois
Pennsylvania
Virginia
Washington
Resident Non-Immigrant Population
270,000
210,000
140,000
100,000
90,000
90,000
70,000
60,000
60,000
50,000
Percent of Resident Non-Immigrant Population
Employed as Temp Workers
45%
47%
42%
60%
52%
68%
48%
36%
37%
55%
California was the leading destination state for resident non-immigrants with 15 percent of the total 1.9 million non-immigrants. The top five destination states accounted for 44 percent of the total.
Leading Destination States for Resident Non-Immigrants
Source: U.S. Department of Homeland Security
Resident Non-Immigrant Population by Age
Source: U.S. Department of Homeland Security
LEADING DESTINATION STATES

A report by the Center for American Progress says that Indian-Americans, at a population of 3.34 million,
comprise the third largest Asian community in the United States. From 2000 to 2012, the Indian-American
population grew by 76 percent.
Chinese-Americans form the largest group of Asian-American population with 4.1 million, followed by
Filipinos-Americans at 3.59 million.
The study also revealed that Indians lead when it comes to education with 39 percent of Indian-Americans
earning post-graduate degrees. India is also ranked among the highest in terms of its immigrants becoming
naturalized U.S. citizens. According to the report, 72 percent of the Indian-origin population in the U.S. is foreign
born, and 33 percent arrived in the U.S. in the last 10 years.
The largest concentration of Indian-Americans is found in California (19 percent), New York (12 percent), and
New Jersey (10 percent). The fastest-growing states for Asian Americans are Nevada, Arizona, North Dakota,
North Carolina, and Georgia, where populations have more than doubled in the past decade.
9
OVER ONE-THIRD OF RESIDENT NON-IMMIGRANT TEMP WORKERS ARE FROM INDIA““Indeed, we might even see new forms of detailed origin identification. For example, it is
possible that, as these South Asian populations grow and settle longer in the United States,
we might see a new consolidated subgrouping of South Asians that is used fairly commonly
among second-generation immigrants on many college campuses and increasingly among
social service organizations” ~ State of Asian Americans And Pacific Islanders, Center for
American Progress

TEMP EMPLOYMENT BECOMING THE NEW NORM
10
““
For many Americans, the thriving demand for temp workers has been more than a simple path out of post-recession unemployment. In contrast, temp positions have become the new norm of the working world.
According to the U.S. Bureau of Labor Statistics (BLS), about 2.8 million workers are employed currently in temporary or contract positions. And in just March 2014, the temp industry added 28,500 jobs. Steve Berchem, chief operating officer of the American Staffing Association, believes that a shift towards companies using temporary workers is underway.
Increasingly, industries not typically thought of as traditional temp workplaces are using more contracted workers. For example, adjunct professors at universities are beginning to say that they are temp workers of college classrooms. And according to the Upjohn Institute for Employment Research manufacturing companies comprise roughly 40 percent of the demand for temp workers.
“Right now we’re seeing something interesting. We’ve seen it surpass its previous highs, so it looks like there could be a structural shift going on, too. There’s a reason to believe we might see some increase in the use of temporary help in general.” ~Susan Houseman, Senior Economist at Upjohn Institute for Employment Research.
“We argued when the recovery began that there would be a structural shift. We were hearing that from members who were hearing that from their clients, (that) they were more likely to use temp and contract workers.” ~Steve Berchem, COO of the American Staffing Association.
PART-TIME POSITIONS
This new normal in the market is a win-win for both companies and workers, particularly in terms of flexibility. Employers enjoy the elasticity gained with a workforce mix consisting of temporary workers, allowing them to ramp up or shed workers based on business cycles, demand, and market conditions. And workers are beginning to place a priority on family and work-life balance, which project-based work allows space for.
WIN-WIN FOR BOTH PARTIES
TOP SOUTH KOREAN COMPANIES TURNING TO TEMP WORKERS
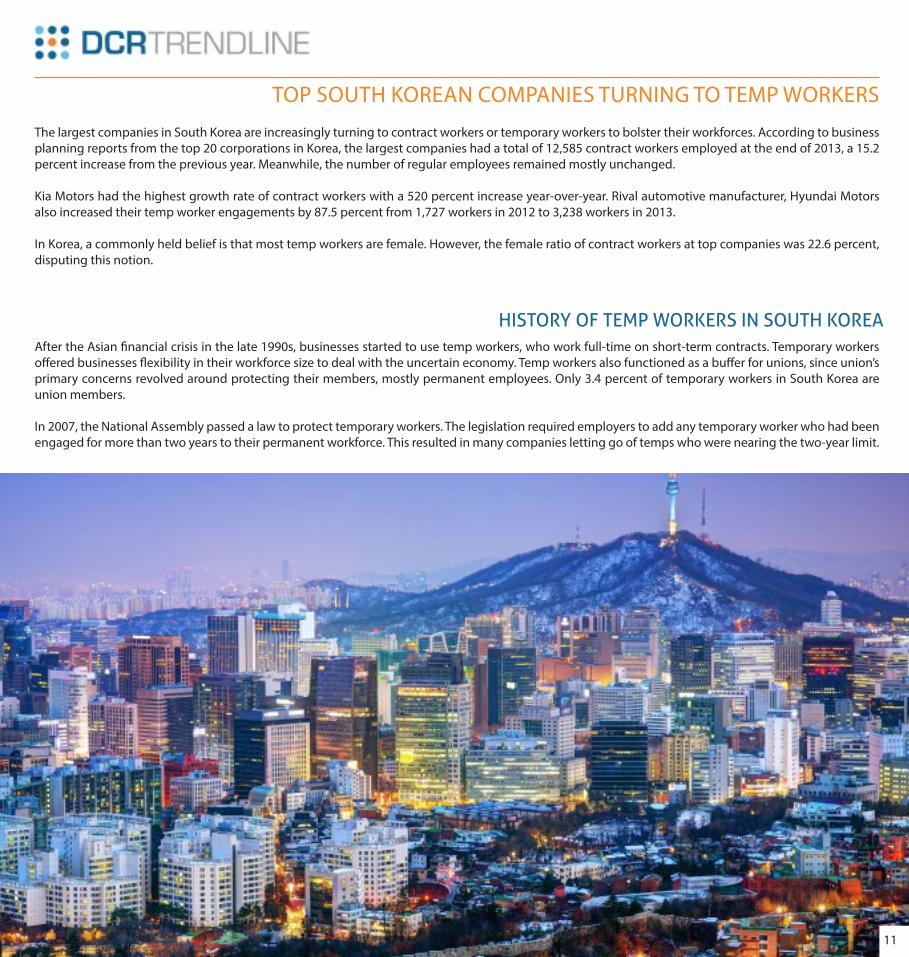
The largest companies in South Korea are increasingly turning to contract workers or temporary workers to bolster their workforces. According to business planning reports from the top 20 corporations in Korea, the largest companies had a total of 12,585 contract workers employed at the end of 2013, a 15.2 percent increase from the previous year. Meanwhile, the number of regular employees remained mostly unchanged.
Kia Motors had the highest growth rate of contract workers with a 520 percent increase year-over-year. Rival automotive manufacturer, Hyundai Motors also increased their temp worker engagements by 87.5 percent from 1,727 workers in 2012 to 3,238 workers in 2013.
In Korea, a commonly held belief is that most temp workers are female. However, the female ratio of contract workers at top companies was 22.6 percent, disputing this notion.
After the Asian financial crisis in the late 1990s, businesses started to use temp workers, who work full-time on short-term contracts. Temporary workers offered businesses flexibility in their workforce size to deal with the uncertain economy. Temp workers also functioned as a buffer for unions, since union’s primary concerns revolved around protecting their members, mostly permanent employees. Only 3.4 percent of temporary workers in South Korea are union members.
In 2007, the National Assembly passed a law to protect temporary workers. The legislation required employers to add any temporary worker who had been engaged for more than two years to their permanent workforce. This resulted in many companies letting go of temps who were nearing the two-year limit.
11
HISTORY OF TEMP WORKERS IN SOUTH KOREA

South Korea’s largest industries, including electronics, automobiles, telecommunication equipment, and shipbuilding, contribute 39.8 percent to the GDP. Additionally, South Korea is one of the biggest global manufacturers and a major automobile producer, with more than 4 million cars manufactured each year.
In February 2014, South Korea’s seasonally adjusted unemployment rate hit a three-year high at 3.9 percent, up from 3.2 percent the previous month. In that month, an additional 308,800 people entered the job market, while only 112,800 jobs were created.
TOP SOUTH KOREAN COMPANIES TURNING TO TEMP WORKERS
12
EMPLOYMENT FIGURES IN SOUTH KOREA
South Korea Unemployment Rate, % of Labor Force
Source: Trading Economics
THE VALUE OF TRANSPARENCY TO RECRUITING
“13
“Every organization should be thinking about how they can be more transparent. It is one of the lowest to no cost initiatives to tackle right away. But of course it requires an ongoing commitment from management to be more transparent to the very people they so carefully brought on board. At the end of the day, to give is to get.” ~TINYpulse Engagement Survey 2013
A recent employee engagement study by TINYpulse, a company that provides a weekly survey related to how workers feel about their organizations’ culture, management, recognition, and co-workers to over 300 companies, revealed that transparency is the number one factor contributing to worker happiness. Over 40,000 workers were surveyed, and it was found that management transparency had a high correlation coefficient of .93 with employee happiness.
Since the cost of improving corporate transparency is low, many companies are increasingly using it as a tool to attract and retain top talent.
Transparency is becoming more important in the recruiting process as well. A survey of over 14,000 IT engineers by Glassdoor also found that transparency is the most valued aspect (81 percent of respondents ranked it as the highest factor) of the recruiting process, where candidates want to know the positives and negatives of the companies and jobs being considered.
Social media has played a part in driving up the value of workplace transparency. Through social networks, people are sharing a lot of information. Just as they share activities on Facebook, post photos and reviews on TripAdvisor, and rate dining experiences on Yelp, people are now reviewing jobs and companies on sites such as Glassdoor. Workplace transparency is becoming a major selling point for companies looking to recruit top talent.
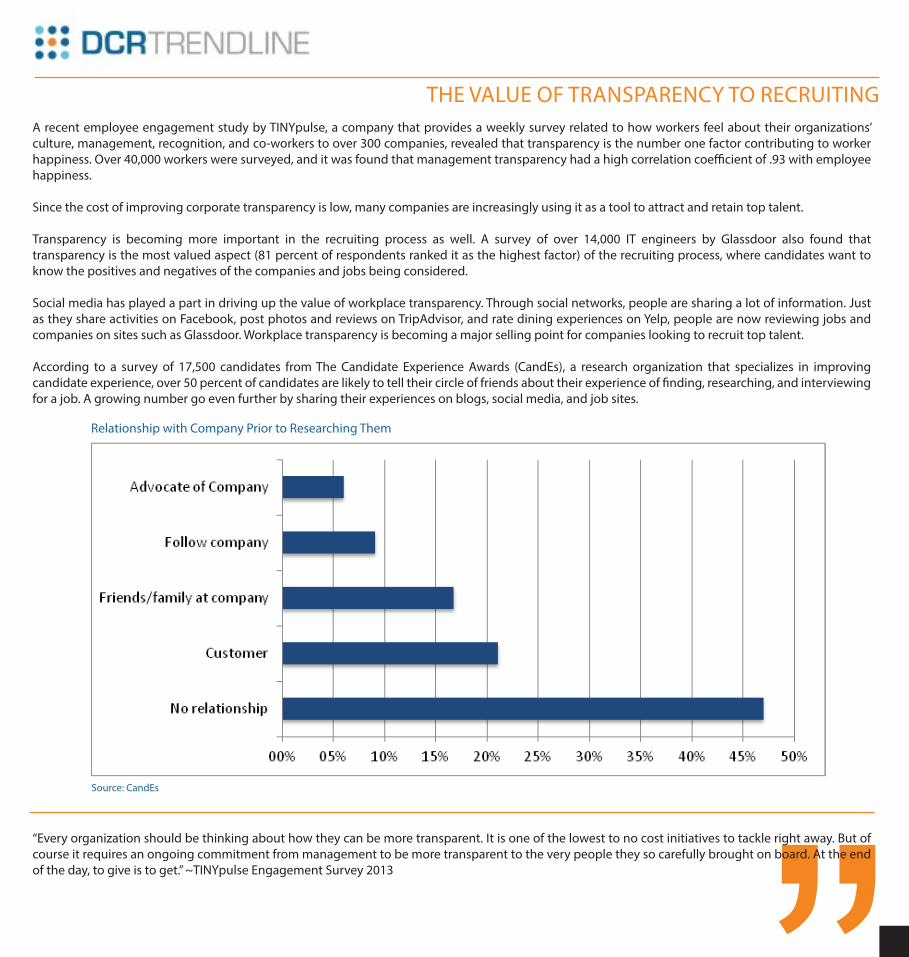
According to a survey of 17,500 candidates from The Candidate Experience Awards (CandEs), a research organization that specializes in improving candidate experience, over 50 percent of candidates are likely to tell their circle of friends about their experience of finding, researching, and interviewing for a job. A growing number go even further by sharing their experiences on blogs, social media, and job sites.
Relationship with Company Prior to Researching Them
Source: CandEs

“THE VALUE OF TRANSPARENCY TO RECRUITING
“Remember job seekers want information from employers, employees and all those in the know about what it’s like to work at a company before they make a career decision.” ~Lisa Holden, Employer Engagement Manager at Glassdoor.
14
What Job Content is Made Available to Candidates Before they Apply?
TIPS ON USING WORKFORCE TRANSPARENCY FOR RECRUITING
Source: CandES

THE VALUE OF TRANSPARENCY TO RECRUITING
15
Getting recruiting right has a large impact on worker engagement, productivity and retention. With transparency being such a key element of the recruiting process from a candidate’s point of view, savvy HR organizations are developing strategies to incorporate more transparency into their sourcing plans.
Pretend to be a Candidate - Experience your recruitment and onboarding process as a candidate to truly learn what they go through and discover opportunities for improvement.
Be Aware - Know everything that is being said about your company and your jobs, by monitoring social media, news sites, and relevant websites, blogs and forums.
Know Your Audience - Identify your audience for each of your communication channels.
Have Well-Defined Job Descriptions - Present job information in a compelling manner but base it on real job requirements, so that employees do not feel deceived.
Develop a Social Recruiting Plan - Outline a plan of who you need to hire, when you need them to start, and where, and insert that message into the proper channels.
Increase Transparency about Compensation - Most candidates consider compensation to be an important element in their decision process, and this provides companies an opportunity for increased transparency by having accurate compensation conversations.
Establish a Formal Onboarding Process - Develop a structured and consistent onboarding process that incorporates transparency through communicating expectations to new hires.
Talk About Your Corporate Culture - Use your communication channels to talk about your organizational culture and talent brand by clearly discussing what makes you stand out as an employer.
Enable Transparency Among Your Workforce - Current workers are your biggest employer ambassadors, so listening to them enabling them to share your messaging will help to create and maintain transparency in the organization.

INDUSTRY HIGHLIGHT: MANUFACTURING INDEX
DCR TrendLine Manufacturing Employment Index
In April 2014, manufacturing employment increased by 12,000 jobs. According to a national employment survey by SHRM, 57 percent of manufacturing companies planned to hire in May 2014, while only 4.1 percent planned to reduce their workforces. A net 4.5 percent of manufacturing respondents said they increased new-hire compensation in April 2014.
The Southern United States has historically s been an industry bed for automobile manufacturers such as Mercedes-Benz and Volkswagen. The area is now attracting aerospace companies, such as Boeing, Airbus, and GE Aviation, who are operating in South Carolina, Alabama, and North Carolina. A report by USA Today credits the region’s lower costs, generous incentive programs, and labor laws that make union organization difficult, as key motivators.
Within aerospace manufacturing, South Carolina experienced a growth of more than 600 percent between 2007 and 2012, while North Carolina was second with job growth of nearly 34 percent. In 2013, hourly compensation rates averaged $27 in Southern states.
“This hiring increase, however, is not translating into higher compensation packages for new hires ~Jennifer Schramm, Manager of Workforce Trends at the Society for Human Resource Management
“16

INDUSTRY HIGHLIGHT: MANUFACTURING INDEX
17
Manufacturing Employment and Wages: Job Title
Minnesota, a state with a strong manufacturing presence, is confident about the future of the industry. The annual State of Manufacturing report found that factory managers are the most optimistic they’ve been since the recession in 2009. Recent employment and produc-tion reports by the Institute of Supply Managers echoes this finding, with industry participants expecting the manufacturing sector across the U.S. and Midwest to grow.
As baby boomers age and jobs continue to grow in the manufacturing industry, a labor skills gap is identified as a reason why over half a million skilled manufacturing jobs remains unfilled. The industry employs more than 12 million workers directly, but about 600,000 skills jobs are vacant, according to a study by Deloitte.

INDUSTRY HIGHLIGHT: MANUFACTURING INDEX
The BLS defines the job title of machinist as workers who “set up and operate a variety of machine tools to produce precision parts and instruments. As of May 2013, the employment estimate for this job was 391,130 with a mean hourly wage of $19.72. The top paying industry for this occupation is natural gas distribution with an average mean wage of $76,690. The job is projected to grow by 8 to 14 percent by 2022, with 125,900 job openings over that period.
18
JOB TITLE FOCUS – MACHINISTS

Since June 2009, about 19 percent of all new jobs created in the United States have been temporary positions. As companies increasingly turn towards temporary workers to bolster their workforces, managers are becoming more concerned with the issue of compliance.
While using contingent workers offer employers several advantages, there are a few areas of compliance that need to be addressed to offer managers peace of mind. These areas include worker classification, joint employment, OSHA requirements, diversity goals, screening policies, and more.
ENSURING PEACE OF MIND WHEN USING TEMP WORKERS
19
Change in Employment, Temp vs. Traditional Workforce
Source: BLS

ENSURING PEACE OF MIND WHEN USING TEMP WORKERS
The IRS says that it is critical that business owners determine if the individuals providing services are their employees or independent contractors. This requires defining the business relationship between the employer and the person performing the service. Common law rules apply to provide evidence of the degree of control and independence, and are based on behavior, financial, and type of relationship parameters. Businesses must weigh these factors to determine the worker classification.
Joint employment, also known as co-employment, refers to the sharing of control and supervision of an employee’s activities among two or more business entities. This dynamic typically comes into question with temp workers as the staffing provider and the on-site company both assume different portions of the responsibility for a worker’s employment situation. While a staffing agency may pay the worker and is the primary employer of record, the client company is considered the secondary employer under joint employment.
Both are responsible for adherence to government regulations regarding compensation. As companies continue to rely on contingent staff as an important part of their workforce strategy, employers have to be mindful of the intricacies that relate to using contingent labor.
Source: IRS
Share of Temp Workforce, by Profession
Source: BLS
Does the company control or have the right to control what the worker does and how the worker does his or her job?
Are the business aspects of the worker’s job controlled by the payer? (these include things like how worker is paid, whether expenses are reimbursed, who provides tools/supplies, etc.)
Are there written contracts or employee type benefits (i.e. pension plan, insurance, vacation pay, etc.)? Will the relationship continue and is the work performed a key aspect of the business?
20
WORKER CLASSIFICATION
JOINT EMPLOYMENT
BEHAVIORAL
FINANCIAL
TYPE OF RELATIONSHIP

OSHA PROTECTIONS
According to the latest data from the U.S. Bureau of Labor Statistics (BLS), the number of temp workers injured on the job rose from 542 in 2011 to 715 in 2012. Contractors represented 15.5 percent of all fatal occupational injuries that year.
ENSURING PEACE OF MIND WHEN USING TEMP WORKERS
21
Source: BLS
Just recently, the U.S. Department of Labor’s Occupational Safety and Health Administration (OSHA) announced a new Recordkeeping Bulletin aimed at raising compliance with requirements that temporary workers receive the same training and protection that permanent employees do. According to the requirements, OSHA delegates responsibility to the host company first if there is a violation or injury, which cannot be pushed to the staffing agency.
Via staffing agreements, many companies require staffing agencies to provide generic training, but it is the host company’s responsibility to supply company-specific training and maintaining training records for all workers.
““Host employers need to treat temporary workers as they treat existing employees. Temporary staffing agencies and host employers share control over the employee, and are therefore jointly responsible for temp employee’s safety and health. It is essential that both employers comply with all relevant OSHA requirements.” ~David Michaels, Assistant Secretary of Labor for Occupational Safety and Health

ENSURING PEACE OF MIND WHEN USING TEMP WORKERS
22
OTHER AREAS OF COMPLIANCE
HOW TO ACHIEVE PEACE OF MIND
Companies often have many recruitment and management processes and policies that require compliance, despite worker type. Diversity goals need to be established and tracked for temporary workers. Corporate screening policies often apply to temporary workers as well. In the case of certain job types, Department of Defense (DoD) security clearance checks need to be performed and maintained. In government-regulated roles or industries, licensing and certifications have to be verified and kept current.
In addition to other corporate policies regarding worker tenure, confidentiality, system access, and more, contract enforcement is also a compliance concern. This includes tracking and managing contract expiration dates for temporary workers, monitoring performance levels, and more.
With all of these various aspects of contingent workforce management, it is no surprise that managers are often overwhelmed.
However, there are many solutions that exist to ensure that employers are provided the information needed to solve problems. These solutions provide peace of mind by safeguarding against areas of temporary workforce risk, such as regulatory non-compliance, failure to comply with corporate policy, safety issues, and supplier breach of contracts.
A Vendor Management System (VMS) with effective compliance management features offers a rule-based system that mirrors the business policies and legal obligations of the company, with automatic reminders, alerts and escalations. With audit trails, and onboarding and offboarding checklists, employers are assured that mandatory actions are completed. Advanced VMS systems offer management features including 1099 compliance modules that provide online assessments and calculate risk levels, and validate compliance with licensing, certifications, and DoD security clearance requirements.
For companies that engage temporary workers, investing in a VMS system or partnering with contingent workforce experts is an avenue to pursue to ensure compliance with policies and regulations and maintain peace of mind.

“According to a survey conducted by Korn Ferry, almost 70 percent of executives say that job prospects are better for the class of 2014 compared to last year.
This optimism is echoed by a new survey from the National Association of Colleges and Employers (NACE), which indicates that 2014 college graduates should have an easier time finding a job compared to last year’s class. Employers said that they plan to hire 8.6 percent more graduates than initially planned.
Over 50 percent of hiring employers had a strong interest in bachelor’s degree graduates in accounting and other business fields along with engineering and computer science. And more than half also expected to hire master’s level graduates, including MBAs.
“The students graduating this spring have had front-row seats to a soft economy. But we’ve seen more employers recruiting on campuses around the country, and I think this will translate into jobs” ~Dan Black, President of NACE
Another survey conducted by Harris Poll for CareerBuilder found that most companies (61 percent) plan to offer graduates the same starting pay as in 2013. Overall, 56 percent expect to pay an annual salary that is less than $40,000. The average salary expectations from the students’ point of view for all majors is $38,494 annually with benefits including annual salary increases, 401(k) company match, and tuition reimbursement.
Employment Prospect by Major
Source: CareerBuilder
Business
Computer Science and IT
Engineering
Math and Statistics
Health Professions and Related Clinical Services
Communications Technologies
Engineering Technologies
Liberal Arts & Sciences, General Studies, and Humanities
Education
Science Technologies
Communication and Journalism
39%
28%
18%
14%
14%
12%
11%
10%
7%
7%
7%
JOB PROSPECTS FOR 2014 COLLEGE GRADS
23

“24
Rosemary Haefner, Vice President of Human Resources for CareerBuilder says that 41 percent of employers do not believe that recent graduates are adequately prepared for roles in customer service. While most employers say that college graduates are ready to work in the real world, almost 24 percent don’t believe that educational facilities have adequately prepared students. Of employers who doubt the abilities of graduates, 53 percent think there is too much emphasis on book learning instead of real-world experience.
“These companies may think the graduates are academically strong, but they aren’t sure they are prepared for the complexity of today’s jobs. Companies are asking these questions about graduates: Are they just book smart? Or will they have street smarts as well? The marketplace is evolving at a faster pace than it did in the past, and academia may not be keeping pace with technology that businesses need.” ~Rosemary Haefner, Vice President of Human Resources at CareerBuilder
Average Salaries by Discipline
Source: NACE
JOB PROSPECTS FOR 2014 COLLEGE GRADS

METHODOLOGY
The DCR Wage Index is developed to assess the relative movements of temporary wage rates in the U.S. economy. The wage rates for temporary workers or contingent workforce are based on payments made by staffing firms to these workers based upon hours worked. Data collected from sources such as Bureau of Labor Standards (BLS) and other government sites as well as an internal pool of staffing companies and consultants, is aggregated and classified based on regions and skill categories, to arrive at an aggregate index.
The baseline for the index is set at 100 for January 2007. Index value for a particular month indicates relative wages with the said baseline and is representative in terms of direction and scale of change. Five years of data has been included to observe seasonal patterns and distinguish seasonality from long-term wage movements. The data and the model has been further refined over last six months.
DCR Wage Index combines the exhaustive data from BLS with practical and more recent developments and data from on-field consultants and clients, to provide timely near-term indications of trends and consistent long-term actionable and objective information.
DCR Work Index uses multiple economic variables to ensure the robustness of its forecasts and cross-validation of trends.
Key data sources and parameters of interest included and influencing the index are:Unemployment dataGross Domestic ProductPrime rate of interestNew and seasonal Job openingsNon Form employmentJob OpeningAll ExportAll ImportAverage Hourly Earnings of All Employees Total PrivateAggregate consultant data on job market parameters
25
SOURCE DATA

REFERENCES
http://www.latimes.com/business/la-fi-permatemp-worker-bill-20140507-story.htmlhttp://online.wsj.com/news/articles/SB10001424052702303910404579485303369082202?cb=logged0.04077291791327298http://www.adpemploymentreport.com/2014/April/NER/NER-April-2014.aspxhttp://www.lucasgroup.com/SMB/SMB-Job-Generator-Outlook-2014Q1.pdfhttps://www.bna.com/wti-forecasts-modest-pr17179889656/http://www.bna.com/wage-trend-indicator-p12884902670/http://www.forbes.com/sites/kathryndill/2014/04/18/survey-42-of-employees-have-changed-jobs-due-to-stress/http://www.ndtv.com/article/diaspora/over-one-third-of-temporary-workers-in-us-from-india-report-509201http://www.pakistankakhudahafiz.com/region/resident-non-immigrants-us-1-4-india/http://www.dhs.gov/sites/default/files/publications/ois_ni_pe_2012.pdfhttp://www.americanbazaaronline.com/2014/04/24/3-3-million-residents-indian-origin-us-4-1-million-chinese-origin/http://www.americanprogress.org/wp-content/uploads/2014/04/AAPI-Demographics.pdfhttp://www.nbcnews.com/feature/in-plain-sight/plain-sight-poverty-america-n69736https://www.tinypulse.com/employee-engagement-survey-2013http://www.forbes.com/sites/victorlipman/2013/12/11/new-study-shows-transparency-isnt-just-good-ethics-its-good-business/http://www.greenkeyllc.com/blog/2014/03/what-it-pros-value-in-recruiters-transparency-candidate-knowledge/http://www.smartrecruiters.com/blog/7-steps-to-use-workplace-transparency-to-help-you-hire/http://www.thecandidateexperienceawards.org/wp-content/uploads/2013/02/Candidate-Experience-2012-FINAL.pdfhttp://beakermag.com/culture-transparency-as-a-recruiting-strategy/http://nam.thecandidateexperienceawards.org/wp-content/uploads/2014/03/Candidate-Experience-2013-eBook_Final.pdfhttp://koreabizwire.com/contract-workers-explodes-while-full-timers-stay-the-same/7984http://www.nytimes.com/2009/07/23/business/global/23temps.html?pagewanted=allhttp://www.reuters.com/article/2014/03/12/us-korea-economy-employment-idUSBREA2B01P20140312http://www.internations.org/south-korea-expats/guide/working-in-south-korea-15577?ah01_enabledhttp://www.tradingeconomics.com/south-korea/unemployment-ratehttp://www.irs.gov/Businesses/Small-Businesses-&-Self-Employed/Independent-Contractor-Self-Employed-or-Employeehttp://www.bloomberg.com/news/2013-05-10/temporary-workers-near-u-s-record-makes-kelly-a-winner.htmlhttp://www.bls.gov/iif/oshwc/cfoi/cfoi_revised12.pdfhttp://www.bls.gov/iif/oshwc/cfoi/contractor.pdfhttp://www.shrm.org/research/monthlyemploymentindices/line/pages/default.aspxhttp://www.shrm.org/research/monthlyemploymentindices/line/pages/default.aspxhttp://www.usnews.com/news/articles/2014/05/07/us-manufacturers-say-skills-gap-could-compromise-competitivenesshttp://www.startribune.com/business/258568031.htmlhttp://www.cnbc.com/id/101588336http://www.usatoday.com/story/money/personalfinance/2014/04/24/college-graduates-jobs-careerbuilder/8017155/http://online.wsj.com/article/PR-CO-20140422-903807.html
26
DCR Workforce is an award winning, best-in-class service provider for contingent workforce and services procurement management. Our proprietary SaaS platform (SMART TRACK) assists in providing customizable VMS and MSP Solutions to manage, procure and analyze your talent with complete transparency, real-time control, high performance and decision-enabling business intelligence.
DCR Workforce serves global clientele including several Fortune 1000 companies. Customers realize greater efficiencies; spend control, improved workforce quality and 100% compliance with our services.
For more information about DCR Workforce and its Forecasting Toolkit (Rate, Demand, Supply and Intelligence) including Best Practice Portal, visit dcrworkforce.com
For more information call +1-888-DCR-4VMS or visit www.dcrworkforce.com
7815 NW Beacon Square Blvd. #224 Boca Raton, FL [email protected] | [email protected]
ABOUT DCR
© 2014 DCR Workforce, Inc. All Rights Reserved. DCR Workforce and Smart Track are Registered Trademarks. CCO — 082912
27
facebook.com/DCRWorkforce
twitter.com/DCRWorkforce
linkedin.com/company/dcr-workforce
plus.google.com/+DCRWorkforce
www.dcrworkforce.com | blog.dcrworkforce.com


![TRENDLINE BREAKOUT STRATEGY[TLB]tlbpro.pullbackforextrading.com/TLB-Basic.pdf · Trendline breakout adalah apabila price memotong trendline dan close pada luar trendline. ... skill](https://img.dokumen.tips/doc/110x75/5aa6bf467f8b9a6d5a8b6727/trendline-breakout-strategytlb-breakout-adalah-apabila-price-memotong-trendline.jpg)