Embed Size (px)
Citation preview

Customer Experience Outside-In Thinking. Customer-focused Execution. Customer Satisfaction.
AS

© 2015 West Monroe Partners | Reproduction and distribution without West Monroe Partners prior consent is prohibited.
Dave Nash – Director, Customer Experience – Dave leads the Customer Strategy & Insights offering and has over 20 years of experience in customer strategy, customer experience, and customer analytics across multiple industries, including utilities, leveraging leading practices across all. Most recently Mr. Nash co-led a customer service strategy and transformational implementation for a major mid-west municipal utility as well as a customer experience strategy for a southwest water utility.
Hattie Winter – Consultant, Customer Experience – Hattie has worked with clients in the utility and banking industries, leading Customer Effort Index assessments. In addition to gathering organizational data she is also instrumental in providing the analysis and methodology development across multiple customer channels. Jack Winter – Sr. Principal, Energy & Utilities - Jack works in our Executive Advisory Services practice and has over 40 years of regulatory, management, operations, and consulting experience, primarily in the North American energy & utility industries. Mr. Winter has worked in every sector of the U.S utility industry and delivered successful engagements that include customer service, operations, and technology improvements.
The Energy and Utility group of West Monroe Partners is pleased to support this exchange of information and brings a significant level of experience to the discussion
2 All

© 2015 West Monroe Partners | Reproduction and distribution without West Monroe Partners prior consent is prohibited.
West Monroe Partners is large enough to tackle our clients’ toughest challenges and nimble enough to adapt to unique requirements with custom solutions.
Established in 2002 Founded by a team from Arthur Andersen,
West Monroe is a full-service strategy, business and technology consulting firm.
People
Over 500 career consultants, confident enough to engage in constructive debate
and understand that it’s okay to disagree.
Organization We are 100% employee owned. We answer
to our people and our clients only.
Global reach but geographically close We serve global clients, locally by partnering
with BearingPoint Europe and Grupo Assa.
3 JW

© 2015 West Monroe Partners | Reproduction and distribution without West Monroe Partners prior consent is prohibited.
I. Introduction
II. Customer Experience Context
III. High- Level Findings
IV. Live Agent
V. IVR
VI. Public Website
VII. Customer Portal
VIII. Questions
Agenda
4 JW

© 2015 West Monroe Partners | Reproduction and distribution without West Monroe Partners prior consent is prohibited.
What is ‘customer experience’, really?
5
^
^
Transferred to new rep; repeats
problem
Helpful, empathetic rep
Confused about billing statement
Confused about how to use
Tries service
Customer experience is simply your customer’s perception of her interactions with your organization.
Customer Perspective
A customer’s journey with your organization may travel across multiple touch points. It differs for each customer and their interactions with each service channel and utility.
Introduction
JW

© 2015 West Monroe Partners | Reproduction and distribution without West Monroe Partners prior consent is prohibited.
Why do utilities care about improving the customer experience?
[6]
We help utilities diagnose and predict customer impacts and trends.
Utilities are responding to a series of changes driven by customer expectations, regulatory emphasis, and new market dynamics Customer-facing programs require customer engagement and participation Regulators focus on storm outage response, reliability, and new services Utility leaders now pay attention to comparative rankings in benchmark studies; poor
performance increases pressure to improve
These changes are already occurring and new ones are in the pipeline. How do utilities engage customers and deliver these new services?
Can we help you prepare and deliver a new standard of service?
Introduction
JW

© 2015 West Monroe Partners | Reproduction and distribution without West Monroe Partners prior consent is prohibited.
West Monroe helps utilities define and improve the customer experience across the entire meter-to-cash process
7
Construct
Customer Architecture Diagram(s)
High Performing Contact Center
Customer Journey Map(s)
Understand
Customer Profiling
Customer Persona Segmentation
Customer Value Segmentation
Diagnose
Customer Insights /
Experience Diagnostic Survey
Industry Customer Experience Maturity Model Benchmarking
Measure
Customer Effort Index
(CEI)
Customer Experience Strategy Framework
Strategic Roadmap
Each of these elements leverages unique tools, methodologies, and insights
CEI
DN

© 2015 West Monroe Partners | Reproduction and distribution without West Monroe Partners prior consent is prohibited.
Have you ever been frustrated when contacting your own cable or telecom provider? Have you ever dialed into your own utility or talked to your own service representatives? How does your utility compare to the worst and the best of customer service providers?
Our Customer Effort Index (CEI) measures the customer’s frustration when interacting with your utility
[8]
West Monroe can help you make it easier for your customers to do business with you. Our Customer Effort Index (CEI) tests each channel and provides a channel-by-channel
analysis of strengths and opportunities to reduce effort and increase satisfaction.
CEI
DN

© 2015 West Monroe Partners | Reproduction and distribution without West Monroe Partners prior consent is prohibited.
Customer Effort Index (CEI) - Benchmarking Overview
9
West Monroe Partners created a scoring model that quantifies the customer experience based on one measure (effort) and designed a program that allows companies to get actionable insight- This study scores the degree of consumer effort required to complete key interactions in a multi-channel environment and compares clients’ scores to WMP’s set of proprietary benchmarks.
Hard, Frustrating Neutral Easy, Effortless
1 2 3 4 5
Customer Effort Index
CEI
DN

© 2015 West Monroe Partners | Reproduction and distribution without West Monroe Partners prior consent is prohibited.
Our recent CEI benchmark offers leading practices, utility rankings, and comparisons to other industries.
10
Leading utility practices
Contact Centers Digital Channels
Self-service bill pay , new customer, and other options
“Sticky” navigation bar, and intuitive pick-list options
Proactive /one-call resolution Historical usage is presented in dashboard or graphical format
Customer follow-up Access to outage information via customer portal
Interaction Channels Top Utility CEI Scores Top Banking CEI Scores
Overall customer effort 3.64 4.92
Live service agent 4.0 5.0
IVR 3.36 5.0
Public website 4.0 4.92
Customer portal 3.55 4.58
High-Level Findings
DN

© 2015 West Monroe Partners | Reproduction and distribution without West Monroe Partners prior consent is prohibited.
Individual channel results show a wide variation and differentiation across all companies
11
High-Level Findings
DN
4.00 3.55 3.36
4.00
1.58 1.29 2.19 2.50
0.00
1.00
2.00
3.00
4.00
5.00
Public Website Customer Portal IVR Live Agent
CEI Summary Scores by Channel
Best
Worst
Average

© 2015 West Monroe Partners | Reproduction and distribution without West Monroe Partners prior consent is prohibited.
Utility A (3.64) • Alert functionality specific to outage information available • Strong “Look and Feel” with easy and intuitive user navigation as well as a high amount of
graphical/dashboard type displays relative to other benchmarks Utility B (3.61)
• Aesthetically pleasing public website and customer portal with global navigation that is intuitive to the customer and presented in a digestible format with majority of key tasks available
Utility C (3.30) • Best practice with features including global/sticky navigation bars and large call to action icons • IVR functionality includes features such as consistent voice and pace throughout, clear
language, and consistent navigation throughout the IVR tree
Utility J (2.69) • Low performing IVR: inability to capture/store customer information; causes user to repeat
information multiple times • Customer Portal: lacks intuitive navigation, key user functions are difficult to access (e.g. how
to modify contact preferences), and auto pay feature is difficult to locate Utility K (2.39)
• Lacks key functionality across channels- specifically, the customer portal functions primarily as an online bill site with little to no other features
Utility L (1.89) • Public Website and Customer Portal is hosted on a municipal site making information difficult
to locate and challenging to navigate
CEI Summary: Top and Bottom of Utility CEI Scores
12
High-Level Findings
DN

© 2015 West Monroe Partners | Reproduction and distribution without West Monroe Partners prior consent is prohibited.
Utility Live Agent Scores
13
2.50
4.00
0.00
1.00
2.00
3.00
4.00
5.00
Live Agent Scores
Live Agent scores range from 4.00 to 2.00. The average scores of public websites was a “3.29”. This channel had the highest channel average.
JW

© 2015 West Monroe Partners | Reproduction and distribution without West Monroe Partners prior consent is prohibited.
Utility Live Agent: High and Low Scores
14
Live Agent Leader
(4.00)
• IVR Routing: IVR had strong routing capabilities and directed users to the correct department/agent with greatest likelihood of customer resolution.
• Pay a Bill: Bill payment is a self-service option feature within the IVR; however, if customer reached live agent before recognizing IVR capability agent was able to transfer customer back to bill pay.
• Customer Follow-Up: Live agent asked for customer call back number/confirmed number upfront in case of customer disconnect. Upon disconnect, customer service representative called user back in timely manner.
Live Agent Follower
(2.50)
• Email Follow Up: Live agents were not able to email users information discussed within call. Instead, representative listed public website link and spoke through navigational queues to the customer in an attempt to address customer question.
• Pay a Bill: Live agents informed users of online bill pay and phone bill pay options but was not able to transfer user to the functions or email bill pay links to customers.
• Update Contact Information: Contact information could be updated via phone however multiple security questions were asked and information had to be repeated by the customer.
JW

© 2015 West Monroe Partners | Reproduction and distribution without West Monroe Partners prior consent is prohibited.
Utility Live Agent Trends
15
Key Trends: Live Agent
Proactive Resolution: • Desire to actively address customer needs • Identify alternative solutions to customer problems • Live agents were knowledgeable about where to get answers Live Agent Rapport/Attitude: • High level of “positive attitude” • Desire to meet all of the customers needs • Infrequent occurrences of unfriendly representatives
Pay a Bill: • Not available via a live agent • Live agent could not complete a direct transfer back to the bill pay number Email Follow Up: • Live agents could not send follow up information to customer emails Inability to Complete Warm Transfer: • Customers had to repeat account information and repeat answers to security questions
JW

© 2015 West Monroe Partners | Reproduction and distribution without West Monroe Partners prior consent is prohibited.
Utility IVR Scores
16
2.19
3.36
0.00
1.00
2.00
3.00
4.00
5.00
IVR Scores
IVR scores range from 3.36 to 2.19. The average score of the IVRs was a 2.94, and the spread of scores was 1.17 points (the lowest deviation amongst scores).
JW
© 2015 West Monroe Partners | Reproduction and distribution without West Monroe Partners prior consent is prohibited.
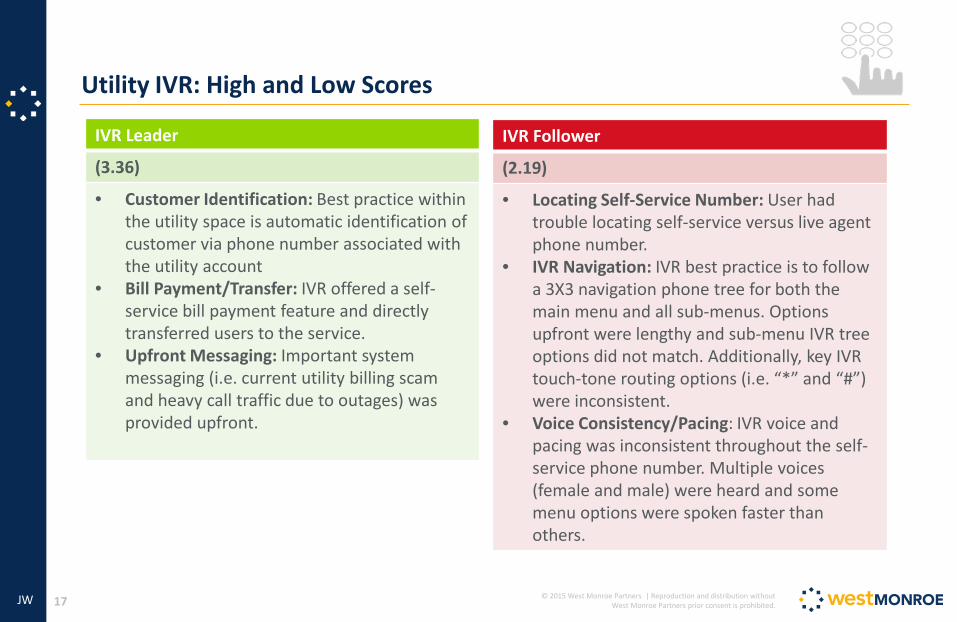
Utility IVR: High and Low Scores
17
IVR Leader
(3.36)
• Customer Identification: Best practice within the utility space is automatic identification of customer via phone number associated with the utility account
• Bill Payment/Transfer: IVR offered a self-service bill payment feature and directly transferred users to the service.
• Upfront Messaging: Important system messaging (i.e. current utility billing scam and heavy call traffic due to outages) was provided upfront.
IVR Follower
(2.19)
• Locating Self-Service Number: User had trouble locating self-service versus live agent phone number.
• IVR Navigation: IVR best practice is to follow a 3X3 navigation phone tree for both the main menu and all sub-menus. Options upfront were lengthy and sub-menu IVR tree options did not match. Additionally, key IVR touch-tone routing options (i.e. “*” and “#”) were inconsistent.
• Voice Consistency/Pacing: IVR voice and pacing was inconsistent throughout the self-service phone number. Multiple voices (female and male) were heard and some menu options were spoken faster than others.
JW

© 2015 West Monroe Partners | Reproduction and distribution without West Monroe Partners prior consent is prohibited.
Utility IVR Trends
18
Key Trends: IVR
Zero-out and menu skipping functionality: • Able to speak to a rep directly and/or skip listening to the entire IVR menu IVR Tolerance for Information Entry: • Tolerant of time it takes users to enter this information • Did not repeat request for information too quickly
Speech Recognition: • Readily available with 8% of benchmark utilities • Helpful when entering lengthy/detailed information such as 15 digit plus account numbers Customer Information Pre-Populated/customer recognition: • 33% of benchmark utilities immediately recognize users via phone number associated with account • Eliminates many of the upfront blockers associated with IVR self-service FAQ Accessibility: • Not available within any of the benchmark utilities
JW

© 2015 West Monroe Partners | Reproduction and distribution without West Monroe Partners prior consent is prohibited.
Utility Public Website Scores
19
1.58
4.00
0.00
1.00
2.00
3.00
4.00
5.00
Public Website Scores
Best
Worst
Public website scores range from 4.00 to 1.58. The average score of public websites was a 3.22. Public website CEI scores had the highest delta between the lowest and highest score with a difference of 2.42.
DN

© 2015 West Monroe Partners | Reproduction and distribution without West Monroe Partners prior consent is prohibited.
Utility Public Website: High and Low Scores
20
Public Website Leader
(4.00)
• Website Navigation: Best practices including a sticky navigation bar, and intuitive pick-list options were used throughout the site. Additionally users had to click-thru a minimal number of pages to reach desired information.
• Outage Information: Outage information was easy to locate with large call to action buttons accessible directly on the homepage. Outage maps were well integrated into the public website and easy to use/understand.
• Email Resolution: Email resolution SLA was established upfront and customers were answered in a timely manner. Email support was clear with links directly to information in question as well as supporting images etc.
Public Website Follower
(1.58)
• Customer Portal Login: The Customer Portal login access was difficult to locate.
• Start/Stop Service Functionality: Key tasks such as a start/stop service online wizard was not available through the customer portal and users were instead required to call in to the customer rep to enable/disable service.
• Locate Customer Service Information: Specific customer service information was readily accessible to users within the main utility page hosted within the municipality website. However multiple numbers were listed for users and it was unclear which number reached self-serve versus live agent options.
DN

© 2015 West Monroe Partners | Reproduction and distribution without West Monroe Partners prior consent is prohibited.
Utility Public Website Trends
21
Key Trends: Public Website
Accessibility to customer portal login: • Available in almost all public websites Payment options: • Readily accessible in the majority of websites • Navigation language was intuitive • Minimal number of page clicks was required to locate detailed information regarding different payment types. Starting/stopping services: • Readily available • Quickly locate right information • Clear which channels users should pursue to establish or stop service
Chat functionality: • Zero benchmark utilities offer chat functionality General alert capability: • 16% of benchmark utilities offer alert functionality (specific to outage information via SMS) Email resolution: • Email forms are generally difficult to use • Slow/unclear resolution to the customer question
DN

© 2015 West Monroe Partners | Reproduction and distribution without West Monroe Partners prior consent is prohibited.
Utility Customer Portal Scores
22
1.29
3.55
0.00
1.00
2.00
3.00
4.00
5.00
Customer Portal Scores
Customer Portal scores range from 3.55 to 1.29. The customer portal channel had the lowest average scores across all channels at “2.77”.
DN

© 2015 West Monroe Partners | Reproduction and distribution without West Monroe Partners prior consent is prohibited.
Utility Customer Portal: High and Low Scores
23
Customer Portal Leader
(3.55)
• Statement accessibility and download: Statement information is easy to locate and statements available date back greater than six months. Download capability is offered in both PDF and Excel formats and information within the statements is presented in an easily digested format.
• Track Historical Usage: Historical usage is presented in dashboard/graphical format.
• Access to Outage Information : A link to outage information is available via the customer portal.
Customer Portal Follower
(1.29)
• Report Outage/Submit Service Request: Users are unable to report an outage and/or submit a service request through customer portal and instead must call into 311, emergency, or live rep number.
• Contact Customer Service: Customer service information is difficult to locate and multiple numbers with unclear purposes are presented.
• Start/Stop Service: A start/stop service enable/disable feature is not available to users within the customer portal.
DN

© 2015 West Monroe Partners | Reproduction and distribution without West Monroe Partners prior consent is prohibited.
Utility Customer Portal Trends
24
Key Trends: Customer Portal Start/Stop/Transfer Services:
• 80% provide a start/stop/transfer service feature within the customer portal • Clear call to actions for users • Easy start/stop/transfer “wizards” pre-populated customer information • Easy 3-5 step navigation to complete and/or notify the utility of user interest Access Customer Service: • Customer service/contact information was present in the majority of public websites
Track Historical Usage: • Inability to view historical usage further back than 6 months • Inability to and view the data in a dashboard/graphical type format • Lack of intuitive navigation labels (i.e. historical usage vs bill history)
Alerts & Outage Information/reporting problem: • Portals did not specifically highlight outages pertinent to the logged in customer Billing & Payment: • Not all utilities provided easy to navigate billing and payment features • 3rd party systems often result in convenience charges which were not always explicitly stated • Integration of the systems was confusing to users (opening in separate windows, etc.)
DN

© 2015 West Monroe Partners | Reproduction and distribution without West Monroe Partners prior consent is prohibited.
We help you understand each step of the customer experience from the customer’s perspective and how they relate to operations.
25
C C
C
C C
C
C
C
C C
Front office
Back office C
C
C C
^
^
Transferred to new rep; repeats
problem
Helpful, empathetic rep
Confused about billing statement
Confused about how to use
Tries service
Company Operations
Customer Journey
Customer Perspective
Company Perspective
C –Capabilities
Conclusions
DN

© 2015 West Monroe Partners | Reproduction and distribution without West Monroe Partners prior consent is prohibited.
Dimension/ Level Developing Foundational Advanced Optimized
Customer Experience Vision & Strategy
Customer Data Management
Customer Insights
Customer Experience Optimization
We can work with your leadership team to update the Customer Experience Vision and Strategy
Conclusions
DN

© 2015 West Monroe Partners | Reproduction and distribution without West Monroe Partners prior consent is prohibited.
We also use data-driven analytics to improve key processes, shorten decision times, and understand customer trends
27
Customer Information Management Gathering a data-based, integrated complete customer view from all
interactions and across all touch-points
Customer Insights – Leveraging Analytics and Segmentation Gaining analytic-based insights into customers to gain competitive advantage
Optimizing Customer Experience - Customer Insights Delivery Leveraging insights and enabling technologies across all touch-points to optimize the customer experience and make it effortless and seamless
Customer Experience Diagnostic >
Conclusions
DN

© 2015 West Monroe Partners | Reproduction and distribution without West Monroe Partners prior consent is prohibited.
We can help you improve the customer experience across the entire company, or target specific scenarios or capabilities.
28
C
C C
C C
C
Front office
Back office C
C C
^
^
Transferred to new rep; repeats
problem
Helpful, empathetic rep
Confused about billing statement
Confused about how to use
Tries service
Customer Perspective
Company Perspective
2) Improve customer experience for a specific scenario (e.g. onboarding; bill
payment)
1) Develop meter-to-cash customer experience capabilities
3) Improve a capability that impacts the customer experience (e.g. contact center, digital)
C C C C C
Conclusions
DN

© 2015 West Monroe Partners | Reproduction and distribution without West Monroe Partners prior consent is prohibited.
Our approach is to DEEPEN the customer experience and leverage industry best practices tailored for our clients
29
Develop a roadmap. Determine options to buy, rent, build, re-configure or eliminate capabilities.
Design & build. Operationalize CX vision through people, process, technology, and change management.
Assess current state. Understand experience and operational environment through a customer lens.
Align on a future state. Use customer insights to create future experience and target operating model.
Strategic alignment. Align customer goals with company objectives.
Define Empathize Envision Plan Enact
Conclusions
DN

Thank You
Dave Nash Customer Experience
Chicago, IL [email protected]
Jack Winter Energy & Utilities
Chicago, IL [email protected]
DN