Embed Size (px)
Citation preview

B u s i n e s s C o n t i n u i t y I n s t i t u t eCOUNTING THE COSTA Meta-analysis of the cost of ineffective business continuity
Business ContinuityInstitute

ABOUT THE AUTHORPatrick Alcantara is a Research Associate for the Business
Continuity Institute (BCI). In this role, he strengthens the BCI’s global thought leadership in business continuity through relevant studies. Prior to the BCI, he has worked in the education sector. He completed a Masters in Lifelong Learning with distinction from the Institute of Education, University of London and Deusto University.
For more questions about this report, contact him at [email protected]

Executive Summary 3
Introduction 4
IT/Telecommunications Outage 6 Data Breach/Cyber Attack 10 Adverse Weather 17
Conclusion And Recommendations 23How The BCI Can Help 24
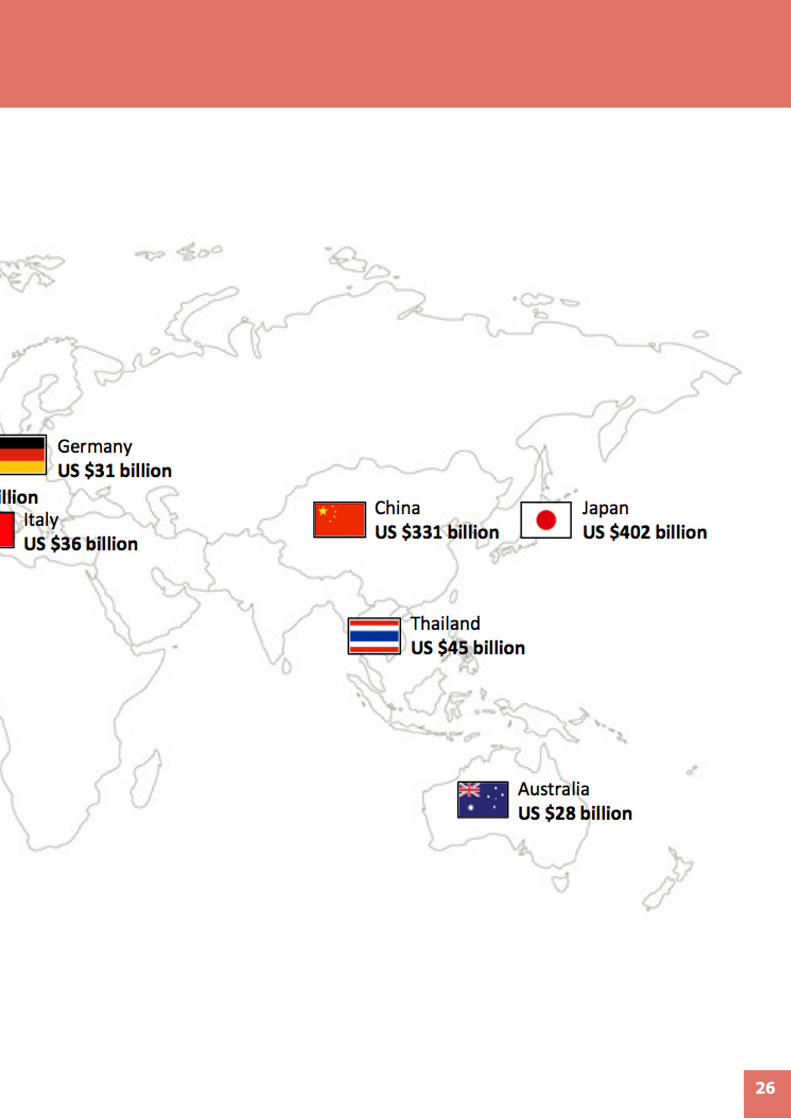
Figure 16. Cost Of Adverse Weather And Natural Disasters, 1992-2010 25
CONTENTS
EXECUTIVE SUMMARY
INTRODUCTION
COUNTING THE COST
CONCLUSION AND RECOMMENDATIONS
APPENDIX
On the occasion of the Business Continuity Awareness Week 2014, we are pleased to present this special report focusing on the cost of common threats to an organisation: IT and telecommunications outage, data breach and cyber attacks, and adverse weather conditions. This report draws upon the insights of earlier BCI studies such as the 5th Annual Survey on Supply Chain Resilience (2013) and the BCI Horizon Scan (2014). As a meta-analysis of available literature, it also draws upon various reports and cost estimates.
The objective of this report is simple. We want to drive home the message that business continuity (BC) is not the sole domain of an organisation’s BC professional. Ensuring an effective, robust BC programme is also the responsibility of management, budget holders and the rest of staff. In a time where cutting budgets is the norm, and BC-related expenses are often one of the first to go, it is important to be reminded of the cost of being caught flat-footed in an incident. The false economy created by cutting down on business continuity may create bigger problems that may impact on organisational resilience and viability.
The key takeaways from this report are the following:
• According to a recent IBM study on professionals dependent on high-availability IT, the cost of an IT/telecommunications outage can vary from US$1.04 million to US$14.25 million over 24 months. Minor incidents, on average, cost US$53,210 per minute of downtime. Further losses due to reputation-related costs can add up to US$5.27 million for substantial incidents.
• Analysis by the Ponemon Institute reveals that the average cost of data breach and cyber attacks stands at an average of US$11.6 million annually. Organisations report costs ranging from US$1.3 million to US$58 million to resolve these incidents. Case studies reveal staggering losses of up to US$4 billion due to severe incidents of data breach and cyber attack.
• A Munich Re report shows that combined household and corporate insurance payouts for weather-related damage in the United States alone cost US$12.8 billion in 2013. Extreme weather phenomena have increased the severity of damage and value of insurance claims. The recent BCI Supply Chain Resilience Survey has also revealed that adverse weather is a top driver of supply chain disruption, with serious consequences for companies that experience an incident.
The purpose of this study is to quantify the financial impact of these common threats, and build the case for strengthening an organisation’s BC programme. Nonetheless, it is important to note that as our figures are rough estimates of the actual cost of disruption, organisations are highly encouraged to think about their specific context in order to arrive at more appropriate data. In the end, we aim to start a conversation among organisations and budget holders using readily understood and comparable data in order to maintain BC investment.
EXECUTIVE SUMMARY
3

Business continuity (BC) goes at the heart of every enterprise. Having in place an effective BC management programme can spell the difference between organisational resilience and financial ruin. With incidents having a greater impact than before, it is essential to any organisation to become proactive through an effective programme.
We are publishing this report as an urgent reminder to all that BC is not the exclusive domain of specialists. In order to remain resilient amidst disaster, entire organisations have to get on board. Management must exercise decisive leadership and think in terms of strengthening organisational resilience. Budget holders must invest in moving the resilience agenda forward. Rank and file employees must remain vigilant, keeping in mind that their organisation’s strength is a collective responsibility.
We strongly argue that having an ineffective BC management programme can cost an organisation dearly. A single incident can cost an organisation millions and can demolish its reputation. Figures show that 40%-60% of businesses without a BC plan never reopen after a significant incident, and the response for the first 10 days are critical to survival1.
This report reviews existing literature, and puts together a more comprehensive account of the costs associated with gaps in an organisation’s BC strategy. Drawing upon the findings of the BCI’s Horizon Scan 2014, we count the cost of failure to meet urgent threats: (1) IT or telecommunications outage, (2) data breach or cyber attack, and (3) adverse weather conditions.
In drafting this report, we acknowledge that costs arising from incidents are often difficult to quantify. The data we present in the following sections are rough and imperfect estimates at best. We acknowledge the following limitations in drafting this report:
• The importance of context: The following figures are mostly estimates that apply primarily to organisations that rely heavily on technology or are vulnerable to weather-related incidents (eg. flooding, etc.). It is important to note that these are merely ballpark figures, and organisations have to think in terms of their context (country/region, industry sector, nature of operation) in order to arrive at an appropriate result.
• Non-statisticalresults: This report aims to be descriptive rather than normative. The figures cited come from surveys conducted by the BCI and other organisations (eg. IBM, Ponemon Institute, etc.), which also acknowledge the same limitations. Hence, statistical inferences cannot be applied to this data.
4
INTRODUCTION
1. Open Access BPO (2013). The cost of not having a business continuity plan. Retrieved from http://visual.ly/business-disaster-preparation.

5
• Estimatedcostresults: The report cites costs that are based from the judgment of professionals who participated in surveys commissioned by other institutions. Hence, these might vary from actual cost data.
Given these limitations, it is nonetheless clear that being caught flat-footed in an incident would require
expensive and time-consuming solutions that do little to contain reputational damage. Our message is simple: ensuring a robust response will cost less than damage control. This is a theme that we will revisit several times in this report, and we hope to convince the wider organisation that BC is everybody’s concern.

A recent BCI study found that 77% of professionals are concerned about the effects of unplanned IT or telecommunications outage2, making it the top perceived threat for organisations. This is a valid concern, as unplanned outages cost millions in terms of deploying solutions, lost productivity and reputational damage3. For organisations in sectors that rely heavily on the high availability of IT (eg. banking and finance, IT and communication, some professional services, etc.), unplanned outages can significantly disrupt operations. IT systems that have 99.5% reliability are still expected to suffer 44 hours of downtime in a year4. This can wreak havoc on organisations that rely heavily on this technology.
A recent IBM study focusing on IT and security professionals confirm this5. By categorising disruptions from minor to substantial, it was observed that the down time associated with these incidents can range from an average of 19.7 to 442.3 minutes (Figure 1). 69% of organisations anticipate having one or more minor incidents occurring within 24 months, whilst 23% expect substantial disruptions occurring within that period (Figure 2), reflecting a wide concern.
2. Scott, A. (2014). BCI Horizon Scan 2014. Caversham, UK: Business Continuity Institute. 3. IBM Global Technology Services (2013a). The economics of IT risk and reputation: What business continuity and IT security really mean to your organisation. Portsmouth, UK: IBM. 4. http://venturebeat.com/2012/11/14/the-high-cost-of-server-downtime-infographic/5. IBM Global Technology Services (2013a). The economics of IT risk and reputation: What business continuity and IT security really mean to your organisation. Portsmouth, UK: IBM.
COUNTING THE COST:IT/ TELECOMMUNICATIONS OUTAGE
6
Figure 1. Average minutes of down time for minor, moderate and substantial disruptions (IBM Global Technology Services, 2013a)
Figure 2. Estimated likelihood of disruptions over the next 24 months (IBM Global Technology Services, 2013a)
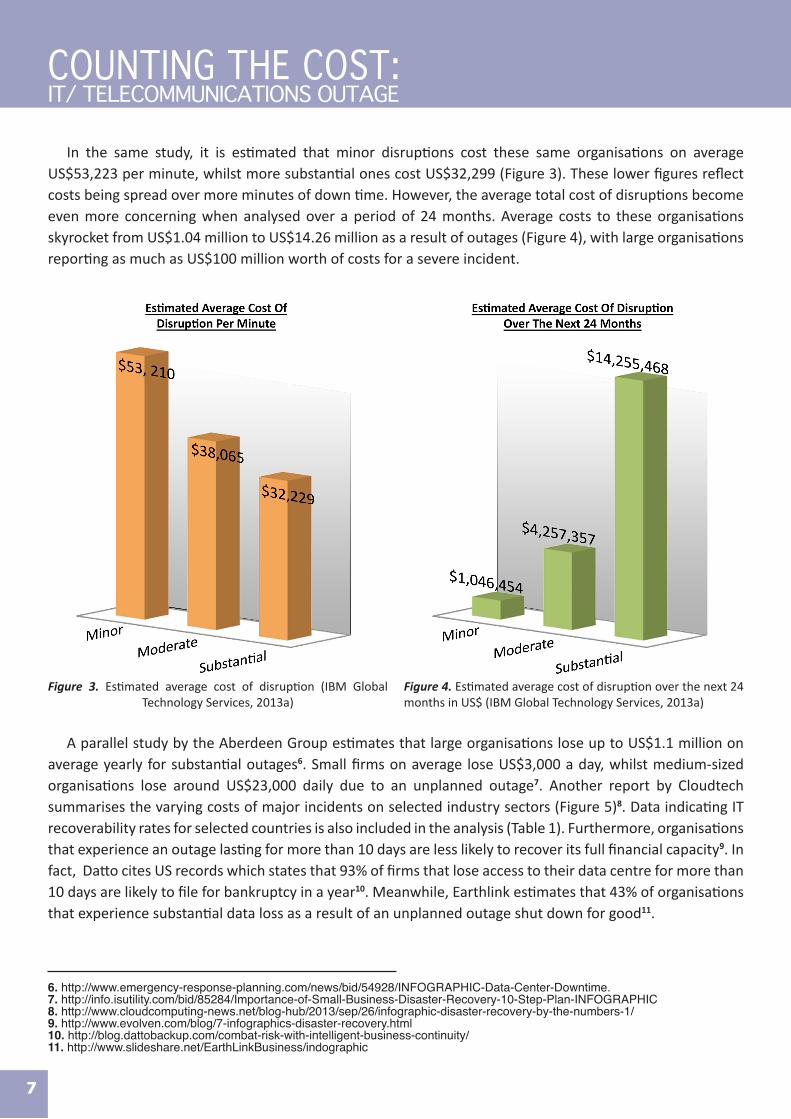
In the same study, it is estimated that minor disruptions cost these same organisations on average US$53,223 per minute, whilst more substantial ones cost US$32,299 (Figure 3). These lower figures reflect costs being spread over more minutes of down time. However, the average total cost of disruptions become even more concerning when analysed over a period of 24 months. Average costs to these organisations skyrocket from US$1.04 million to US$14.26 million as a result of outages (Figure 4), with large organisations reporting as much as US$100 million worth of costs for a severe incident.
6. http://www.emergency-response-planning.com/news/bid/54928/INFOGRAPHIC-Data-Center-Downtime.7. http://info.isutility.com/bid/85284/Importance-of-Small-Business-Disaster-Recovery-10-Step-Plan-INFOGRAPHIC8. http://www.cloudcomputing-news.net/blog-hub/2013/sep/26/infographic-disaster-recovery-by-the-numbers-1/9. http://www.evolven.com/blog/7-infographics-disaster-recovery.html10. http://blog.dattobackup.com/combat-risk-with-intelligent-business-continuity/11. http://www.slideshare.net/EarthLinkBusiness/indographic
7
Figure 3. Estimated average cost of disruption (IBM Global Technology Services, 2013a)
Figure 4. Estimated average cost of disruption over the next 24 months in US$ (IBM Global Technology Services, 2013a)
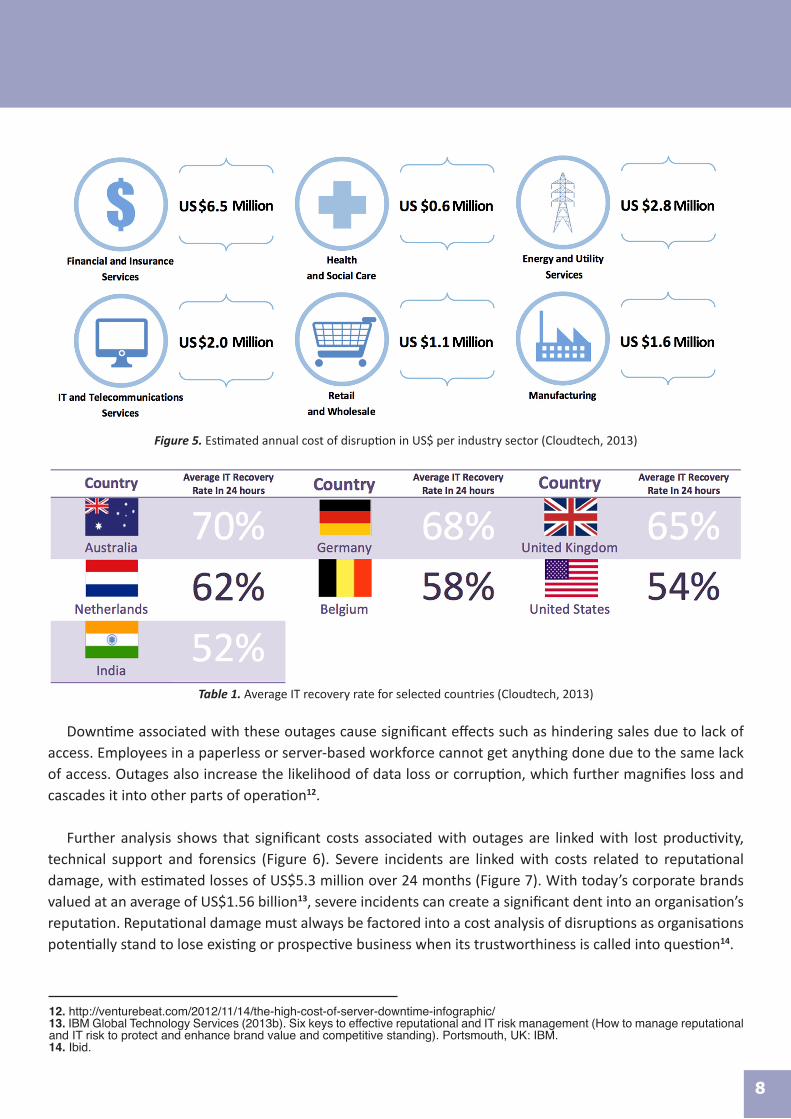
A parallel study by the Aberdeen Group estimates that large organisations lose up to US$1.1 million on average yearly for substantial outages6. Small firms on average lose US$3,000 a day, whilst medium-sized organisations lose around US$23,000 daily due to an unplanned outage7. Another report by Cloudtech summarises the varying costs of major incidents on selected industry sectors (Figure 5)8. Data indicating IT recoverability rates for selected countries is also included in the analysis (Table 1). Furthermore, organisations that experience an outage lasting for more than 10 days are less likely to recover its full financial capacity9. In fact, Datto cites US records which states that 93% of firms that lose access to their data centre for more than 10 days are likely to file for bankruptcy in a year10. Meanwhile, Earthlink estimates that 43% of organisations that experience substantial data loss as a result of an unplanned outage shut down for good11.
COUNTING THE COST:IT/ TELECOMMUNICATIONS OUTAGE
12. http://venturebeat.com/2012/11/14/the-high-cost-of-server-downtime-infographic/13. IBM Global Technology Services (2013b). Six keys to effective reputational and IT risk management (How to manage reputational and IT risk to protect and enhance brand value and competitive standing). Portsmouth, UK: IBM.14. Ibid.
8
Figure 5. Estimated annual cost of disruption in US$ per industry sector (Cloudtech, 2013)
Table 1. Average IT recovery rate for selected countries (Cloudtech, 2013)
Downtime associated with these outages cause significant effects such as hindering sales due to lack of access. Employees in a paperless or server-based workforce cannot get anything done due to the same lack of access. Outages also increase the likelihood of data loss or corruption, which further magnifies loss and cascades it into other parts of operation12.
Further analysis shows that significant costs associated with outages are linked with lost productivity, technical support and forensics (Figure 6). Severe incidents are linked with costs related to reputational damage, with estimated losses of US$5.3 million over 24 months (Figure 7). With today’s corporate brands valued at an average of US$1.56 billion13, severe incidents can create a significant dent into an organisation’s reputation. Reputational damage must always be factored into a cost analysis of disruptions as organisations potentially stand to lose existing or prospective business when its trustworthiness is called into question14.

For other organisations in sectors less dependent on high-availability IT solutions (eg. small and medium sized enterprises, transport and storage, manufacturing, etc.), it can be assumed that losses due
to these incidents may be significantly lower. This is due to the nature of their work, which can adopt low-technology yet efficient strategies (eg. taking orders on paper, deploying power generators, etc.) which prolong the timeframe before significant disruption occurs. Whilst they may face lower costs associated to IT and telecommunications disruption, it does not completely eliminate the need to mount a robust BC programme. It is essential to note that BC programmes do not entirely rely on building sophisticated IT or telecom infrastructure, but imparting preparedness into an entire organisation. However, regardless of dependence on IT and telecommunications, organisations still face reputational risks given significant disruption. Given reputational risks and cost of damage control, it becomes evident that prevention is much better – and cheaper – than the cure.
9
Figure 6. Estimated allocation of total costs associated with a minor, moderate and substantial disruption (IBM Global Technology Services, 2013a)
Figure 7. Estimated allocation of reputation-related costs associated with a minor, moderate and substantial disruption over the next 24 months (IBM Global Technology Services, 2013a)
COUNTING THE COST:IT/ TELECOMMUNICATIONS OUTAGE

In the BCI Horizon Scan 2014, 73% of respondents reported concern over the threat of data breach and cyber attack. This is understandable given today’s context. With sensitive customer information, intellectual property and the control of key machinery increasingly found in electronic formats15, the potential damage caused by data breach or a cyber attack can prove devastating. This is more evident in organisations that rely on data and use sensitive customer information in their transactions, such as the financial, retail, and IT/communication sectors. This also applies to finance departments in other sectors that deal with similar data.
A study by Shred-It reveals that approximately 1 billion records have been compromised over the last eight years alone16. Data breaches cause 80% of small firms to report bankruptcy or severe financial losses 24 months after the incident17. According to Forrester Research, a security breach can cost an organisation US$90-350 per lost record18. Actual data reveals even greater figures. A lawsuit filed against the US Department of Veterans Affairs over a recent breach demanded damages worth US$1,000 for each record lost, taking the claim to a staggering US$26.5 billion if awarded by the courts19.
Organisations experiencing substantial data breaches might even be subject to fines from regulators if found guilty of negligence. An Institute for Risk Management survey reveals that fines may range from <£50,000 (US$81,685) to >£250,000 (US$408,425) for British organisations who have their data breached to the detriment of the public20. In different countries, significant incidents may also be subject to fines by regulators (Table 2). In addition to the cost of damage control and regaining an organisation’s reputation, fines add to a mounting bill that cannot be ignored.
15. IBM Institute for Business Value (2011). Managing threats in the digital age. Somers, New York: IBM.16. http://www.emergency-response-planning.com/news/?BBPage=1&Tag=Business%20Continuity17. ibid.18. http://www.evolven.com/blog/7-infographics-disaster-recovery.html19. ibid.20. Hillyer, M. (2014). The iceberg impact of a cyber loss in: Alison, A. et al. (Auth.) Cyber Risk: Resources for Practitioners (pp. 29-38). London, UK: The Institute of Risk Management.
10
COUNTING THE COST:DATA BREACH/CYBER ATTACK
Table 2. Data protection fines for selected countries (Hillver, 2014)

21. IBM Global Technology Services (2013a). The economics of IT risk and reputation: What business continuity and IT security really mean to your organisation. Portsmouth, UK: IBM. 22. Scott, A. (2014). BCI Horizon Scan 2014. Caversham, UK: Business Continuity Institute.23. Ibid.
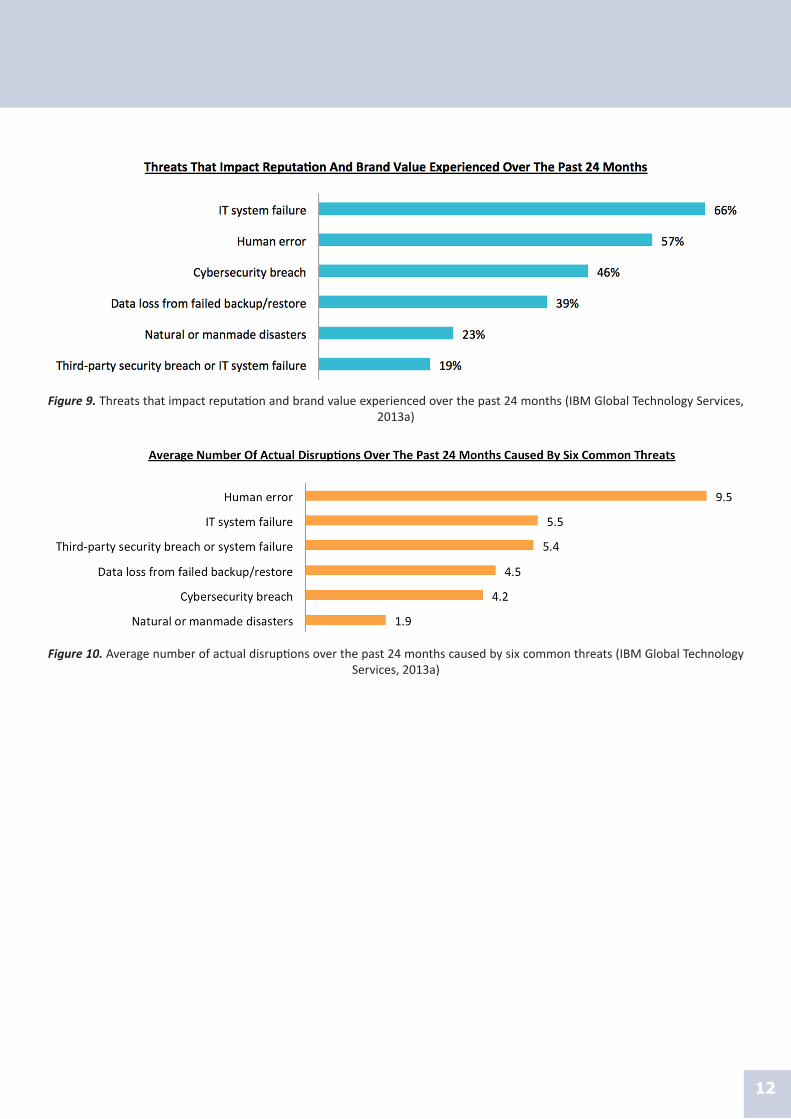
Meanwhile, an IBM study ranks cyber attacks high up in terms of economic impact (Figure 8)21. This concern is reflected by the latest BCI Horizon Scan which reveals that 73% of professionals report monitoring the use of the Internet for malicious attacks in their BCM plans22. 46% of professionals belonging to organisations with significant IT infrastructure also reported experiencing a major cyber security breach in the last 24 months23 (Figure 9). An average of 4.2 actual disruptions was reported as a cause of a cyber security breach over the past 24 months by the same respondents (Figure 10). A further analysis of this figure reveals that a similar incident can be expected to occur once in every six months.
11
Table 2. Data protection fines for selected countries (Hillver, 2014) (Contin)
Figure 8. Common threats ranked in terms of economic impact (IBM Global Technology Services, 2013a)
COUNTING THE COST:DATA BREACH/CYBER ATTACK
12
Figure 9. Threats that impact reputation and brand value experienced over the past 24 months (IBM Global Technology Services, 2013a)
Figure 10. Average number of actual disruptions over the past 24 months caused by six common threats (IBM Global Technology Services, 2013a)

24. http://www.londonlovesbusiness.com/business-news/tech/terrifying-infographic-shows-cyberattack-risk-to-your-businesse/3024.article
13
Another study conducted by the Ponemon Institute points to even higher numbers, with companies surveyed reporting two attacks every week. Common attacks involve malicious code, denial of service and web-based attacks (Figure 11). American companies are most likely to experience the most costly types of attacks (ie. malicious code, denial of service) according to the same study. The following data show the top countries (Table 3) and industry sectors (Figure 12) affected by cyber attacks24.
Figure 11. Types of cyber attacks reported by organisations (Ponemon Institute, 2013)
Table 3. Share of cyber attacks, by top countries (London Loves Business, 2011)
Figure 12. Share of cyber attacks, by industry sector (London Loves Business, 2011)
COUNTING THE COST:DATA BREACH/CYBER ATTACK

14
Figure 13. Figures pertaining to social media ubiquity (CRI Group, 2014)
The ubiquity of social media has now made it into a legitimate target for hackers and criminal elements, which is reflected by the shifting medium of cyber attacks from individual computers to social media accounts25. A CRI Group study26 reveals the potential of launching attacks from social media due to the sheer number of accounts (Figure 13), and the inability to keep up with cybercriminals. A good example is the hijacking of the Associated Press Twitter account in 2013, which falsely reported an explosion at the White House27. This sent American stock markets plunging, with the S&P 500 estimated to have temporarily lost US$136.5 billion in market capitalisation. Foreign exchange markets also reported significant losses in value due to the incident. This potentially disruptive nature of social media is confirmed by the BCI Horizon Scan which reveals that 63% of professionals are concerned about its negative influence28.
25. http://www.emergency-response-planning.com/news/bid/46374/INFOGRAPHIC-Shifting-Digital-Threats-to-Business-Continuity26. Anjum, Z. (2014). Risks of cybercrime and social media. London, UK: CRI Group.27. http://www.cnbc.com/id/10064619728. Scott, A. (2014). BCI Horizon Scan 2014. Caversham, UK: Business Continuity Institute.
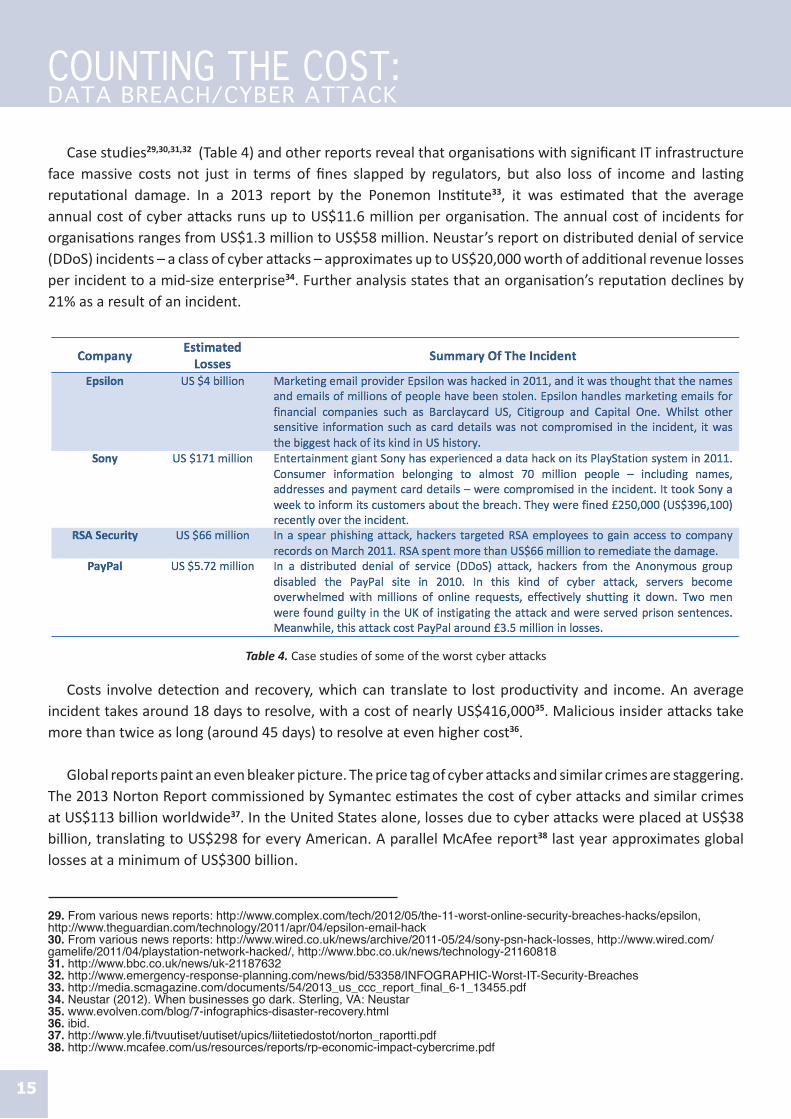
Case studies29,30,31,32 (Table 4) and other reports reveal that organisations with significant IT infrastructure face massive costs not just in terms of fines slapped by regulators, but also loss of income and lasting reputational damage. In a 2013 report by the Ponemon Institute33, it was estimated that the average annual cost of cyber attacks runs up to US$11.6 million per organisation. The annual cost of incidents for organisations ranges from US$1.3 million to US$58 million. Neustar’s report on distributed denial of service (DDoS) incidents – a class of cyber attacks – approximates up to US$20,000 worth of additional revenue losses per incident to a mid-size enterprise34. Further analysis states that an organisation’s reputation declines by 21% as a result of an incident.
29. From various news reports: http://www.complex.com/tech/2012/05/the-11-worst-online-security-breaches-hacks/epsilon, http://www.theguardian.com/technology/2011/apr/04/epsilon-email-hack30. From various news reports: http://www.wired.co.uk/news/archive/2011-05/24/sony-psn-hack-losses, http://www.wired.com/gamelife/2011/04/playstation-network-hacked/, http://www.bbc.co.uk/news/technology-2116081831. http://www.bbc.co.uk/news/uk-2118763232. http://www.emergency-response-planning.com/news/bid/53358/INFOGRAPHIC-Worst-IT-Security-Breaches33. http://media.scmagazine.com/documents/54/2013_us_ccc_report_final_6-1_13455.pdf34. Neustar (2012). When businesses go dark. Sterling, VA: Neustar35. www.evolven.com/blog/7-infographics-disaster-recovery.html36. ibid.37. http://www.yle.fi/tvuutiset/uutiset/upics/liitetiedostot/norton_raportti.pdf38. http://www.mcafee.com/us/resources/reports/rp-economic-impact-cybercrime.pdf
15
Table 4. Case studies of some of the worst cyber attacks
Costs involve detection and recovery, which can translate to lost productivity and income. An average incident takes around 18 days to resolve, with a cost of nearly US$416,00035. Malicious insider attacks take more than twice as long (around 45 days) to resolve at even higher cost36.
Global reports paint an even bleaker picture. The price tag of cyber attacks and similar crimes are staggering. The 2013 Norton Report commissioned by Symantec estimates the cost of cyber attacks and similar crimes at US$113 billion worldwide37. In the United States alone, losses due to cyber attacks were placed at US$38 billion, translating to US$298 for every American. A parallel McAfee report38 last year approximates global losses at a minimum of US$300 billion.
COUNTING THE COST:DATA BREACH/CYBER ATTACK

16
It must be noted that these figures are more appropriate for organisations with a high dependence on IT for their operations. Predictably, these same organisations bear the brunt of global economic losses attributable to cyber attacks. Significantly lower losses can be estimated to organisations in other sectors that rely on workforce expertise (eg. engineering and construction, manufacturing, etc.). It may also be the case for other sectors which rely on other inputs (eg. mining and quarrying, agriculture/forestry/fishing, etc.). In these sectors, the susceptibility for sophisticated forms of data breach and cyber attack is low. Nonetheless, these organisations still hold physical data in terms of employee records, client details and financial statements that may be compromised through less technologically sophisticated means (eg. employees leaking data, burglary, etc.).
Even for organisations with some IT infrastructure, damage caused by data breach and cyber attack is mitigated by other parts of their operations that are not as data-dependent. However, it would not be wise to dismiss deploying good IT perimeter security and involving employees in safeguarding sensitive data, as an incident can still create significant disruption. Even as the data from the reports vary, the message is clear: data breach and cyber attacks cost money. Organisations cannot simply opt not having an effective BC programme which can respond to these threats.

The most recent BCI study reveals that 57% of professionals are concerned about the effects of adverse weather to their business39. Whilst many sectors, with the exception of agriculture and tourism, are not highly weather-dependent, adverse weather conditions can cause significant disruption and losses. In a report by insurer Munich Re, combined household and corporate insured losses in the United States totalled US$12.8 billion in 201340, with four incidents resulting to at least a billion dollars worth of claims41. Situating this against overall trends since 1980, insured losses have been on an upward track (Figure 14), due to the doubling of extreme weather events during the same period42 (Figure 15).
17
COUNTING THE COST:A D V E R S E W E A T H E R
39. Scott, A. (2014). BCI Horizon Scan 2014. Caversham, UK: Business Continuity Institute.40. http://www.iii.org/assets/docs/pdf/MunichRe-010714.pdf41. Ibid. 42. http://www.iii.org/assets/docs/pdf/MunichRe-010412.pdf
Figure 14. Loss events in the United States (overall and insured losses), 1980-2013 (Munich Re, 2014)
Figure 15. Loss events in the United States (number of events), 1980-2013 (Munich Re, 2014)
18
COUNTING THE COST:A D V E R S E W E A T H E R
Available data from the United Nations Office for Disaster Risk Reduction (UNISDR) also shows the staggering cost of adverse weather and other natural disasters from 1992 to 2010 (Figure 16, please refer to the appendix)43. Total damages worldwide during that period were estimated at a whopping US$2.0 trillion for an average of US$111.11 billion yearly. The entire amount lost to adverse weather and natural disasters is enough to fund global development aid for 25 years44. The three largest economies (United States, China and Japan) account for 64% of total costs (US$1.29 trillion) due to their exposure to adverse weather and other natural hazards. This is almost equivalent to Spain’s entire 2012 GDP (US$1.32 trillion)45.
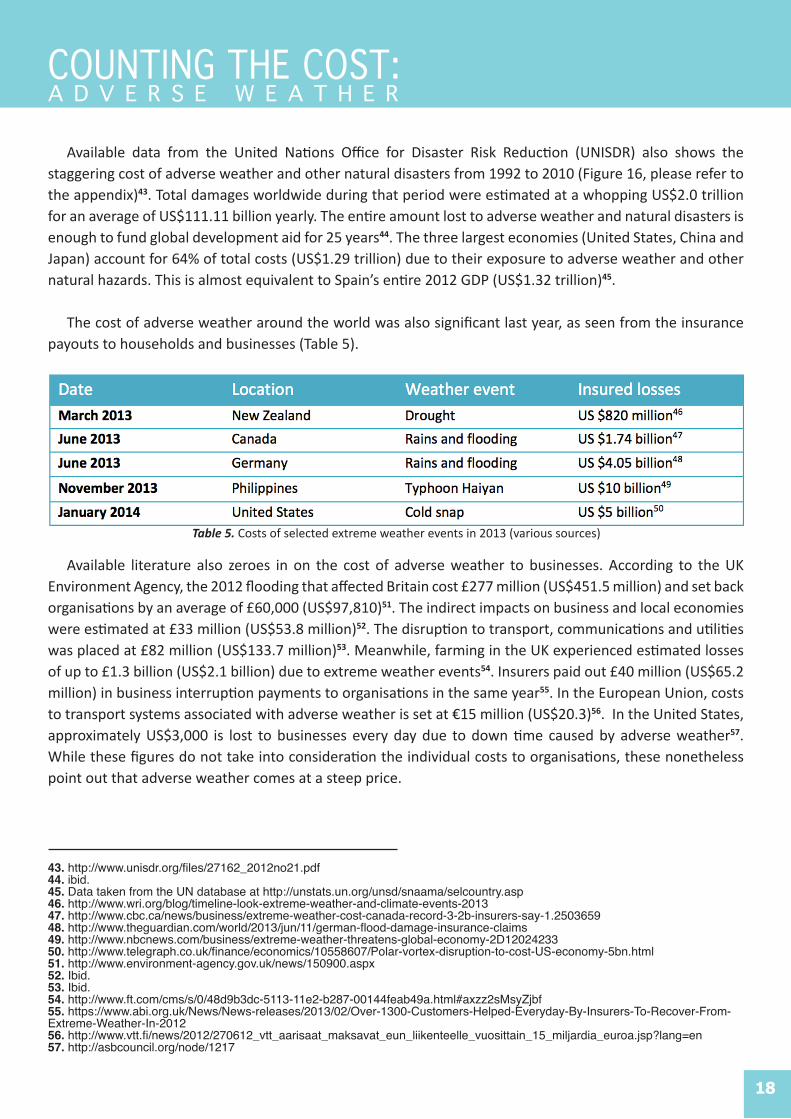
The cost of adverse weather around the world was also significant last year, as seen from the insurance payouts to households and businesses (Table 5).
Table 5. Costs of selected extreme weather events in 2013 (various sources)
Available literature also zeroes in on the cost of adverse weather to businesses. According to the UK Environment Agency, the 2012 flooding that affected Britain cost £277 million (US$451.5 million) and set back organisations by an average of £60,000 (US$97,810)51. The indirect impacts on business and local economies were estimated at £33 million (US$53.8 million)52. The disruption to transport, communications and utilities was placed at £82 million (US$133.7 million)53. Meanwhile, farming in the UK experienced estimated losses of up to £1.3 billion (US$2.1 billion) due to extreme weather events54. Insurers paid out £40 million (US$65.2 million) in business interruption payments to organisations in the same year55. In the European Union, costs to transport systems associated with adverse weather is set at €15 million (US$20.3)56. In the United States, approximately US$3,000 is lost to businesses every day due to down time caused by adverse weather57. While these figures do not take into consideration the individual costs to organisations, these nonetheless point out that adverse weather comes at a steep price.
43. http://www.unisdr.org/files/27162_2012no21.pdf44. ibid.45. Data taken from the UN database at http://unstats.un.org/unsd/snaama/selcountry.asp46. http://www.wri.org/blog/timeline-look-extreme-weather-and-climate-events-201347. http://www.cbc.ca/news/business/extreme-weather-cost-canada-record-3-2b-insurers-say-1.250365948. http://www.theguardian.com/world/2013/jun/11/german-flood-damage-insurance-claims49. http://www.nbcnews.com/business/extreme-weather-threatens-global-economy-2D1202423350. http://www.telegraph.co.uk/finance/economics/10558607/Polar-vortex-disruption-to-cost-US-economy-5bn.html51. http://www.environment-agency.gov.uk/news/150900.aspx52. Ibid.53. Ibid.54. http://www.ft.com/cms/s/0/48d9b3dc-5113-11e2-b287-00144feab49a.html#axzz2sMsyZjbf55. https://www.abi.org.uk/News/News-releases/2013/02/Over-1300-Customers-Helped-Everyday-By-Insurers-To-Recover-From-Extreme-Weather-In-201256. http://www.vtt.fi/news/2012/270612_vtt_aarisaat_maksavat_eun_liikenteelle_vuosittain_15_miljardia_euroa.jsp?lang=en57. http://asbcouncil.org/node/1217

19
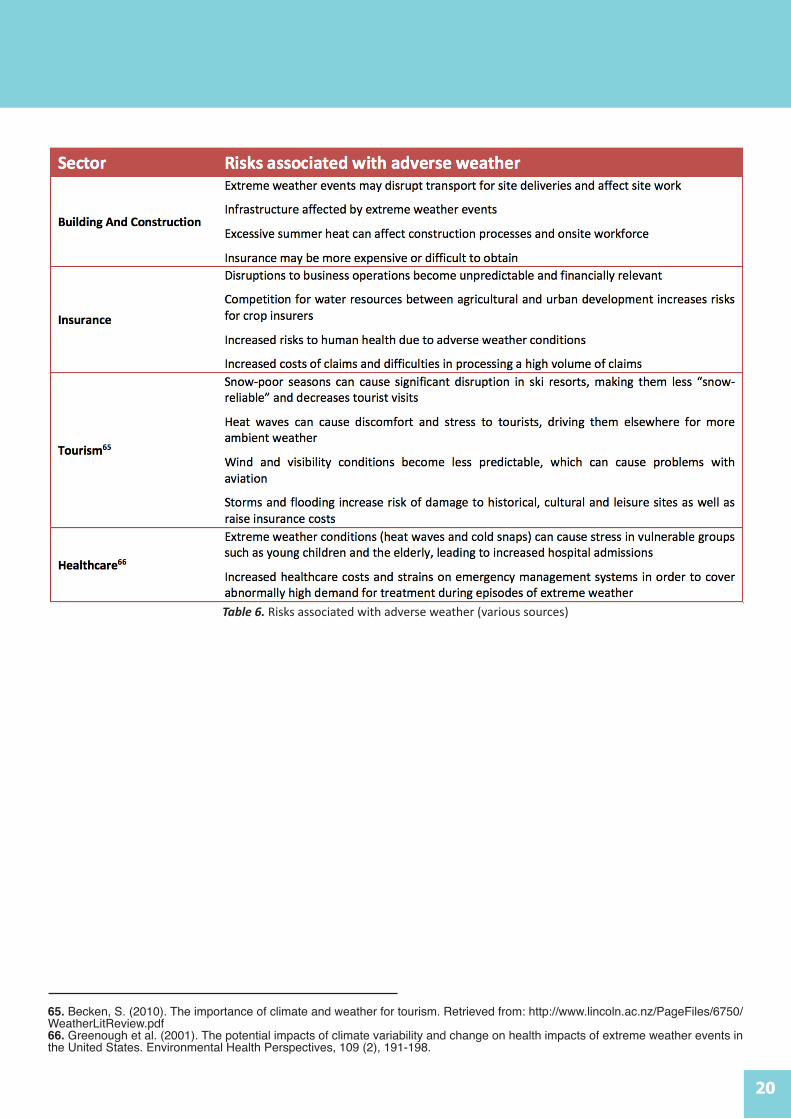
Table 6. Risks associated with adverse weather (various sources)
58. Lubchenco, J. and Karl, T. (2012). Predicting and managing extreme weather events. Physics Today, 65 (3), 31-37.59. Sussman, F. and Reed, J. (2008). Adapting to Climate Change: A Business Approach. Arlington, VA: Pew Centre on Global Climate Change.60. ibid. unless taken from another source61. http://science.time.com/2011/06/27/sticker-shock-what-extreme-weather-costs-the-u-s/62. Dell, J. (2012). Petroleum Industry: Adaptation to Projected Impacts of Climate Change. Presentation to the International Energy Workshop 2013. Paris, France: International Energy Agency. 63. Hess, U., Richter, K. And Stoppa, A. (2004). Weather risk management for agriculture and agri-business in developing countries In: Climate risk and the weather markets (pp. 295-307). London: Risk Books.64. Cachon, G., Gallino, S. and Olivares, M. (2012). Severe weather and automobile assembly productivity. Columbia Business School Research Paper No. 12/37. Retrieved from: http://papers.ssrn.com/sol3/papers.cfm?abstract_id=2099798.
Furthermore, scientists have also reported the increased frequency and intensity of adverse weather events of an extreme kind58. These changes have also been observed around the globe according to a 2008 report by the Pew Centre for Global Climate Change59. These changes produce far-reaching impacts across industry sectors (Table 6)60.
COUNTING THE COST:A D V E R S E W E A T H E R
20
Table 6. Risks associated with adverse weather (various sources)
65. Becken, S. (2010). The importance of climate and weather for tourism. Retrieved from: http://www.lincoln.ac.nz/PageFiles/6750/WeatherLitReview.pdf66. Greenough et al. (2001). The potential impacts of climate variability and change on health impacts of extreme weather events in the United States. Environmental Health Perspectives, 109 (2), 191-198.
21
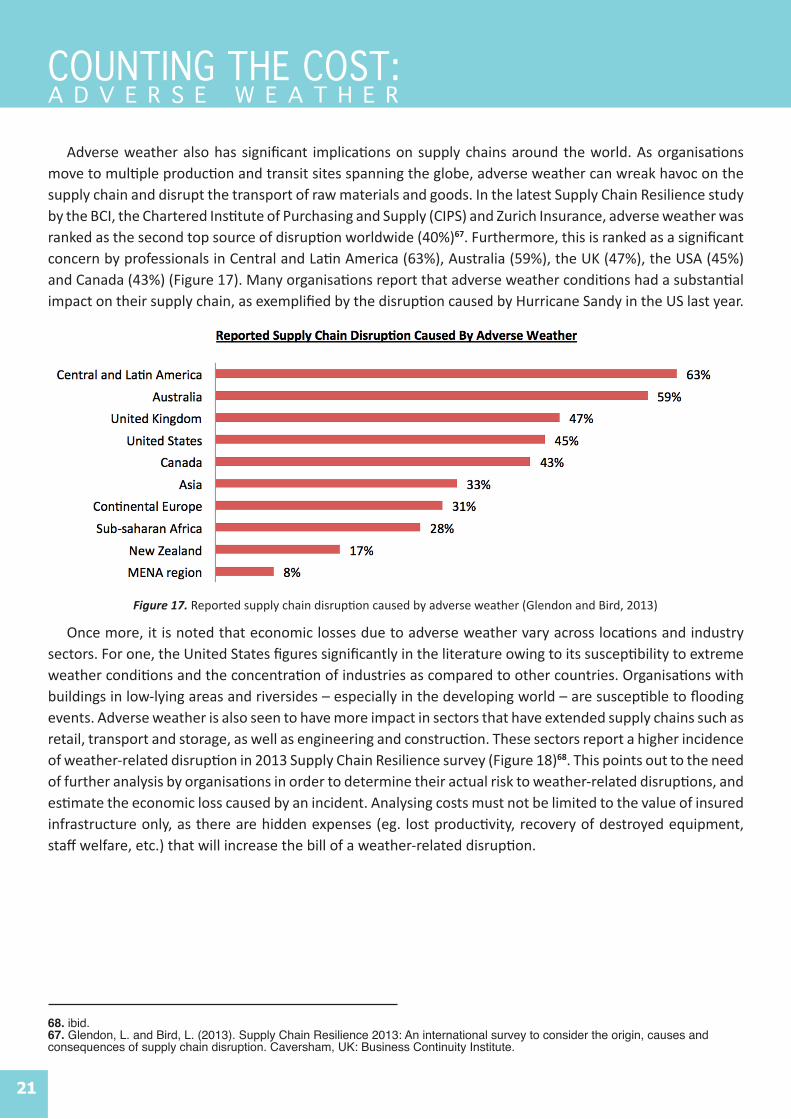
Adverse weather also has significant implications on supply chains around the world. As organisations move to multiple production and transit sites spanning the globe, adverse weather can wreak havoc on the supply chain and disrupt the transport of raw materials and goods. In the latest Supply Chain Resilience study by the BCI, the Chartered Institute of Purchasing and Supply (CIPS) and Zurich Insurance, adverse weather was ranked as the second top source of disruption worldwide (40%)67. Furthermore, this is ranked as a significant concern by professionals in Central and Latin America (63%), Australia (59%), the UK (47%), the USA (45%) and Canada (43%) (Figure 17). Many organisations report that adverse weather conditions had a substantial impact on their supply chain, as exemplified by the disruption caused by Hurricane Sandy in the US last year.
68. ibid.67. Glendon, L. and Bird, L. (2013). Supply Chain Resilience 2013: An international survey to consider the origin, causes and consequences of supply chain disruption. Caversham, UK: Business Continuity Institute.
Figure 17. Reported supply chain disruption caused by adverse weather (Glendon and Bird, 2013)
COUNTING THE COST:A D V E R S E W E A T H E R
Once more, it is noted that economic losses due to adverse weather vary across locations and industry sectors. For one, the United States figures significantly in the literature owing to its susceptibility to extreme weather conditions and the concentration of industries as compared to other countries. Organisations with buildings in low-lying areas and riversides – especially in the developing world – are susceptible to flooding events. Adverse weather is also seen to have more impact in sectors that have extended supply chains such as retail, transport and storage, as well as engineering and construction. These sectors report a higher incidence of weather-related disruption in 2013 Supply Chain Resilience survey (Figure 18)68. This points out to the need of further analysis by organisations in order to determine their actual risk to weather-related disruptions, and estimate the economic loss caused by an incident. Analysing costs must not be limited to the value of insured infrastructure only, as there are hidden expenses (eg. lost productivity, recovery of destroyed equipment, staff welfare, etc.) that will increase the bill of a weather-related disruption.

22
Figure 18. Reported weather-related disruption by sector (Glendon and Bird, 2013)
This data leads to the importance of an effective BC programme. As more extreme weather conditions are forecast in the years to come69, organisations have to accept the current situation as the “new normal” and devise strategies that will head off this threat. Only through proactive adaptation – one that assesses projected changes and the likelihood of these changes70 – coupled with an effective programme can help organisations adapt to this new normal and minimise losses.
69. Bohannon, J. (2005). Disasters: Searching for lessons from a bad year. Science, 310, 1883.70. Sussman, F. and Reed, J. (2008). Adapting to Climate Change: A Business Approach. Arlington, VA: Pew Centre on Global Climate Change.

23
Table 7. Summary of annual cost estimates for various threats (various sources)
71. Bohannon, J. (2005). Disasters: Searching for lessons from a bad year. Science, 310, 1883.72. Sussman, F. and Reed, J. (2008). Adapting to Climate Change: A Business Approach. Arlington, VA: Pew Centre on Global Climate Change.73. Walker, K., Deary, D. and Woods, D. (2013). Reducing the potential for cascade: Recognizing and mitigating situations that threaten business viability. Paper for the 5th Resilience Engineering Symposium. Soesterberg, Netherlands: Resilience Engineering Association.
C O N C L U S I O N :NOT DOOM AND GLOOM
Data from various sources pertaining to three common threats – IT and telecommunications outage, data breach and cyber attack, and adverse weather – points out to a steep price tag (Table 7). Note that these figures correspond to a worst-case scenario involving organisations that are highly dependent on IT and telecommunications. Meanwhile, costs for adverse weather represent estimated losses to businesses and may often exceed insurance payouts.
It is important to note that these threats do not just involve economic loss. Challenging events produce effects that propagate and cascade into other spheres of operation, eventually disrupting an organisation’s business viability73. Experience tells us that disruptions are rarely isolated; hence, it is foolhardy to think that it can be limited to one area once it happens. This makes business continuity everybody’s concern as it goes into the heart of an organisation.
As organisations grapple with the fragile economic recovery, rationalising cost remains a paramount concern. In a time of budget cuts, it is often tempting to downsize business continuity efforts and hope that nothing too disruptive happens in the meantime. However, as the wealth of data above shows, it is wise to continue investing in a responsive BC programme. Attention must also be given to low-cost measures that strengthen a BC management programme such as embedding business continuity in existing training. In many occasions, a BC programme does not necessarily mean purchasing more sophisticated technology. Instead, it requires changing individual mindsets – and organisational cultures – from a reactive paradigm to a proactive one. More often, it just requires changing habits, acquiring a strategic frame of mind, and ensuring consistent leadership from top management.
Whilst we present the staggering costs of organisational threats, we do not wish to communicate doom and gloom. Instead, we are hoping that an appraisal of how much threats cost can start a conversation about improving business continuity within organisations. We also wish to point out that effective BC strategies can translate to significant cost savings. For example, with minor IT and telecommunication outage more likely to happen than substantial incidents, the cost of prevention is definitely cheaper. Organisations reliant on high-availability IT infrastructure can save up to US$1.04 million on average over a period of 24 months by preventing minor outages74. Furthermore, deploying security intelligence to defend against data breach and cyber attacks can save similar organisations an average of US$400,000 to US$4.0 million a year75. Managing

24
74. IBM Global Technology Services (2013a). The economics of IT risk and reputation: What business continuity and IT security really mean to your organisation. Portsmouth, UK: IBM. 75. http://media.scmagazine.com/documents/54/2013_us_ccc_report_final_6-1_13455.pdf76. Sussman, F. and Reed, J. (2008). Adapting to Climate Change: A Business Approach. Arlington, VA: Pew Centre on Global Climate Change.77. www.huffingtonpost.com/2012/10/30/flood-insurance-in-northeast_n_2045031.html78. https://www.abi.org.uk/News/News-releases/2013/02/Over-1300-Customers-Helped-Everyday-By-Insurers-To-Recover-From-Extreme-Weather-In-2012
HOW THE BCI CAN HELPThe BCI is a world leader in business continuity research in areas such as supply chain resilience. Insights
contained in its published reports help BCI members and the wide professional community. The BCI’s Good Practice Guidelines, world-recognised and ISO-aligned, can be used as a reference for supplier BC arrangements. The BCI also offers organisations opportunities to share and learn best practices in business continuity with its global professional network. Opportunities for continuous professional development to BC practitioners are available through globally-recognised certification (CBCI), a mentoring programme and annual industry events. It also offers a Diploma course for business continuity in cooperation with Bucks New University in the UK.
For more information on how the BCI can help your organisation, contact [email protected]
risks associated with adverse weather and possible climate change can better position organisations into avoiding or mitigating damage76. With average insurance payouts for flooding in 2012 valued at US$29,236 (United States)77 and US$29,613 (United Kingdom)78, organisations can have a rough idea on how much weather-related damage costs and devise appropriate strategies. Even organisations in sectors having lesser reliance on technology and the weather can still realise considerable savings, and become better prepared to face related incidents should they occur.
In the end, our message is simple. Business continuity is everybody’s concern as the benefits of preparedness translates to overall organisational resilience. It is essential that BC professionals are supported by management, budget holders and the rest of staff in ensuring the highest level of preparedness. Business continuity remains as relevant to today’s organisations as it was before, with the current spectrum of threats adding to that urgency to act.

25
APPENDIX
Figure 16.COST OF ADVERSE WEATHER AND NATURAL DISASTERS, 1992-2010
26

Business Continuity Institute
10-11 Southview ParkMarsack Street
CavershamRG4 5AF
United Kingdom
+44 (0)118 947 8215www.thebci.org