Embed Size (px)
Citation preview
Investor Presentation
November 2014
NASDAQ: BAGR
Michael AnsleyPresident, CEO & Board Chairman
David G. BurkeChief Financial Officer & Treasurer
© 2014 by Diversified Restaurant Holdings, Inc.
© 2014 by Diversified Restaurant Holdings, Inc.2
Safe Harbor Statement
The information made available in this presentation contains forward-looking statementswhich reflect the Company’s current view of future events, results of operations, cash flows,performance, business prospects and opportunities. Wherever used, the words "anticipate,""believe," "expect," "intend," "plan," "project," "will continue," "will likely result," "may," andsimilar expressions identify forward-looking statements as such term is defined in theSecurities Exchange Act of 1934. Any such forward-looking statements are subject to risksand uncertainties and the Company's actual growth, results of operations, financialcondition, cash flows, performance, business prospects and opportunities could differmaterially from historical results or current expectations. Some of these risks include, withoutlimitation, the impact of economic and industry conditions, competition, food and drug safetyissues, store expansion and remodeling, labor relations issues, costs of providing employeebenefits, regulatory matters, legal and administrative proceedings, information technology,security, severe weather, natural disasters, accounting matters, other risk factors relating toour business or industry and other risks detailed from time to time in the Securities andExchange Commission filings of DRH. Forward-looking statements contained herein speakonly as of the date made and, thus, DRH undertakes no obligation to update or publiclyannounce the revision of any of the forward-looking statements contained herein to reflectnew information, future events, developments or changed circumstances or for any otherreason.
NASDAQ: BAGRNASDAQ: BAGR
© 2014 by Diversified Restaurant Holdings, Inc.3
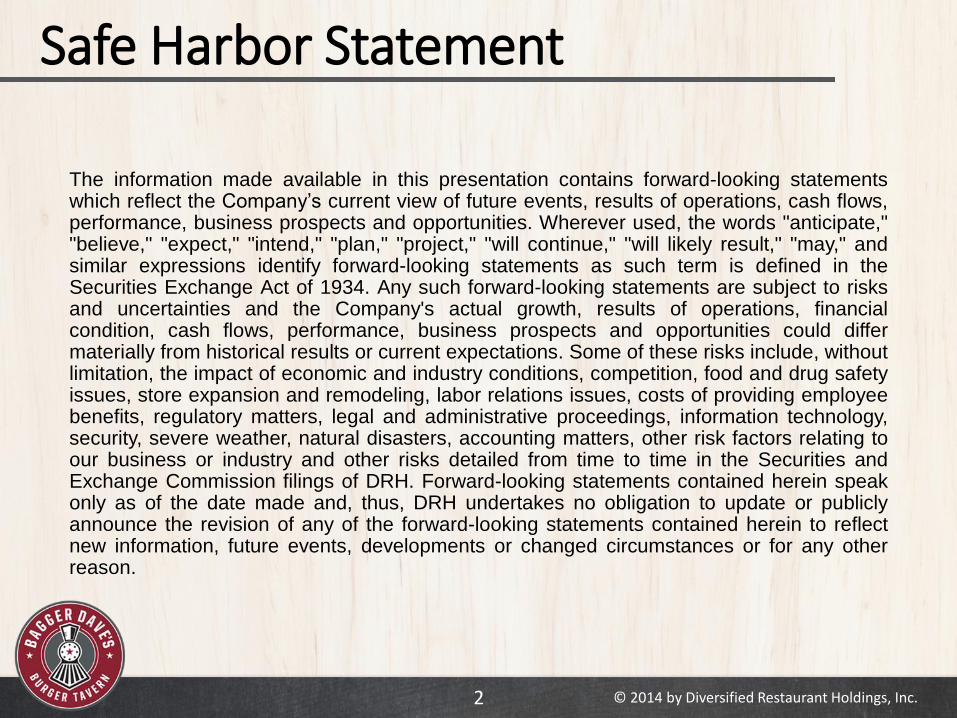
Premier Restaurant Concepts
The creator, developer and operator of the unique, full-service,
ultra-casual restaurant and bar Bagger Dave’s Burger Tavern
and one of the largest franchisees of Buffalo Wild Wings
VISION
MISSION
To be the preferred, “ultra-casual” dining destination in our market
To “delight guests” by providing experiences that create loyalty
NASDAQ: BAGRNASDAQ: BAGR
Fast-Casual Ultra-Casual Casual Dining
© 2014 by Diversified Restaurant Holdings, Inc.4
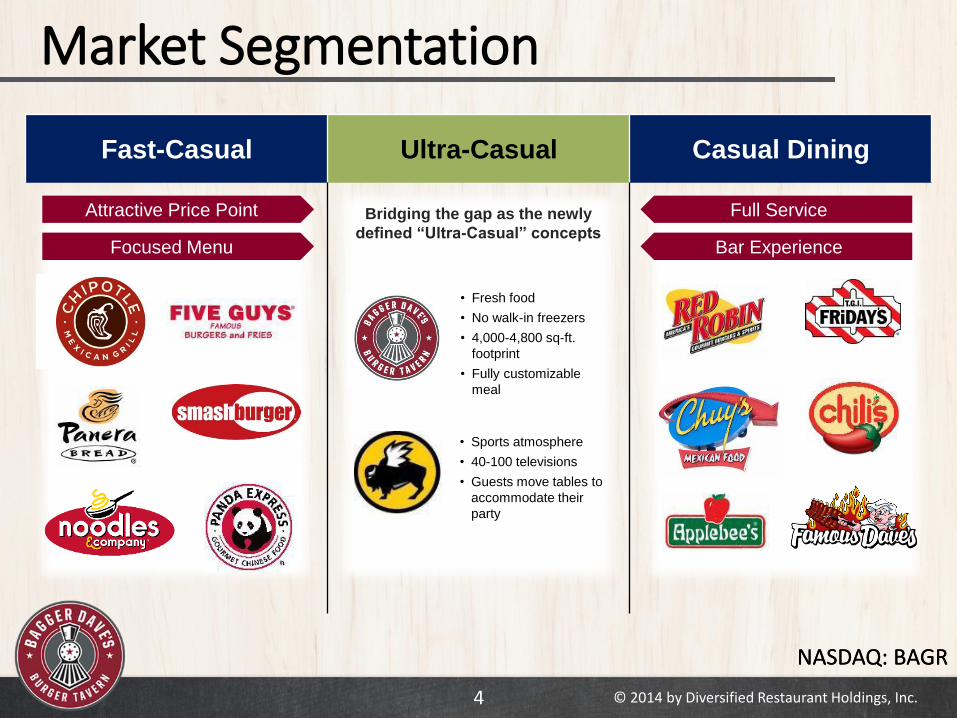
Market Segmentation
Bridging the gap as the newly
defined “Ultra-Casual” concepts
Attractive Price Point
Focused Menu
Full Service
Bar Experience
• Fresh food
• No walk-in freezers
• 4,000-4,800 sq-ft.
footprint
• Fully customizable
meal
• Sports atmosphere
• 40-100 televisions
• Guests move tables to
accommodate their
party
NASDAQ: BAGRNASDAQ: BAGR
© 2014 by Diversified Restaurant Holdings, Inc.5
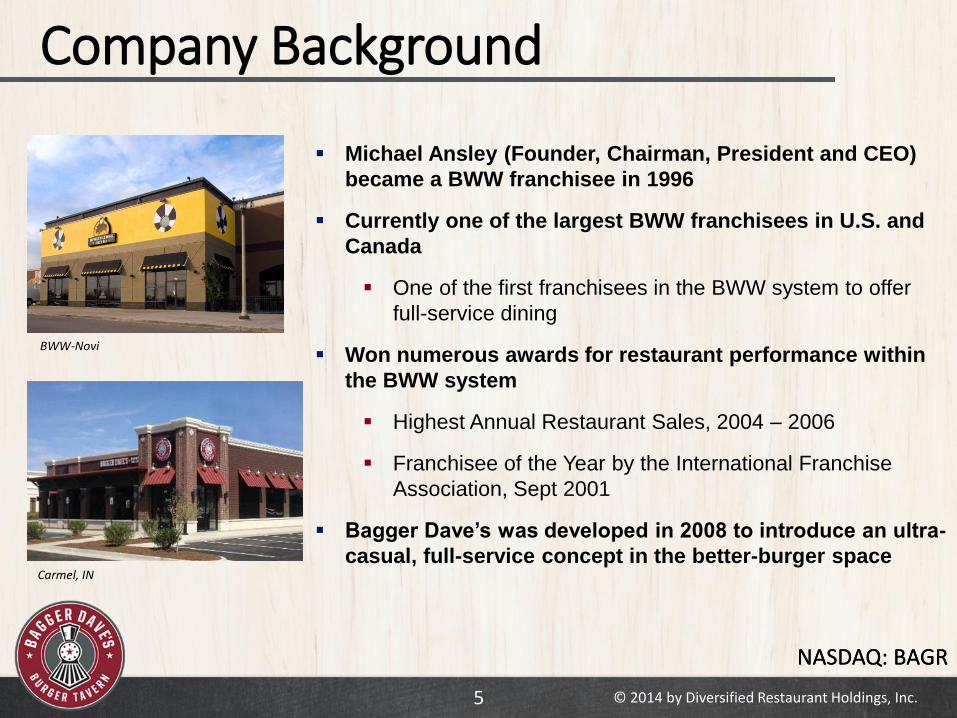
Company Background
Michael Ansley (Founder, Chairman, President and CEO)
became a BWW franchisee in 1996
Currently one of the largest BWW franchisees in U.S. and
Canada
One of the first franchisees in the BWW system to offer
full-service dining
Won numerous awards for restaurant performance within
the BWW system
Highest Annual Restaurant Sales, 2004 – 2006
Franchisee of the Year by the International Franchise
Association, Sept 2001
Bagger Dave’s was developed in 2008 to introduce an ultra-
casual, full-service concept in the better-burger space
BWW-Novi
Carmel, IN
NASDAQ: BAGRNASDAQ: BAGR
© 2014 by Diversified Restaurant Holdings, Inc.6
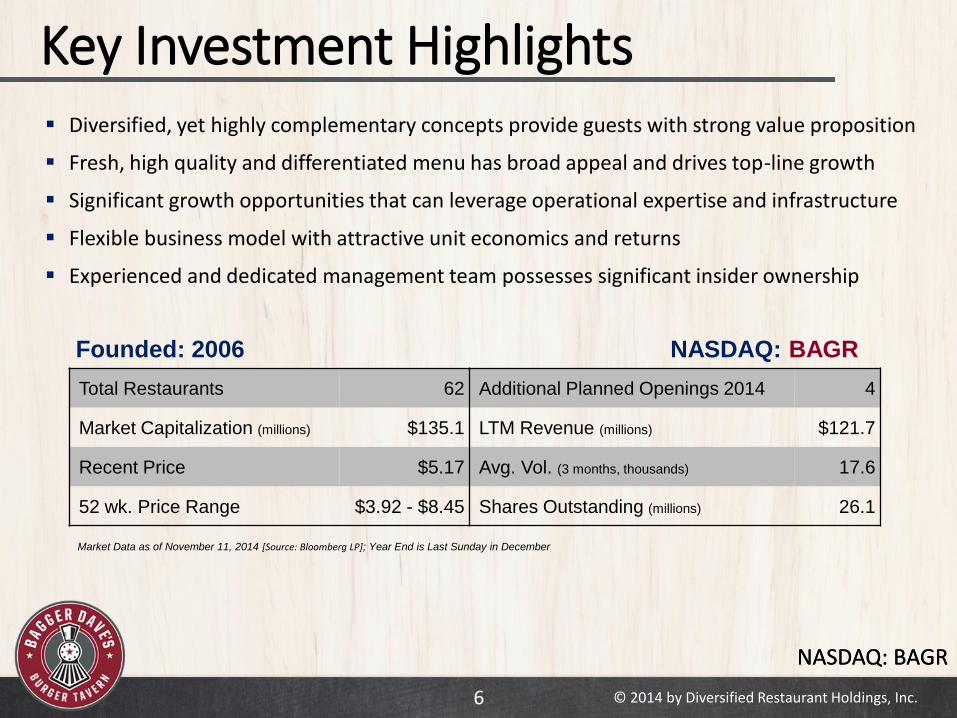
Key Investment Highlights Diversified, yet highly complementary concepts provide guests with strong value proposition
Fresh, high quality and differentiated menu has broad appeal and drives top-line growth
Significant growth opportunities that can leverage operational expertise and infrastructure
Flexible business model with attractive unit economics and returns
Experienced and dedicated management team possesses significant insider ownership
Founded: 2006 NASDAQ: BAGR
Total Restaurants 62 Additional Planned Openings 2014 4
Market Capitalization (millions) $135.1 LTM Revenue (millions) $121.7
Recent Price $5.17 Avg. Vol. (3 months, thousands) 17.6
52 wk. Price Range $3.92 - $8.45 Shares Outstanding (millions) 26.1
Market Data as of November 11, 2014 [Source: Bloomberg LP]; Year End is Last Sunday in December

NASDAQ: BAGRNASDAQ: BAGR
© 2014 by Diversified Restaurant Holdings, Inc.7
Strength Through Diversification
Leverage experienced Managing Partners of BWW
Provides a new career path for restaurant-level managers
through Bagger Dave’s
Reduces turnover in restaurant-level management
Standardized systems and processes enhance
restaurant-level management
Reduces time to train new restaurant-level management
Facilitates training of personnel and improves level of
customer service
Shared infrastructure
Locations featuring both Bagger Dave’s and Buffalo Wild
Wings can share real estate and other fixed costs
Existing infrastructure supports Bagger Dave’s expansion
Complementary Concepts GenerateOperational Synergies
Bagger Dave’s – Carmel, IN
BWW-Detroit
NASDAQ: BAGRNASDAQ: BAGR
© 2014 by Diversified Restaurant Holdings, Inc.8
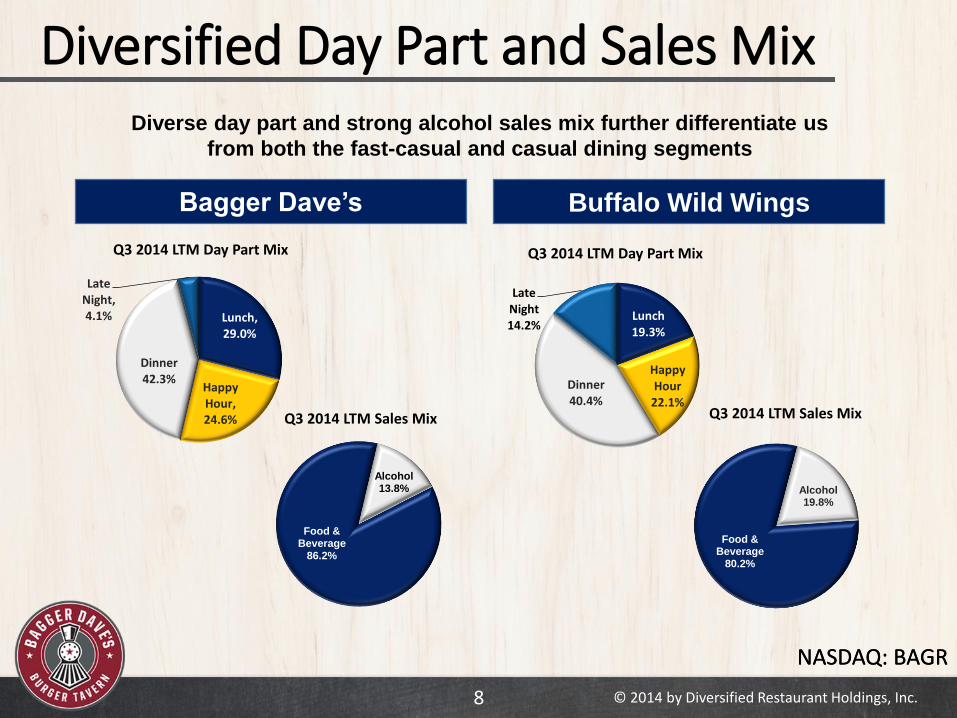
Diversified Day Part and Sales Mix
Food & Beverage
86.2%
Alcohol13.8%
Food & Beverage
80.2%
Alcohol19.8%
Lunch, 29.0%
Happy Hour, 24.6%
Dinner42.3%
Late Night, 4.1% Lunch
19.3%
Happy Hour
22.1%
Dinner 40.4%
Late Night14.2%
Bagger Dave’s
Q3 2014 LTM Day Part Mix
Q3 2014 LTM Sales Mix
Buffalo Wild Wings
Diverse day part and strong alcohol sales mix further differentiate us
from both the fast-casual and casual dining segments
Q3 2014 LTM Day Part Mix
Q3 2014 LTM Sales Mix
NASDAQ: BAGRNASDAQ: BAGR
© 2014 by Diversified Restaurant Holdings, Inc.9
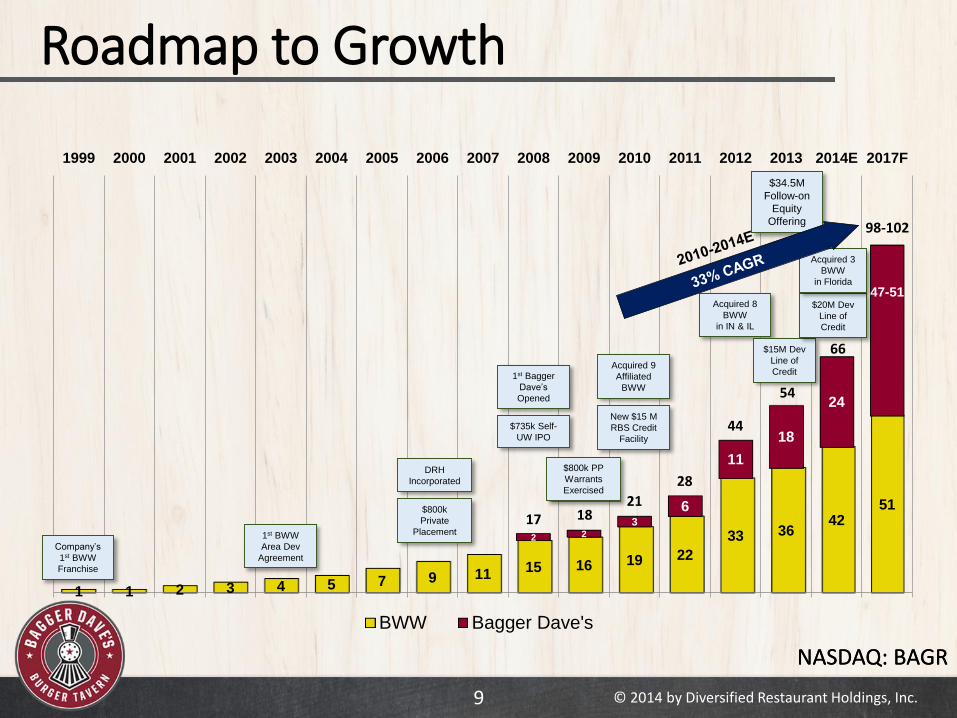
Roadmap to Growth
1 1 2 3 4 5 7 9 1115 16 19 22
33 3642
51
2 2
3
6
11
18
24
47-51
1999 2000 2001 2002 2003 2004 2005 2006 2007 2008 2009 2010 2011 2012 2013 2014E 2017F
BWW Bagger Dave's
Company’s
1st BWW
Franchise
DRH
Incorporated
1st Bagger
Dave’s
Opened
Acquired 8
BWW
in IN & IL
$34.5M
Follow-on
Equity
Offering
$800k
Private
Placement
$735k Self-
UW IPO
New $15 M
RBS Credit
Facility
Acquired 9
Affiliated
BWW
$15M Dev
Line of
Credit
$800k PP
Warrants
Exercised
1st BWW
Area Dev
Agreement
98-102
66
54
44
28
211817
$20M Dev
Line of
Credit
Acquired 3
BWW
in Florida

NASDAQ: BAGRNASDAQ: BAGR
© 2014 by Diversified Restaurant Holdings, Inc.10
Current & Planned Locations
Indiana
Illinois
Michigan
Florida
2013A YEAR-END 18 36 54
CURRENT 22 40 61
2014E YEAR-END 24 42 66
GROWTH RATE 33% 17% 22%
Current Bagger Dave’s
Planned Bagger Dave’s
Current BWW
Planned BWW
NASDAQ: BAGRNASDAQ: BAGR
© 2014 by Diversified Restaurant Holdings, Inc.11
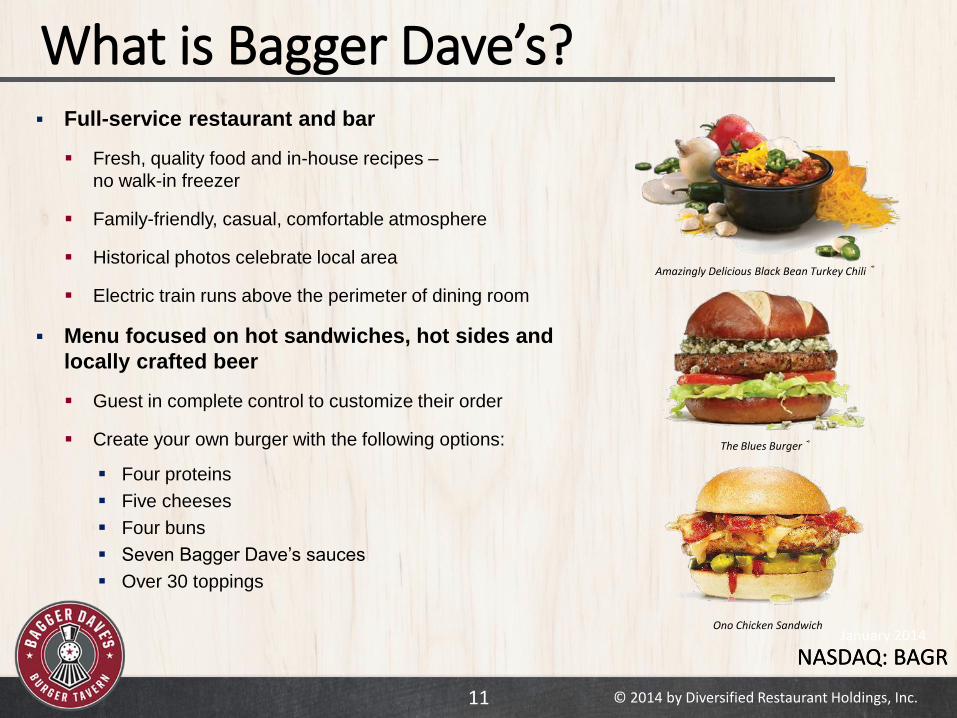
What is Bagger Dave’s?
January 2014
Full-service restaurant and bar
Fresh, quality food and in-house recipes –
no walk-in freezer
Family-friendly, casual, comfortable atmosphere
Historical photos celebrate local area
Electric train runs above the perimeter of dining room
Menu focused on hot sandwiches, hot sides and
locally crafted beer
Guest in complete control to customize their order
Create your own burger with the following options:
Four proteins
Five cheeses
Four buns
Seven Bagger Dave’s sauces
Over 30 toppings
Amazingly Delicious Black Bean Turkey Chili ®
Ono Chicken Sandwich
The Blues Burger ®

Focused on Sustainable Sales Growth
© 2014 by Diversified Restaurant Holdings, Inc.12
Multiple initiatives in place to drive same store sales growth
1.5%
5.1%
6.0% 6.3%
7.2%
6.2%
7.2%
9.2%
3.5%
6.7%
3.7%
1.1% 1.2% 1.2%
5.0%
0.0%
1.0%
2.0%
3.0%
4.0%
5.0%
6.0%
7.0%
8.0%
9.0%
10.0%
Q1 2011 Q2 2011 Q3 2011 Q4 2011 Q1 2012 Q2 2012 Q3 2012 Q4 2012 Q1 2013 Q2 2013 Q3 2013 Q4 2013 Q1 2014 Q2 2014 Q3 2014
15 Consecutive Quarters of Positive Same Store Sales Growth
Traffic
Check
Marketing
Reimaging
Stay ahead of the curve through differentiated, customizable and proprietary menu offerings that decrease
“veto” vote and enhance guest experience
New marketing program creates “buzz” around concept
Technologically sophisticated loyalty program attracts and retains guests
New prototype designs for both Bagger Dave’s and BWW improve brand image
Features edgier feel with an increased emphasis on bar area and experience
Table side selling of food and beverage items encourages higher attachment and productivity gains

NASDAQ: BAGRNASDAQ: BAGR
© 2014 by Diversified Restaurant Holdings, Inc.13
Strong New Marketing Message

Bagger Dave’s Menu Evolution
© 2014 by Diversified Restaurant Holdings, Inc.14
Fresh, diverse menu offerings create customer and media excitement
Featured on several local news broadcasts
Menu offerings generating buzz:
8oz Prime Rib Recipe Burger
Farm-Raised Grilled Chicken Breast
Turkey Burger
Custom Made Sauces
Chopped Salads
Fresh-made Mac & Cheese
Fresh Hand-cut Fries
Hand-cut Sweet Potato Chips
Local Craft Beers
Own-brand soda with specialty flavors

NASDAQ: BAGRNASDAQ: BAGR
© 2014 by Diversified Restaurant Holdings, Inc.15
Bagger Dave’s Interior Design
New innovated interior design debuted in
Carmel, Fishers, and Schererville IN and
Woodhaven, MI locations opened this year.
Hipper look and feel provided with updated
flooring, furniture and fixtures.
New bar design emphasizes liquor, wine and
draft beer offerings.
NASDAQ: BAGRNASDAQ: BAGR
© 2014 by Diversified Restaurant Holdings, Inc.16
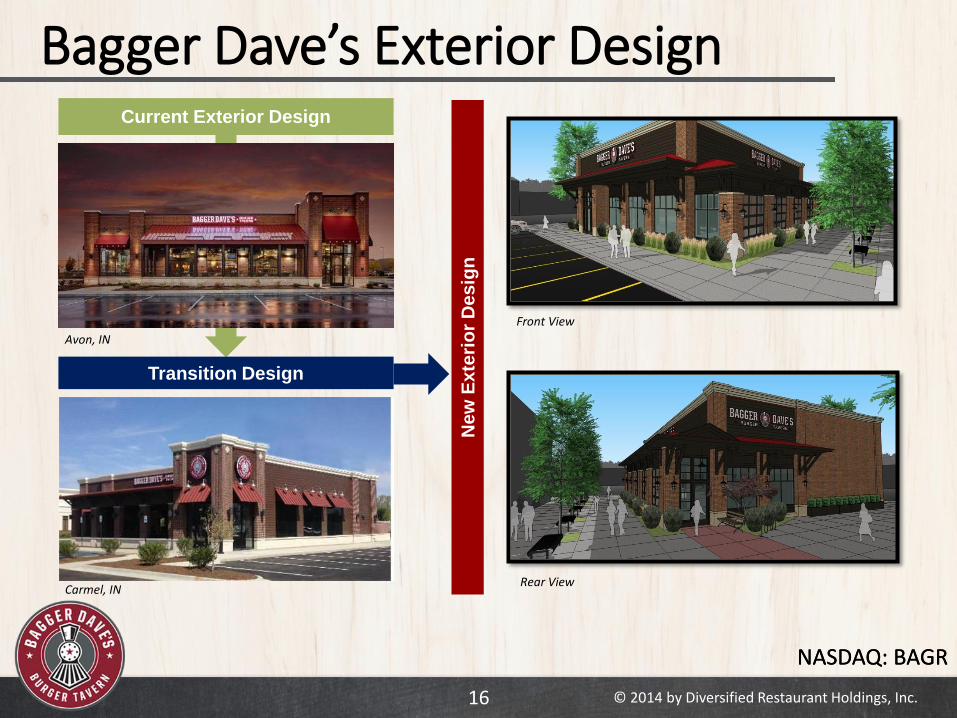
Bagger Dave’s Exterior Design
Transition Design
Ne
w E
xte
rio
r D
es
ign
Front View
Rear View
Avon, IN
Current Exterior Design
Carmel, IN
NASDAQ: BAGRNASDAQ: BAGR
© 2014 by Diversified Restaurant Holdings, Inc.17
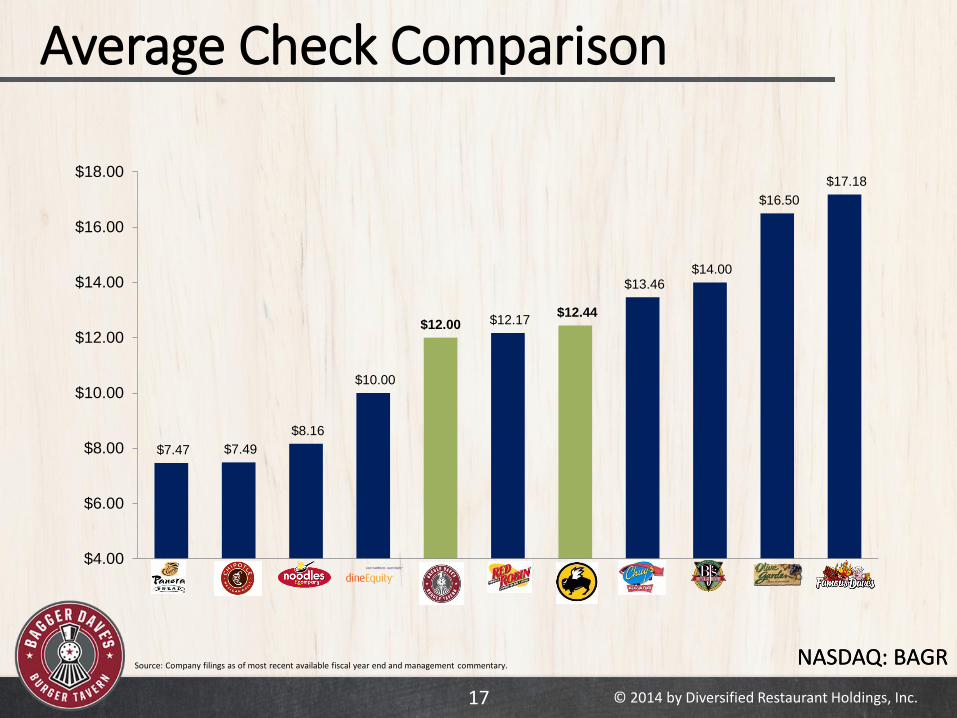
Average Check Comparison
$7.47 $7.49
$8.16
$10.00
$12.00 $12.17 $12.44
$13.46 $14.00
$16.50
$17.18
$4.00
$6.00
$8.00
$10.00
$12.00
$14.00
$16.00
$18.00
Source: Company filings as of most recent available fiscal year end and management commentary.

NASDAQ: BAGRNASDAQ: BAGR
© 2014 by Diversified Restaurant Holdings, Inc.18
Bagger Dave’s Craft Soda
Premium Craft Soda sold on draft
Eight favors available
Includes mystery rotator flavor
Retail bottle sales launched in July
In-store only; brings customers into restaurant
Ability to add proprietary flavors
Unique differentiator
Flexibility to add / promote new flavors
Exceedingly better margins than Coca-Cola
or Pepsi
50-year supply agreement
NASDAQ: BAGRNASDAQ: BAGR
© 2014 by Diversified Restaurant Holdings, Inc.19
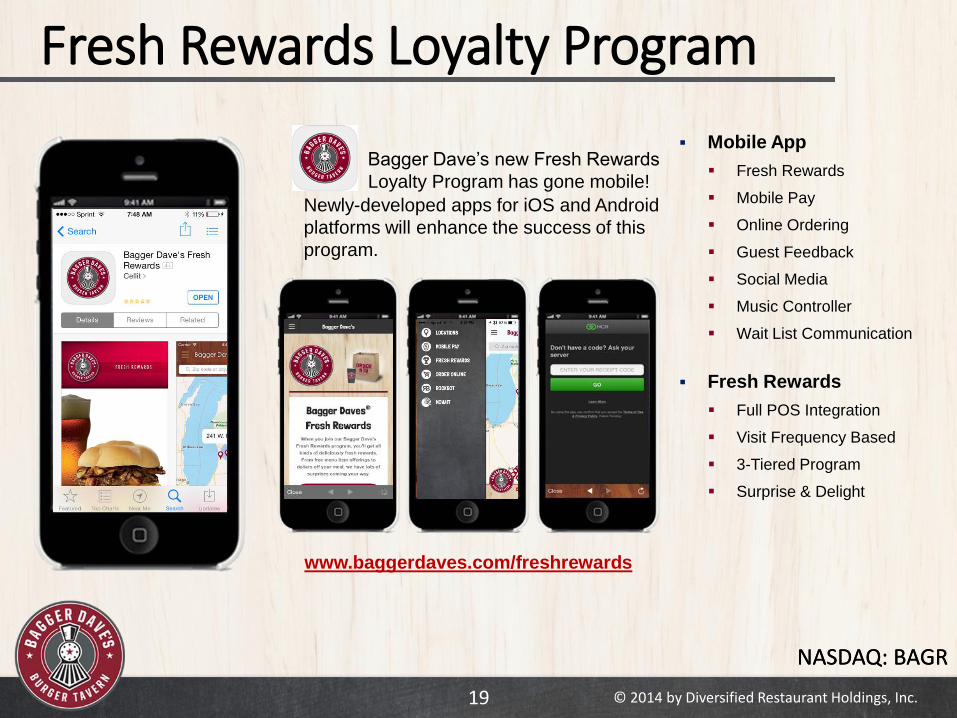
Fresh Rewards Loyalty Program
Bagger Dave’s new Fresh Rewards
Loyalty Program has gone mobile!
Mobile App
Fresh Rewards
Mobile Pay
Online Ordering
Guest Feedback
Social Media
Music Controller
Wait List Communication
Fresh Rewards
Full POS Integration
Visit Frequency Based
3-Tiered Program
Surprise & Delight
Newly-developed apps for iOS and Android
platforms will enhance the success of this
program.
www.baggerdaves.com/freshrewards
NASDAQ: BAGRNASDAQ: BAGR
© 2014 by Diversified Restaurant Holdings, Inc.20
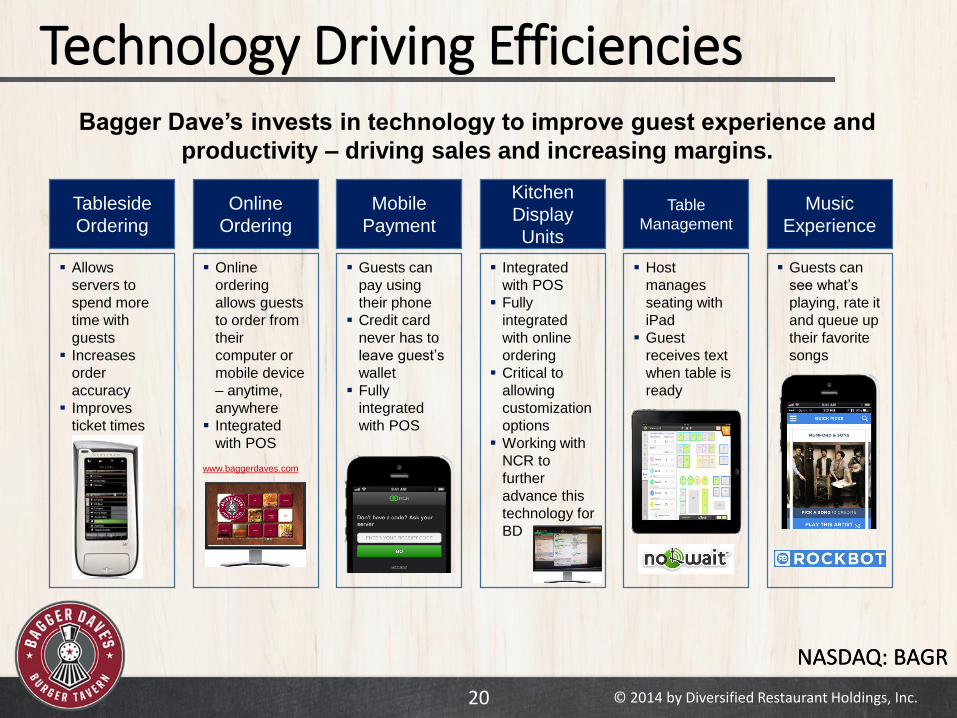
Technology Driving Efficiencies Bagger Dave’s invests in technology to improve guest experience and
productivity – driving sales and increasing margins.
Allows
servers to
spend more
time with
guests
Increases
order
accuracy
Improves
ticket times
Tableside
Ordering
Online
ordering
allows guests
to order from
their
computer or
mobile device
– anytime,
anywhere
Integrated
with POS
www.baggerdaves.com
Online
Ordering
Guests can
pay using
their phone
Credit card
never has to
leave guest’s
wallet
Fully
integrated
with POS
Mobile
Payment
Integrated
with POS
Fully
integrated
with online
ordering
Critical to
allowing
customization
options
Working with
NCR to
further
advance this
technology for
BD
Kitchen
Display
Units
Host
manages
seating with
iPad
Guest
receives text
when table is
ready
Table
Management
Guests can
see what’s
playing, rate it
and queue up
their favorite
songs
Music
Experience
NASDAQ: BAGRNASDAQ: BAGR
© 2014 by Diversified Restaurant Holdings, Inc.21
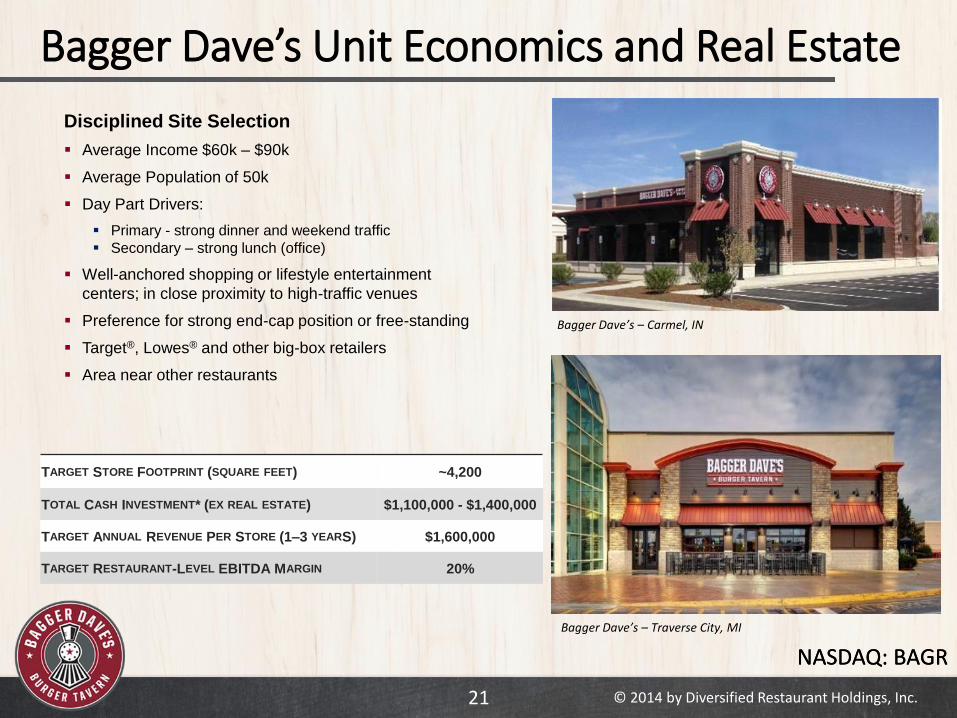
Bagger Dave’s Unit Economics and Real Estate
TARGET STORE FOOTPRINT (SQUARE FEET) ~4,200
TOTAL CASH INVESTMENT* (EX REAL ESTATE) $1,100,000 - $1,400,000
TARGET ANNUAL REVENUE PER STORE (1–3 YEARS) $1,600,000
TARGET RESTAURANT-LEVEL EBITDA MARGIN 20%
Disciplined Site Selection
Average Income $60k – $90k
Average Population of 50k
Day Part Drivers:
Primary - strong dinner and weekend traffic
Secondary – strong lunch (office)
Well-anchored shopping or lifestyle entertainment
centers; in close proximity to high-traffic venues
Preference for strong end-cap position or free-standing
Target®, Lowes® and other big-box retailers
Area near other restaurants
Bagger Dave’s – Traverse City, MI
Bagger Dave’s – Carmel, IN
NASDAQ: BAGRNASDAQ: BAGR
© 2014 by Diversified Restaurant Holdings, Inc.22
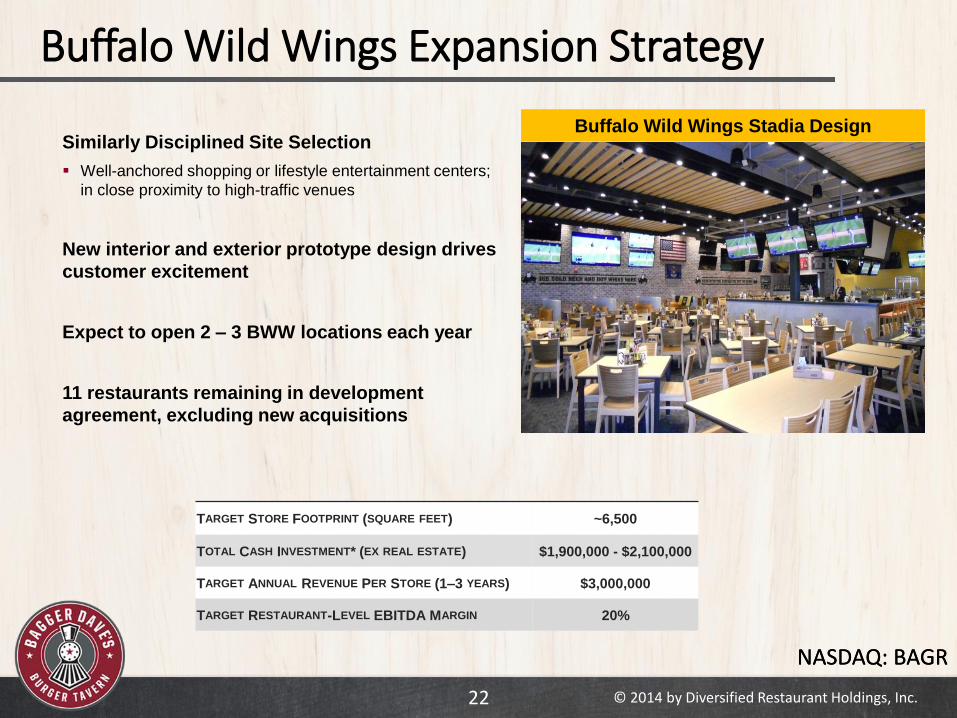
Buffalo Wild Wings Expansion Strategy
TARGET STORE FOOTPRINT (SQUARE FEET) ~6,500
TOTAL CASH INVESTMENT* (EX REAL ESTATE) $1,900,000 - $2,100,000
TARGET ANNUAL REVENUE PER STORE (1–3 YEARS) $3,000,000
TARGET RESTAURANT-LEVEL EBITDA MARGIN 20%
Similarly Disciplined Site Selection
Well-anchored shopping or lifestyle entertainment centers;
in close proximity to high-traffic venues
New interior and exterior prototype design drives
customer excitement
Expect to open 2 – 3 BWW locations each year
11 restaurants remaining in development
agreement, excluding new acquisitions
Buffalo Wild Wings Stadia Design
NASDAQ: BAGRNASDAQ: BAGR
23
Progress with Margin Enhancing Initiatives
Improving restaurant productivity is an ongoing priority
Opportunity to leverage corporate G&A
Bagger Dave’s strong unit growth momentum
facilitates operating leverage
Acquisition of BWW franchises in Florida enhances
market positioning with ability to leverage scale
NASDAQ: BAGRNASDAQ: BAGR
© 2014 by Diversified Restaurant Holdings, Inc.24
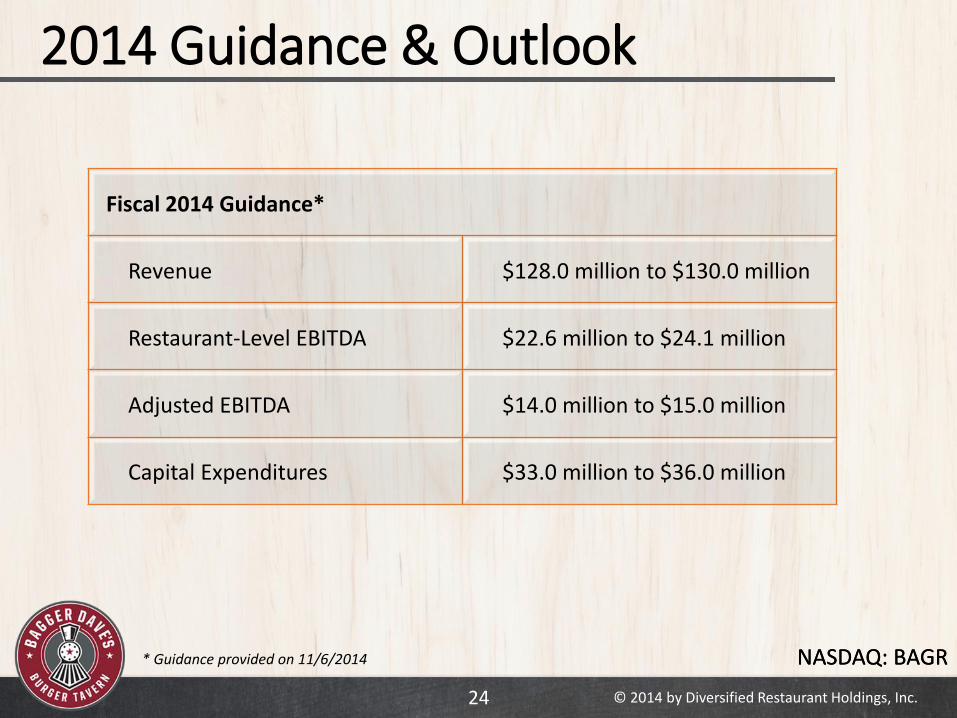
2014 Guidance & Outlook
* Guidance provided on 11/6/2014
Fiscal 2014 Guidance*
Revenue $128.0 million to $130.0 million
Restaurant-Level EBITDA $22.6 million to $24.1 million
Adjusted EBITDA $14.0 million to $15.0 million
Capital Expenditures $33.0 million to $36.0 million

Supplemental Information
NASDAQ: BAGR
Supplemental Information
NASDAQ: BAGR © 2014 by Diversified Restaurant Holdings, Inc.
NASDAQ: BAGRNASDAQ: BAGR
© 2014 by Diversified Restaurant Holdings, Inc.26
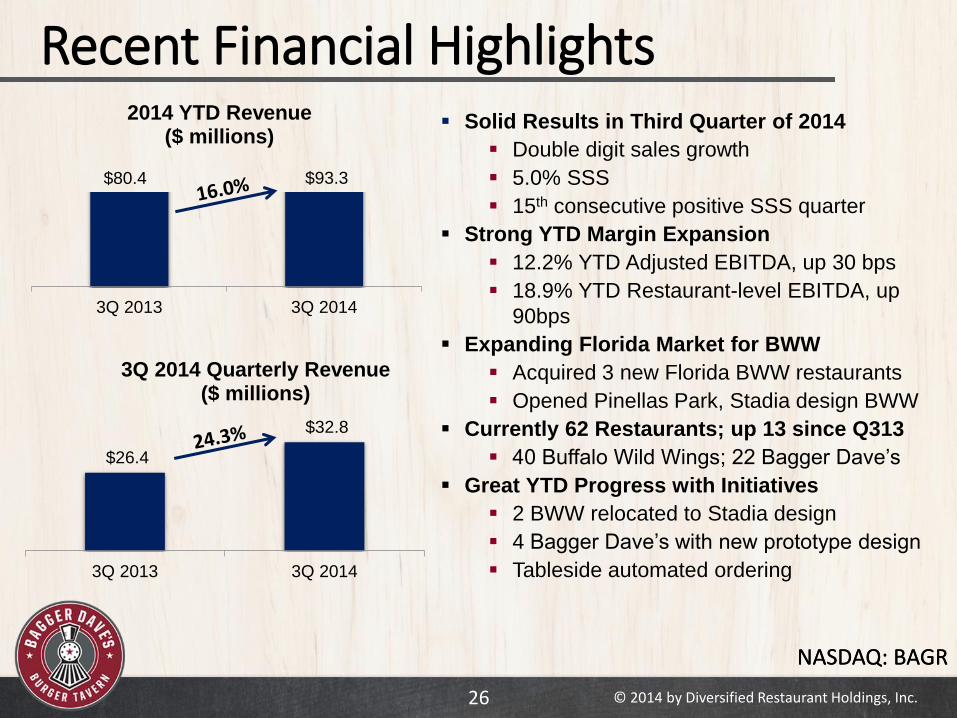
Recent Financial Highlights
$26.4
$32.8
3Q 2013 3Q 2014
3Q 2014 Quarterly Revenue($ millions)
Solid Results in Third Quarter of 2014
Double digit sales growth
5.0% SSS
15th consecutive positive SSS quarter
Strong YTD Margin Expansion
12.2% YTD Adjusted EBITDA, up 30 bps
18.9% YTD Restaurant-level EBITDA, up
90bps
Expanding Florida Market for BWW
Acquired 3 new Florida BWW restaurants
Opened Pinellas Park, Stadia design BWW
Currently 62 Restaurants; up 13 since Q313
40 Buffalo Wild Wings; 22 Bagger Dave’s
Great YTD Progress with Initiatives
2 BWW relocated to Stadia design
4 Bagger Dave’s with new prototype design
Tableside automated ordering
$80.4 $93.3
3Q 2013 3Q 2014
2014 YTD Revenue($ millions)

NASDAQ: BAGRNASDAQ: BAGR
© 2014 by Diversified Restaurant Holdings, Inc.27
Expanding Revenue($ in millions)
$45.2
$60.7
$77.4
$108.9
$128-$130*
2010 2011 2012 2013 2014E
* Guidance provided on 11/6/14
2014 YTD
$93.3
NASDAQ: BAGRNASDAQ: BAGR
© 2014 by Diversified Restaurant Holdings, Inc.28
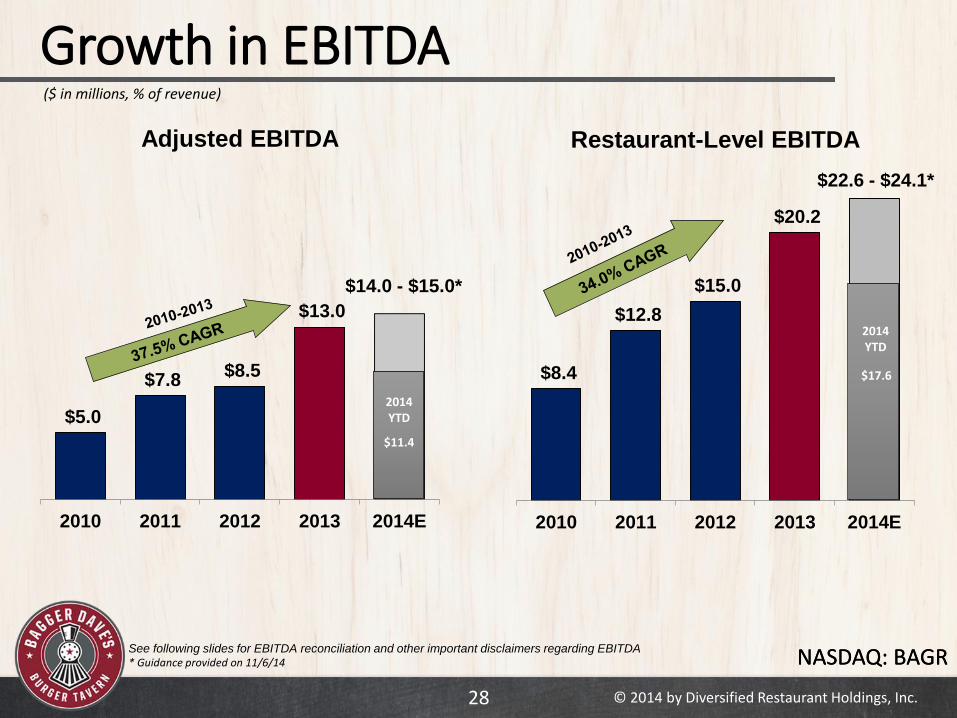
Growth in EBITDA
See following slides for EBITDA reconciliation and other important disclaimers regarding EBITDA* Guidance provided on 11/6/14
($ in millions, % of revenue)
$5.0
$7.8 $8.5
$13.0
2010 2011 2012 2013 2014E
Adjusted EBITDA
$8.4
$12.8
$15.0
$20.2
2010 2011 2012 2013 2014E
Restaurant-Level EBITDA
$14.0 - $15.0*
$22.6 - $24.1*
2014 YTD
$11.4
2014 YTD
$17.6
NASDAQ: BAGRNASDAQ: BAGR
© 2014 by Diversified Restaurant Holdings, Inc.29
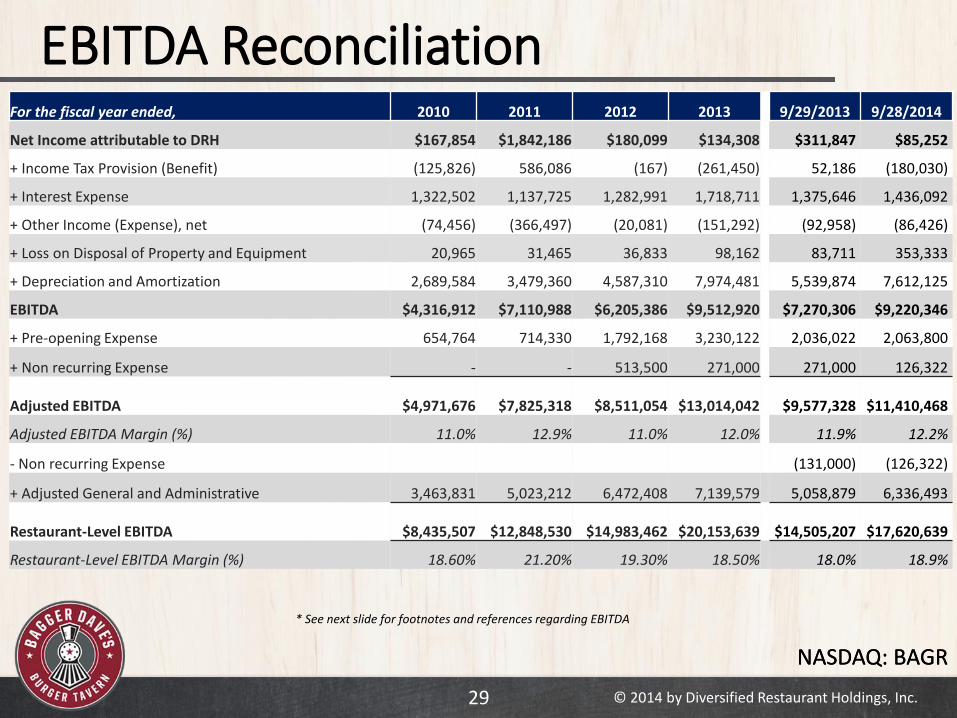
EBITDA Reconciliation
* See next slide for footnotes and references regarding EBITDA
For the fiscal year ended, 2010 2011 2012 2013 9/29/2013 9/28/2014
Net Income attributable to DRH $167,854 $1,842,186 $180,099 $134,308 $311,847 $85,252
+ Income Tax Provision (Benefit) (125,826) 586,086 (167) (261,450) 52,186 (180,030)
+ Interest Expense 1,322,502 1,137,725 1,282,991 1,718,711 1,375,646 1,436,092
+ Other Income (Expense), net (74,456) (366,497) (20,081) (151,292) (92,958) (86,426)
+ Loss on Disposal of Property and Equipment 20,965 31,465 36,833 98,162 83,711 353,333
+ Depreciation and Amortization 2,689,584 3,479,360 4,587,310 7,974,481 5,539,874 7,612,125
EBITDA $4,316,912 $7,110,988 $6,205,386 $9,512,920 $7,270,306 $9,220,346
+ Pre-opening Expense 654,764 714,330 1,792,168 3,230,122 2,036,022 2,063,800
+ Non recurring Expense - - 513,500 271,000 271,000 126,322
Adjusted EBITDA $4,971,676 $7,825,318 $8,511,054 $13,014,042 $9,577,328 $11,410,468
Adjusted EBITDA Margin (%) 11.0% 12.9% 11.0% 12.0% 11.9% 12.2%
- Non recurring Expense (131,000) (126,322)
+ Adjusted General and Administrative 3,463,831 5,023,212 6,472,408 7,139,579 5,058,879 6,336,493
Restaurant-Level EBITDA $8,435,507 $12,848,530 $14,983,462 $20,153,639 $14,505,207 $17,620,639
Restaurant-Level EBITDA Margin (%) 18.60% 21.20% 19.30% 18.50% 18.0% 18.9%

NASDAQ: BAGRNASDAQ: BAGR
© 2014 by Diversified Restaurant Holdings, Inc.30
EBITDA ReconciliationRestaurant-Level EBITDA represents net income plus the sum of non-restaurant specific general and administrative expenses, restaurant pre-opening costs, loss on property and equipment
disposals, the change in fair value of derivative instruments, depreciation and amortization, other income and expenses, interest, taxes and non-recurring acquisition related costs expenses.
Adjusted EBITDA represents net income plus the sum of restaurant pre-opening costs, loss on property and equipment disposals, the change in fair value of derivative instruments,
depreciation and amortization, other income and expenses, interest, taxes and non-recurring acquisition related costs expenses. We are presenting Restaurant-Level EBITDA and Adjusted
EBITDA, which are not prepared in accordance with GAAP, because we believe that they provide an additional metric by which to evaluate our operations and, when considered together
with our GAAP results and the reconciliation to our net income, we believe they provide a more complete understanding of our business than could be obtained absent this disclosure. We
use Restaurant-Level EBITDA and Adjusted EBITDA, together with financial measures prepared in accordance with GAAP, such as revenue, income from operations, net income and cash
flows from operations, to assess our historical and prospective operating performance and to enhance our understanding of our core operating performance. Restaurant-Level EBITDA and
Adjusted EBITDA are presented because: (i) we believe they are useful measures for investors to assess the operating performance of our business without the effect of non-cash
depreciation and amortization expenses; (ii) we believe that investors will find these measures useful in assessing our ability to service or incur indebtedness; and (iii) we use Restaurant-
Level EBITDA and Adjusted EBITDA internally as benchmarks to evaluate our operating performance or compare our performance to that of our competitors.
Additionally, we present Restaurant-Level EBITDA because it excludes the impact of general and administrative expenses, which are not incurred at the restaurant level, and restaurant pre-
opening costs, which are non-recurring at the restaurant level. The use of Restaurant-Level EBITDA thereby enables us and our investors to compare our operating performance between
periods and to compare our operating performance to the performance of our competitors. The measure is also widely used within the restaurant industry to evaluate restaurant level
productivity, efficiency and performance. The use of Restaurant-Level EBITDA and Adjusted EBITDA as performance measures permits a comparative assessment of our operating
performance relative to our performance based on our GAAP results, while isolating the effects of some items that vary from period to period without any correlation to core operating
performance or that vary widely among similar companies. Companies within our industry exhibit significant variations with respect to capital structures and cost of capital (which affect
interest expense and tax rates) and differences in book depreciation of facilities and equipment (which affect relative depreciation expense), including significant differences in the
depreciable lives of similar assets among various companies. Our management believes that Restaurant-Level EBITDA and Adjusted EBITDA facilitate company-to-company comparisons
within our industry by eliminating some of the foregoing variations.
Restaurant-Level EBITDA and Adjusted EBITDA are not determined in accordance with GAAP and should not be considered in isolation or as an alternative to net income, income from
operations, net cash provided by operating, investing or financing activities or other financial statement data presented as indicators of financial performance or liquidity, each as presented
in accordance with GAAP. Neither Restaurant-Level EBITDA nor Adjusted EBITDA should be considered as a measure of discretionary cash available to us to invest in the growth of our
business. Restaurant-Level EBITDA and Adjusted EBITDA as presented may not be comparable to other similarly titled measures of other companies and our presentation of Restaurant-
Level EBITDA and Adjusted EBITDA should not be construed as an inference that our future results will be unaffected by unusual items. Our management recognizes that Restaurant-Level
EBITDA and Adjusted EBITDA have limitations as analytical financial measures, including the following:
• Restaurant-Level EBITDA and Adjusted EBITDA do not reflect our current capital expenditures or future requirements for capital expenditures;
• Restaurant-Level EBITDA and Adjusted EBITDA do not reflect the interest expense, or the cash requirements necessary to service interest or principal payments, associated with our
indebtedness;
• Restaurant-Level EBITDA and Adjusted EBITDA do not reflect depreciation and amortization, which are non-cash charges, although the assets being depreciated and amortized will likely
have to be replaced in the future, nor do Restaurant-Level EBITDA and Adjusted EBITDA reflect any cash requirements for such replacements;
• Restaurant-Level EBITDA and Adjusted EBITDA do not reflect changes in, or cash requirements for, our working capital needs;
• Restaurant-Level EBITDA and Adjusted EBITDA do not reflect disposals or other non-recurring income and expenses;
• Restaurant-Level EBITDA and Adjusted EBITDA do not reflect changes in fair value of derivative instruments;
• Restaurant-Level EBITDA and Adjusted EBITDA do not reflect restaurant pre-opening costs; and
• Restaurant-Level EBITDA does not reflect general and administrative expenses.
Adjusted EBITDA margin and Restaurant-Level EBITDA margin is defined as the ratio of Adjusted EBITDA and Restaurant-Level EBITDA to revenue. We present Adjusted EBITDA margin
and Restaurant-Level EBITDA margin because it is used by management as a performance measurement to judge the level of Adjusted EBITDA and Restaurant-Level EBITDA generated
from revenue and we believe its inclusion is appropriate to provide additional information to investors.
NASDAQ: BAGRNASDAQ: BAGR
© 2014 by Diversified Restaurant Holdings, Inc.31
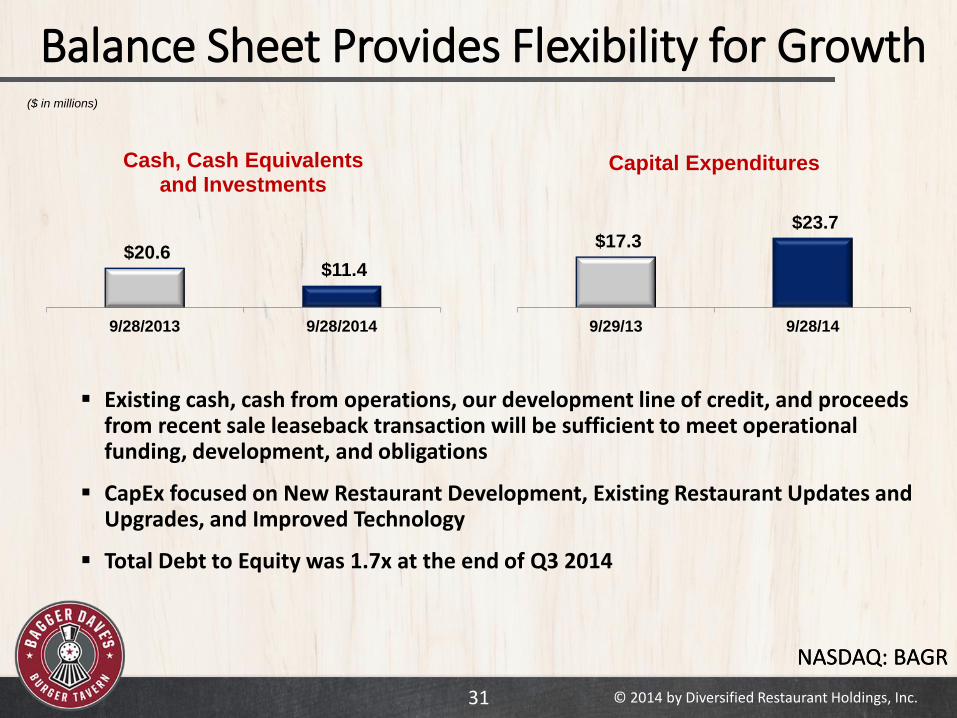
Balance Sheet Provides Flexibility for Growth($ in millions)
$20.6 $11.4
9/28/2013 9/28/2014
Cash, Cash Equivalents and Investments
$17.3 $23.7
9/29/13 9/28/14
Capital Expenditures
Existing cash, cash from operations, our development line of credit, and proceeds from recent sale leaseback transaction will be sufficient to meet operational funding, development, and obligations
CapEx focused on New Restaurant Development, Existing Restaurant Updates and Upgrades, and Improved Technology
Total Debt to Equity was 1.7x at the end of Q3 2014
Contact Information
Investor Contact: Company Contact:Alex Hamilton David G. BurkeKei Advisors, LLC Chief Financial Officer716.242.8632 [email protected]
Or visit us at:
www.diversifiedrestaurantholdings.com
NASDAQ: BAGR
Contact Information
Investor Contacts:
Raphael Gross Sheryl Freeman203.682.8253 [email protected] [email protected]
Or visit us at:
www.diversifiedrestaurantholdings.com
NASDAQ: BAGR © 2014 by Diversified Restaurant Holdings, Inc.