Embed Size (px)
Citation preview
GC-113--1
TOOLS AND TOYS FOR TEACHING DESIGN OF EXPERIMENTS METHODOLOGY L. M. Lye1 1. Faculty of Engineering and Applied Science, Memorial University of Newfoundland, St. John’s, NL, Canada ABSTRACT: It is recognized that the factorial approach first introduced by R.A. Fisher is the correct and scientific approach in conducting multi-factored experiments. In this paper, an approach that uses specially designed toys and software that allow students to conduct multi-factored experiments, analyze the data collected, and do follow-up experiments, is described. Several physical and software toys and how they are used in a course on experimental design for engineers will be presented. The software available to analyze and present the data is also discussed. It is hoped that these toys and tools will help facilitate the teaching and learning of proper design of experiment methodologies. 1. INTRODUCTION The design of engineering systems is rarely accomplished exclusively by applying fundamental scientific principles. In most cases, the design of systems also requires some use of empirical data and experimentation. As such, engineers, scientists, and even businesses carry out experiments in the field, laboratory, computer, or marketplace to discover how different factors may affect the response of the system they are investigating. Often these experiments are multi-factored with multi-responses. As usual, time and budget are limited. It is recognized that the factorial approach first introduced by R.A. Fisher is the correct and scientific approach in conducting multi-factored experiments. These designs are now widely used in industry. This is resulting in a trend of teaching engineers the design of experiments so they can more efficiently plan experiments and analyse and understand the results. These methodologies are now widely taught in industry through six sigma programs, as well as through more traditional college and professional education programs. The methods of experimental design are now widely disseminated and are having a significant impact throughout industry (Dym, et al, 2005). These designs are statistically based and should follow the basic statistical principles of experimental design. The question is: how do we teach all these designs and principles to students in a course in such a way that is easy to learn, fun, challenging, and memorable? In this paper, an approach that uses specially designed toys and software that allow students to conduct multi-factored experiments, analyze the data collected, and do follow-up experiments, is described. Several physical and software toys are described and how they are used in a course on experimental design for engineers will be presented. The software available to analyze and present the data is also discussed. It is hoped that these toys and tools will help facilitate the teaching and learning of proper design of experiment methodologies. This paper has six sections. Section 2, the definition of an experiment and some everyday example of experiments will be given. Examples of experiments from the field of civil engineering will also be
33rd Annual General Conference of the Canadian Society for Civil Engineering 33e Congrès général annuel de la Société canadienne de génie civil
Toronto, Ontario, Canada June 2-4, 2005 / 2-4 juin 2005
GC-113--2
discussed. Some commonly used strategies and their advantages and disadvantages for conducting experiments will be discussed in Section 3. In Section 4, teaching the key statistical concepts of design of experiments using specially designed toys will be presented. Strategies for using these toys and software to design the experiment, analyse the data collected, and present the results will also be discussed. Discussion and conclusion are given in Section 5. References are given in Section 6. 2. EXPERIMENTS An experiment is basically a test or a series of tests in which purposeful changes are made to the input variables or factors of a system so that we may observe and identify the reasons for changes observed in the outputs or responses (Montgomery, 2001). Some simple examples of experiments from daily life include:
Microwave popcorns:
Factors: brand, time, power, height (on bottom or raised) Responses: taste (maximize), un-popped kernels (minimize) Photography: Factors: film speed, lighting, shutter speed Response: quality of slides Boiling water: Factors: pan type, burner size, cover Response: time to boil water Mailing: Factors: stamp, area code, time of day, location Response: number of days required for delivery Basketball: Factors: distance from basket, type of shot, location on court Response: number of shots made (out of 10) with basketball
In the field of civil engineering, many empirical equations in use today ranging from hydraulics to soil mechanics are the result of experiments carried out by researchers in the field, laboratory, or on computers using sophisticated computer models. As engineering systems and designs become more and more complex, to figure out the system response(s) as the many input factors are varied may be out of the question using analytical methods. One may have no choice but to resort to the experimental method. Consider the design of an engineering system that has five input factors (A, B, C, D, and E) and two output responses (Y1 and Y2). It may be desired to determine:
• the relative contribution of A, B, C, D, and E to the responses Y1 and Y2; • which factors have a synergistic or antagonistic effect on the responses; • an equation that can be used to predict Y1 and Y2 given values of the input factors; and • what combination of the factors would maximize Y1 but minimize Y2?
As with most engineering problems, we are faced with limited time and budget. Hence we would like to gain as much information as possible and do so as efficiently as possible. How would one proceed to conduct such an experiment?
GC-113--3
3. STRATEGIES OF EXPERIMENTATION In engineering, one often-used approach is the best-guess (with engineering judgment) approach. Another strategy of experimentation that is prevalent in practice is the one-factor-at-a-time or OFAT approach. The OFAT method was once considered the standard, systematic, and accepted method of scientific experimentation. Both of these methods have been shown to be inefficient and in fact can be disastrous (Lye, 2002; Montgomery, 2001). These methods of experimentation became outdated in the early 1920s when Ronald A. Fisher discovered much more efficient methods of experimentation based on factorial designs. This class of experimental designs includes the general factorial, two-level factorial, fractional factorial, and response surface designs among others. These statistically based experimental design methods are now simply called design of experiment methods or DOE methods. Some recent applications of DOE methods in civil engineering can be found in Box et al (1978), Ebead et al (2002), Lye (2002, 2003), Mukhtasor and Lye (2004), Zangeneh et al (2002), and Kandil and Lye (2005), among others.
Basically, DOE is a methodology for systematically applying statistics to experimentation. DOE lets experimenters develop a mathematical model that predicts how input variables interact to create output variables or responses in a process or system. DOE can be used for a wide range of experiments for various purposes including nearly all fields of engineering and science and even in marketing studies. The use of statistics is important in DOE but not absolutely necessary. In general, by using DOE, we can:
• learn about the process we are investigating; • screen important factors; • determine whether factors interact; • build a mathematical model for prediction; and • optimize the response(s) if required.
DOE methods are also very useful as a strategy for building mechanistic models, and they have the additional advantage that no complicated calculations are needed to analyze the data produced from the designed experiment. It has been recognized for many years that the factorial-based DOE is the correct and the most efficient method of conducting multi-factored experiments; they allow a large number of factors to be investigated in few experimental runs. The efficiency stems from using settings of the independent factors that are completely uncorrelated with each other. That is, the experimental designs are orthogonal. The consequence of the orthogonal design is that the main effect of each experiment factor, and also the interactions between factors, can be estimated independent of the other effects. As stated earlier, industry has recognised this fact. Yet it is surprising that about 80 years after Fisher invented modern experimental design it is still not widely taught in schools of engineering and of science in our universities. Surely an engineer or scientist who does not know how to run and design an efficient experiment is not a very good engineer. The question is: how do we teach all these statistically based designs and principles to students in a course in such a way that is easy to learn, fun, challenging, and memorable? 4. TOYS AND SOFTWARE TOOLS FOR TEACHING DOE 4.1 DOE Toys Most of us are young at heart and not beyond playing with toys, especially toys that are fun, challenging, and educational. Hence using toys as a vehicle to teach design of experiment principles and methods is a good approach. In the literature, a number of toys have been suggested. Descriptions of some of these toys or apparatus are given below. Paper airplane or helicopter The use of paper airplanes was described by Sarin (1997) and the use of paper helicopters have been described in great detail by George Box in Tiao et al (2000). For the paper airplanes, at least six factors
GC-113--4
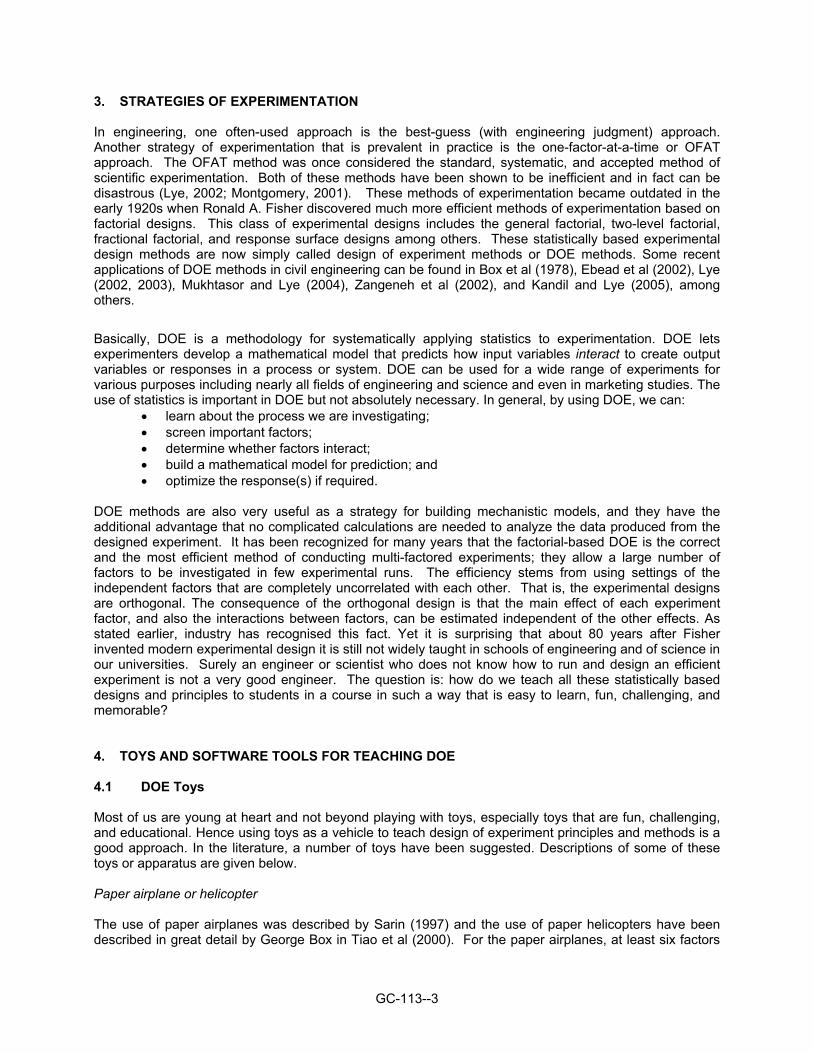
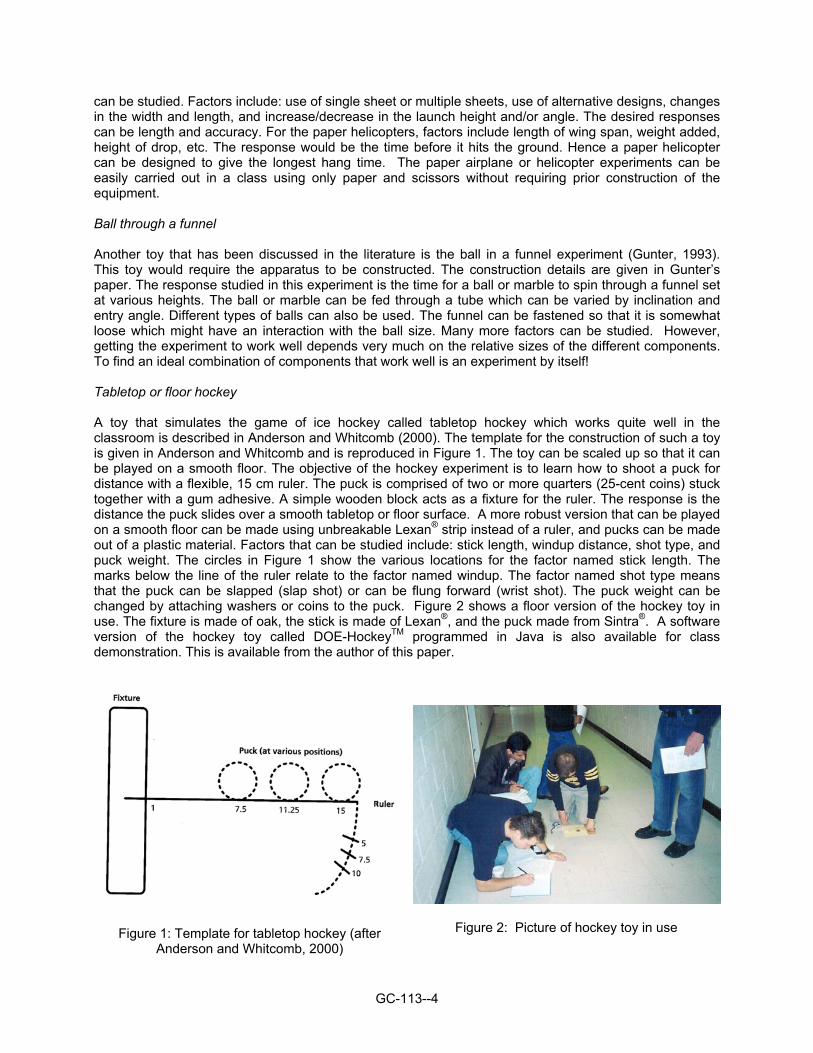
can be studied. Factors include: use of single sheet or multiple sheets, use of alternative designs, changes in the width and length, and increase/decrease in the launch height and/or angle. The desired responses can be length and accuracy. For the paper helicopters, factors include length of wing span, weight added, height of drop, etc. The response would be the time before it hits the ground. Hence a paper helicopter can be designed to give the longest hang time. The paper airplane or helicopter experiments can be easily carried out in a class using only paper and scissors without requiring prior construction of the equipment. Ball through a funnel Another toy that has been discussed in the literature is the ball in a funnel experiment (Gunter, 1993). This toy would require the apparatus to be constructed. The construction details are given in Gunter’s paper. The response studied in this experiment is the time for a ball or marble to spin through a funnel set at various heights. The ball or marble can be fed through a tube which can be varied by inclination and entry angle. Different types of balls can also be used. The funnel can be fastened so that it is somewhat loose which might have an interaction with the ball size. Many more factors can be studied. However, getting the experiment to work well depends very much on the relative sizes of the different components. To find an ideal combination of components that work well is an experiment by itself! Tabletop or floor hockey A toy that simulates the game of ice hockey called tabletop hockey which works quite well in the classroom is described in Anderson and Whitcomb (2000). The template for the construction of such a toy is given in Anderson and Whitcomb and is reproduced in Figure 1. The toy can be scaled up so that it can be played on a smooth floor. The objective of the hockey experiment is to learn how to shoot a puck for distance with a flexible, 15 cm ruler. The puck is comprised of two or more quarters (25-cent coins) stuck together with a gum adhesive. A simple wooden block acts as a fixture for the ruler. The response is the distance the puck slides over a smooth tabletop or floor surface. A more robust version that can be played on a smooth floor can be made using unbreakable Lexan® strip instead of a ruler, and pucks can be made out of a plastic material. Factors that can be studied include: stick length, windup distance, shot type, and puck weight. The circles in Figure 1 show the various locations for the factor named stick length. The marks below the line of the ruler relate to the factor named windup. The factor named shot type means that the puck can be slapped (slap shot) or can be flung forward (wrist shot). The puck weight can be changed by attaching washers or coins to the puck. Figure 2 shows a floor version of the hockey toy in use. The fixture is made of oak, the stick is made of Lexan®, and the puck made from Sintra®. A software version of the hockey toy called DOE-HockeyTM programmed in Java is also available for class demonstration. This is available from the author of this paper.
Figure 1: Template for tabletop hockey (after
Anderson and Whitcomb, 2000)
Figure 2: Picture of hockey toy in use
GC-113--5
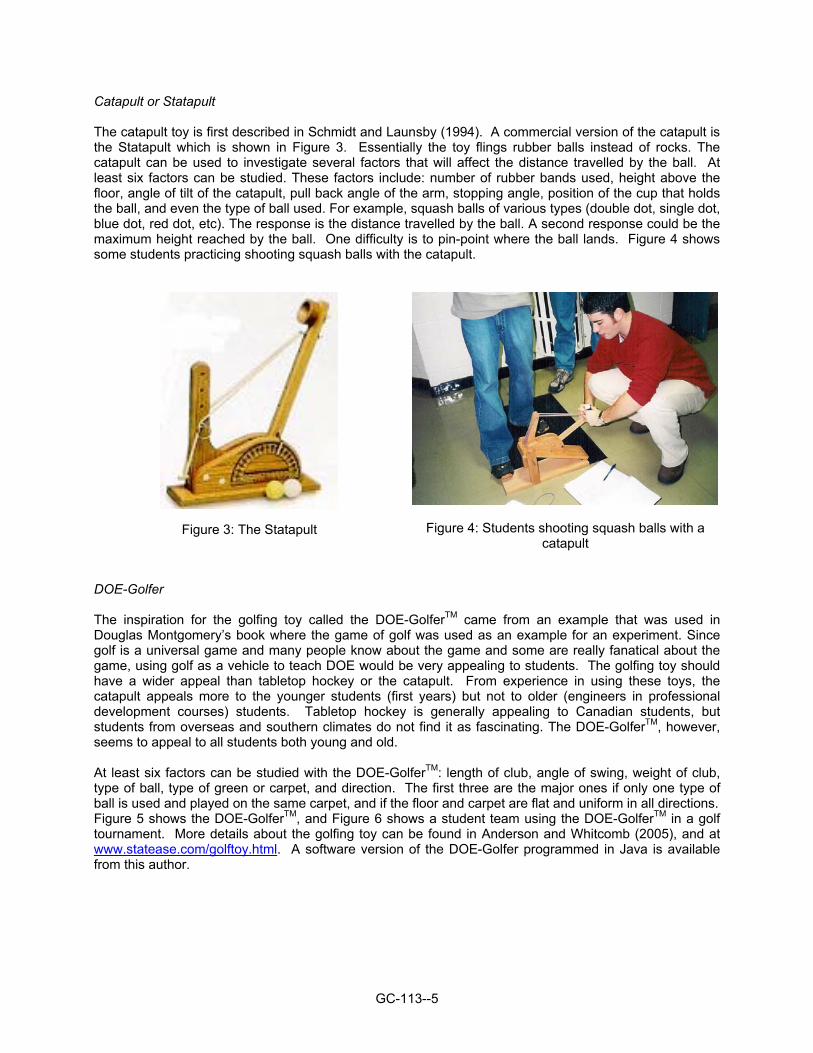
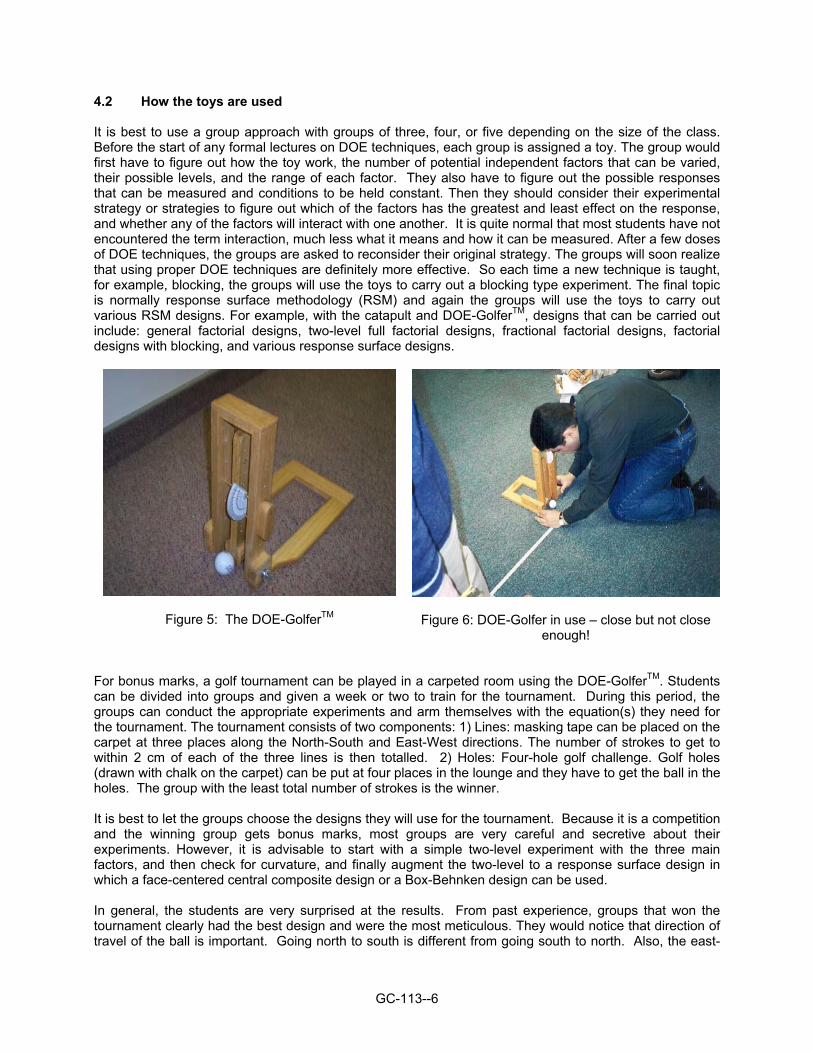
Catapult or Statapult The catapult toy is first described in Schmidt and Launsby (1994). A commercial version of the catapult is the Statapult which is shown in Figure 3. Essentially the toy flings rubber balls instead of rocks. The catapult can be used to investigate several factors that will affect the distance travelled by the ball. At least six factors can be studied. These factors include: number of rubber bands used, height above the floor, angle of tilt of the catapult, pull back angle of the arm, stopping angle, position of the cup that holds the ball, and even the type of ball used. For example, squash balls of various types (double dot, single dot, blue dot, red dot, etc). The response is the distance travelled by the ball. A second response could be the maximum height reached by the ball. One difficulty is to pin-point where the ball lands. Figure 4 shows some students practicing shooting squash balls with the catapult.
Figure 3: The Statapult
Figure 4: Students shooting squash balls with a catapult
DOE-Golfer The inspiration for the golfing toy called the DOE-GolferTM came from an example that was used in Douglas Montgomery’s book where the game of golf was used as an example for an experiment. Since golf is a universal game and many people know about the game and some are really fanatical about the game, using golf as a vehicle to teach DOE would be very appealing to students. The golfing toy should have a wider appeal than tabletop hockey or the catapult. From experience in using these toys, the catapult appeals more to the younger students (first years) but not to older (engineers in professional development courses) students. Tabletop hockey is generally appealing to Canadian students, but students from overseas and southern climates do not find it as fascinating. The DOE-GolferTM, however, seems to appeal to all students both young and old. At least six factors can be studied with the DOE-GolferTM: length of club, angle of swing, weight of club, type of ball, type of green or carpet, and direction. The first three are the major ones if only one type of ball is used and played on the same carpet, and if the floor and carpet are flat and uniform in all directions. Figure 5 shows the DOE-GolferTM, and Figure 6 shows a student team using the DOE-GolferTM in a golf tournament. More details about the golfing toy can be found in Anderson and Whitcomb (2005), and at www.statease.com/golftoy.html. A software version of the DOE-Golfer programmed in Java is available from this author.
GC-113--6
4.2 How the toys are used It is best to use a group approach with groups of three, four, or five depending on the size of the class. Before the start of any formal lectures on DOE techniques, each group is assigned a toy. The group would first have to figure out how the toy work, the number of potential independent factors that can be varied, their possible levels, and the range of each factor. They also have to figure out the possible responses that can be measured and conditions to be held constant. Then they should consider their experimental strategy or strategies to figure out which of the factors has the greatest and least effect on the response, and whether any of the factors will interact with one another. It is quite normal that most students have not encountered the term interaction, much less what it means and how it can be measured. After a few doses of DOE techniques, the groups are asked to reconsider their original strategy. The groups will soon realize that using proper DOE techniques are definitely more effective. So each time a new technique is taught, for example, blocking, the groups will use the toys to carry out a blocking type experiment. The final topic is normally response surface methodology (RSM) and again the groups will use the toys to carry out various RSM designs. For example, with the catapult and DOE-GolferTM, designs that can be carried out include: general factorial designs, two-level full factorial designs, fractional factorial designs, factorial designs with blocking, and various response surface designs.
Figure 5: The DOE-GolferTM
Figure 6: DOE-Golfer in use – close but not close
enough! For bonus marks, a golf tournament can be played in a carpeted room using the DOE-GolferTM. Students can be divided into groups and given a week or two to train for the tournament. During this period, the groups can conduct the appropriate experiments and arm themselves with the equation(s) they need for the tournament. The tournament consists of two components: 1) Lines: masking tape can be placed on the carpet at three places along the North-South and East-West directions. The number of strokes to get to within 2 cm of each of the three lines is then totalled. 2) Holes: Four-hole golf challenge. Golf holes (drawn with chalk on the carpet) can be put at four places in the lounge and they have to get the ball in the holes. The group with the least total number of strokes is the winner. It is best to let the groups choose the designs they will use for the tournament. Because it is a competition and the winning group gets bonus marks, most groups are very careful and secretive about their experiments. However, it is advisable to start with a simple two-level experiment with the three main factors, and then check for curvature, and finally augment the two-level to a response surface design in which a face-centered central composite design or a Box-Behnken design can be used. In general, the students are very surprised at the results. From past experience, groups that won the tournament clearly had the best design and were the most meticulous. They would notice that direction of travel of the ball is important. Going north to south is different from going south to north. Also, the east-
GC-113--7
west direction is different from the north-south direction. Taking this into account would make quite a difference. The moral here is not to assume that the floor is flat or the carpet is uniform in all directions. Using the DOE-GolferTM as a vehicle for teaching DOE has been found to be a great success. The students really enjoyed it and they learned much about both DOE and golf and it was lots of fun. Since according to George Box “the best time to do an experiment is after it has been done”, it is a good idea to ask the winners to share their secrets of their success and every group should be asked: If they had a chance to compete again, what would they do different? Most groups would probably agree that they should have done more replications and should have considered combinations that would give the shorter distances. For example, their first stroke would usually get them fairly close to the line or hole (maybe 3 cm away), and now they need a factor combination for 3 cm. Some groups completely forgot about this possibility. Also, if they overshoot in the first stroke, the next stroke is in the opposite direction. If they did not consider direction as a factor, then again their prediction is not accurate. 4.3 DOE Software The basic calculations required for designing and analysing factorial experiments are not difficult, Most of the calculations can be carried out by hand or by spreadsheet but can be tedious. Fortunately, aside from general software packages that have DOE routines e.g. Minitab®, Systat®, SAS®, SPSS® among others, there exist quite a number of excellent standalone software packages designed specifically for DOE. A list of some of the DOE software available with a very brief description of their features is given below. Design-Expert This standalone software is available from Statease Inc. (www.statease.com). This easy to use software has all the major experimental designs (general ANOVA, two-level full and fractional factorials, three-level factorials, several RSM designs, mixture designs, and much more. More and more features are added with each new version of the software. It has powerful graphical tools and it has been featured in several well-known texts on DOE. Apparently it has been widely used in industry. The web site provides excellent DOE resources and one can download a 30-day full version from the web site. DOE Wisdom This standalone software is available from Launsby Consulting (www.launsby.com). This software also claims that it offers practicality and ease-of-use that is ideal for beginners but with the computing power demanded by advanced users. It basically offers very similar features to Design-Expert with the addition of the Pareto chart and a few other minor differences. One can download a 15-day full version of the software for the web site. DOEpack This standalone software available from PQ Systems (www.pqsystems.com) also features the usual classical and Taguchi designs with a wide selection of screening designs, process optimization design and analysis tools. It has good graphical tools and an intuitive user interface. JMP This standalone DOE software is developed by the well-known SAS Institute, developers of the SAS program. More information can be obtained from (www.jmp.com). This is also powerful software and provides design choices for almost every situation. Perhaps the additional feature that is not available in the other software is that the user can perform custom designs which give the experimenter the most flexibility. Obviously, this feature is only useful for the expert user. Limited time free download of the software is also available from the JMP web site. Aside from standalone software, there are also Excel add-in DOE software where the software runs within and is fully integrated with, Microsoft Excel spreadsheet package. Two such software are: DOE PRO XL
GC-113--8
available from (www.sigmazone.com) and DOE KISS available from the DOES Institute (www.does.org). These software provide the familiar spreadsheet interface and basically have most of the features of the above standalone packages. There is a wide choice of software and it is advisable to download the free trial versions and try them out. The final choice depends on price, features, and availability of technical support for the software itself and for statistical help, resources and advice. 5. DISCUSSION AND CONCLUSION Several physical and software versions of toys and how they can be used in a course for teaching proper design of experiment methodology for engineers was described. Several software that can be used to analyse the data collected and present the results of the experimental design was also discussed. The use of specially designed toys as a vehicle for teaching and learning design of experiments is a great success. It is hands-on, fun, challenging, and memorable. It is thus highly recommended. 6. REFERENCES Anderson, M. J. and Whitcomb, P. J. 2000. DOE Simplified: Practical Tools for Effective Experimentation, Productivity Inc.Portland, OR. Anderson, M. J. and Whitcomb, P. J. 2005. RSM Simplified: Optimizing Processes Using Response Surface Methods for Design of Experiments. Productivity Inc.Portland, OR. Box, G. E. P., W. G. Hunter, and J. S. Hunter (1978): Statistics for Experimenters: An Introduction to Design, Data Analysis, and Model Building, NY, Wiley Interscience. Dym, C. L., Agogino, A. M., Ozgur, E., Frey, D. D., and Leifer, L. J. 2005. Engineering Design Thinking, Teaching, and Learning, Journal of Engineering Education, Vol. 94, No. 1, pages 103-120. Ebead, U., Marzouk, H. and Lye, L. M. 2002. Strengthening of Two-Way Slabs Using FRP Materials: A Simplified Analysis Based on Response Surface Methodology, Proceedings 2nd World Engineering Congress, Kuching, Malaysia. Gunter, B. 1993. Through a Funnel Slowly with Ball Bearing and Insight to Teach Experimental Design, The American Statistician, Vol. 47, November. Kandil, K. and Lye, L. M. 2005. A Design of Experiment Approach to Pavement Responses Evaluation, Proceedings of the 6th Transportation Specialty Conference, Toronto Ontario, June. Lye, L. M. 2002. Design of Experiments in Civil Engineering: Are we still in the 1920s?, Proceedings of the 30th Annual Conference of the Canadian Society for Civil Engineering, Montreal, Quebec, June. Lye, L. M. 2003. Some Applications of Design of Experiment Methodology in Civil Engineering, Proceedings of the 32nd Annual Conference of the Canadian Society for Civil Engineering, Moncton, NB, June.
Montgomery, D. G. (2001): Design and Analysis of Experiments, 5th Edition, John Wiley and Sons, Inc.
Mukhtasor and Lye, L. M. 2004. Use of Response Surface Methodology is Extracting a Model from an Artificial Neural Network: A Case of Initial Dilution Modelling, Proceedings of the 33rd Annual Conference of the Canadian Society for Civil Engineering, Saskatoon, Saskatchewan, June. Sarin, S. 1997. Teaching Taguchi’s Approach to Parameter Design, Quality Progress, May.
GC-113--9
Schmidt, S.R. and Launsby, R. G. 1994. Understanding Industrial Designed Experiments, 4th Edition, Air Academy Press, Colorado. Tiao, G. C., Hill, B., Bisgaard, S., Pena, D., and Stigler, S. (Editors), 2000. Box on Quality and Discovery: with Design Control, and Robustness. John Wiley and Sons, New Jersey. Zangeneh, N, A. Azizian, L. M. Lye, and R. Popescu (2002): Application of Response Surface Methodology in Numerical Geotechnical Analysis, Proceedings 55th Canadian Geotechnical Conference, Niagara Falls, Canada.


![Lye Soap Final[1]](https://img.dokumen.tips/doc/110x75/54556429af79591a448b539c/lye-soap-final1-5584af0a8bd7c.jpg)