Embed Size (px)
Citation preview
2www.activate.com
Welcome to Activate’s Tech and Media Outlook 2017.
For everyone in the tech and media industry, there’s the fun and challenge of trying to anticipate what’s going to matter in the future. That’s why we take time each year, as part of the WSJD Live Conference, to offer a look at the big picture, identifying and evaluating the non-obvious patterns and sometimes-subtle trends that help us predict what’s about to happen next.
We’re most excited to share the Outlook for its surprising and unexpected insights. From the rise of messaging bots, to the extraordinary growth of eSports, to the future of streaming music, we’ve uncovered the key insights and likely trends. There’s also a hard look at the likely winners in Pay TV and video streaming. Forecasts include how consumers will spend their tech and media time, the next wave of internet and media revenues, and the growth of the smart speaker category – which may be the most significant new platform launch since the smartphone. Some of the other results are important at a broader social level including a clear look at the tens of millions of people who are under-served by tech and media companies.
This year, we’ve gone deeper than ever, drawing upon extensive proprietary industry research along with brand new, exclusive user surveys of over 5,000 tech and media consumers. We know you’ll find the results both provocative and useful and we look forward to a lively discussion.
Let’s see where tech and media are headed!
The Activate Team
3www.activate.com
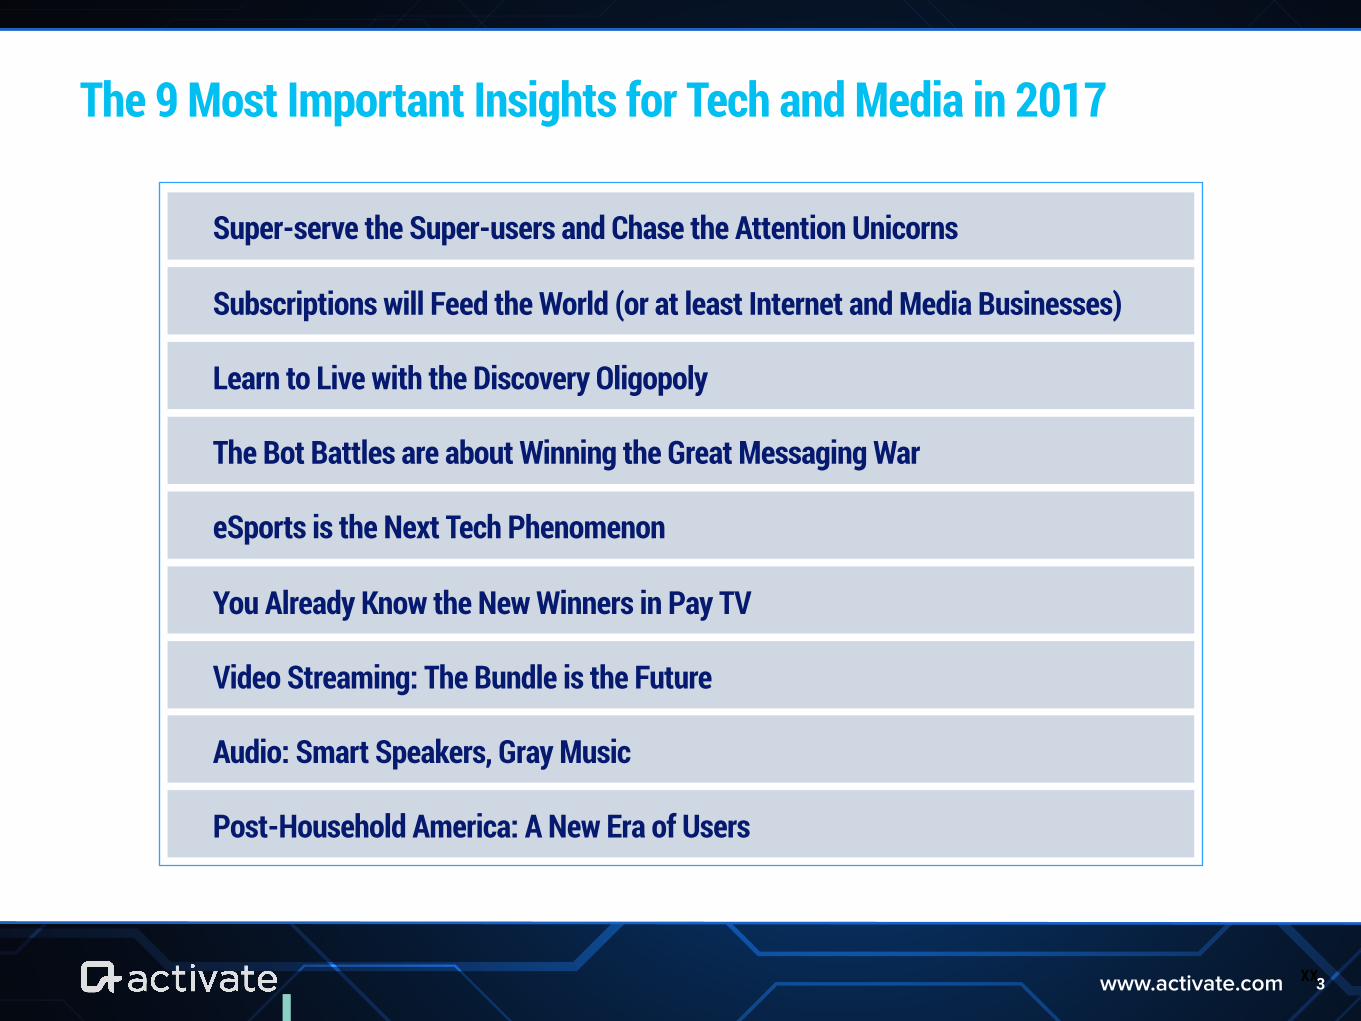
The 9 Most Important Insights for Tech and Media in 2017
XX
Super-serve the Super-users and Chase the Attention Unicorns
Subscriptions will Feed the World (or at least Internet and Media Businesses)
Learn to Live with the Discovery Oligopoly
The Bot Battles are about Winning the Great Messaging War
eSports is the Next Tech Phenomenon
You Already Know the New Winners in Pay TV
Video Streaming: The Bundle is the Future
Audio: Smart Speakers, Gray Music
Post-Household America: A New Era of Users
4www.activate.com
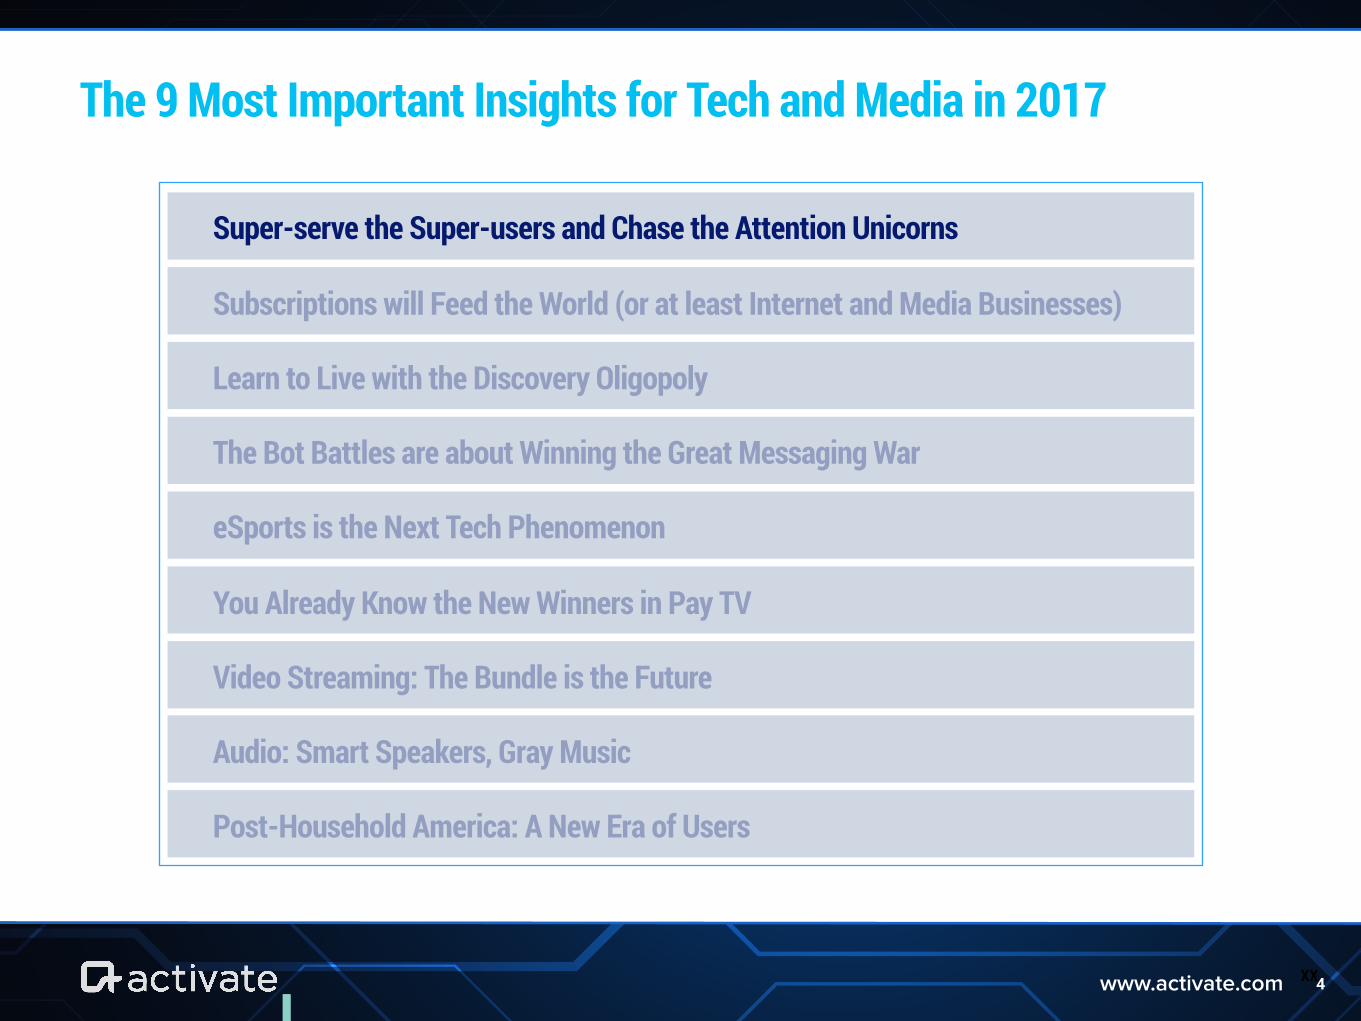
The 9 Most Important Insights for Tech and Media in 2017
XX
Super-serve the Super-users and Chase the Attention Unicorns
Subscriptions will Feed the World (or at least Internet and Media Businesses)
Learn to Live with the Discovery Oligopoly
The Bot Battles are about Winning the Great Messaging War
eSports is the Next Tech Phenomenon
You Already Know the New Winners in Pay TV
Video Streaming: The Bundle is the Future
Audio: Smart Speakers, Gray Music
Post-Household America: A New Era of Users
CONSUMER TIME & ATTENTION
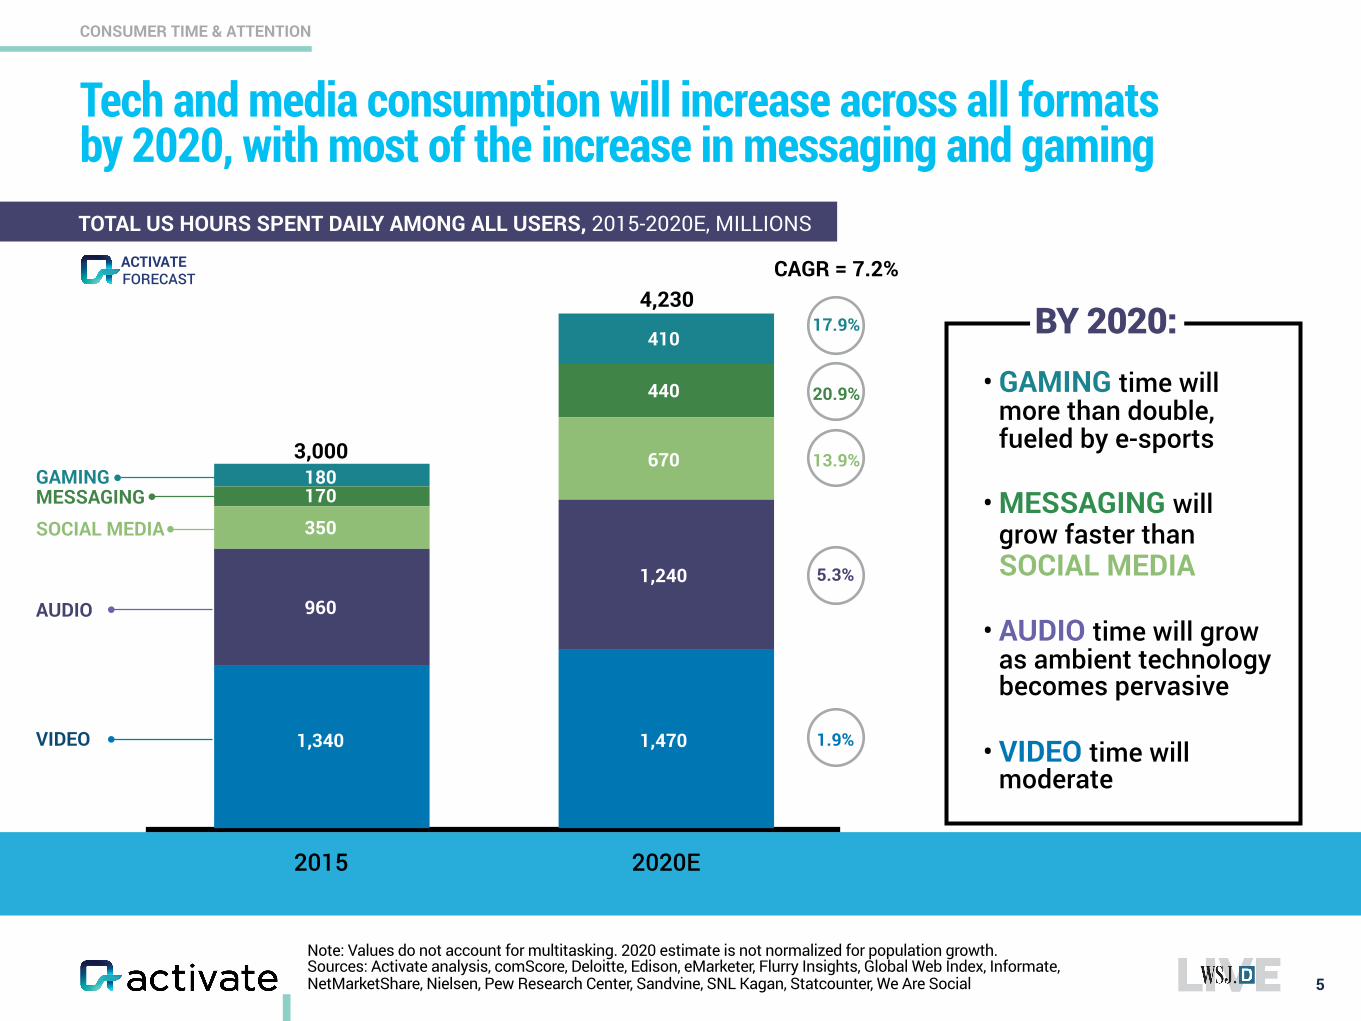
Tech and media consumption will increase across all formats by 2020, with most of the increase in messaging and gaming
5
Note: Values do not account for multitasking. 2020 estimate is not normalized for population growth. Sources: Activate analysis, comScore, Deloitte, Edison, eMarketer, Flurry Insights, Global Web Index, Informate, NetMarketShare, Nielsen, Pew Research Center, Sandvine, SNL Kagan, Statcounter, We Are Social
TOTAL US HOURS SPENT DAILY AMONG ALL USERS, 2015-2020E, MILLIONS
2015 2020E
CAGR = 7.2%
VIDEO
AUDIO
GAMING
• GAMING time will more than double, fueled by e-sports
• MESSAGING will grow faster than SOCIAL MEDIA
• AUDIO time will grow as ambient technology becomes pervasive
• VIDEO time will moderate
1,340 1,470
410
670
1,240
180170
960
17.9%
13.9%
5.3%
1.9%
SOCIAL MEDIA
3,000
4,230
20.9%
MESSAGING350
440
FORECASTACTIVATE
BY 2020:
Sources: Activate analysis, Activate 2016 Consumer Tech & Media Research Study (n=1,003)
CONSUMER TIME & ATTENTION
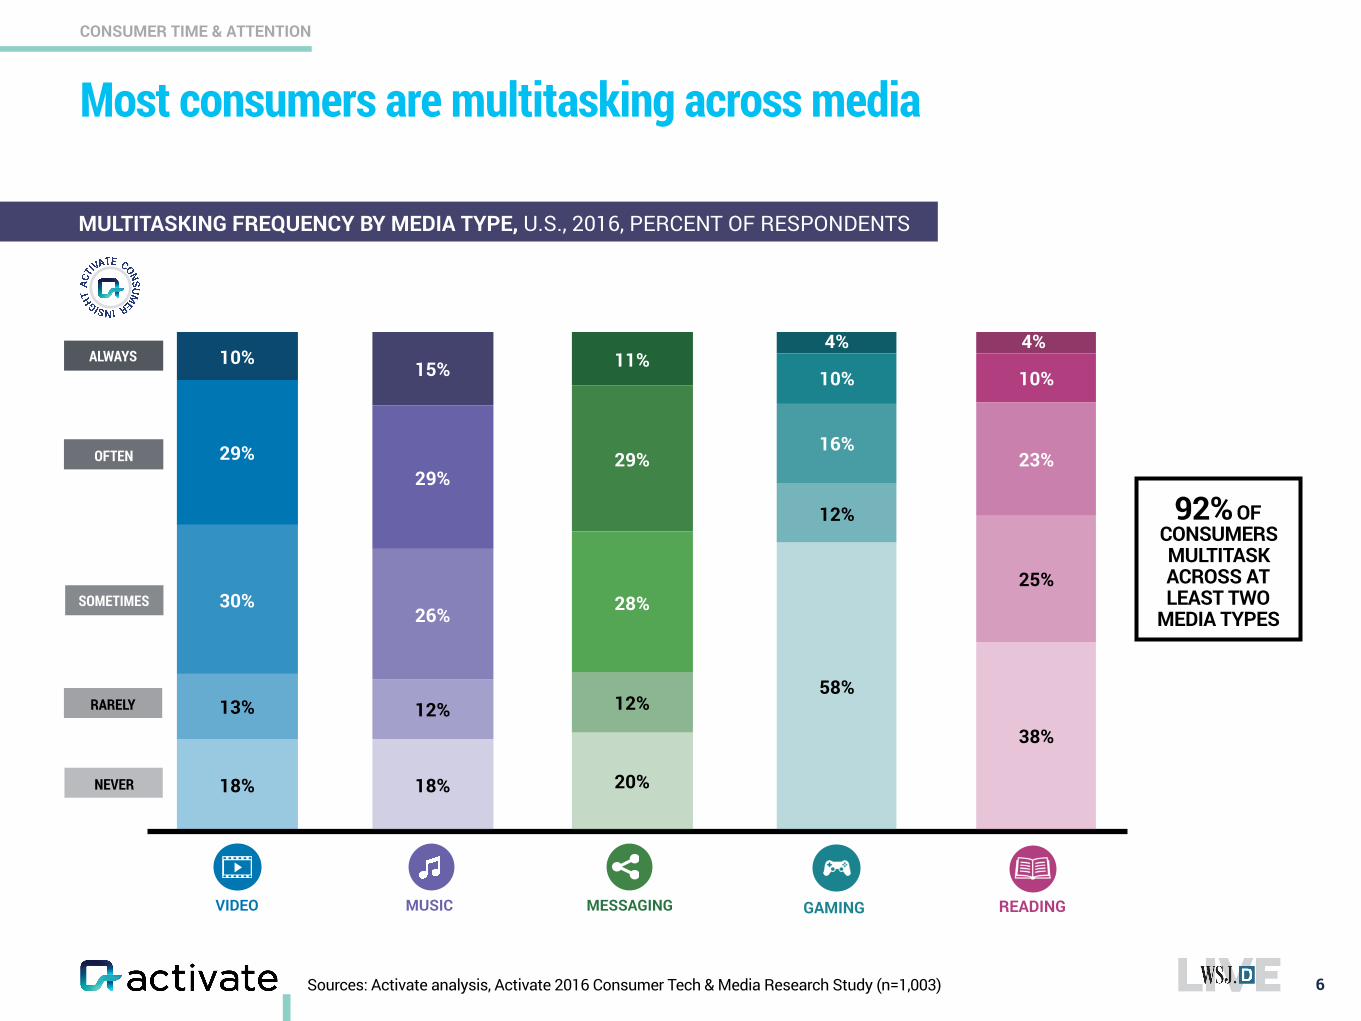
Most consumers are multitasking across media
6
NEVER
RARELY
SOMETIMES
OFTEN
ALWAYS 10%
29%
30%
13%
18%
VIDEO MUSIC GAMING READINGMESSAGING
15%
29%
26%
12%
18%
11%
29%
28%
12%
20%
10%
16%
12%
58%
10%
23%
25%
38%
4% 4%
92% OF CONSUMERS MULTITASK ACROSS AT LEAST TWO
MEDIA TYPES
MULTITASKING FREQUENCY BY MEDIA TYPE, U.S., 2016, PERCENT OF RESPONDENTS
CONSUMER TIME & ATTENTION
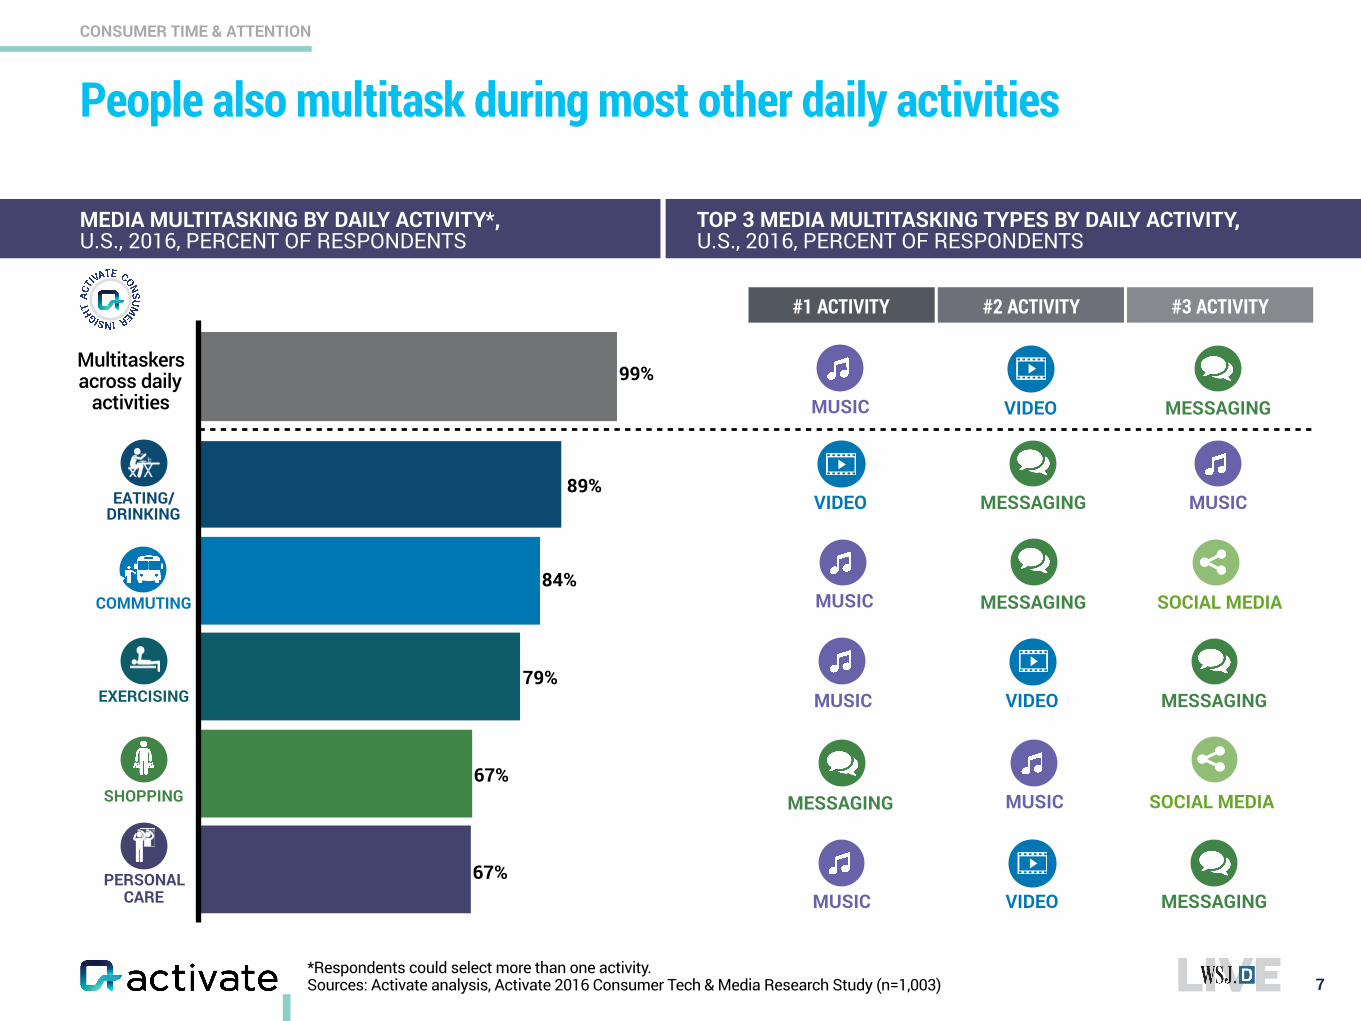
People also multitask during most other daily activities
7
MEDIA MULTITASKING BY DAILY ACTIVITY*, U.S., 2016, PERCENT OF RESPONDENTS
TOP 3 MEDIA MULTITASKING TYPES BY DAILY ACTIVITY, U.S., 2016, PERCENT OF RESPONDENTS
*Respondents could select more than one activity. Sources: Activate analysis, Activate 2016 Consumer Tech & Media Research Study (n=1,003)
#3 ACTIVITY#2 ACTIVITY#1 ACTIVITY
PERSONAL CARE
SHOPPING
EXERCISING
COMMUTING
EATING/ DRINKING
89%
84%
79%
67%
67%
99%Multitaskers across daily
activities
VIDEO MESSAGING MUSIC
MUSIC MESSAGING SOCIAL MEDIA
MUSIC VIDEO MESSAGING
MESSAGING MUSIC SOCIAL MEDIA
MUSIC VIDEO MESSAGING
MUSIC VIDEO MESSAGING
CONSUMER TIME & ATTENTION
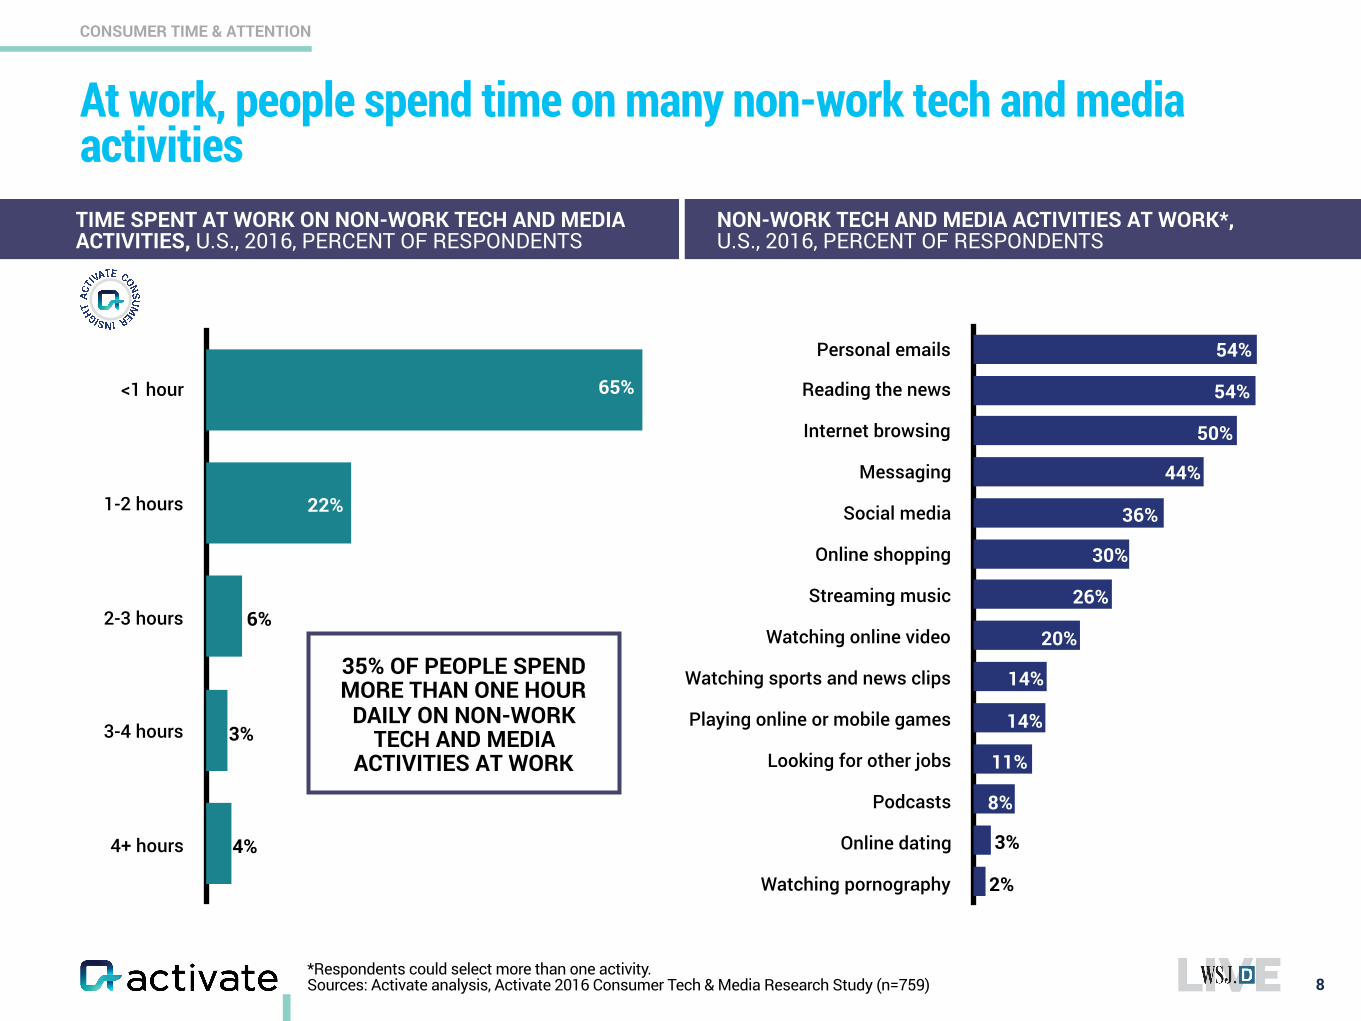
*Respondents could select more than one activity. Sources: Activate analysis, Activate 2016 Consumer Tech & Media Research Study (n=759)
At work, people spend time on many non-work tech and media activities
8
<1 hour
1-2 hours
2-3 hours
3-4 hours
4+ hours
TIME SPENT AT WORK ON NON-WORK TECH AND MEDIA ACTIVITIES, U.S., 2016, PERCENT OF RESPONDENTS
NON-WORK TECH AND MEDIA ACTIVITIES AT WORK*, U.S., 2016, PERCENT OF RESPONDENTS
Personal emails
Reading the news
Internet browsing
Messaging
Social media
Online shopping
Streaming music
Watching online video
Watching sports and news clips
Playing online or mobile games
Looking for other jobs
Podcasts
Online dating
Watching pornography
54%
54%
50%
44%
36%
30%
26%
20%
14%
14%
11%
8%
3%
2%
3%
4%
6%
22%
65%
35% OF PEOPLE SPEND MORE THAN ONE HOUR
DAILY ON NON-WORK TECH AND MEDIA
ACTIVITIES AT WORK
43%31%
82%
57%69%
18%
CONSUMER TIME & ATTENTION
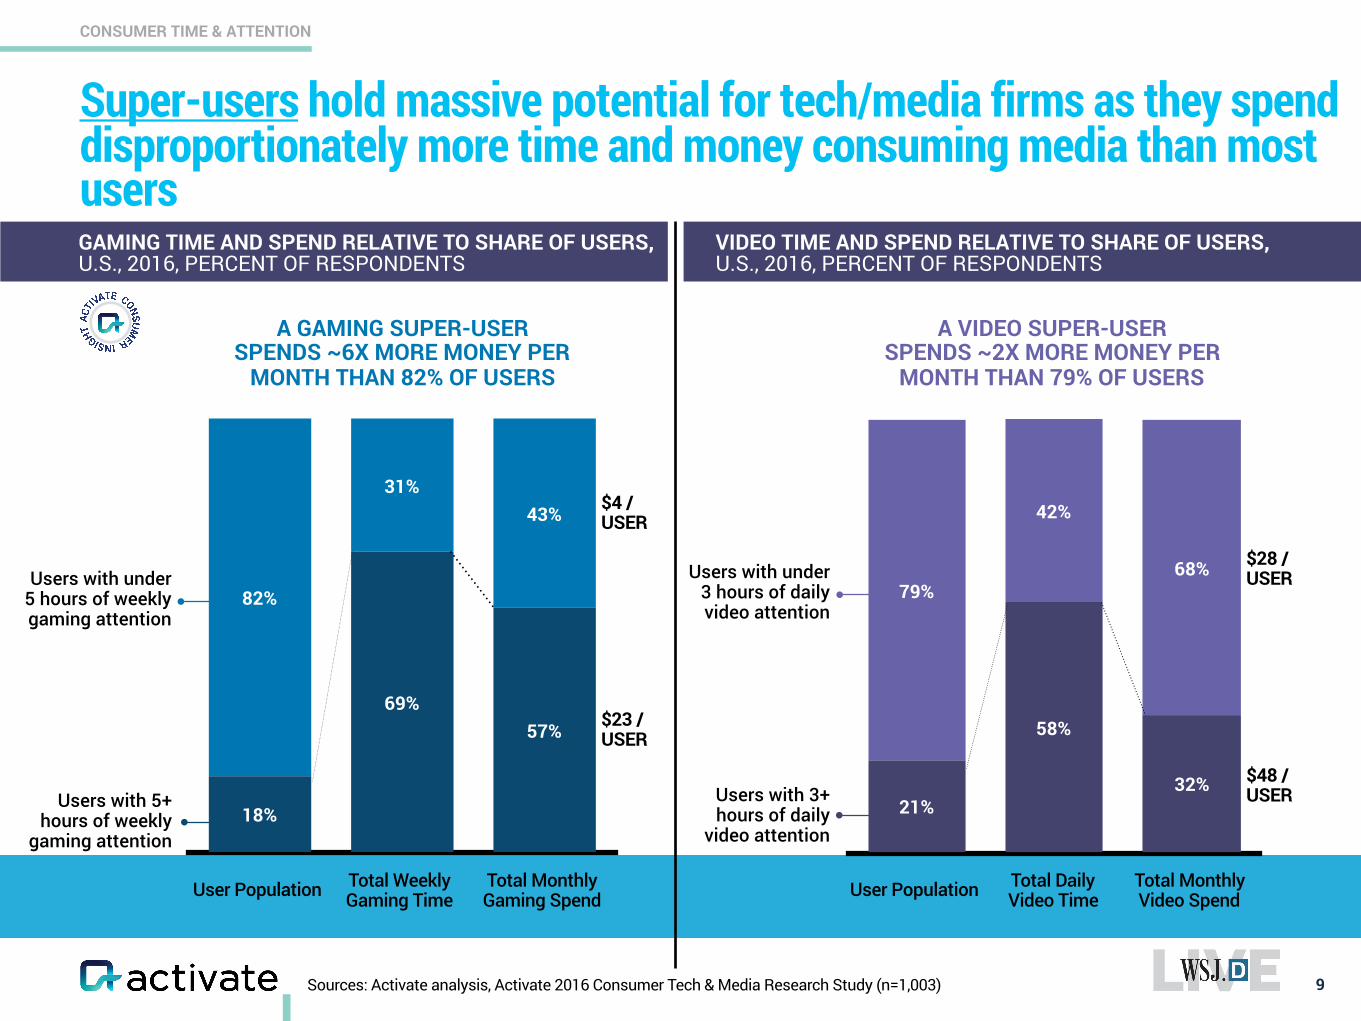
Super-users hold massive potential for tech/media firms as they spend disproportionately more time and money consuming media than most users
9
GAMING TIME AND SPEND RELATIVE TO SHARE OF USERS, U.S., 2016, PERCENT OF RESPONDENTS
Sources: Activate analysis, Activate 2016 Consumer Tech & Media Research Study (n=1,003)
VIDEO TIME AND SPEND RELATIVE TO SHARE OF USERS, U.S., 2016, PERCENT OF RESPONDENTS
A GAMING SUPER-USER SPENDS ~6X MORE MONEY PER
MONTH THAN 82% OF USERS
A VIDEO SUPER-USER SPENDS ~2X MORE MONEY PER
MONTH THAN 79% OF USERS
68%
42%
79%
32%
58%
21%Users with 5+ hours of weekly
gaming attention
Users with under 5 hours of weekly gaming attention
$23 / USER
$4 / USER
Users with 3+ hours of daily
video attention
Users with under 3 hours of daily video attention
$48 / USER
$28 / USER
Total Weekly Gaming Time
Total Monthly Gaming Spend
Total Daily Video Time
Total Monthly Video SpendUser Population User Population
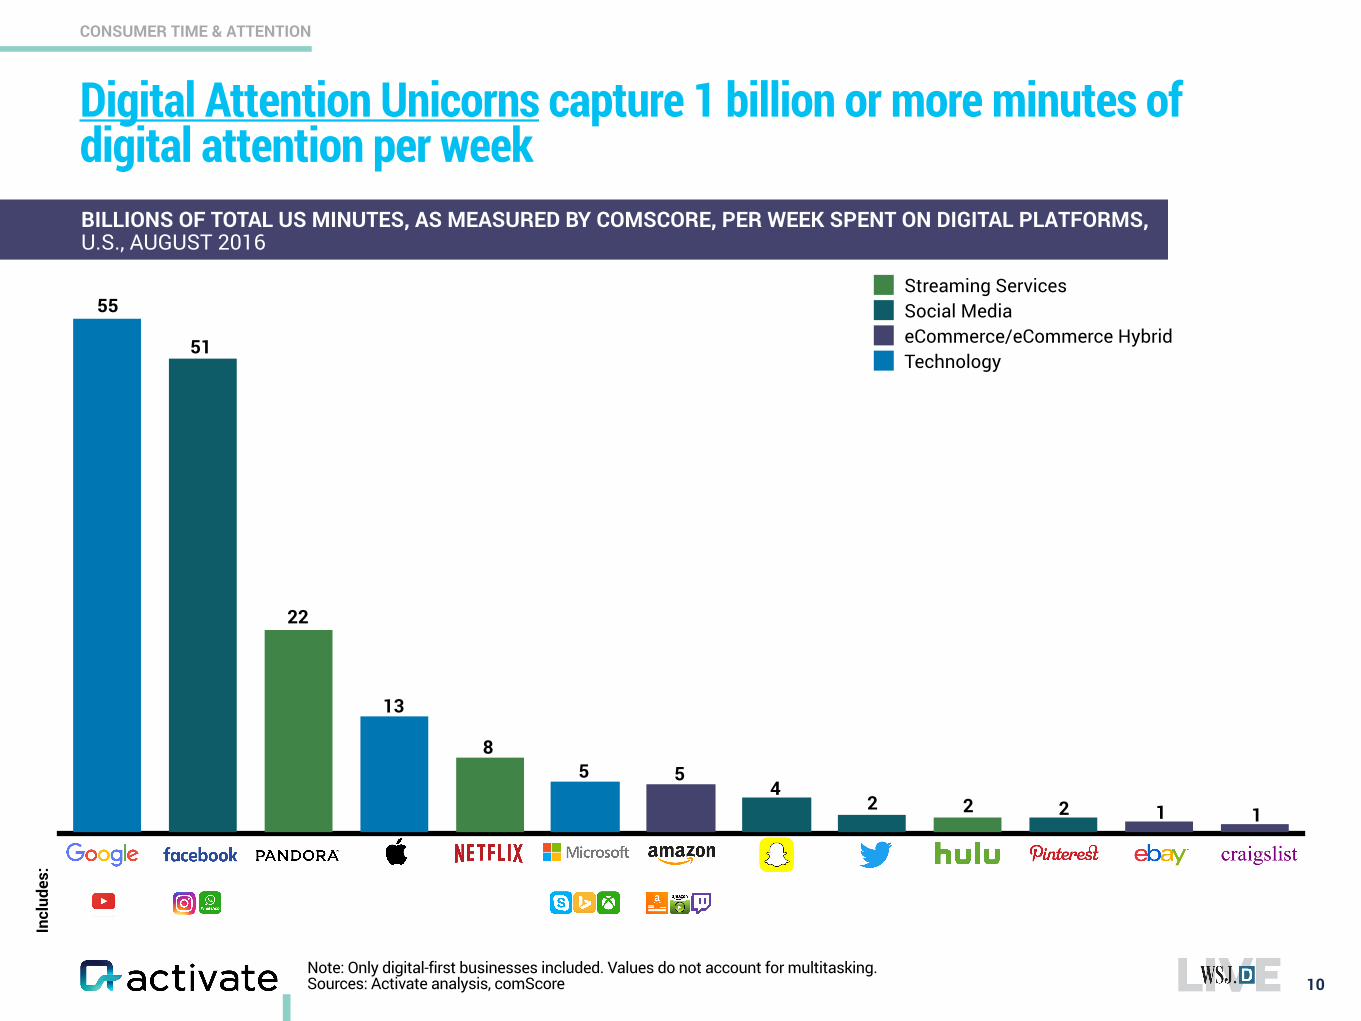
CONSUMER TIME & ATTENTION
Note: Only digital-first businesses included. Values do not account for multitasking. Sources: Activate analysis, comScore
Digital Attention Unicorns capture 1 billion or more minutes of digital attention per week
10
TechnologyeCommerce/eCommerce HybridSocial MediaStreaming Services
55
BILLIONS OF TOTAL US MINUTES, AS MEASURED BY COMSCORE, PER WEEK SPENT ON DIGITAL PLATFORMS, U.S., AUGUST 2016
51
22
13
85 5
42 2 1 1
Incl
udes
:
2
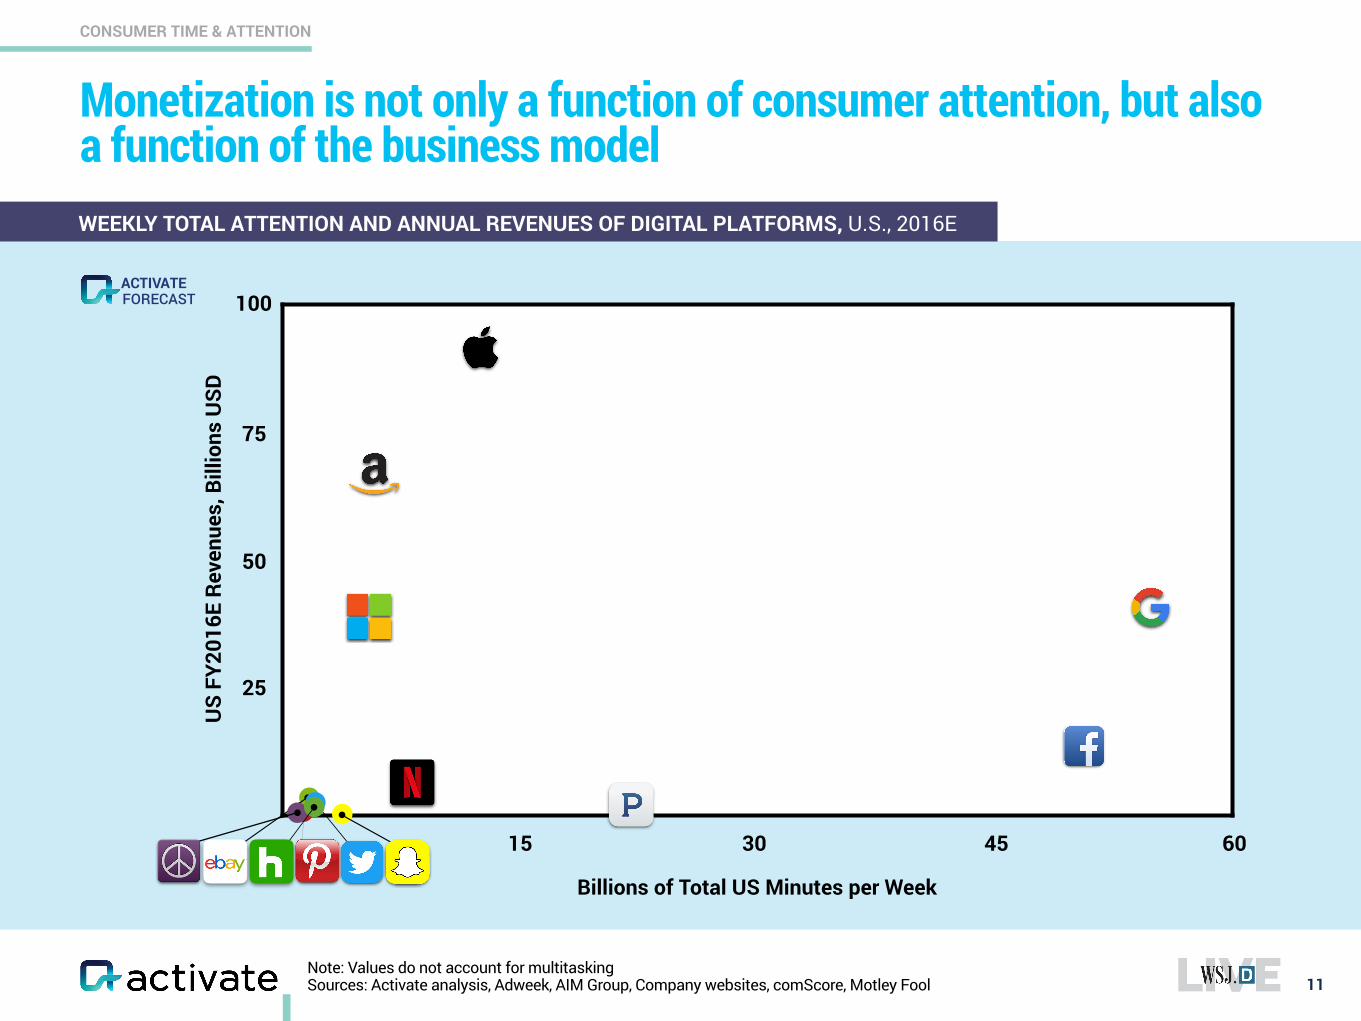
CONSUMER TIME & ATTENTION
Note: Values do not account for multitasking Sources: Activate analysis, Adweek, AIM Group, Company websites, comScore, Motley Fool
Monetization is not only a function of consumer attention, but also a function of the business model
11
FORECASTACTIVATE
50
25
75
100
US
FY20
16E
Reve
nues
, Bill
ions
USD
15 30 45 60
Billions of Total US Minutes per Week
WEEKLY TOTAL ATTENTION AND ANNUAL REVENUES OF DIGITAL PLATFORMS, U.S., 2016E
12www.activate.com
The 9 Most Important Insights for Tech and Media in 2017
Super-serve the Super-users and Chase the Attention Unicorns
Subscriptions will Feed the World (or at least Internet and Media Businesses)
Learn to Live with the Discovery Oligopoly
The Bot Battles are about Winning the Great Messaging War
eSports is the Next Tech Phenomenon
You Already Know the New Winners in Pay TV
Video Streaming: The Bundle is the Future
Audio: Smart Speakers, Gray Music
Post-Household America: A New Era of Users
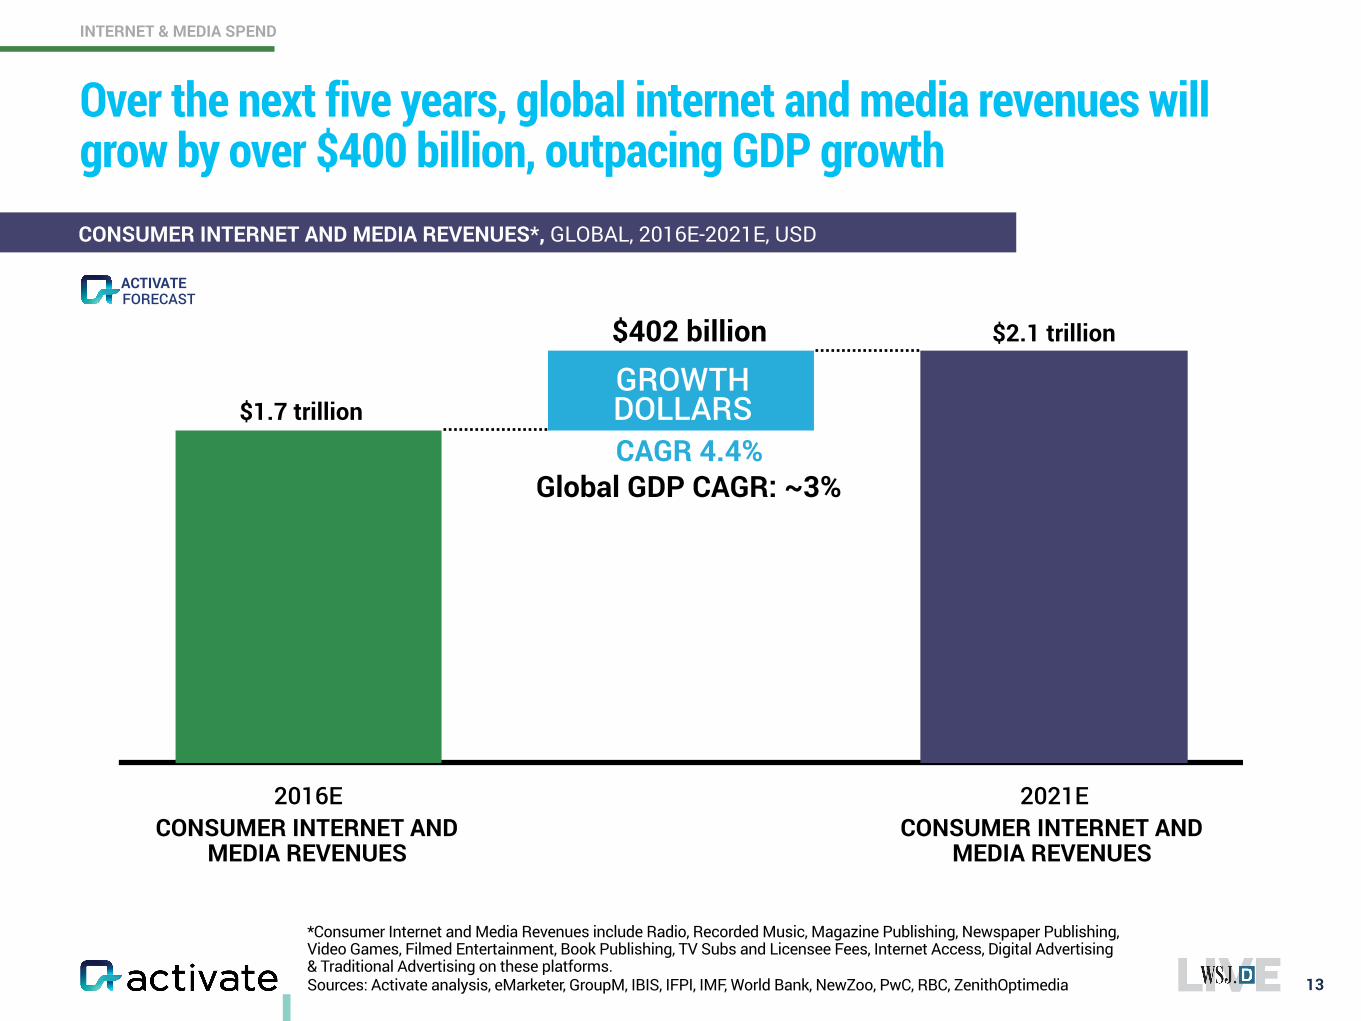
Over the next five years, global internet and media revenues will grow by over $400 billion, outpacing GDP growth
13
CONSUMER INTERNET AND MEDIA REVENUES*, GLOBAL, 2016E-2021E, USD
*Consumer Internet and Media Revenues include Radio, Recorded Music, Magazine Publishing, Newspaper Publishing, Video Games, Filmed Entertainment, Book Publishing, TV Subs and Licensee Fees, Internet Access, Digital Advertising & Traditional Advertising on these platforms. Sources: Activate analysis, eMarketer, GroupM, IBIS, IFPI, IMF, World Bank, NewZoo, PwC, RBC, ZenithOptimedia
2016E 2021E
$1.7 trillion
$2.1 trillion$402 billion
CONSUMER INTERNET AND MEDIA REVENUES
GROWTH DOLLARS
CONSUMER INTERNET AND MEDIA REVENUES
CAGR 4.4%Global GDP CAGR: ~3%
INTERNET & MEDIA SPEND
FORECASTACTIVATE
CONSUMER INTERNET AND MEDIA REVENUES
CONSUMER INTERNET AND MEDIA REVENUES
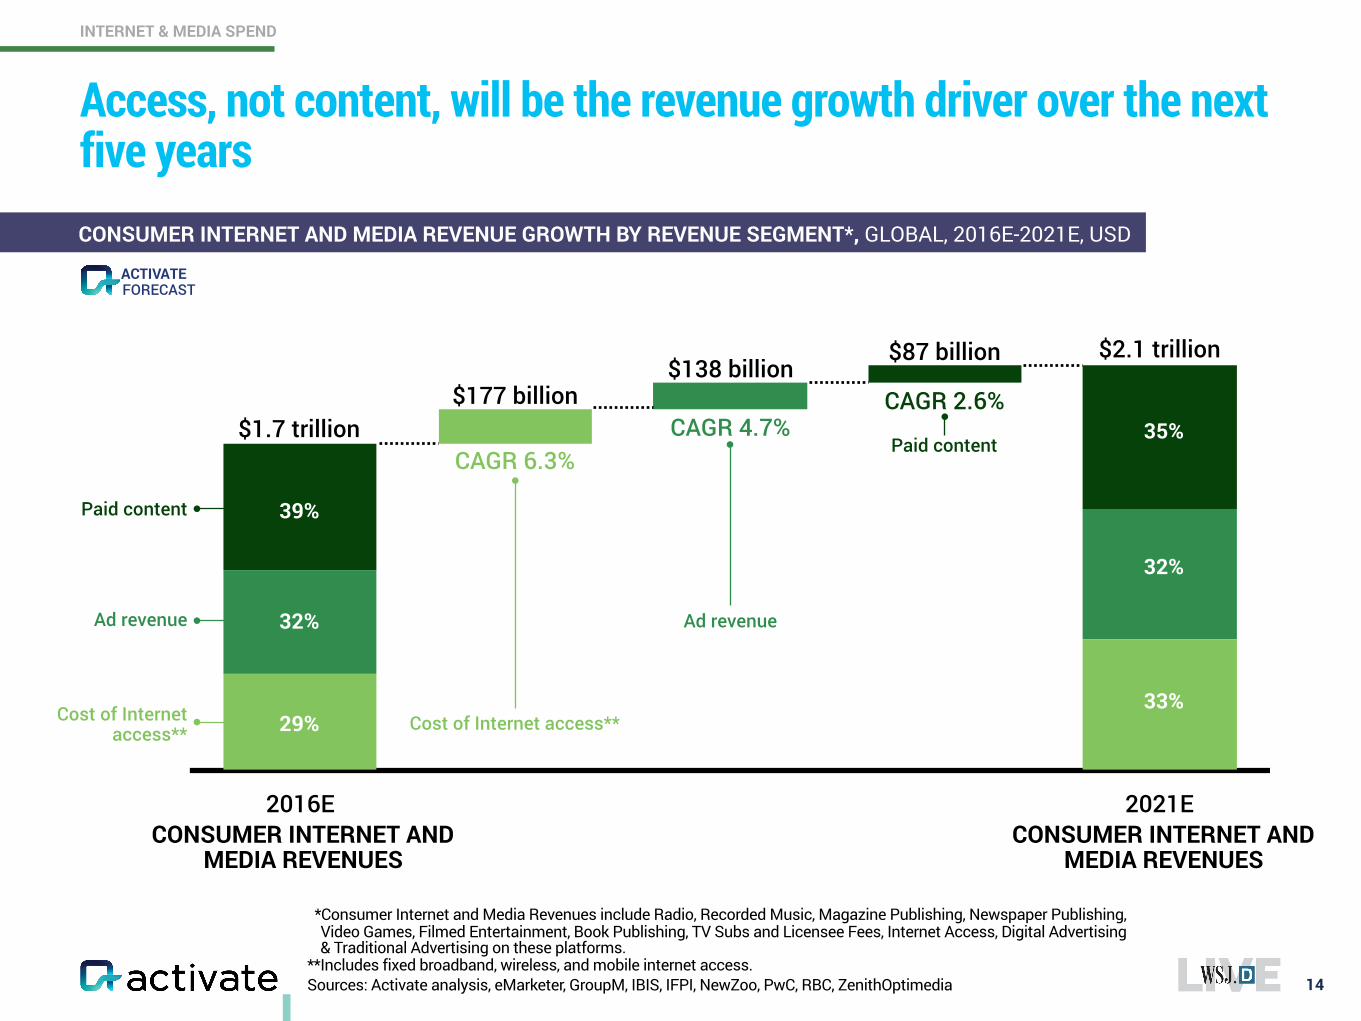
2016E 2021E
$1.7 trillion
$2.1 trillion
$177 billion
Ad revenue
Cost of Internet access**
Paid content
$87 billion$138 billion
CAGR 2.6%
CAGR 6.3%CAGR 4.7%
39%
32%
29%
35%
32%
33%
Ad revenue
Cost of Internet access**
Paid content
Access, not content, will be the revenue growth driver over the next five years
14
*Consumer Internet and Media Revenues include Radio, Recorded Music, Magazine Publishing, Newspaper Publishing, Video Games, Filmed Entertainment, Book Publishing, TV Subs and Licensee Fees, Internet Access, Digital Advertising & Traditional Advertising on these platforms.
**Includes fixed broadband, wireless, and mobile internet access. Sources: Activate analysis, eMarketer, GroupM, IBIS, IFPI, NewZoo, PwC, RBC, ZenithOptimedia
CONSUMER INTERNET AND MEDIA REVENUE GROWTH BY REVENUE SEGMENT*, GLOBAL, 2016E-2021E, USD
INTERNET & MEDIA SPEND
FORECASTACTIVATE
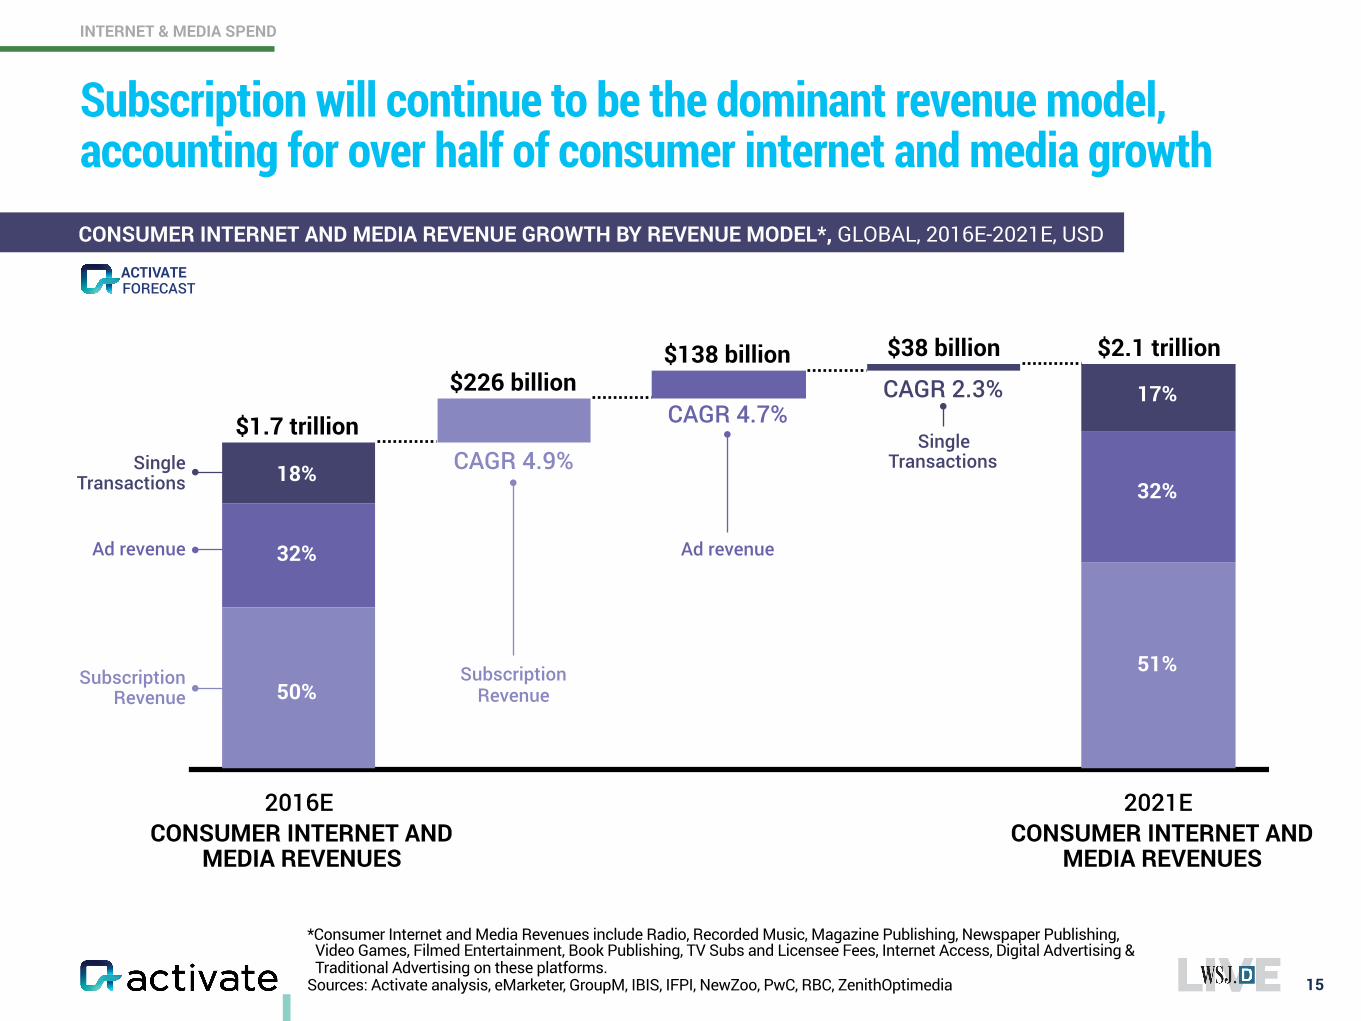
CONSUMER INTERNET AND MEDIA REVENUES
CONSUMER INTERNET AND MEDIA REVENUES
2016E 2021E
$1.7 trillion
$2.1 trillion$226 billion
$138 billion $38 billion
CAGR 4.7%
CAGR 4.9%
CAGR 2.3%
18%
32%
50%
17%
32%
51%
Ad revenue
Subscription Revenue
Single Transactions
Ad revenue
Subscription Revenue
Single Transactions
Subscription will continue to be the dominant revenue model, accounting for over half of consumer internet and media growth
15
*Consumer Internet and Media Revenues include Radio, Recorded Music, Magazine Publishing, Newspaper Publishing, Video Games, Filmed Entertainment, Book Publishing, TV Subs and Licensee Fees, Internet Access, Digital Advertising & Traditional Advertising on these platforms.
Sources: Activate analysis, eMarketer, GroupM, IBIS, IFPI, NewZoo, PwC, RBC, ZenithOptimedia
INTERNET & MEDIA SPEND
CONSUMER INTERNET AND MEDIA REVENUE GROWTH BY REVENUE MODEL*, GLOBAL, 2016E-2021E, USD
FORECASTACTIVATE
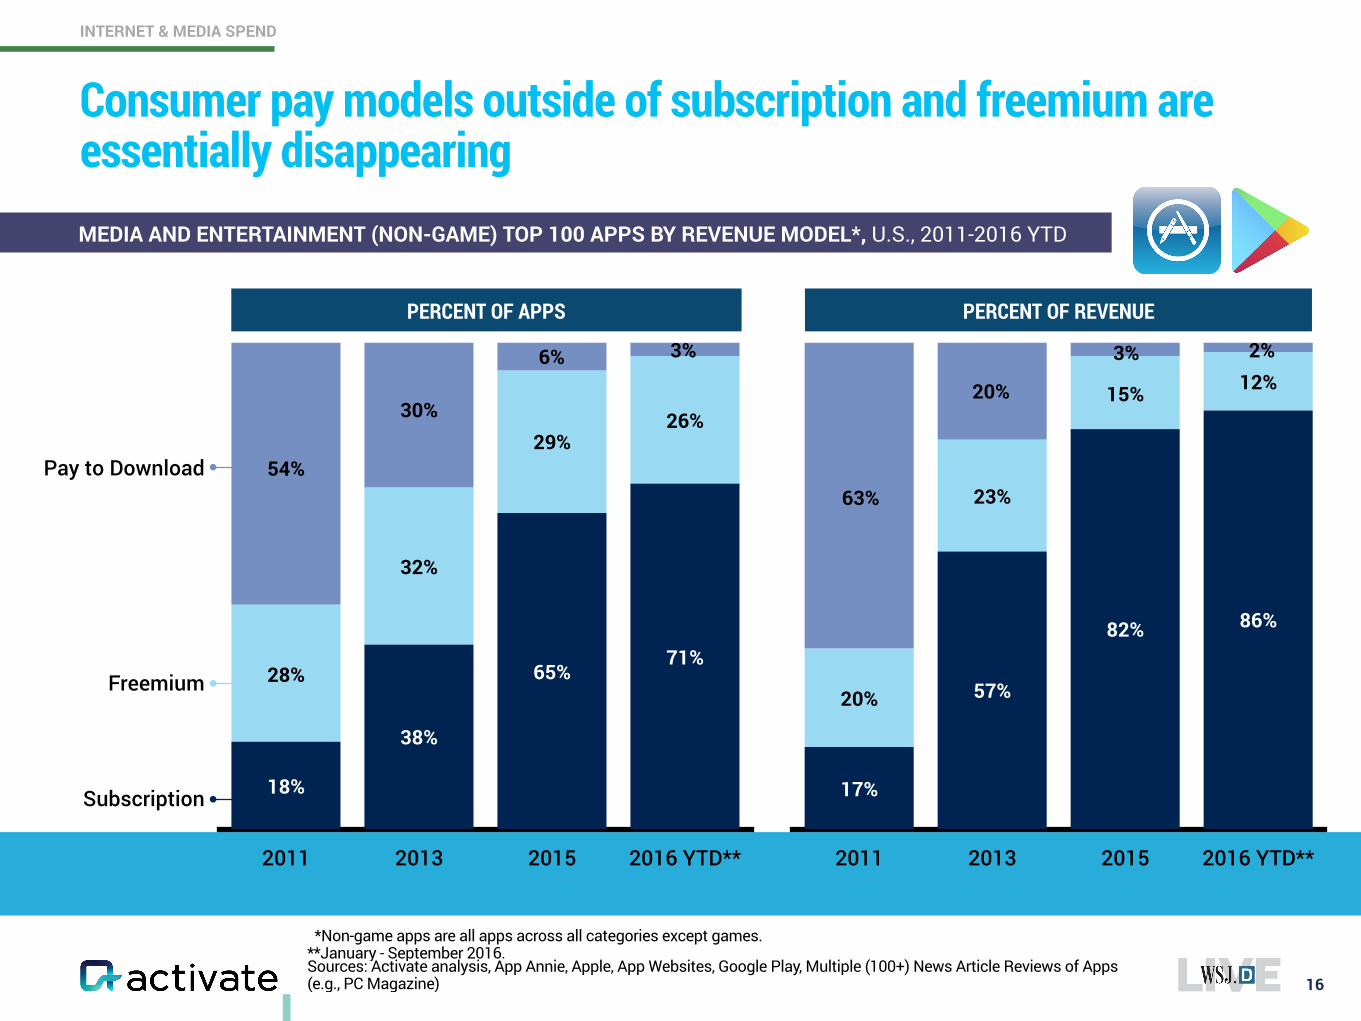
Sources: Activate analysis, App Annie, Apple, App Websites, Google Play, Multiple (100+) News Article Reviews of Apps (e.g., PC Magazine)
Consumer pay models outside of subscription and freemium are essentially disappearing
16
INTERNET & MEDIA SPEND
MEDIA AND ENTERTAINMENT (NON-GAME) TOP 100 APPS BY REVENUE MODEL*, U.S., 2011-2016 YTD
*Non-game apps are all apps across all categories except games. **January - September 2016.
Freemium
Pay to Download
2011 2013 2015 2016 YTD**
12%15%
23%
20%
86%82%
57%
17%Subscription
PERCENT OF REVENUEPERCENT OF APPS
2011 2013 2015 2016 YTD**
26%29%
32%
28%71%
65%
38%
18%
6%
30%
54%
3% 2%3%
20%
63%
Sources: Activate analysis, App Annie, Apple, App Websites, comScore, Google Play, Multiple (100+) News Article Reviews of Apps (e.g., PC Magazine)
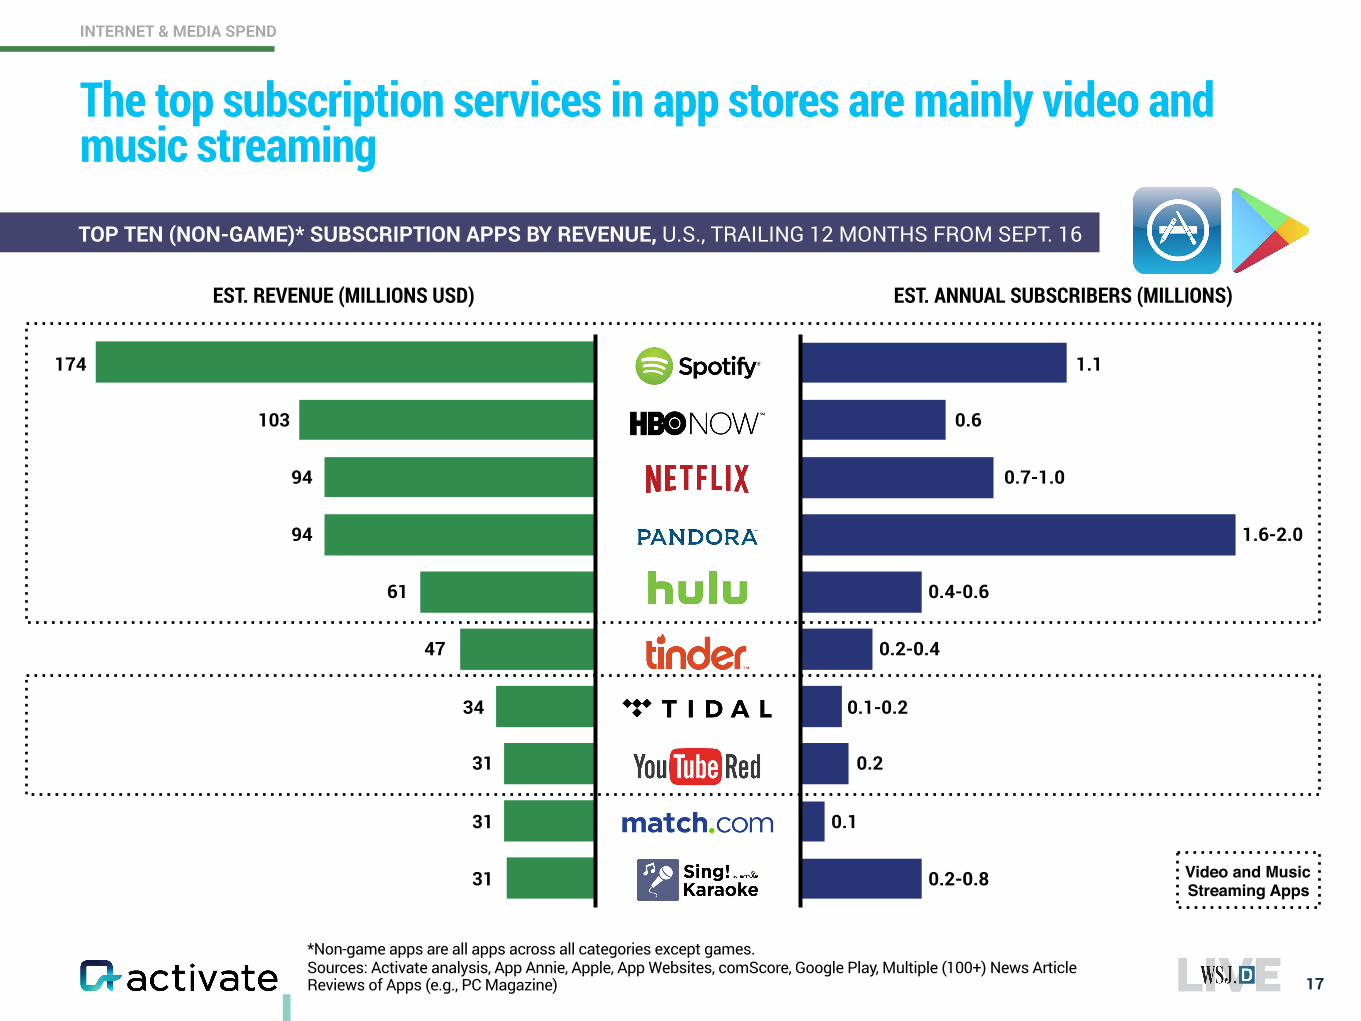
The top subscription services in app stores are mainly video and music streaming
17
TOP TEN (NON-GAME)* SUBSCRIPTION APPS BY REVENUE, U.S., TRAILING 12 MONTHS FROM SEPT. 16
*Non-game apps are all apps across all categories except games.
EST. REVENUE (MILLIONS USD) EST. ANNUAL SUBSCRIBERS (MILLIONS)
94
174
94
31
103
61
47
31
34
31
1.6-2.0
1.1
0.7-1.0
0.2-0.8
0.6
0.4-0.6
0.2-0.4
0.2
0.1-0.2
0.1
INTERNET & MEDIA SPEND
Video and Music Streaming Apps
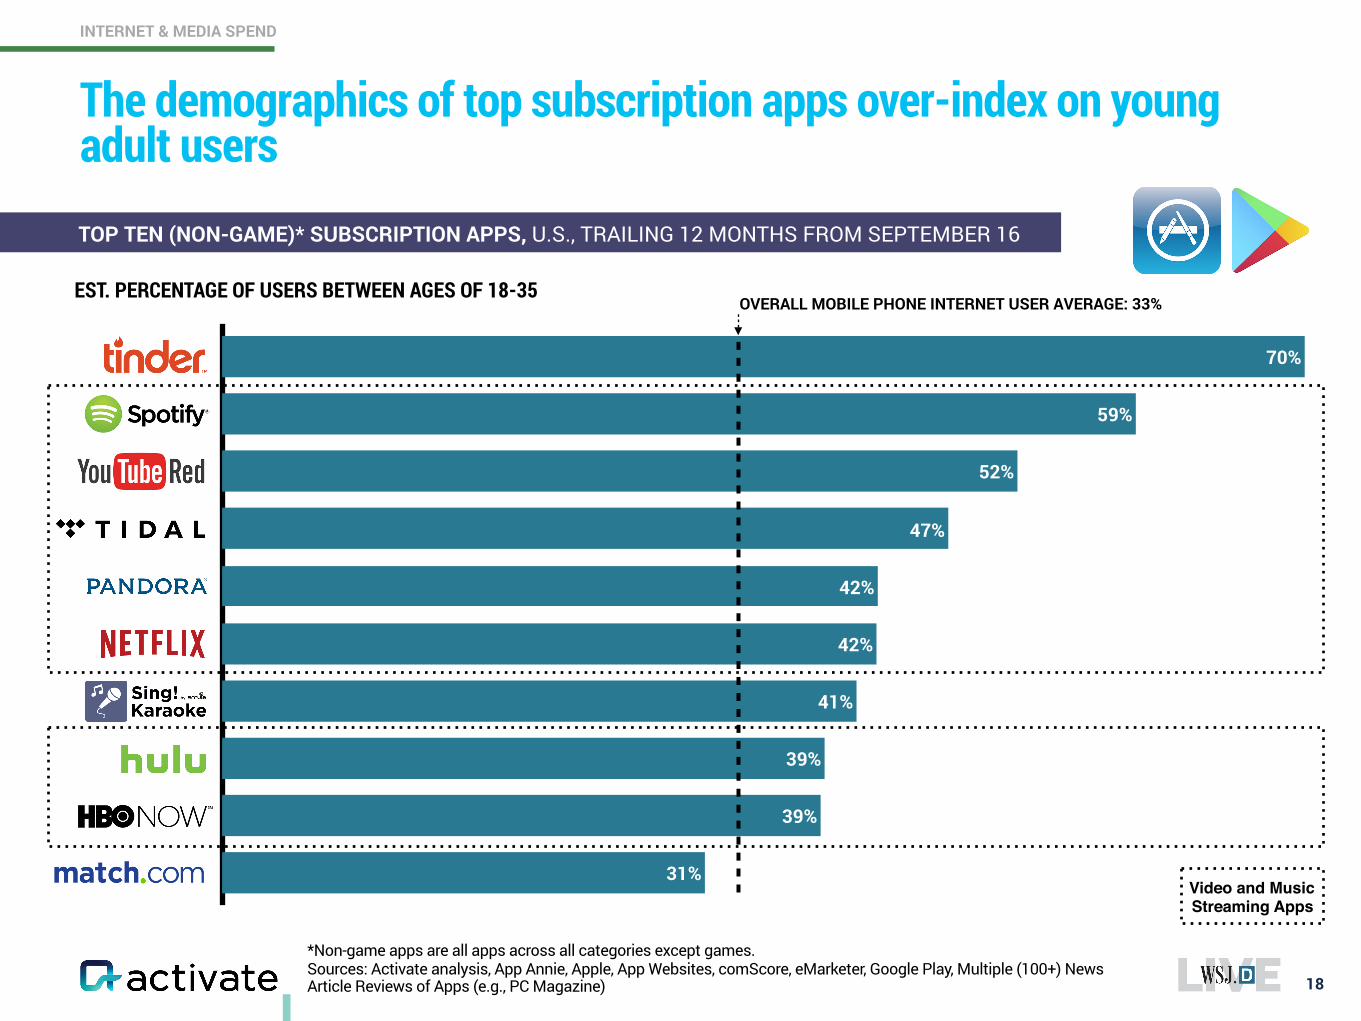
31%
39%
39%
41%
42%
42%
47%
52%
59%
70%
Sources: Activate analysis, App Annie, Apple, App Websites, comScore, eMarketer, Google Play, Multiple (100+) News Article Reviews of Apps (e.g., PC Magazine)
The demographics of top subscription apps over-index on young adult users
18
*Non-game apps are all apps across all categories except games.
EST. PERCENTAGE OF USERS BETWEEN AGES OF 18-35OVERALL MOBILE PHONE INTERNET USER AVERAGE: 33%
TOP TEN (NON-GAME)* SUBSCRIPTION APPS, U.S., TRAILING 12 MONTHS FROM SEPTEMBER 16
INTERNET & MEDIA SPEND
Video and Music Streaming Apps
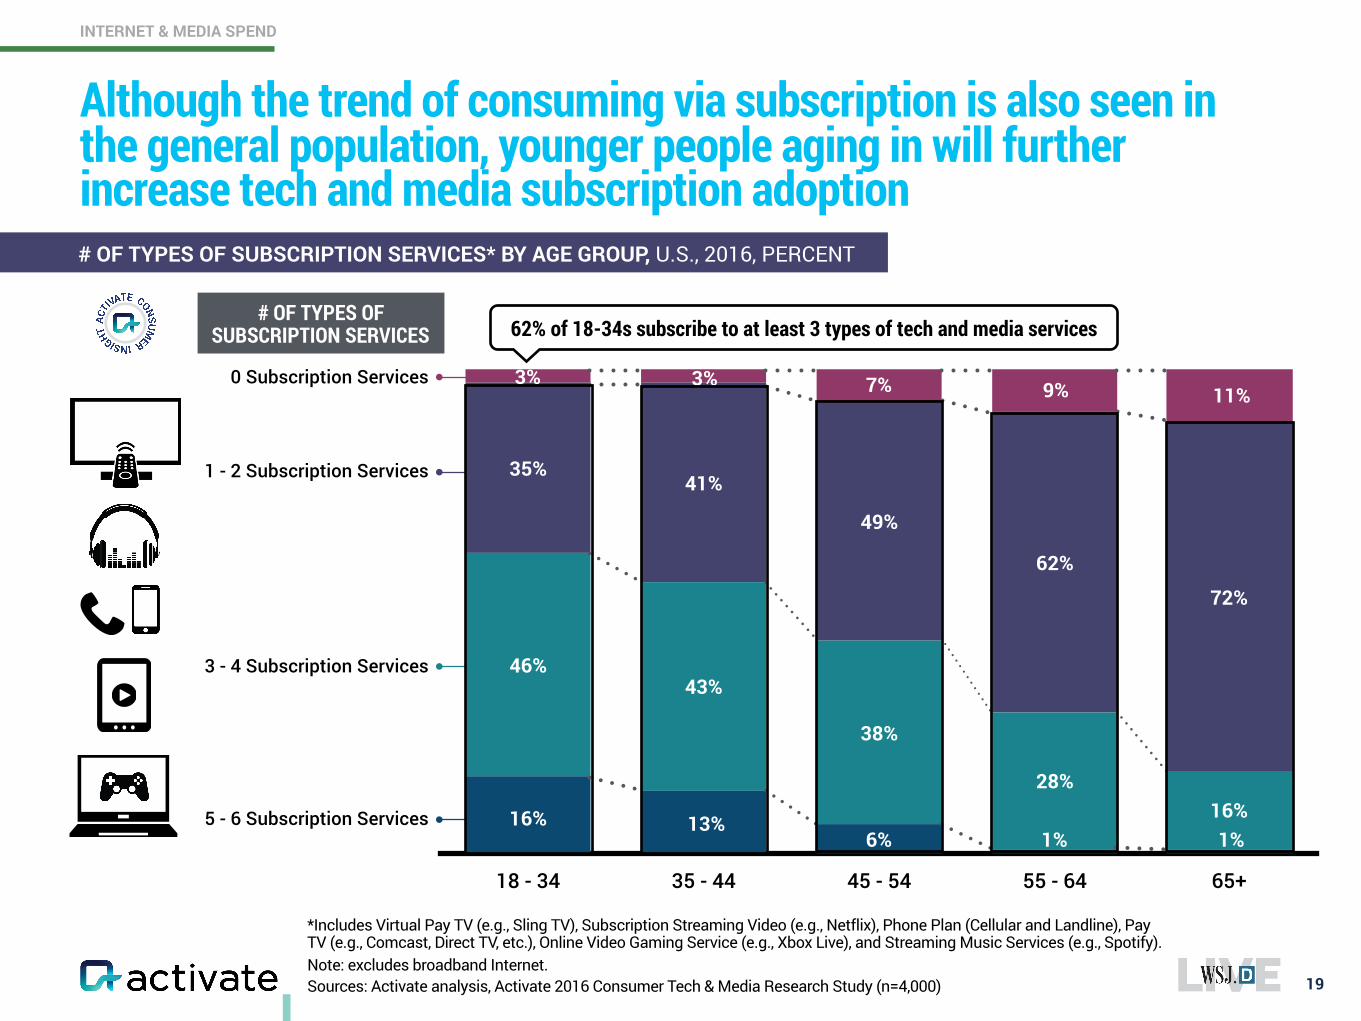
# OF TYPES OF SUBSCRIPTION SERVICES
18 - 34 35 - 44 45 - 54 55 - 64 65+
72%
62%
49%
41%35%
16%28%
38%
43%46%
Sources: Activate analysis, Activate 2016 Consumer Tech & Media Research Study (n=4,000)
Although the trend of consuming via subscription is also seen in the general population, younger people aging in will further increase tech and media subscription adoption
19
*Includes Virtual Pay TV (e.g., Sling TV), Subscription Streaming Video (e.g., Netflix), Phone Plan (Cellular and Landline), Pay TV (e.g., Comcast, Direct TV, etc.), Online Video Gaming Service (e.g., Xbox Live), and Streaming Music Services (e.g., Spotify).
16% 13%6% 1% 1%
3% 3% 7% 9% 11%
# OF TYPES OF SUBSCRIPTION SERVICES* BY AGE GROUP, U.S., 2016, PERCENT
Note: excludes broadband Internet.
62% of 18-34s subscribe to at least 3 types of tech and media services
INTERNET & MEDIA SPEND
3 - 4 Subscription Services
1 - 2 Subscription Services
0 Subscription Services
5 - 6 Subscription Services
20
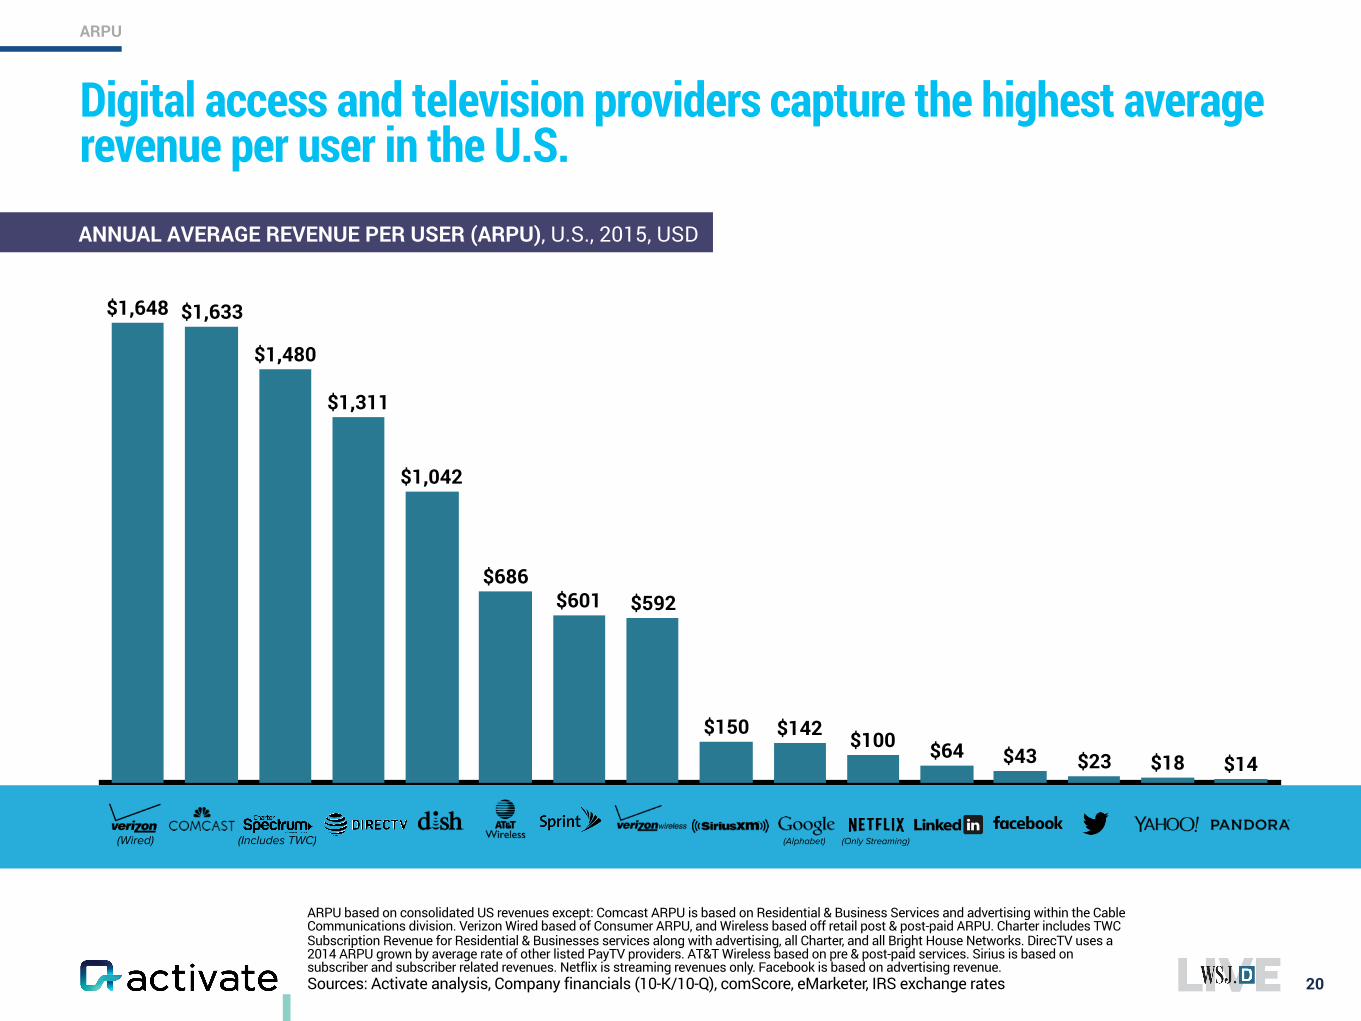
Digital access and television providers capture the highest average revenue per user in the U.S.
ARPU based on consolidated US revenues except: Comcast ARPU is based on Residential & Business Services and advertising within the Cable Communications division. Verizon Wired based of Consumer ARPU, and Wireless based off retail post & post-paid ARPU. Charter includes TWC Subscription Revenue for Residential & Businesses services along with advertising, all Charter, and all Bright House Networks. DirecTV uses a 2014 ARPU grown by average rate of other listed PayTV providers. AT&T Wireless based on pre & post-paid services. Sirius is based on subscriber and subscriber related revenues. Netflix is streaming revenues only. Facebook is based on advertising revenue. Sources: Activate analysis, Company financials (10-K/10-Q), comScore, eMarketer, IRS exchange rates
$14$18$23$43$64$100$142$150
$592$601$686
$1,042
$1,311
$1,480
$1,633$1,648
ANNUAL AVERAGE REVENUE PER USER (ARPU), U.S., 2015, USD
(Includes TWC) (Only Streaming)(Alphabet)(Wired)
ARPU
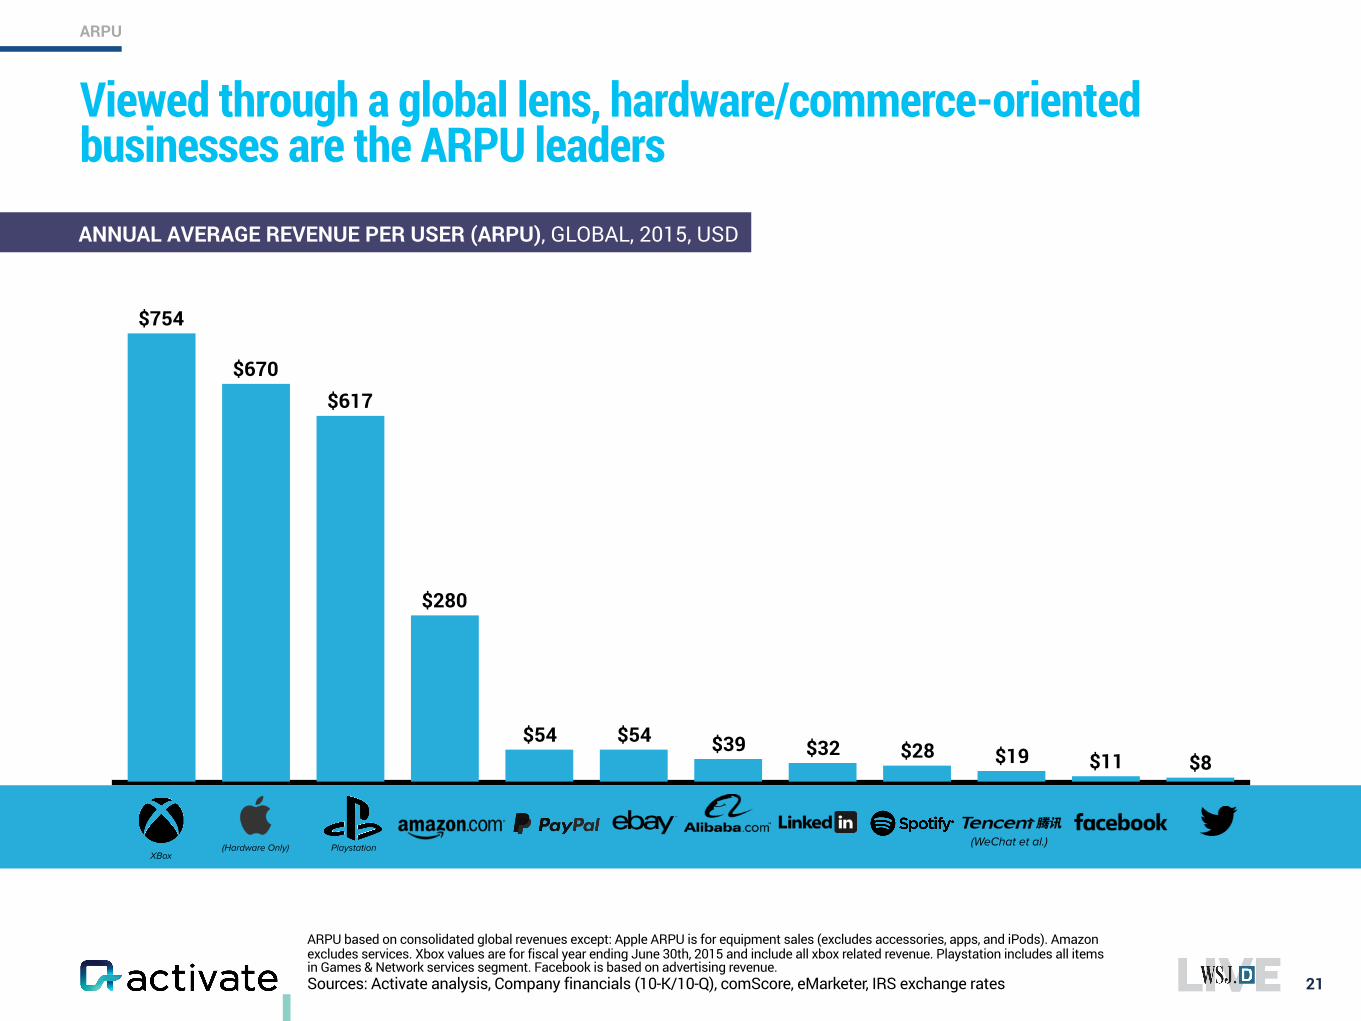
ARPU based on consolidated global revenues except: Apple ARPU is for equipment sales (excludes accessories, apps, and iPods). Amazon excludes services. Xbox values are for fiscal year ending June 30th, 2015 and include all xbox related revenue. Playstation includes all items in Games & Network services segment. Facebook is based on advertising revenue. Sources: Activate analysis, Company financials (10-K/10-Q), comScore, eMarketer, IRS exchange rates 21
Viewed through a global lens, hardware/commerce-oriented businesses are the ARPU leaders
$8$11$19$28$32$39$54$54
$280
$617$670
$754
ANNUAL AVERAGE REVENUE PER USER (ARPU), GLOBAL, 2015, USD
(Hardware Only) (WeChat et al.)XBox
Playstation
ARPU
22www.activate.com
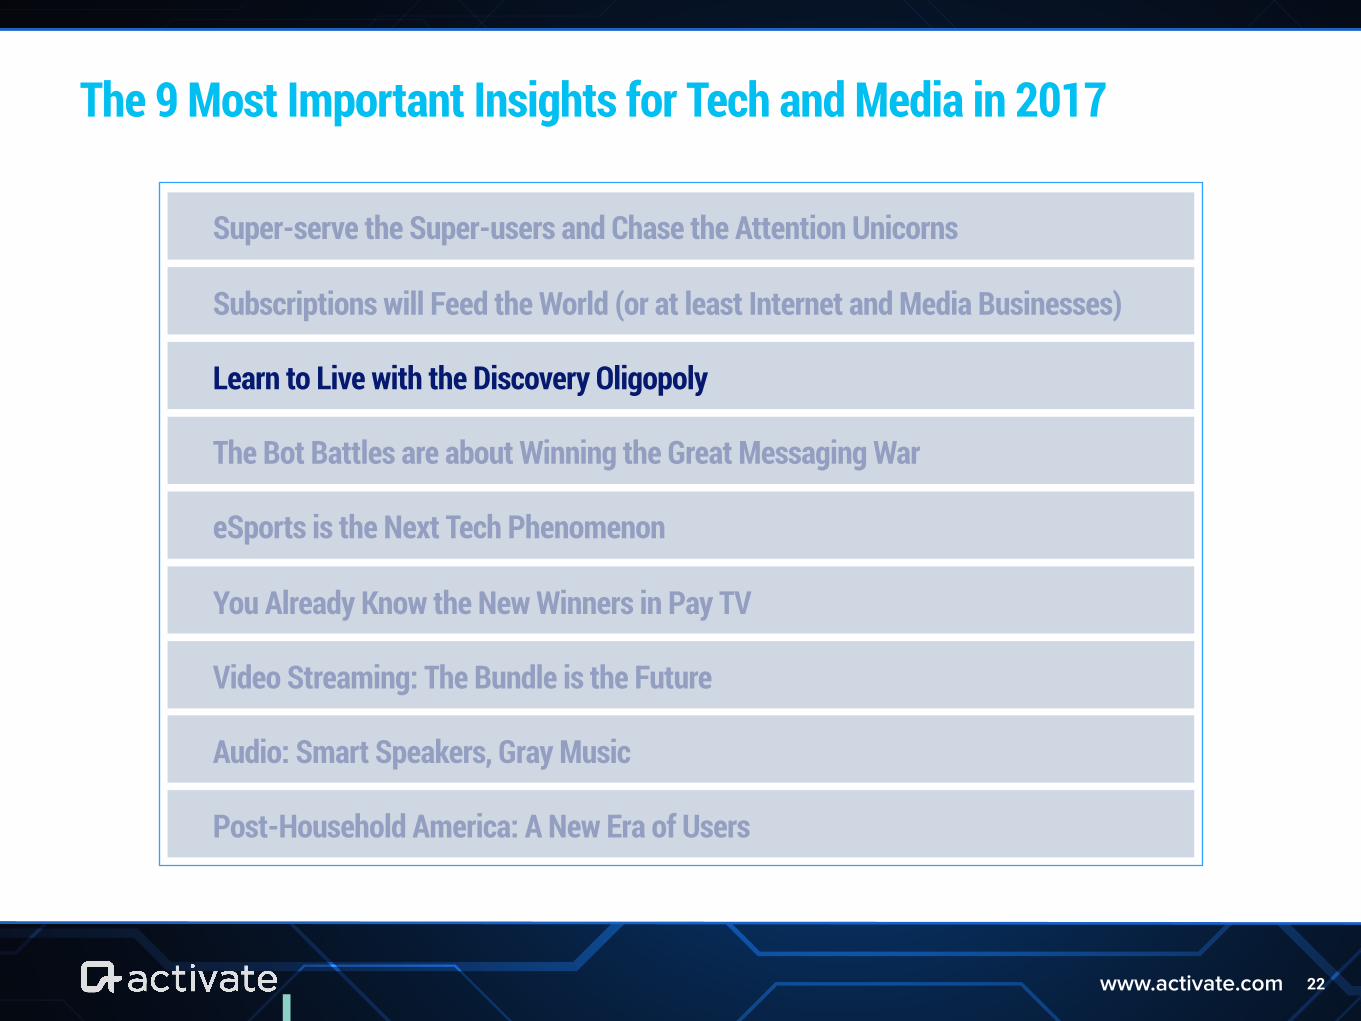
The 9 Most Important Insights for Tech and Media in 2017
Super-serve the Super-users and Chase the Attention Unicorns
Subscriptions will Feed the World (or at least Internet and Media Businesses)
Learn to Live with the Discovery Oligopoly
The Bot Battles are about Winning the Great Messaging War
eSports is the Next Tech Phenomenon
You Already Know the New Winners in Pay TV
Video Streaming: The Bundle is the Future
Audio: Smart Speakers, Gray Music
Post-Household America: A New Era of Users
DISCOVERY OLIGOPOLY
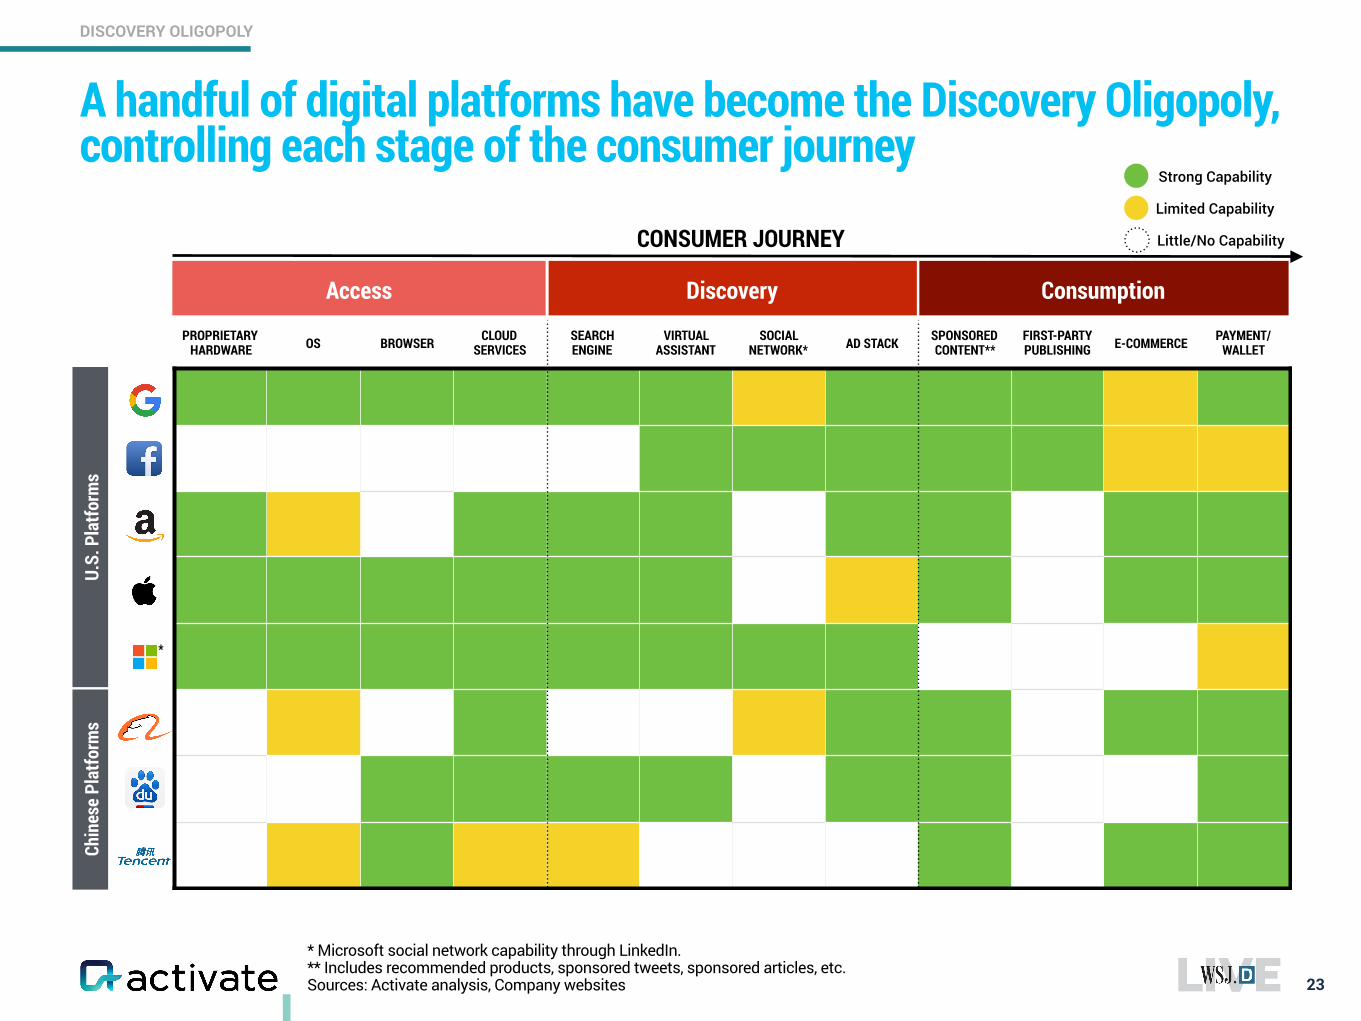
* Microsoft social network capability through LinkedIn. ** Includes recommended products, sponsored tweets, sponsored articles, etc. Sources: Activate analysis, Company websites
A handful of digital platforms have become the Discovery Oligopoly, controlling each stage of the consumer journey
23
Access Discovery Consumption
PROPRIETARY HARDWARE OS BROWSER CLOUD
SERVICESSEARCH ENGINE
VIRTUAL ASSISTANT
SOCIAL NETWORK* AD STACK SPONSORED
CONTENT**FIRST-PARTY PUBLISHING E-COMMERCE PAYMENT/
WALLET
CONSUMER JOURNEY
U.S.
Pla
tform
sCh
ines
e Pl
atfo
rms
Strong Capability
Limited Capability
Little/No Capability
*
DISCOVERY OLIGOPOLY
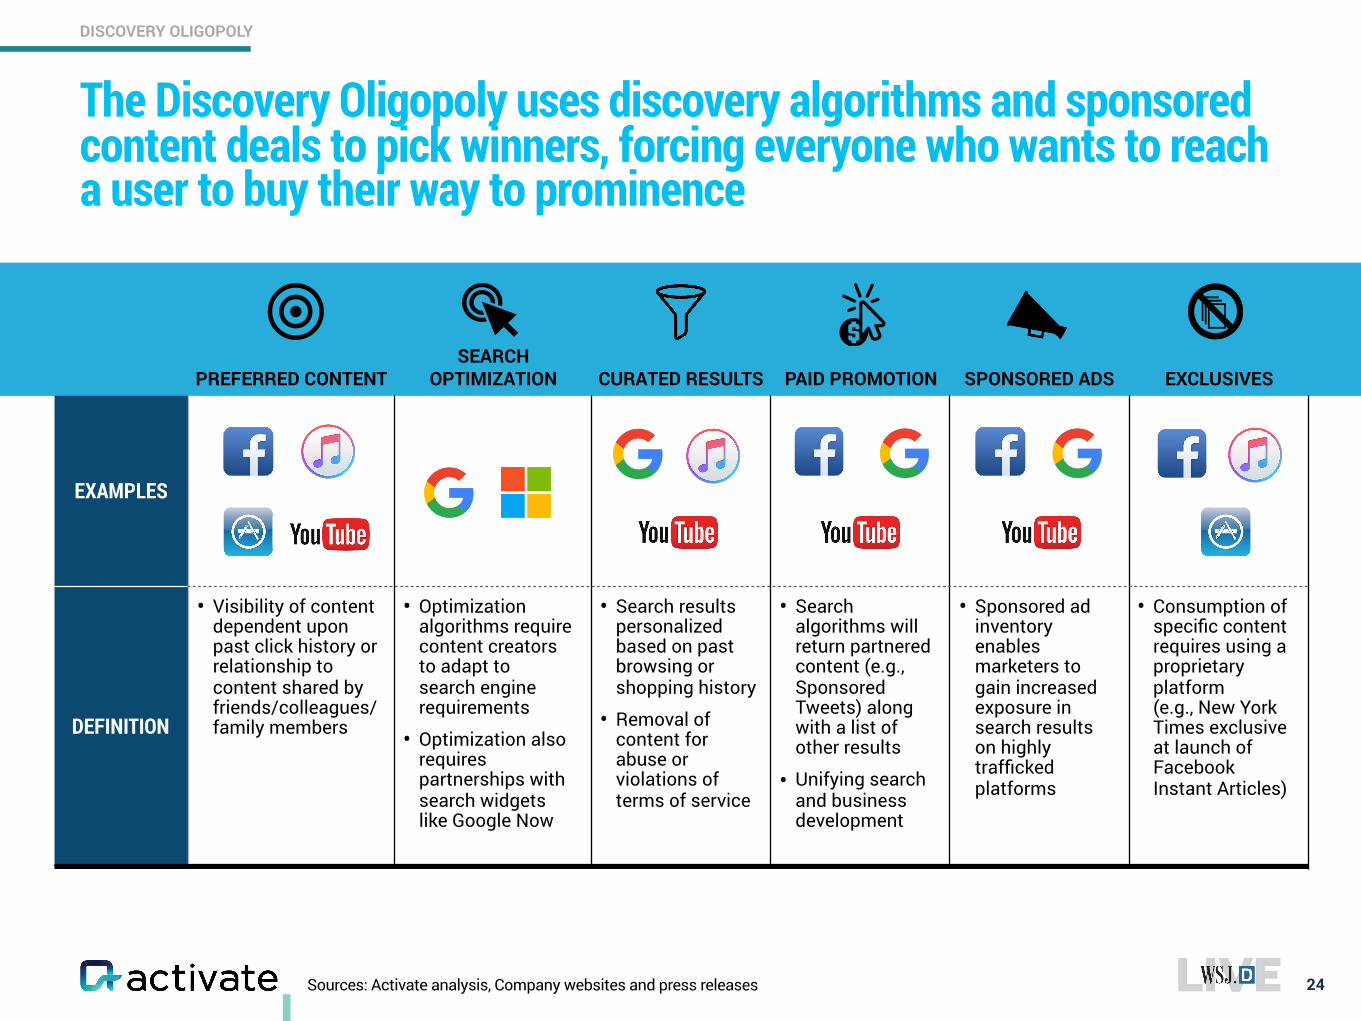
Sources: Activate analysis, Company websites and press releases
The Discovery Oligopoly uses discovery algorithms and sponsored content deals to pick winners, forcing everyone who wants to reach a user to buy their way to prominence
24
PREFERRED CONTENTSEARCH
OPTIMIZATION CURATED RESULTS PAID PROMOTION SPONSORED ADS EXCLUSIVES
EXAMPLES
DEFINITION
• Visibility of content dependent upon past click history or relationship to content shared by friends/colleagues/family members
• Optimization algorithms require content creators to adapt to search engine requirements
• Optimization also requires partnerships with search widgets like Google Now
• Search results personalized based on past browsing or shopping history
• Removal of content for abuse or violations of terms of service
• Search algorithms will return partnered content (e.g., Sponsored Tweets) along with a list of other results
• Unifying search and business development
• Sponsored ad inventory enables marketers to gain increased exposure in search results on highly trafficked platforms
• Consumption of specific content requires using a proprietary platform (e.g., New York Times exclusive at launch of Facebook Instant Articles)
DISCOVERY OLIGOPOLY
Sources: Activate analysis, Parse.ly
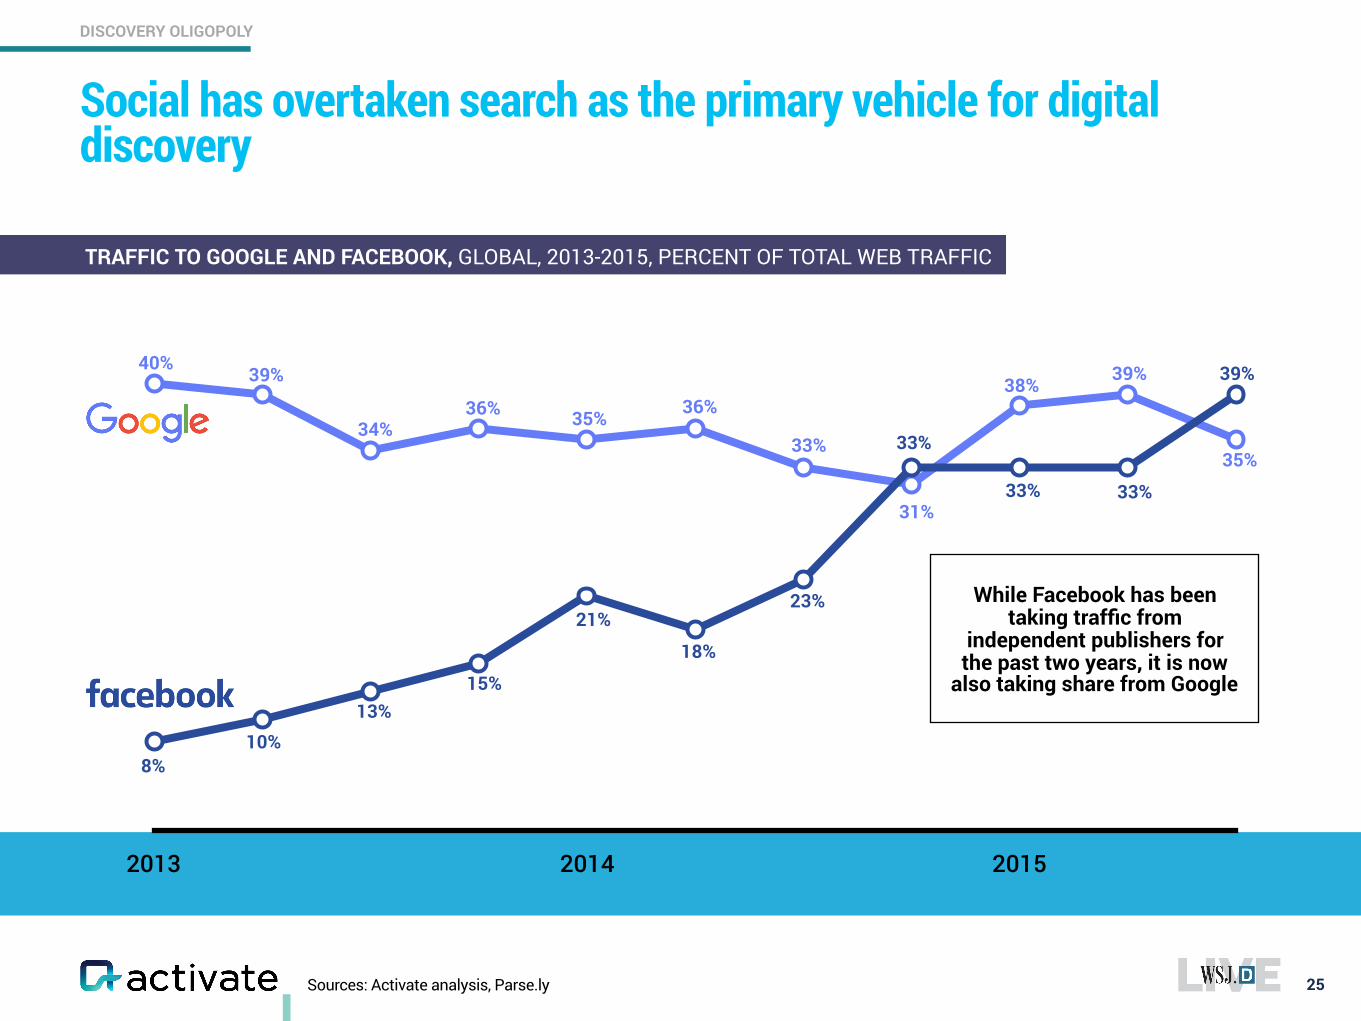
Social has overtaken search as the primary vehicle for digital discovery
25
TRAFFIC TO GOOGLE AND FACEBOOK, GLOBAL, 2013-2015, PERCENT OF TOTAL WEB TRAFFIC
2013 2014 2015
While Facebook has been taking traffic from
independent publishers for the past two years, it is now
also taking share from Google
40% 39%
34%36% 35% 36%
33%
31%
38% 39%
35%33%
33% 33%
39%
23%
18%
21%
15%13%
10%8%
DISCOVERY OLIGOPOLY
Sources: Activate analysis, Parse.ly, Reuters
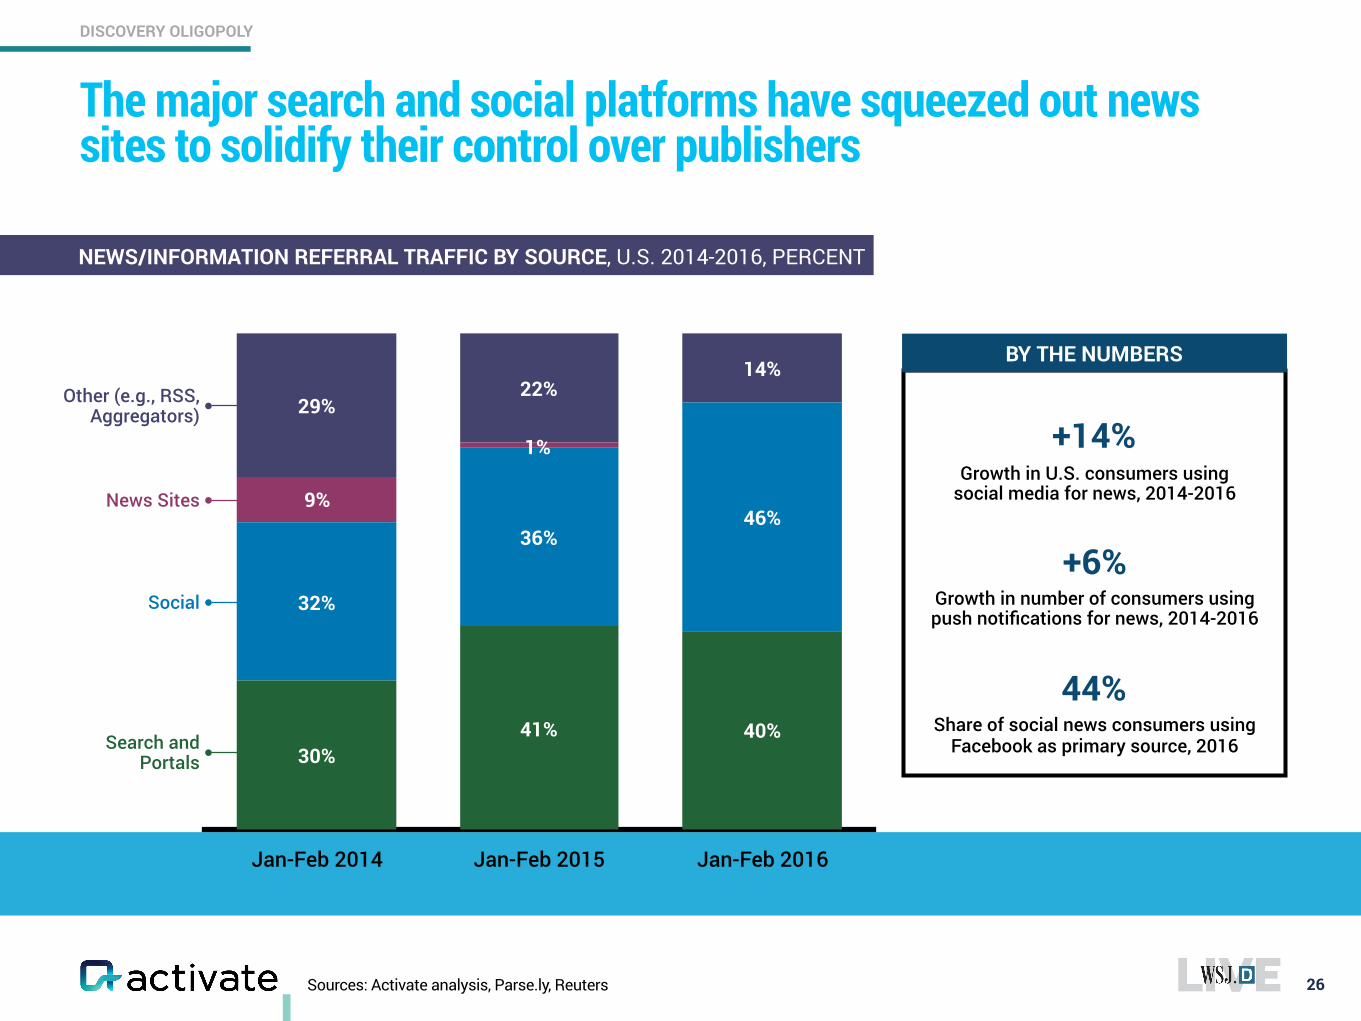
The major search and social platforms have squeezed out news sites to solidify their control over publishers
26
Jan-Feb 2014 Jan-Feb 2015 Jan-Feb 2016
14%22%
29%
46%36%
32%
40%41%30%
NEWS/INFORMATION REFERRAL TRAFFIC BY SOURCE, U.S. 2014-2016, PERCENT
Other (e.g., RSS, Aggregators)
News Sites
Social
Search and Portals
Growth in U.S. consumers using social media for news, 2014-2016
Growth in number of consumers using push notifications for news, 2014-2016
Share of social news consumers using Facebook as primary source, 2016
9%
1% +14%
+6%
44%
BY THE NUMBERS
DISCOVERY OLIGOPOLY
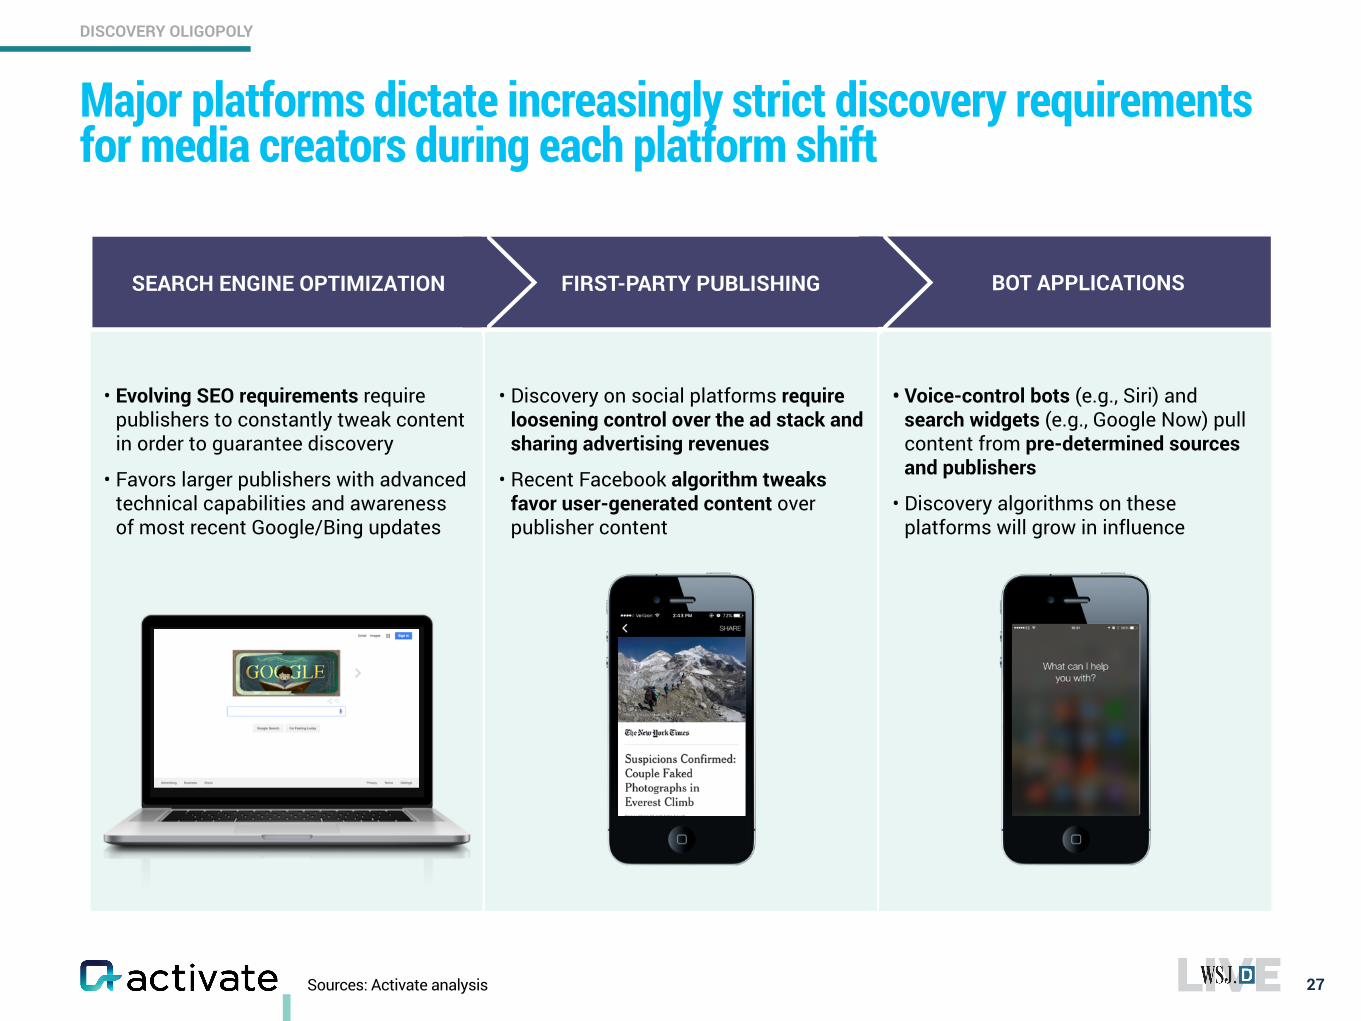
Major platforms dictate increasingly strict discovery requirements for media creators during each platform shift
27
• Evolving SEO requirements require publishers to constantly tweak content in order to guarantee discovery
• Favors larger publishers with advanced technical capabilities and awareness of most recent Google/Bing updates
• Discovery on social platforms require loosening control over the ad stack and sharing advertising revenues
• Recent Facebook algorithm tweaks favor user-generated content over publisher content
• Voice-control bots (e.g., Siri) and search widgets (e.g., Google Now) pull content from pre-determined sources and publishers
• Discovery algorithms on these platforms will grow in influence
BOT APPLICATIONSSEARCH ENGINE OPTIMIZATION FIRST-PARTY PUBLISHING
Sources: Activate analysis
DISCOVERY OLIGOPOLY
Sources: Activate analysis, comScore, Morgan Stanley
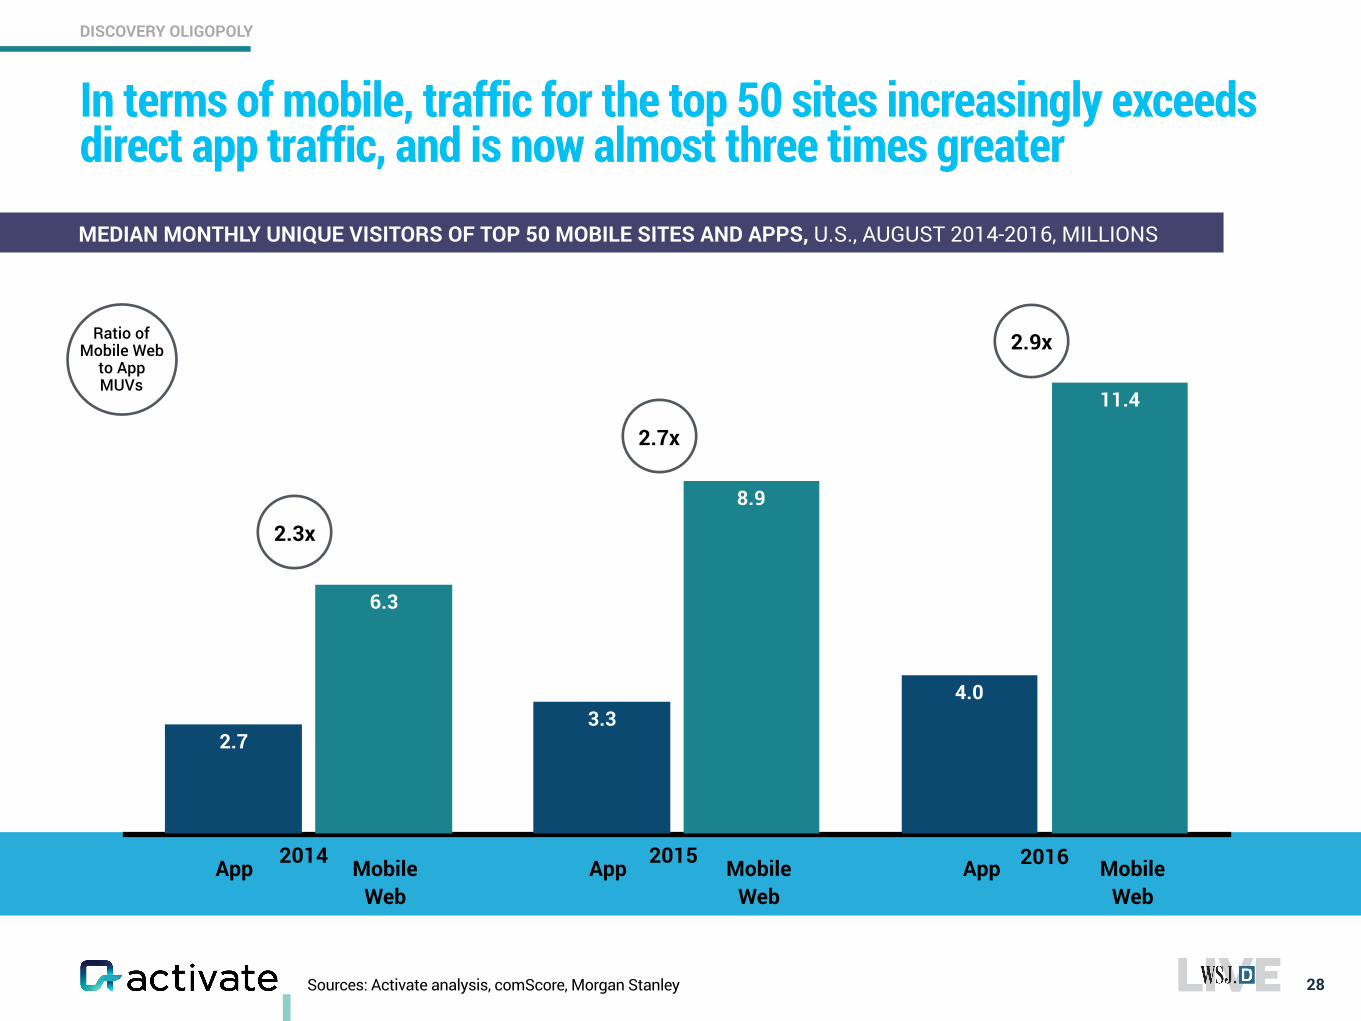
In terms of mobile, traffic for the top 50 sites increasingly exceeds direct app traffic, and is now almost three times greater
28
11.4
8.9
6.3
4.03.3
2.7
2.9x
2.7x
2.3x
2014 2015 2016
MEDIAN MONTHLY UNIQUE VISITORS OF TOP 50 MOBILE SITES AND APPS, U.S., AUGUST 2014-2016, MILLIONS
Ratio of Mobile Web
to App MUVs
App Mobile Web
App Mobile Web
App Mobile Web
DISCOVERY OLIGOPOLY
*CPI/CPLU data for iOS applications. Sources: Activate analysis, Blur, Fiksu
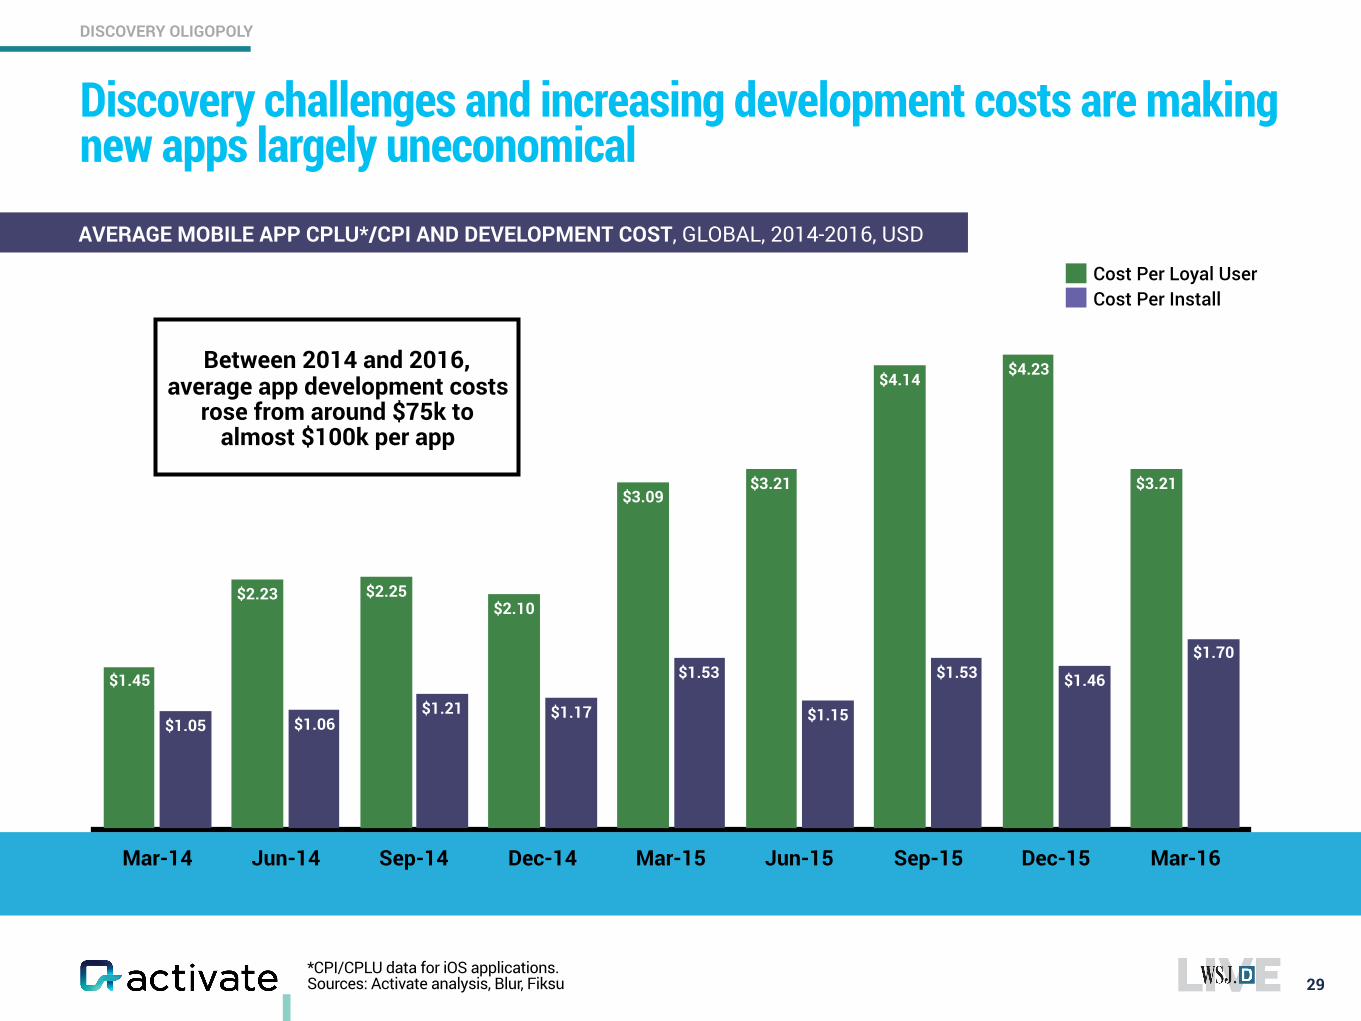
Discovery challenges and increasing development costs are making new apps largely uneconomical
29
AVERAGE MOBILE APP CPLU*/CPI AND DEVELOPMENT COST, GLOBAL, 2014-2016, USD
Mar-14 Jun-14 Sep-14 Dec-14 Mar-15 Jun-15 Sep-15 Dec-15 Mar-16
$1.70
$1.46$1.53
$1.15
$1.53
$1.17$1.21$1.06$1.05
$3.21
$4.23$4.14
$3.21$3.09
$2.10$2.25$2.23
$1.45
Cost Per Loyal UserCost Per Install
Between 2014 and 2016, average app development costs
rose from around $75k to almost $100k per app
DISCOVERY OLIGOPOLY
Sources: Activate analysis, eMarketer, Localytics
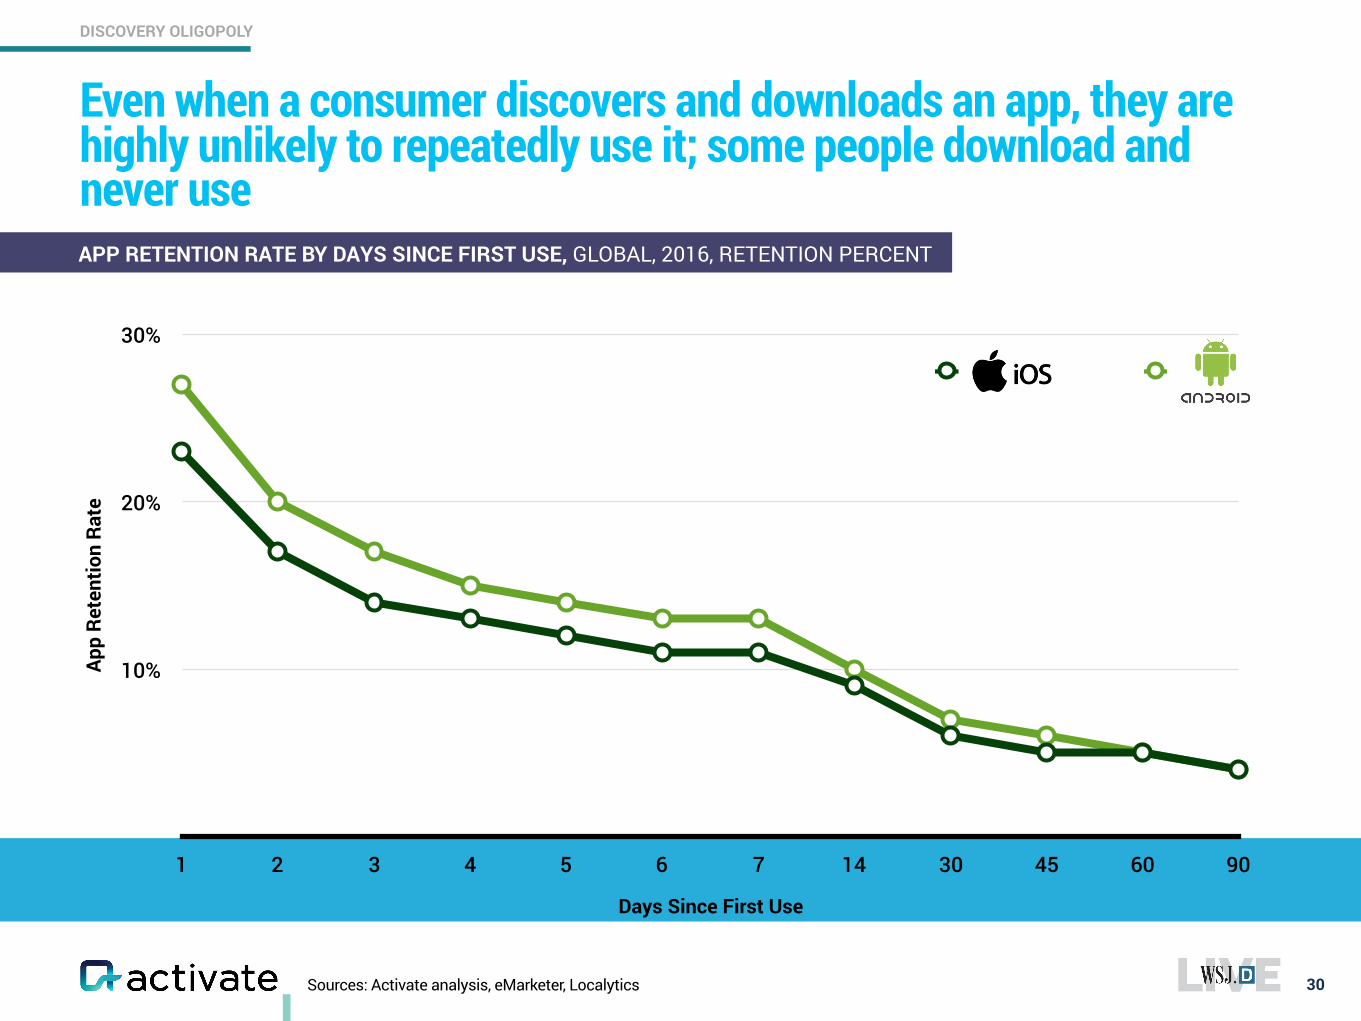
Even when a consumer discovers and downloads an app, they are highly unlikely to repeatedly use it; some people download and never use
30
APP RETENTION RATE BY DAYS SINCE FIRST USE, GLOBAL, 2016, RETENTION PERCENT
App
Rete
ntio
n Ra
te
10%
20%
30%
Days Since First Use
1 2 3 4 5 6 7 14 30 45 60 90
iOS
DISCOVERY OLIGOPOLY
Sources: Activate analysis, BloomReach, PowerReviews
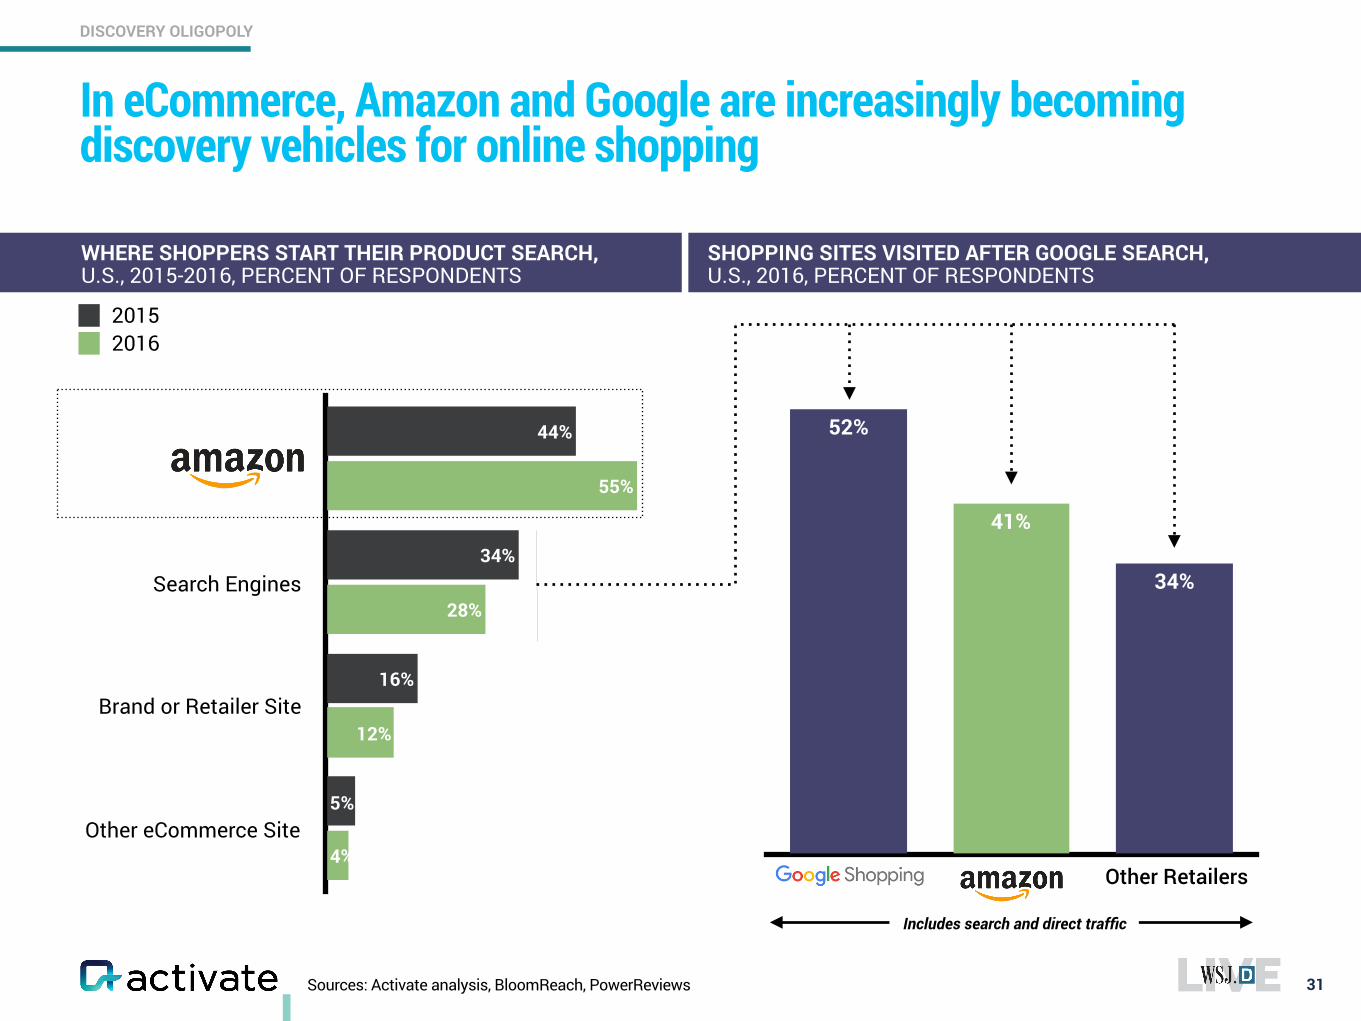
In eCommerce, Amazon and Google are increasingly becoming discovery vehicles for online shopping
31
4%
12%
28%
55%
5%
16%
34%
44%
20152016
41%
34%
52%
WHERE SHOPPERS START THEIR PRODUCT SEARCH, U.S., 2015-2016, PERCENT OF RESPONDENTS
SHOPPING SITES VISITED AFTER GOOGLE SEARCH, U.S., 2016, PERCENT OF RESPONDENTS
Search Engines
Brand or Retailer Site
Other eCommerce Site
Other Retailers
Includes search and direct traffic
DISCOVERY OLIGOPOLY
Note: Figures will not sum perfectly due to rounding. *Includes digital revenues from both traditional and digital native media companies. Sources: Activate analysis, eMarketer, IAB, MoffettNathanson, PwC
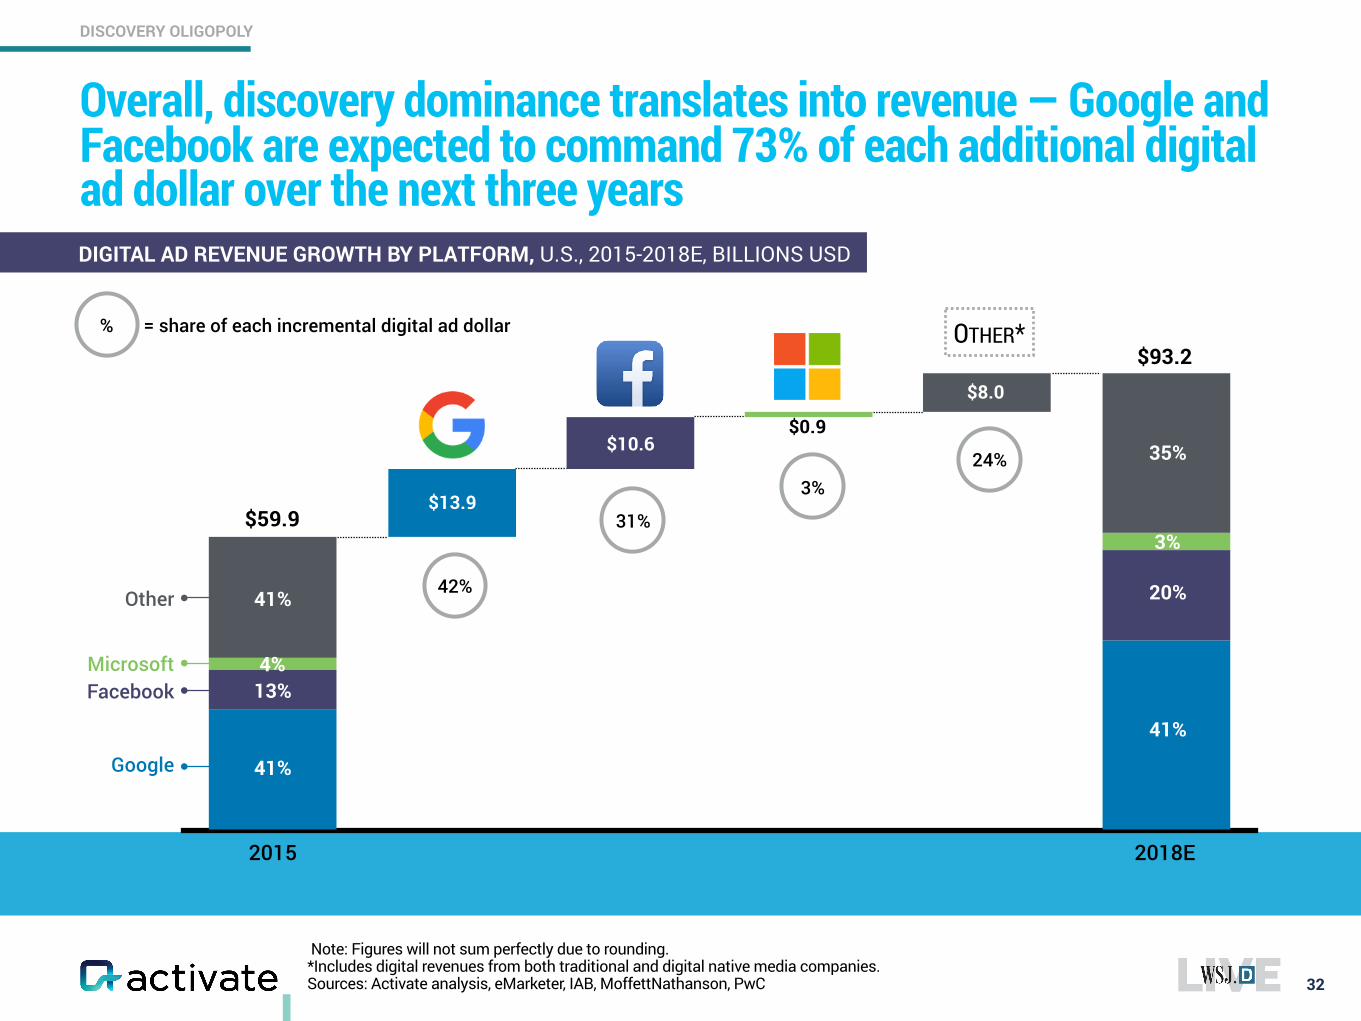
Overall, discovery dominance translates into revenue — Google and Facebook are expected to command 73% of each additional digital ad dollar over the next three years
32
DIGITAL AD REVENUE GROWTH BY PLATFORM, U.S., 2015-2018E, BILLIONS USD
$59.9$13.9
$10.6
$8.0
$0.9
2015 2018E
$93.2OTHER*
FacebookMicrosoft
Other 41%
41%
13%4%
35%
20%
41%
3%
42%
31%
3%24%
% = share of each incremental digital ad dollar
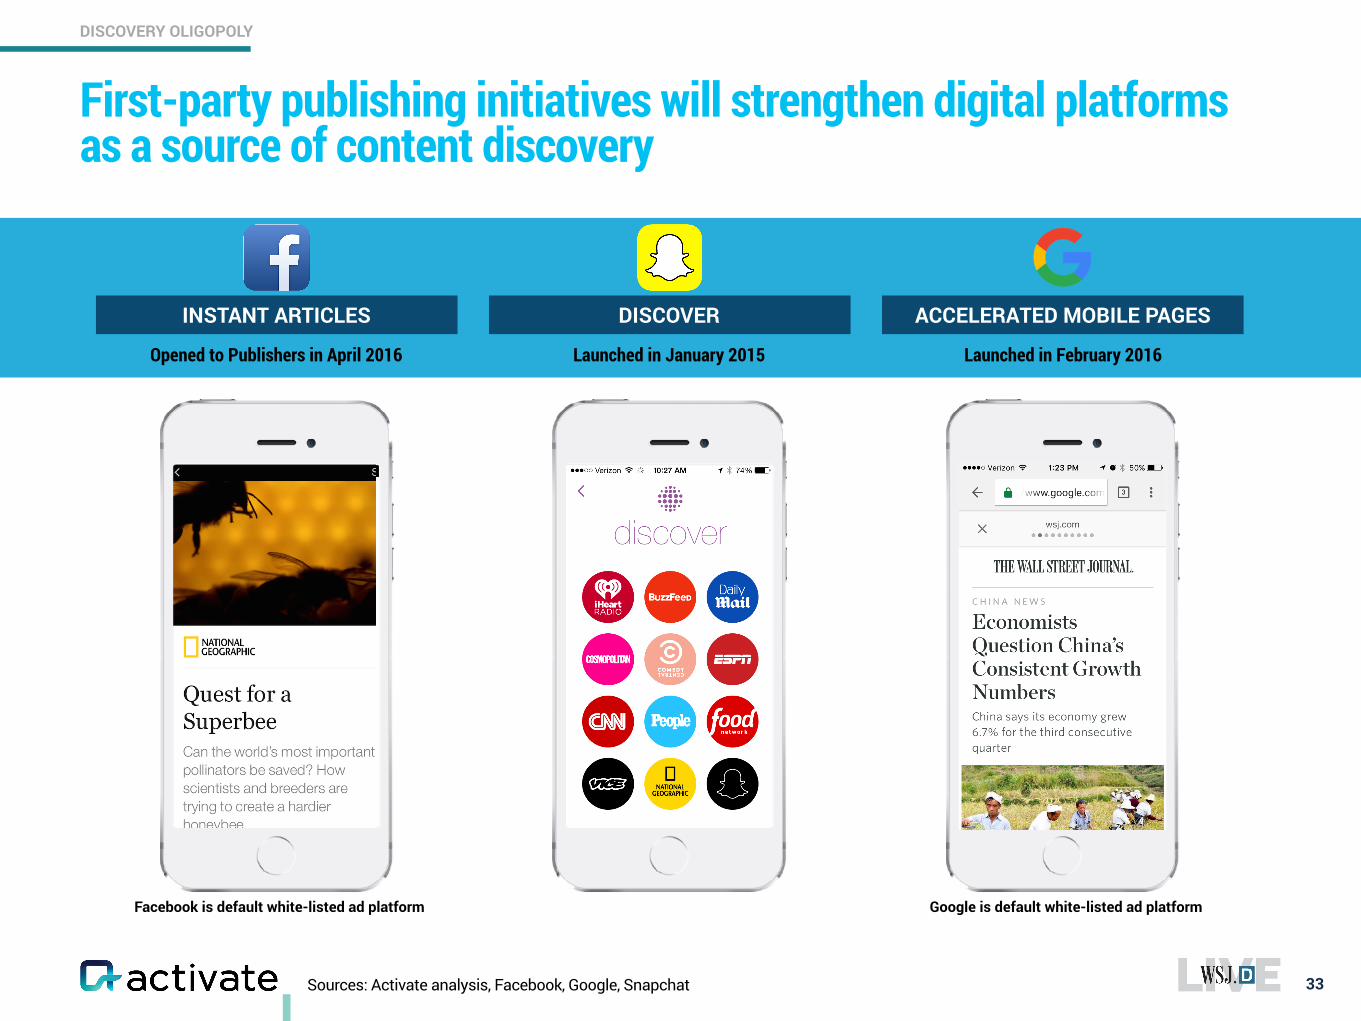
First-party publishing initiatives will strengthen digital platforms as a source of content discovery
Sources: Activate analysis, Facebook, Google, Snapchat 33
DISCOVER ACCELERATED MOBILE PAGESINSTANT ARTICLES
Launched in January 2015 Launched in February 2016Opened to Publishers in April 2016
Facebook is default white-listed ad platform Google is default white-listed ad platform
+ FOLLOW
DISCOVERY OLIGOPOLY
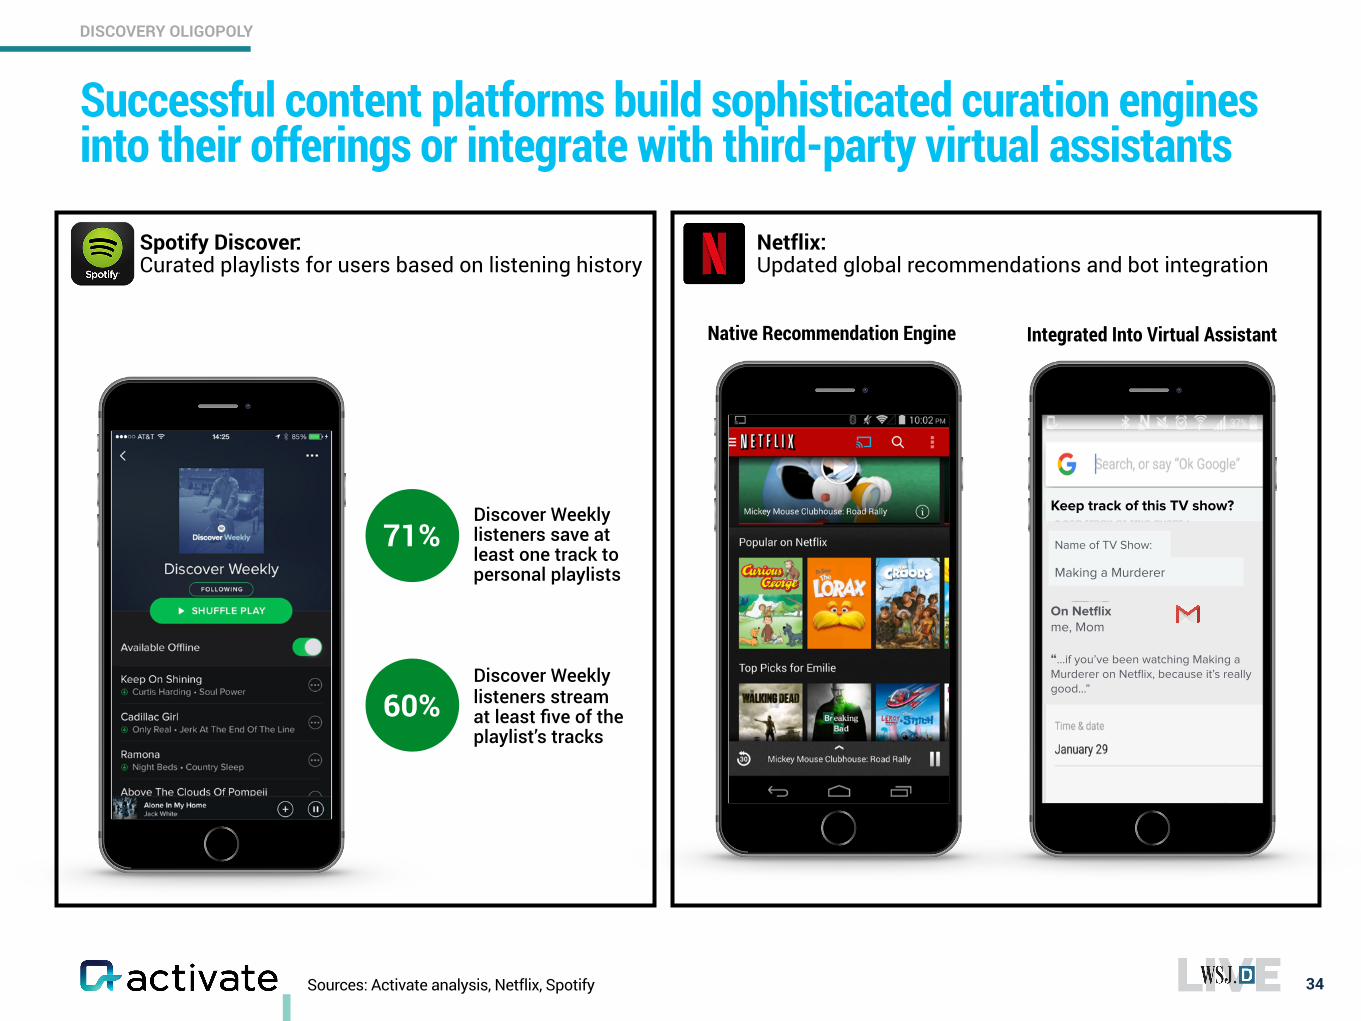
Sources: Activate analysis, Netflix, Spotify
Successful content platforms build sophisticated curation engines into their offerings or integrate with third-party virtual assistants
34
71%
60%
Discover Weekly listeners save at least one track to personal playlists
Discover Weekly listeners stream at least five of the playlist’s tracks
Spotify Discover: Curated playlists for users based on listening history
Netflix: Updated global recommendations and bot integration
Native Recommendation Engine Integrated Into Virtual Assistant
DISCOVERY OLIGOPOLY
Making a Murderer
Name of TV Show:
Keep track of this TV show?
On Netflixme, Mom“…if you’ve been watching Making a Murderer on Netflix, because it’s really good…”
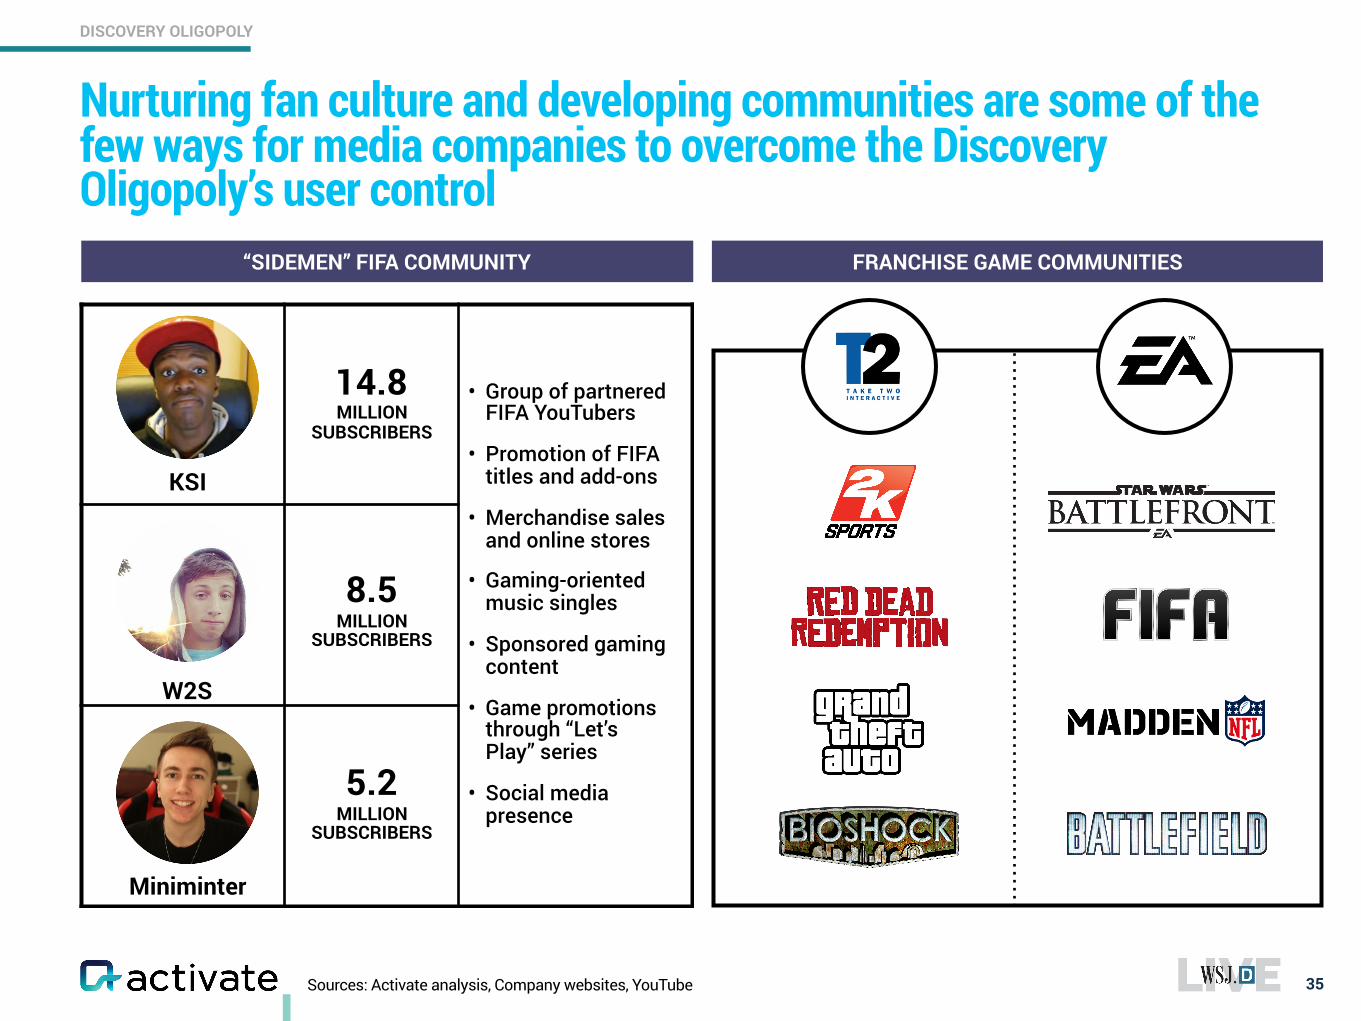
Nurturing fan culture and developing communities are some of the few ways for media companies to overcome the Discovery Oligopoly’s user control
35
DISCOVERY OLIGOPOLY
Sources: Activate analysis, Company websites, YouTube
“SIDEMEN” FIFA COMMUNITY FRANCHISE GAME COMMUNITIES
14.8 MILLION
SUBSCRIBERS
KSI
W2S
Miniminter
8.5 MILLION
SUBSCRIBERS
5.2 MILLION
SUBSCRIBERS
• Group of partnered FIFA YouTubers
• Promotion of FIFA titles and add-ons
• Merchandise sales and online stores
• Gaming-oriented music singles
• Sponsored gaming content
• Game promotions through “Let’s Play” series
• Social media presence
36www.activate.com
The 9 Most Important Insights for Tech and Media in 2017
Super-serve the Super-users and Chase the Attention Unicorns
Subscriptions will Feed the World (or at least Internet and Media Businesses)
Learn to Live with the Discovery Oligopoly
The Bot Battles are about Winning the Great Messaging War
eSports is the Next Tech Phenomenon
You Already Know the New Winners in Pay TV
Video Streaming: The Bundle is the Future
Audio: Smart Speakers, Gray Music
Post-Household America: A New Era of Users
Sources: Activate analysis, Company websites and press releases
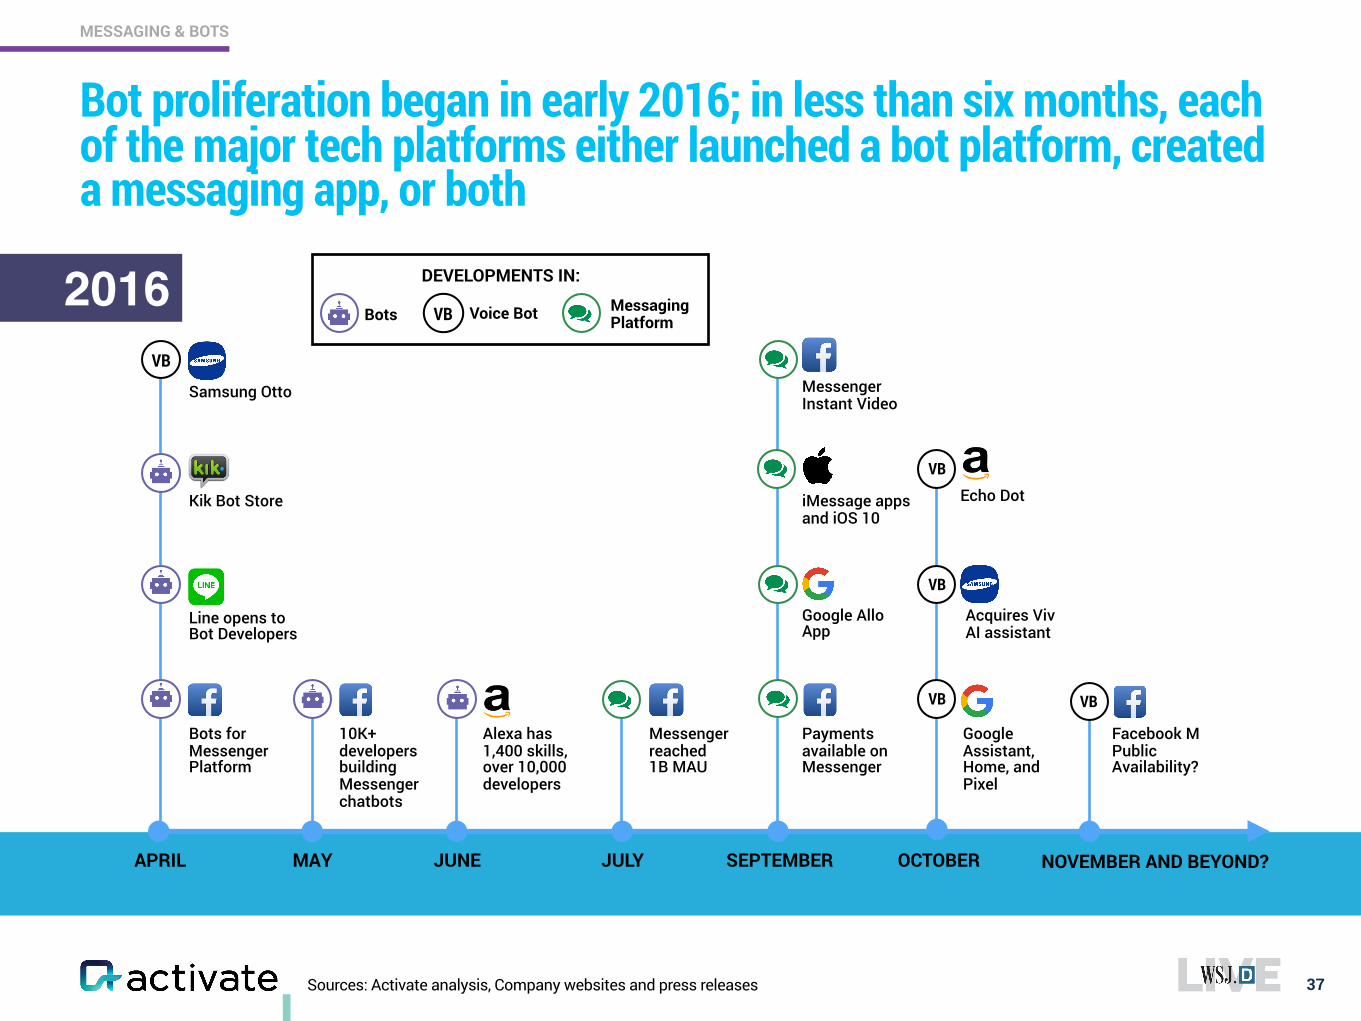
Bot proliferation began in early 2016; in less than six months, each of the major tech platforms either launched a bot platform, created a messaging app, or both
37
MESSAGING & BOTS
2016 DEVELOPMENTS IN:
Bots Messaging PlatformVB Voice Bot
Facebook M Public Availability?
NOVEMBER AND BEYOND?
Bots for Messenger Platform
10K+ developers building Messenger chatbots
Messenger reached 1B MAU
Alexa has 1,400 skills, over 10,000 developers
Google Assistant, Home, and Pixel
APRIL MAY JUNE JULY SEPTEMBER OCTOBER
Kik Bot Store
Line opens to Bot Developers
Messenger Instant Video
Echo Dot
Google Allo App
Payments available on Messenger
iMessage apps and iOS 10
VB VB
Samsung Otto
VB
Acquires Viv AI assistant
VB
VB
Sources: Activate analysis, Company websites
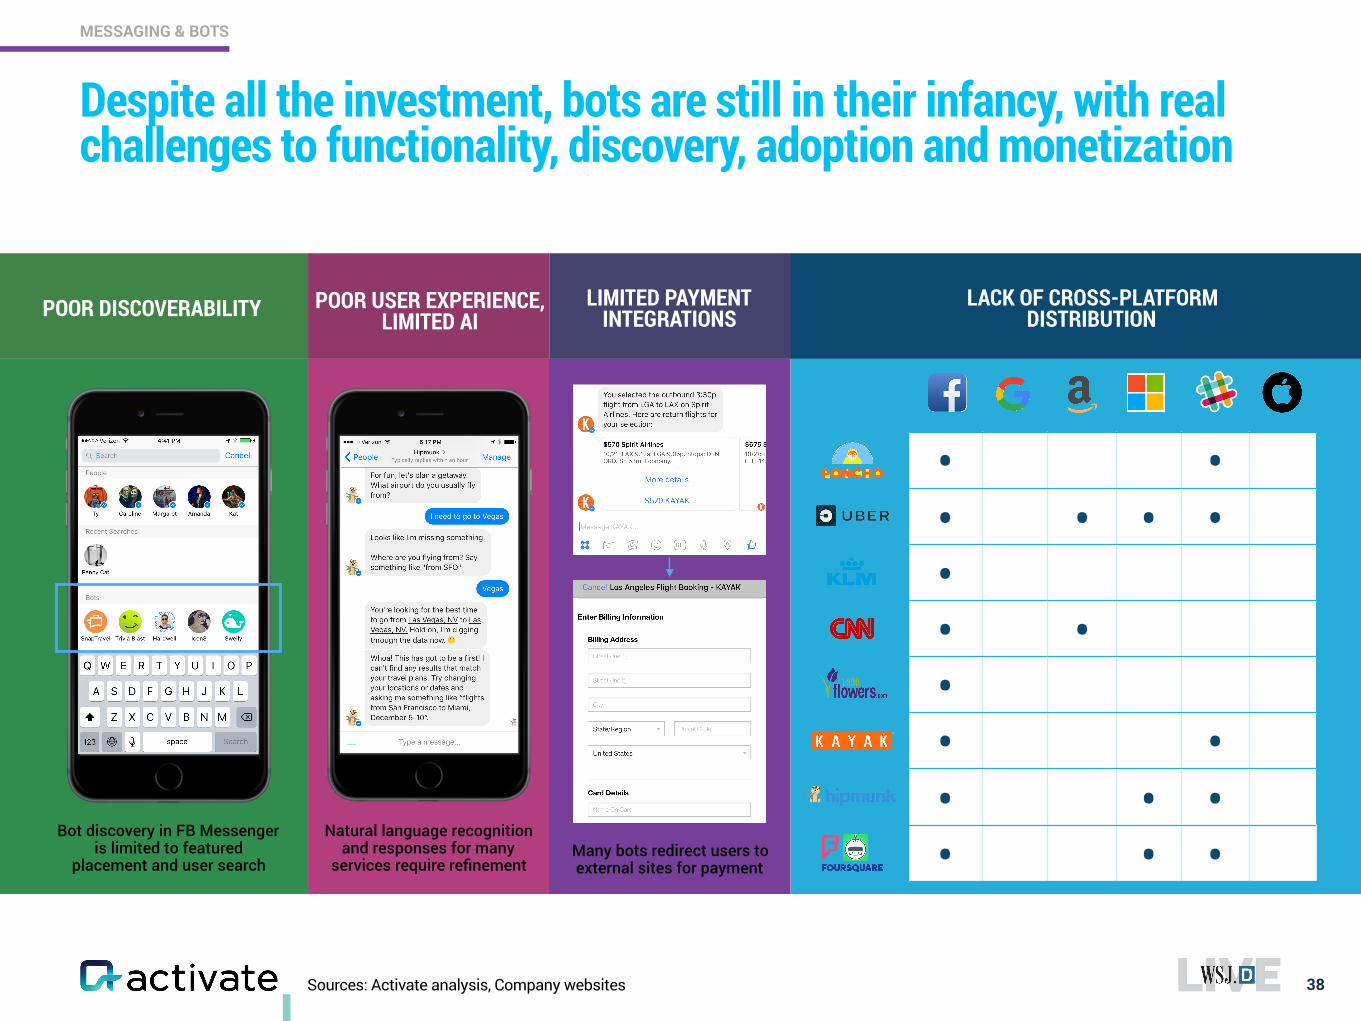
Despite all the investment, bots are still in their infancy, with real challenges to functionality, discovery, adoption and monetization
38
MESSAGING & BOTS
• •• • • ••• ••• •• • •• • •
Bot discovery in FB Messenger is limited to featured
placement and user search
Natural language recognition and responses for many
services require refinementMany bots redirect users to external sites for payment
POOR DISCOVERABILITY POOR USER EXPERIENCE, LIMITED AI
LIMITED PAYMENT INTEGRATIONS
LACK OF CROSS-PLATFORM DISTRIBUTION
Note: Messaging defined as communicating in real time with other contacts; social defined as broadcast sharing of updates, images, videos, etc. *Hybrid messaging apps **No data available for MAU of Allo Sources: Activate analysis, Company websites, eMarketer, GlobalWebIndex, SNL Kagan, TechCrunch, US Census
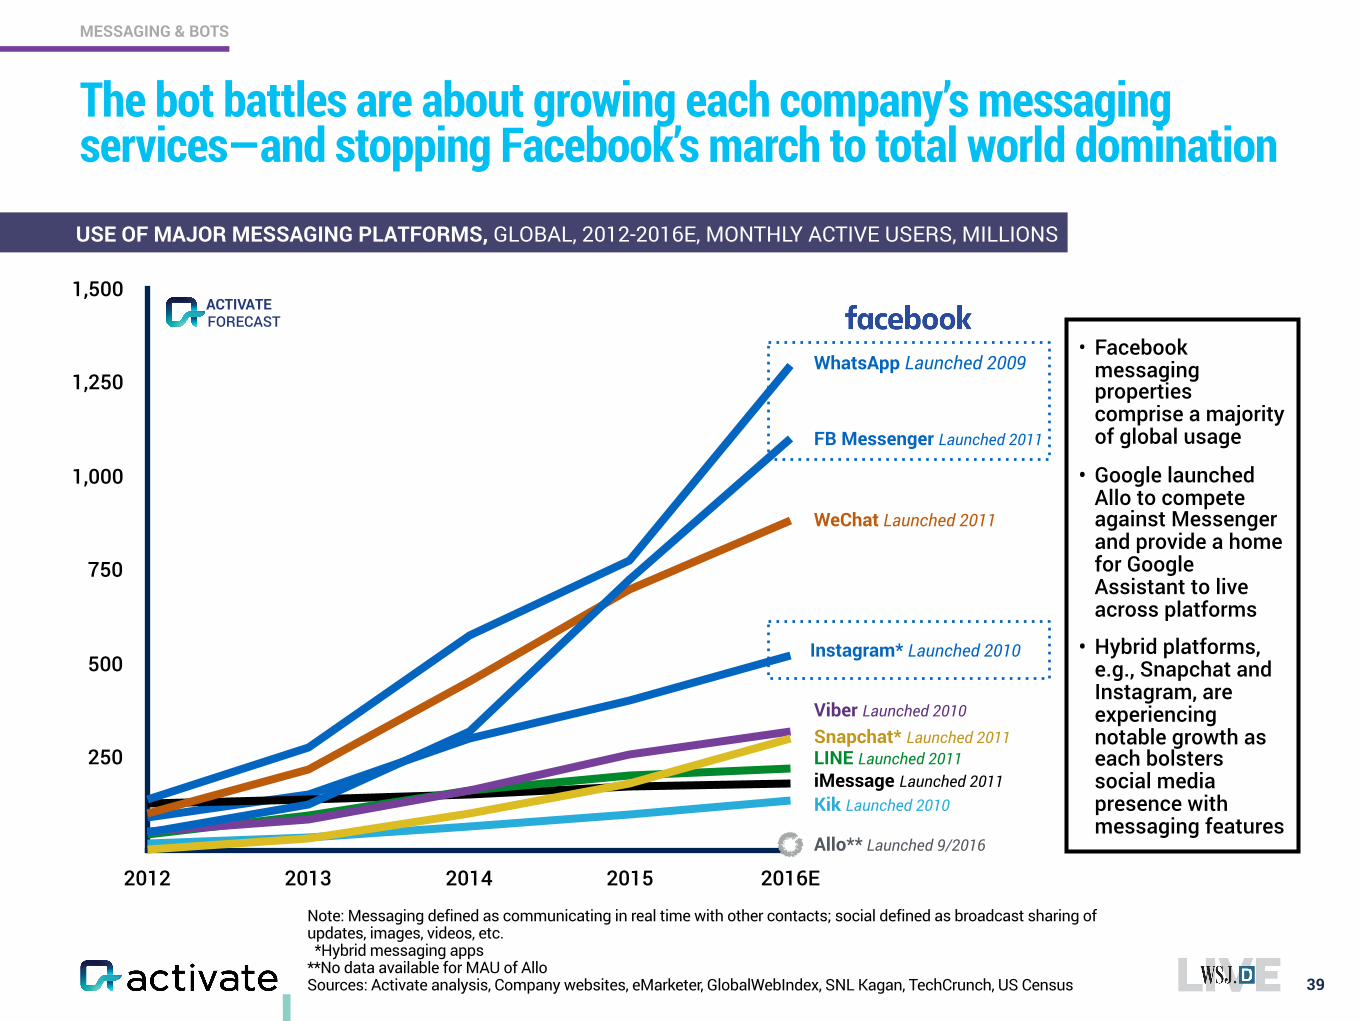
The bot battles are about growing each company’s messaging services—and stopping Facebook’s march to total world domination
39
MESSAGING & BOTS
250
500
750
1,000
1,250
1,500
2012 2013 2014 2015 2016E
WhatsApp Launched 2009
FB Messenger Launched 2011
WeChat Launched 2011
Viber Launched 2010
Kik Launched 2010
LINE Launched 2011iMessage Launched 2011
Allo** Launched 9/2016
Instagram* Launched 2010
Snapchat* Launched 2011
USE OF MAJOR MESSAGING PLATFORMS, GLOBAL, 2012-2016E, MONTHLY ACTIVE USERS, MILLIONS
• Facebook messaging properties comprise a majority of global usage
• Google launched Allo to compete against Messenger and provide a home for Google Assistant to live across platforms
• Hybrid platforms, e.g., Snapchat and Instagram, are experiencing notable growth as each bolsters social media presence with messaging features
FORECASTACTIVATE
*Hybrid messaging apps Note: Excludes Line and Viber Sources: Activate analysis, Ark Invest, Asymco, CNET, Company websites, eMarketer, Ericsson, Forbes, GlobalWebIndex, IDC, SNL Kagan, TechCrunch, US Census
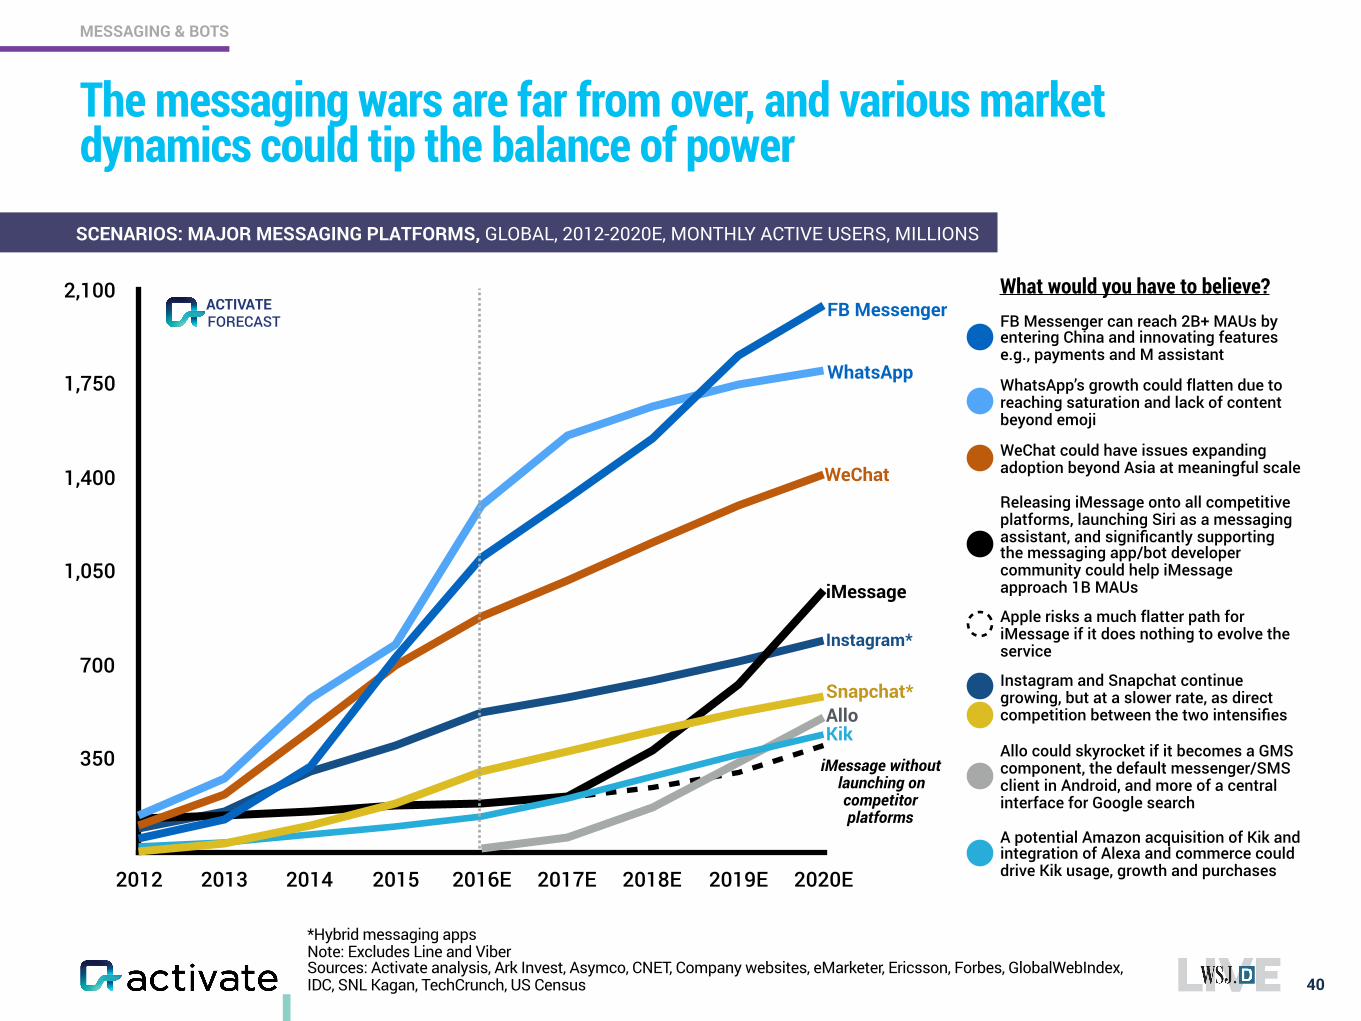
The messaging wars are far from over, and various market dynamics could tip the balance of power
40
MESSAGING & BOTS
What would you have to believe?FB Messenger can reach 2B+ MAUs by entering China and innovating features e.g., payments and M assistant
WhatsApp’s growth could flatten due to reaching saturation and lack of content beyond emoji
A potential Amazon acquisition of Kik and integration of Alexa and commerce could drive Kik usage, growth and purchases
Releasing iMessage onto all competitive platforms, launching Siri as a messaging assistant, and significantly supporting the messaging app/bot developer community could help iMessage approach 1B MAUs
Allo could skyrocket if it becomes a GMS component, the default messenger/SMS client in Android, and more of a central interface for Google search
FB Messenger
Kik
iMessage
Allo
Instagram*
Snapchat*
WeChat could have issues expanding adoption beyond Asia at meaningful scale
Instagram and Snapchat continue growing, but at a slower rate, as direct competition between the two intensifies
350
700
1,050
1,400
1,750
2,100
2012 2013 2014 2015 2016E 2017E 2018E 2019E 2020E
iMessage without launching on competitor platforms
Apple risks a much flatter path for iMessage if it does nothing to evolve the service
SCENARIOS: MAJOR MESSAGING PLATFORMS, GLOBAL, 2012-2020E, MONTHLY ACTIVE USERS, MILLIONS
FORECASTACTIVATE
Sources: Activate analysis, Activate 2016 Consumer Tech & Media Research Study (n=1,003)
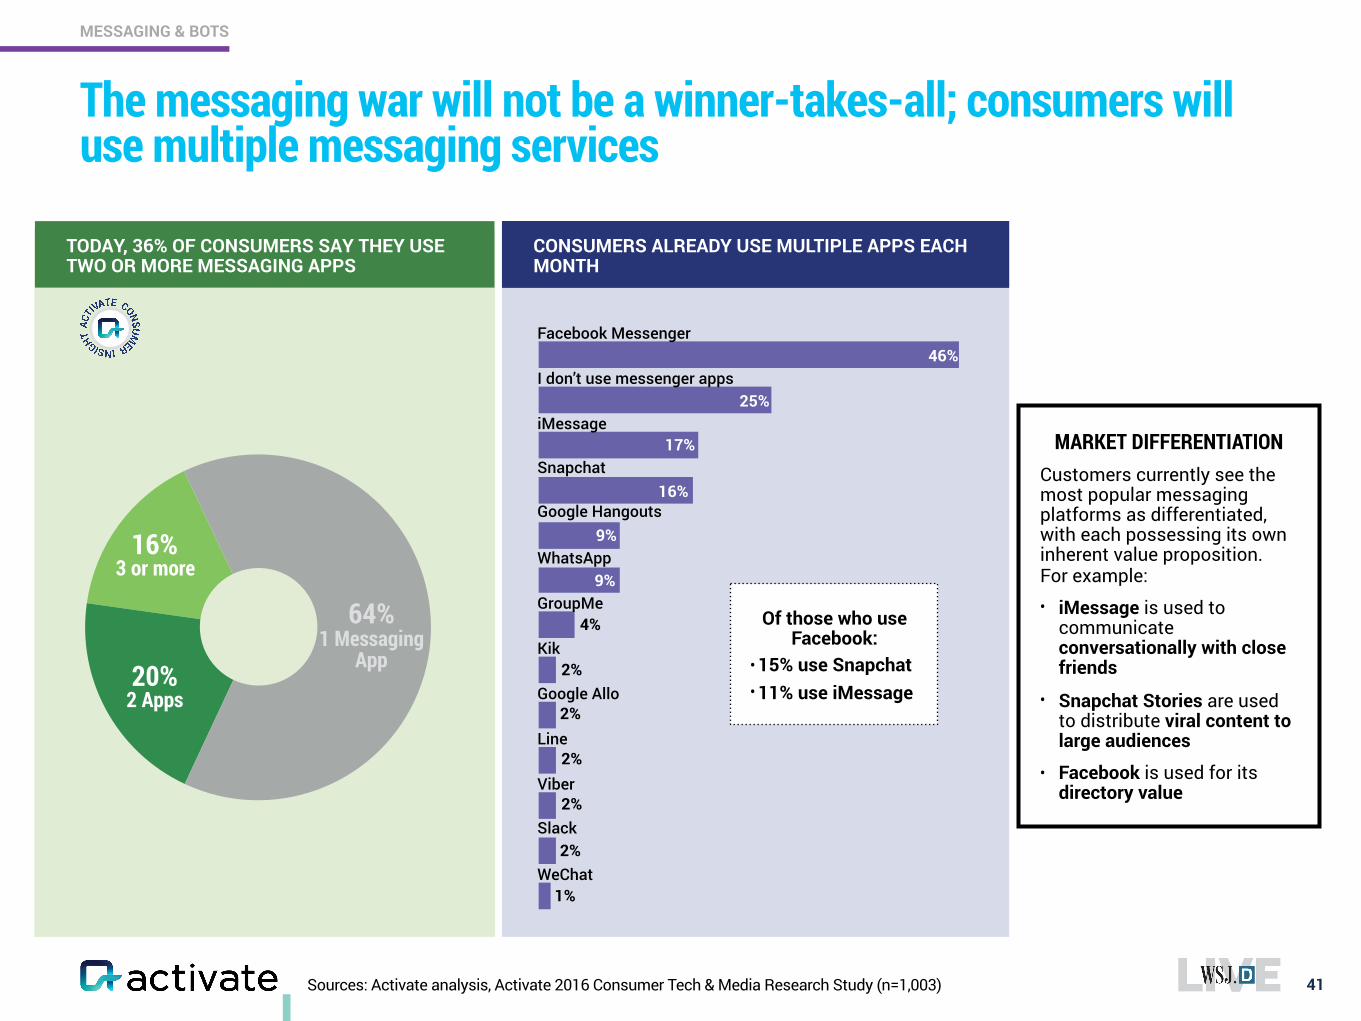
The messaging war will not be a winner-takes-all; consumers will use multiple messaging services
41
MESSAGING & BOTS
64% 1 Messaging
App20%
2 Apps
16% 3 or more
Of those who use Facebook:
• 15% use Snapchat • 11% use iMessage
TODAY, 36% OF CONSUMERS SAY THEY USE TWO OR MORE MESSAGING APPS
CONSUMERS ALREADY USE MULTIPLE APPS EACH MONTH
MARKET DIFFERENTIATION Customers currently see the most popular messaging platforms as differentiated, with each possessing its own inherent value proposition. For example: • iMessage is used to
communicate conversationally with close friends
• Snapchat Stories are used to distribute viral content to large audiences
• Facebook is used for its directory value
I don’t use messenger apps
iMessage
Snapchat
Google Hangouts
GroupMe
Kik
Google Allo
Line
Viber
Slack
Facebook Messenger46%
25%
17%
16%
9%
9%
4%
2%
2%
2%
2%
2%
1%
Source: Activate analysis
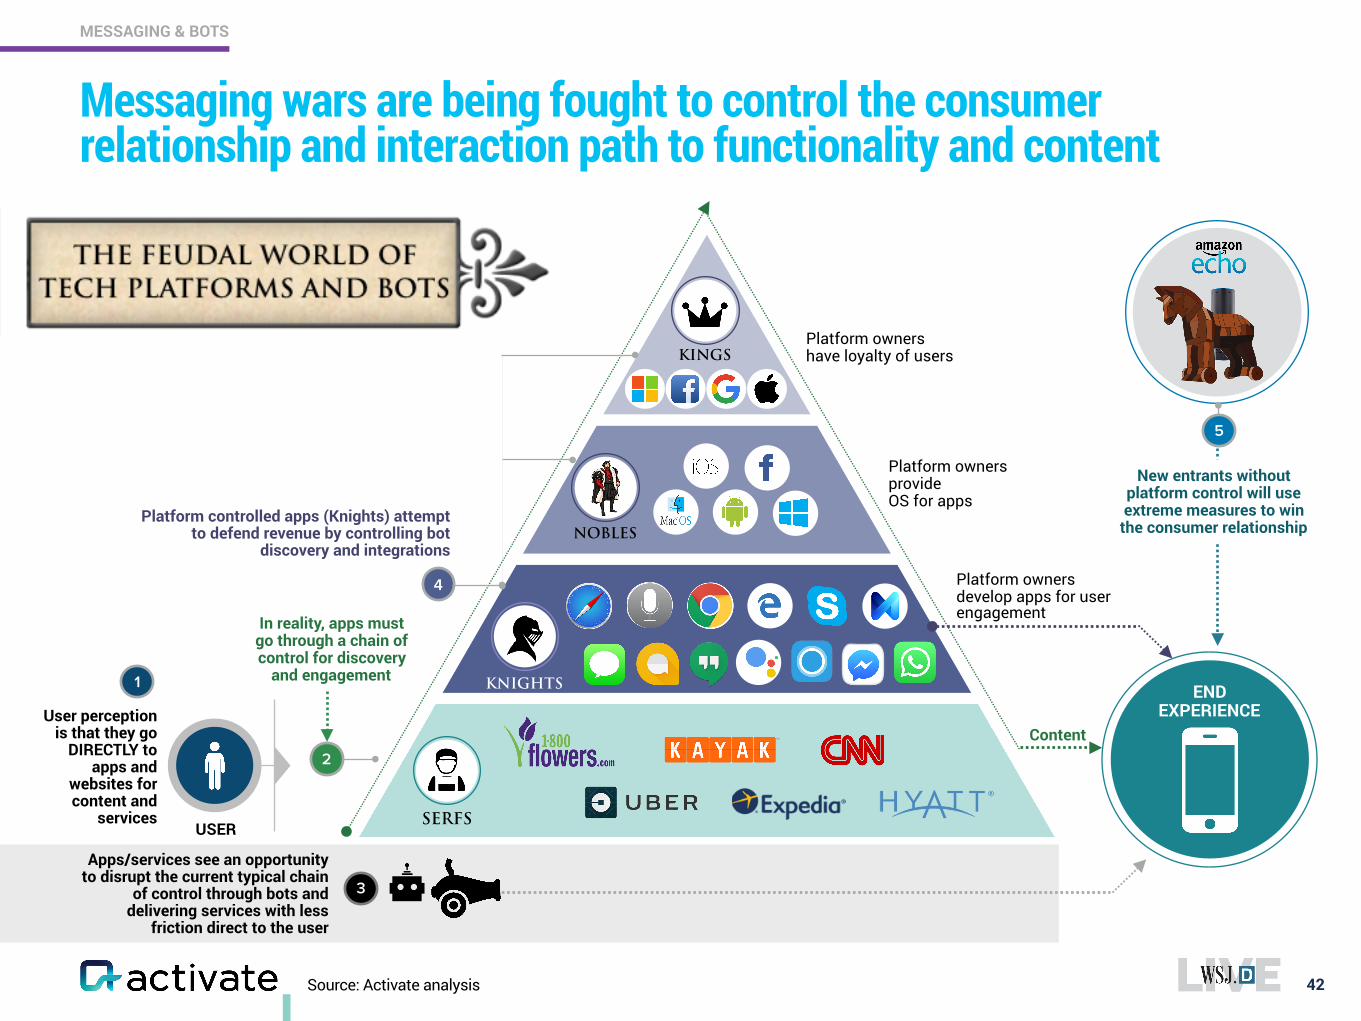
Messaging wars are being fought to control the consumer relationship and interaction path to functionality and content
42
MESSAGING & BOTS
1
USER
User perception is that they go
DIRECTLY to apps and
websites for content and
services
In reality, apps must go through a chain of control for discovery
and engagement
2
Content
Apps/services see an opportunity to disrupt the current typical chain
of control through bots and delivering services with less
friction direct to the user
3
KNIGHTS
Platform controlled apps (Knights) attempt to defend revenue by controlling bot
discovery and integrations
4
SERFS
NOBLES
KINGSPlatform owners have loyalty of users
Platform owners provide OS for apps
Platform owners develop apps for user engagement
END EXPERIENCE
5
New entrants without platform control will use extreme measures to win
the consumer relationship
Source: Activate analysis
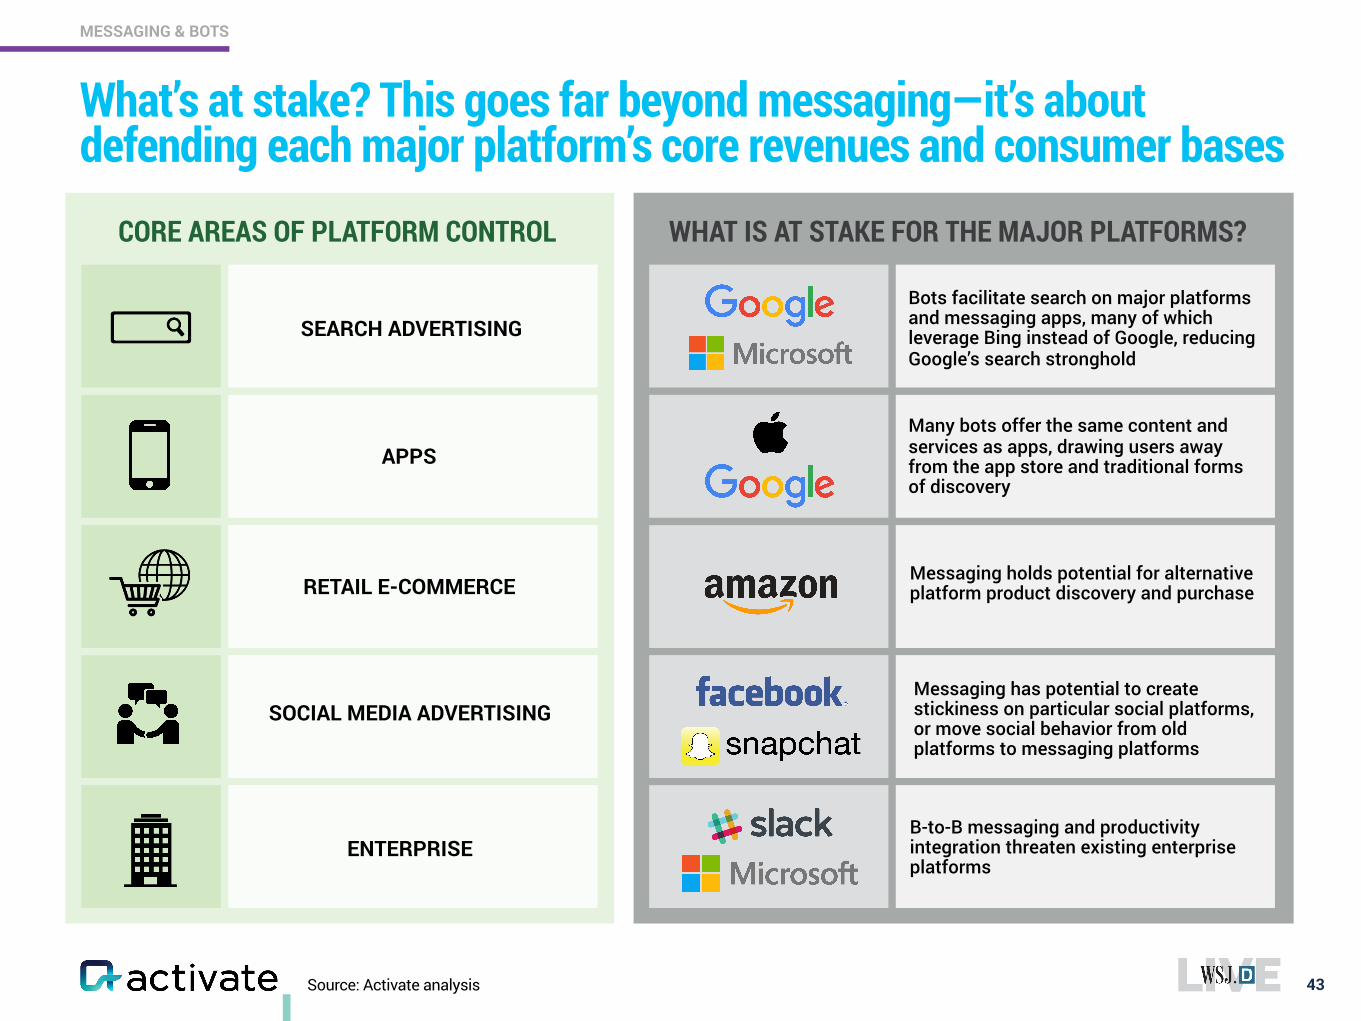
What’s at stake? This goes far beyond messaging—it’s about defending each major platform’s core revenues and consumer bases
43
MESSAGING & BOTS
SEARCH ADVERTISINGBots facilitate search on major platforms and messaging apps, many of which leverage Bing instead of Google, reducing Google’s search stronghold
Messaging holds potential for alternative platform product discovery and purchase
B-to-B messaging and productivity integration threaten existing enterprise platforms
Messaging has potential to create stickiness on particular social platforms, or move social behavior from old platforms to messaging platforms
Many bots offer the same content and services as apps, drawing users away from the app store and traditional forms of discovery
APPS
RETAIL E-COMMERCE
ENTERPRISE
SOCIAL MEDIA ADVERTISING
CORE AREAS OF PLATFORM CONTROL WHAT IS AT STAKE FOR THE MAJOR PLATFORMS?
Sources: Activate analysis, Company websites, LinkedIn, Salesforce Annual Report, Salesforce appexchange, Quartz
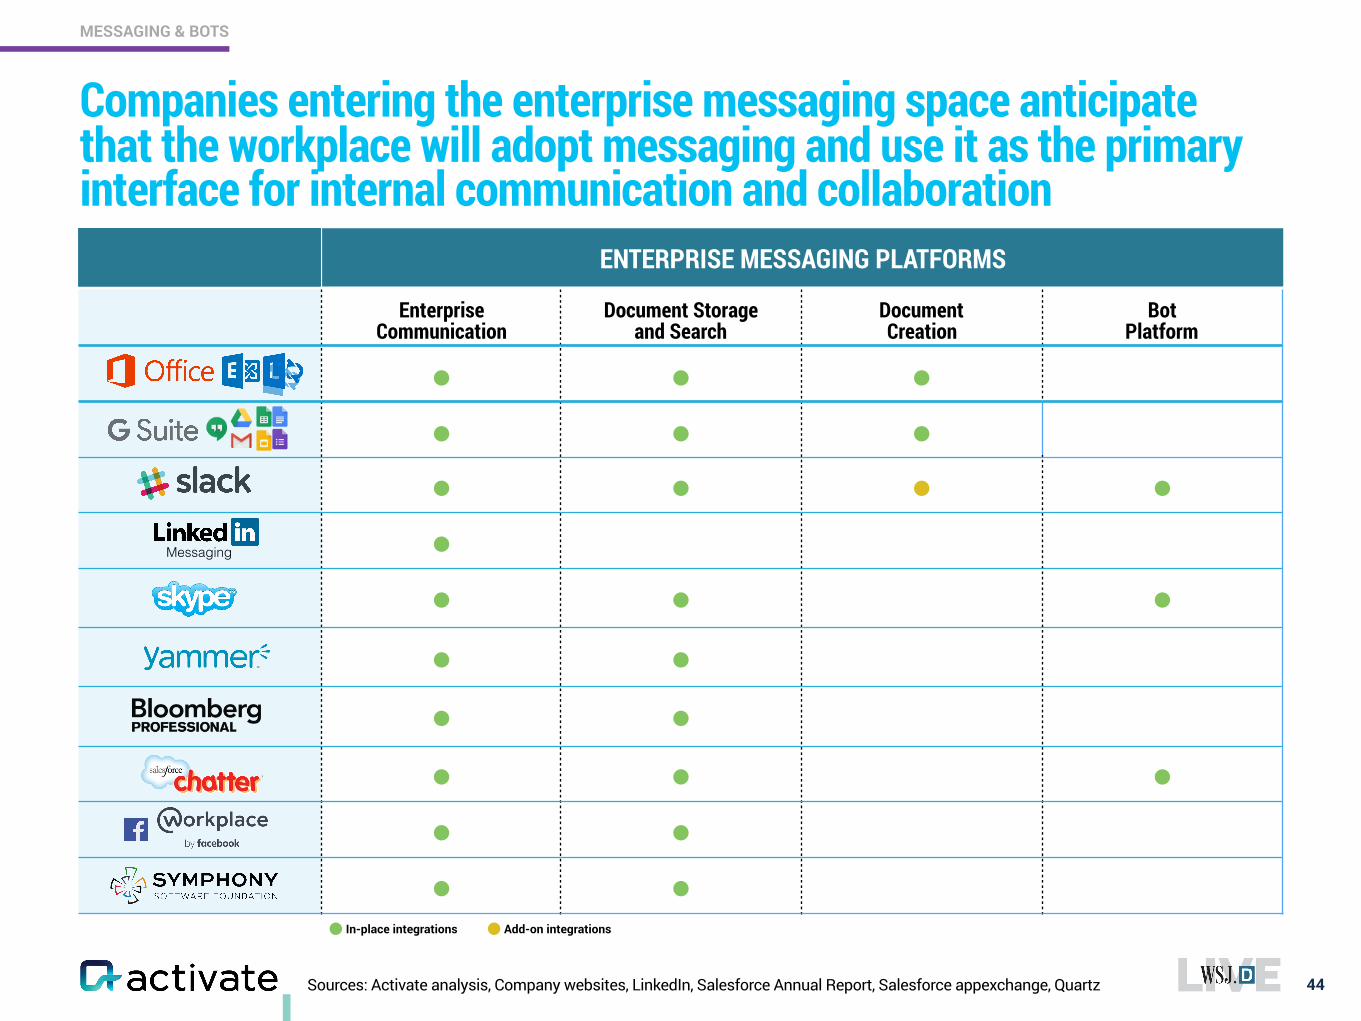
Companies entering the enterprise messaging space anticipate that the workplace will adopt messaging and use it as the primary interface for internal communication and collaboration
44
MESSAGING & BOTS
ENTERPRISE MESSAGING PLATFORMS
• In-place integrations
Enterprise Communication
Document Storage and Search
Document Creation
Bot Platform
• • •• • •• • • ••• • •• • • • • • •• •• •
Messaging
•Add-on integrations
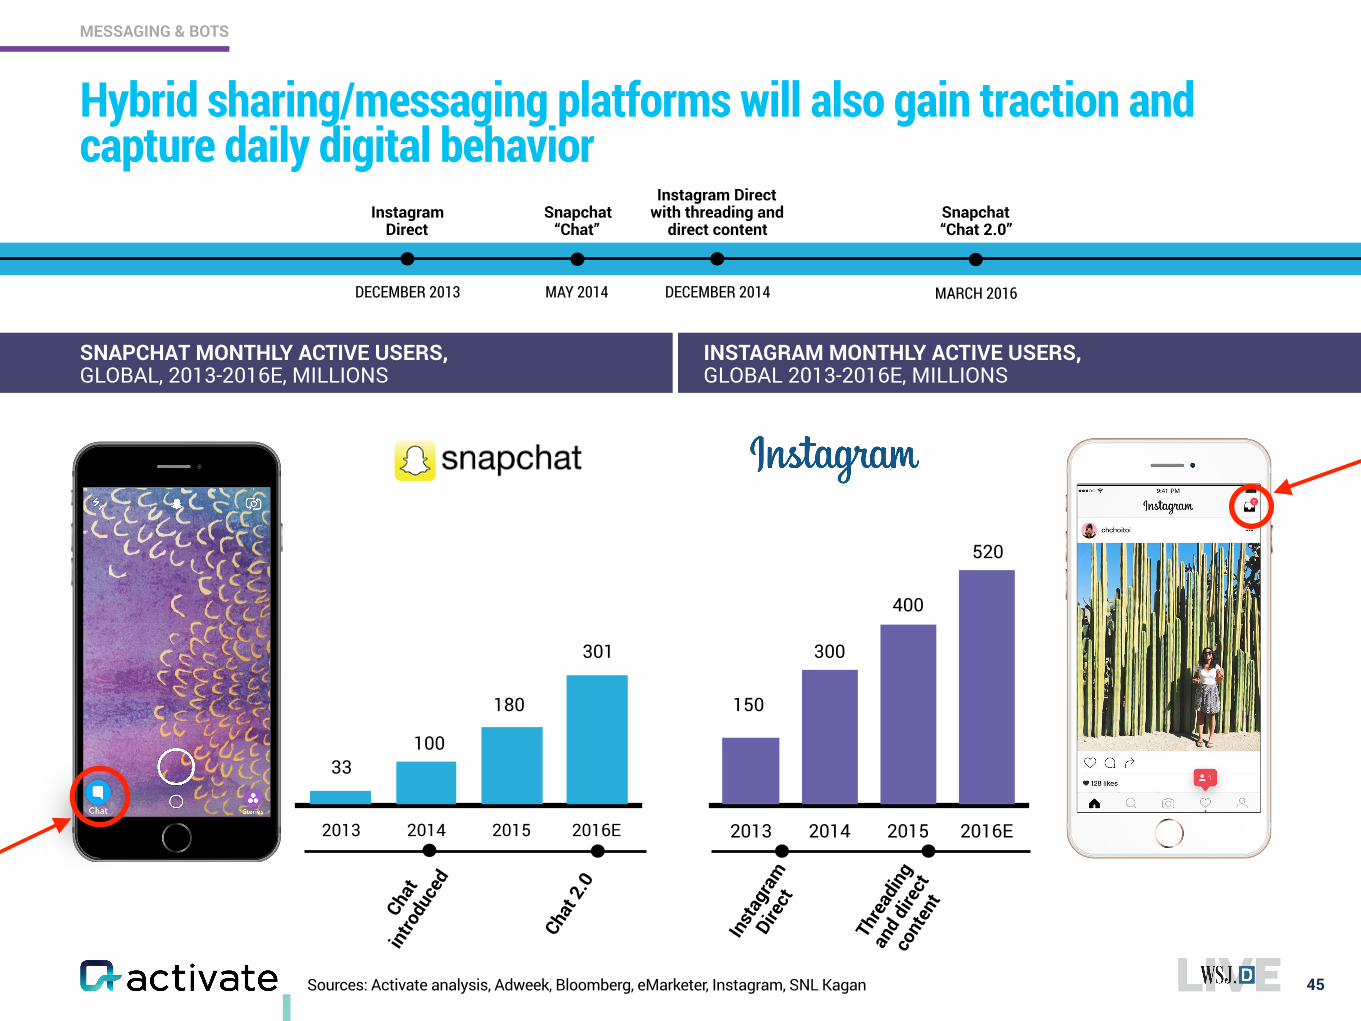
Sources: Activate analysis, Adweek, Bloomberg, eMarketer, Instagram, SNL Kagan
Hybrid sharing/messaging platforms will also gain traction and capture daily digital behavior
45
MESSAGING & BOTS
Instagram Direct
DECEMBER 2013
Snapchat “Chat”
MAY 2014
Instagram Direct with threading and
direct content
DECEMBER 2014
Snapchat “Chat 2.0”
MARCH 2016
SNAPCHAT MONTHLY ACTIVE USERS, GLOBAL, 2013-2016E, MILLIONS
INSTAGRAM MONTHLY ACTIVE USERS, GLOBAL 2013-2016E, MILLIONS
2013 2014 2015 2016E
100
180
301
Chat
in
trodu
ced
Chat
2.0
2013 2014 2015 2016E
Inst
agra
m
Dire
ct
Thre
adin
g an
d di
rect
co
nten
t
150
300
33
400
520
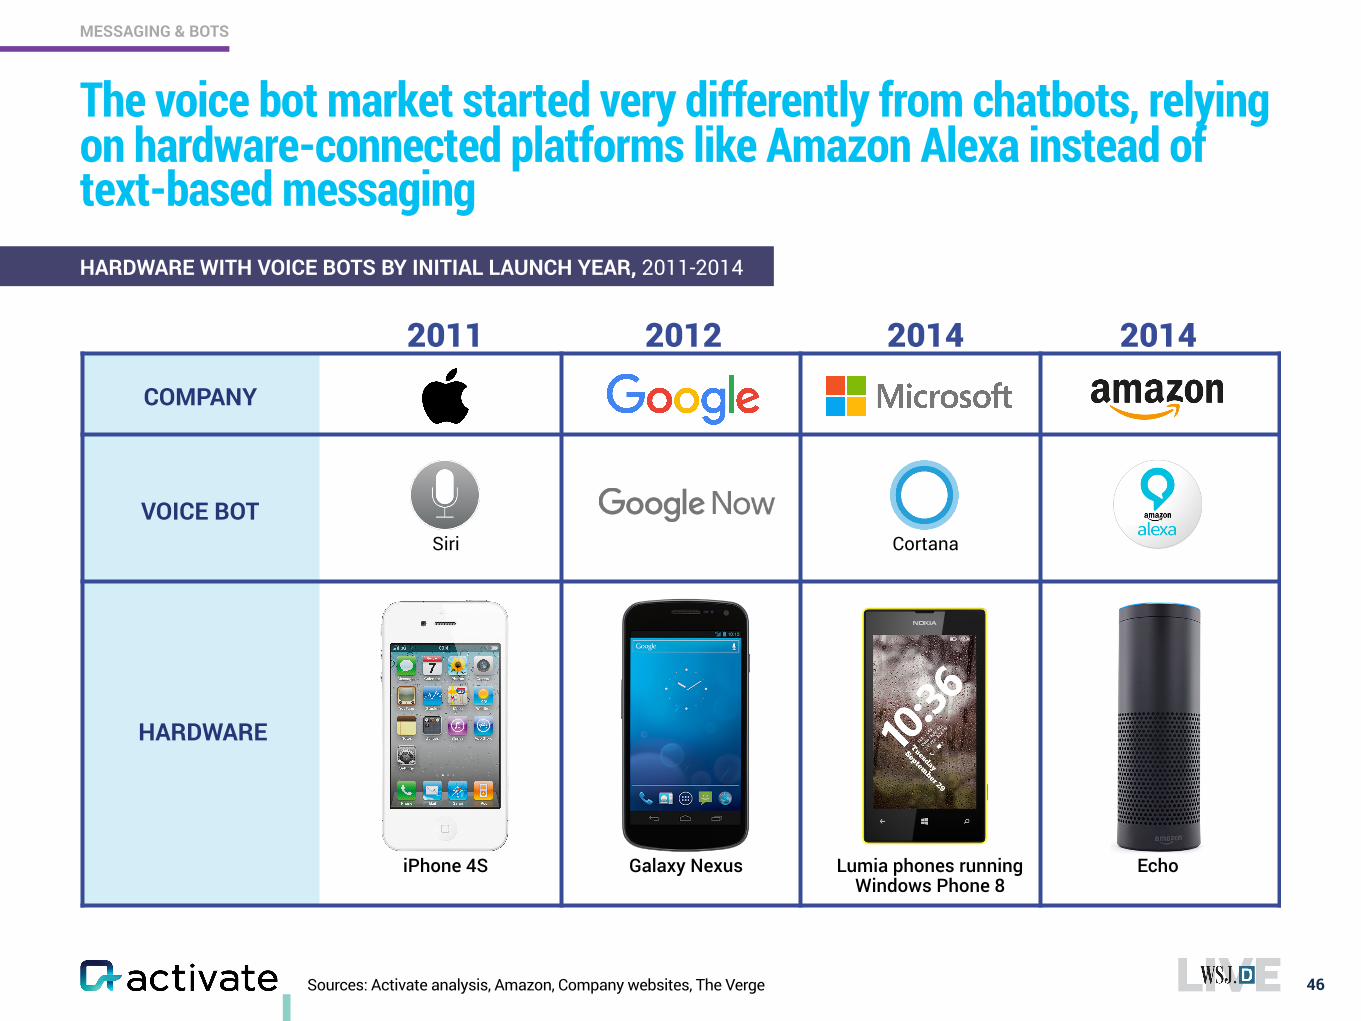
Sources: Activate analysis, Amazon, Company websites, The Verge
The voice bot market started very differently from chatbots, relying on hardware-connected platforms like Amazon Alexa instead of text-based messaging
46
MESSAGING & BOTS
HARDWARE WITH VOICE BOTS BY INITIAL LAUNCH YEAR, 2011-2014
2011 2012 2014 2014
iPhone 4S
Siri
Galaxy Nexus Lumia phones running Windows Phone 8
Cortana
COMPANY
VOICE BOT
Echo
HARDWARE
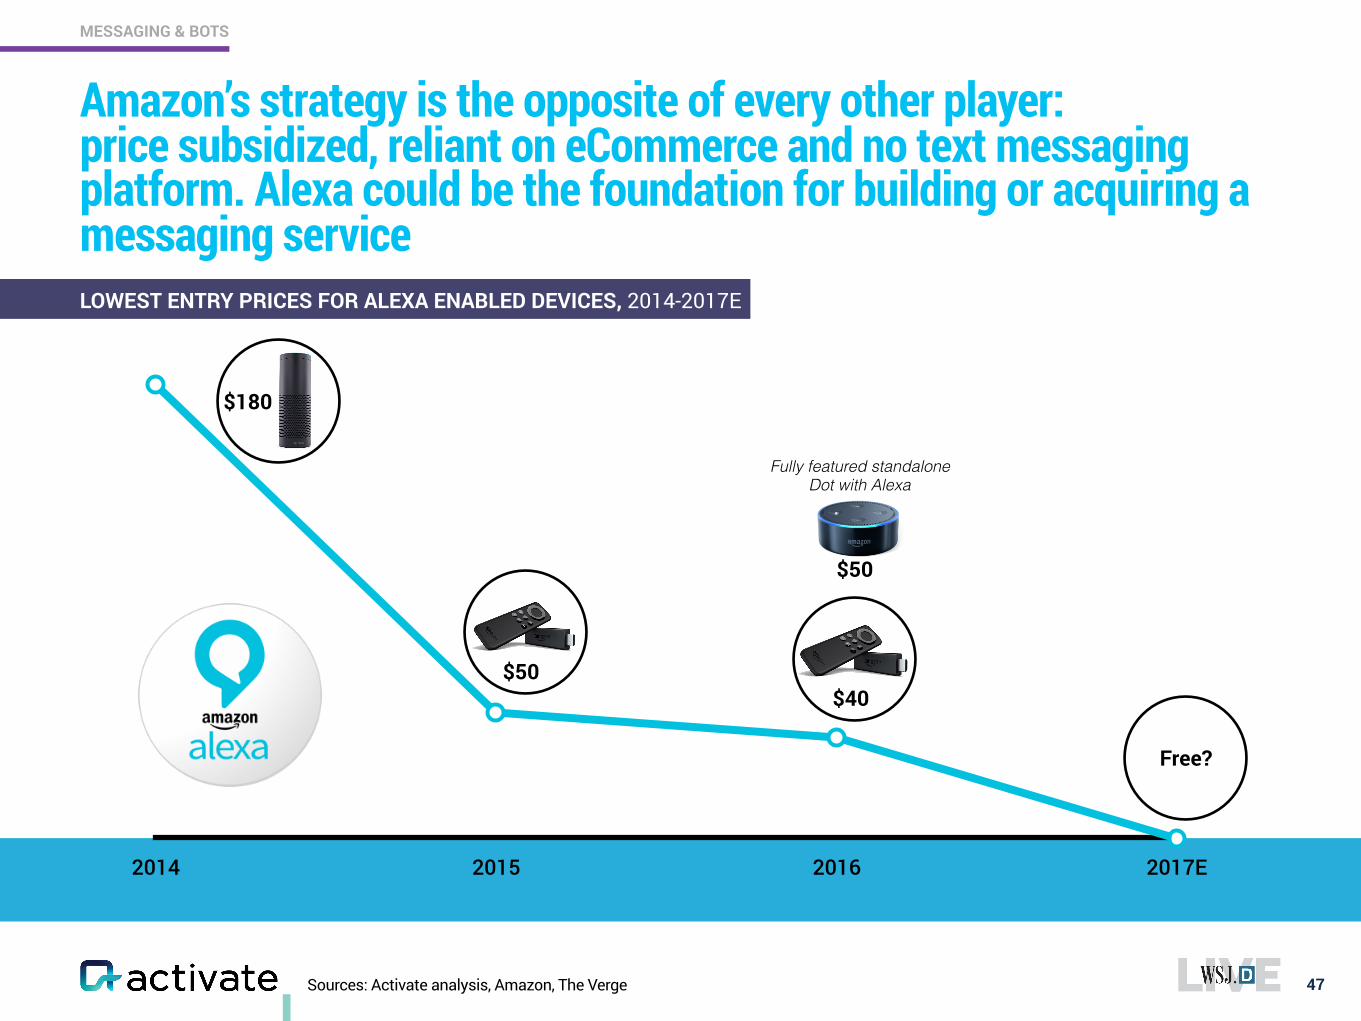
Sources: Activate analysis, Amazon, The Verge
Amazon’s strategy is the opposite of every other player: price subsidized, reliant on eCommerce and no text messaging platform. Alexa could be the foundation for building or acquiring a messaging service
47
MESSAGING & BOTS
2014 2015 2016 2017E
$180
$50
Free?
$40
$50
Fully featured standalone Dot with Alexa
LOWEST ENTRY PRICES FOR ALEXA ENABLED DEVICES, 2014-2017E
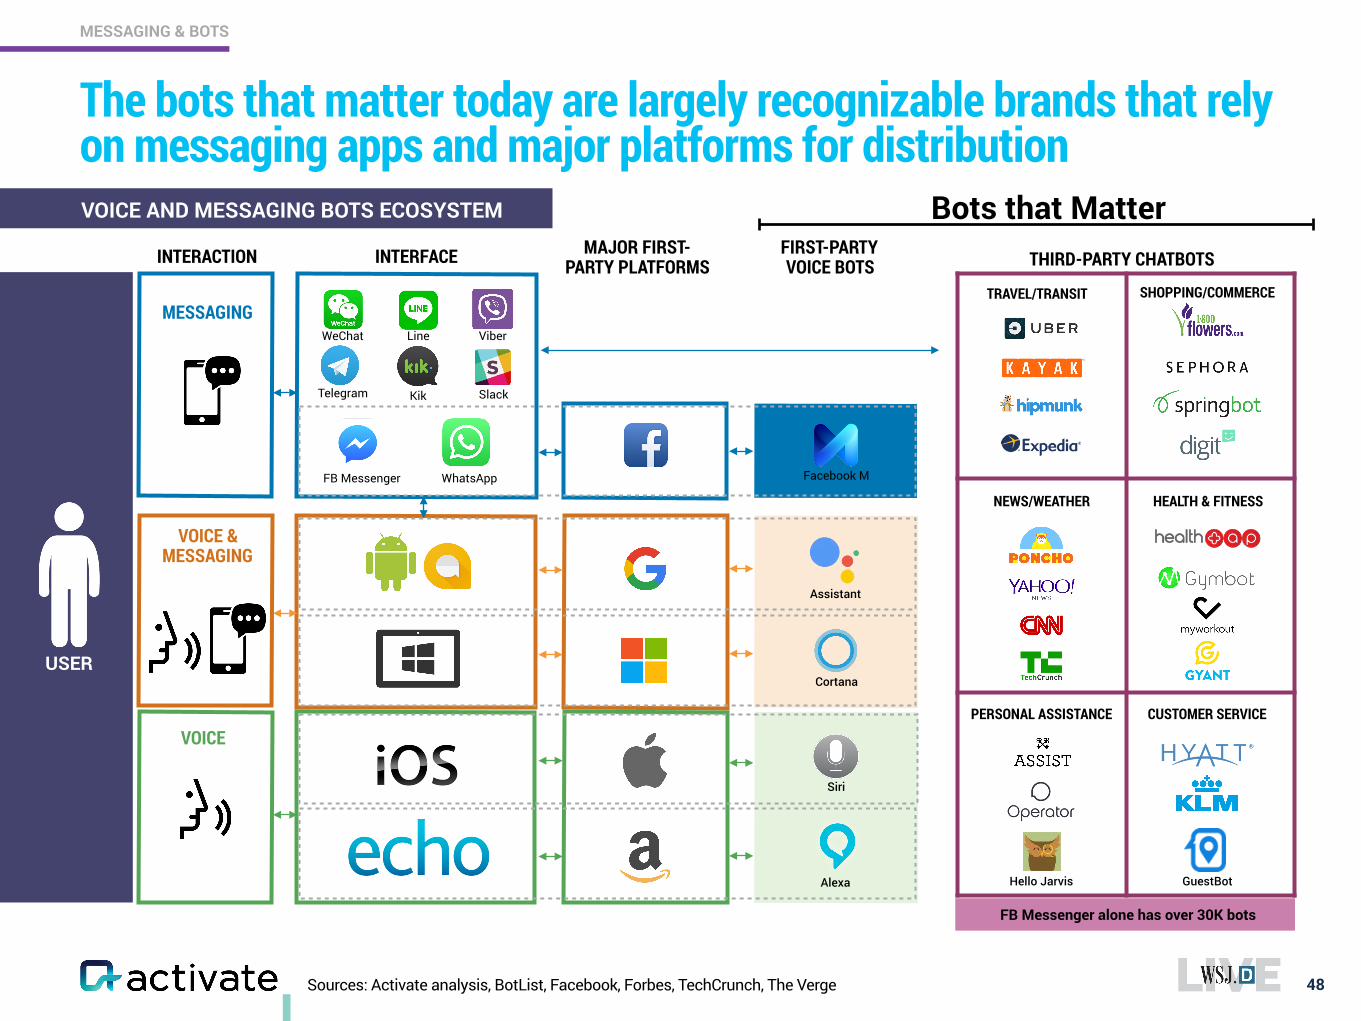
Sources: Activate analysis, BotList, Facebook, Forbes, TechCrunch, The Verge
The bots that matter today are largely recognizable brands that rely on messaging apps and major platforms for distribution
48
MESSAGING & BOTS
USER
FIRST-PARTY VOICE BOTSINTERFACEINTERACTION THIRD-PARTY CHATBOTSMAJOR FIRST-
PARTY PLATFORMS
VOICE
VOICE & MESSAGING
MESSAGING
FB Messenger WhatsApp
Telegram
LineWeChat
Kik Slack
Viber
Cortana
Alexa
Facebook M
Siri
Assistant
TRAVEL/TRANSIT SHOPPING/COMMERCE
NEWS/WEATHER HEALTH & FITNESS
PERSONAL ASSISTANCE CUSTOMER SERVICE
VOICE AND MESSAGING BOTS ECOSYSTEM
FB Messenger alone has over 30K bots
Bots that Matter
GuestBotHello Jarvis
*Note: Bing search as default on Facebook M unconfirmed, though Facebook search agreement is with Microsoft Sources: Activate analysis, Company websites, SearchEngineLand
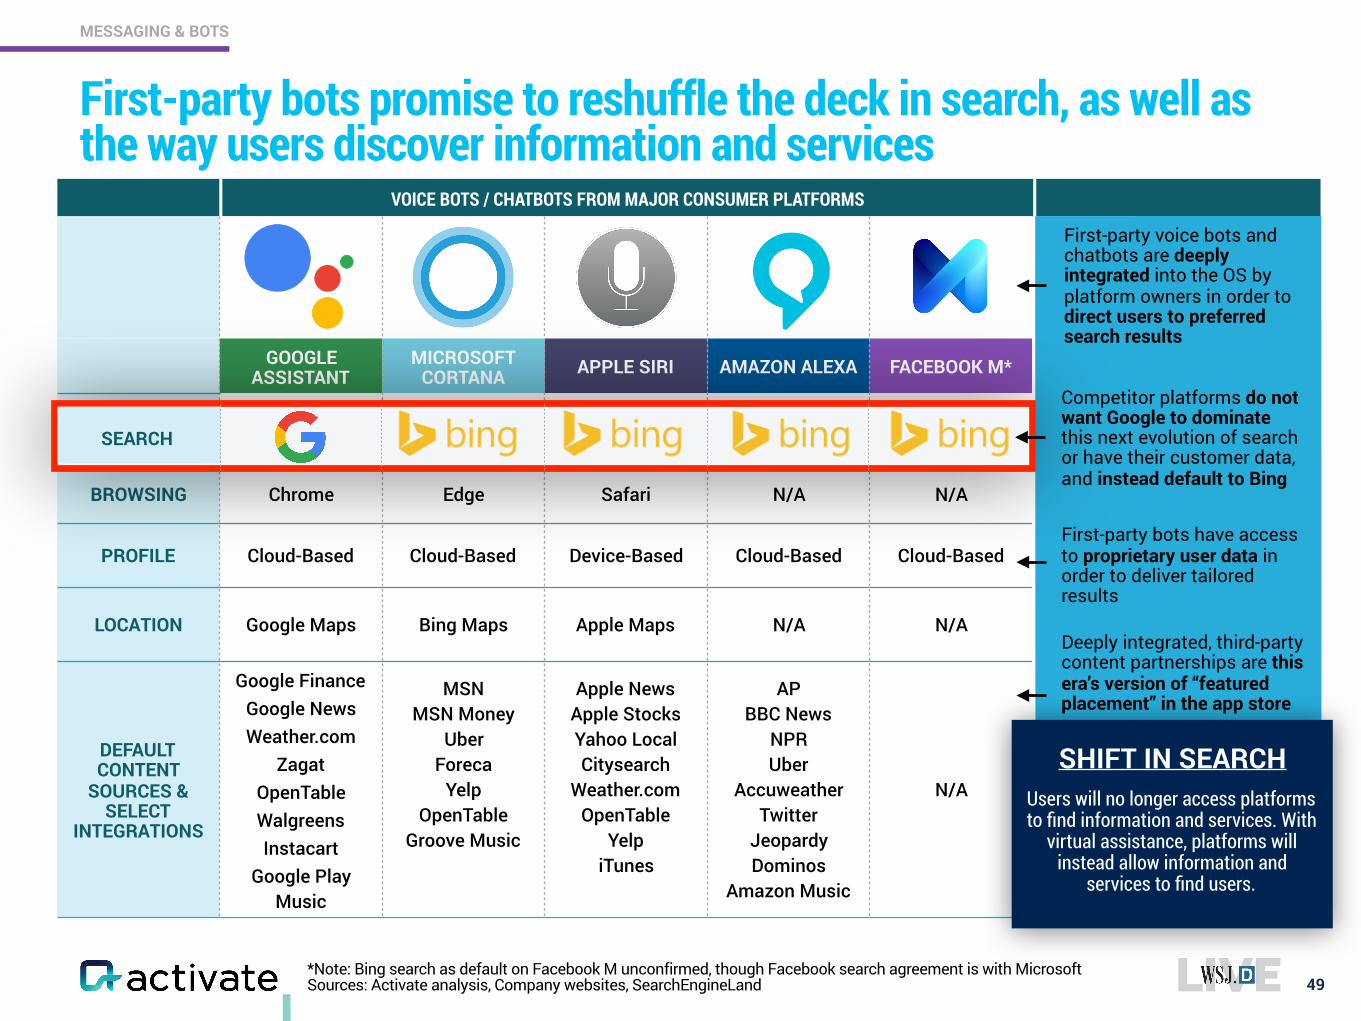
First-party bots promise to reshuffle the deck in search, as well as the way users discover information and services
49
MESSAGING & BOTS
VOICE BOTS / CHATBOTS FROM MAJOR CONSUMER PLATFORMS
GOOGLE ASSISTANT
MICROSOFT CORTANA APPLE SIRI AMAZON ALEXA FACEBOOK M*
SEARCH Google Bing Bing* Bing
BROWSING Chrome Edge Safari N/A N/A
PROFILE Cloud-Based Cloud-Based Device-Based Cloud-Based Cloud-Based
LOCATION Google Maps Bing Maps Apple Maps N/A N/A
DEFAULT CONTENT
SOURCES & SELECT
INTEGRATIONS
Google Finance Google News Weather.com
Zagat OpenTable Walgreens Instacart
Google Play Music
MSN MSN Money
Uber Foreca
Yelp OpenTable
Groove Music
Apple News Apple Stocks Yahoo Local Citysearch
Weather.com OpenTable
Yelp iTunes
AP BBC News
NPR Uber
Accuweather Twitter
Jeopardy Dominos
Amazon Music
N/A
Deeply integrated, third-party content partnerships are this era’s version of “featured placement” in the app store
First-party voice bots and chatbots are deeply integrated into the OS by platform owners in order to direct users to preferred search results
Competitor platforms do not want Google to dominate this next evolution of search or have their customer data, and instead default to Bing
SHIFT IN SEARCHUsers will no longer access platforms to find information and services. With
virtual assistance, platforms will instead allow information and
services to find users.
SEARCH
First-party bots have access to proprietary user data in order to deliver tailored results
Source: Activate analysis
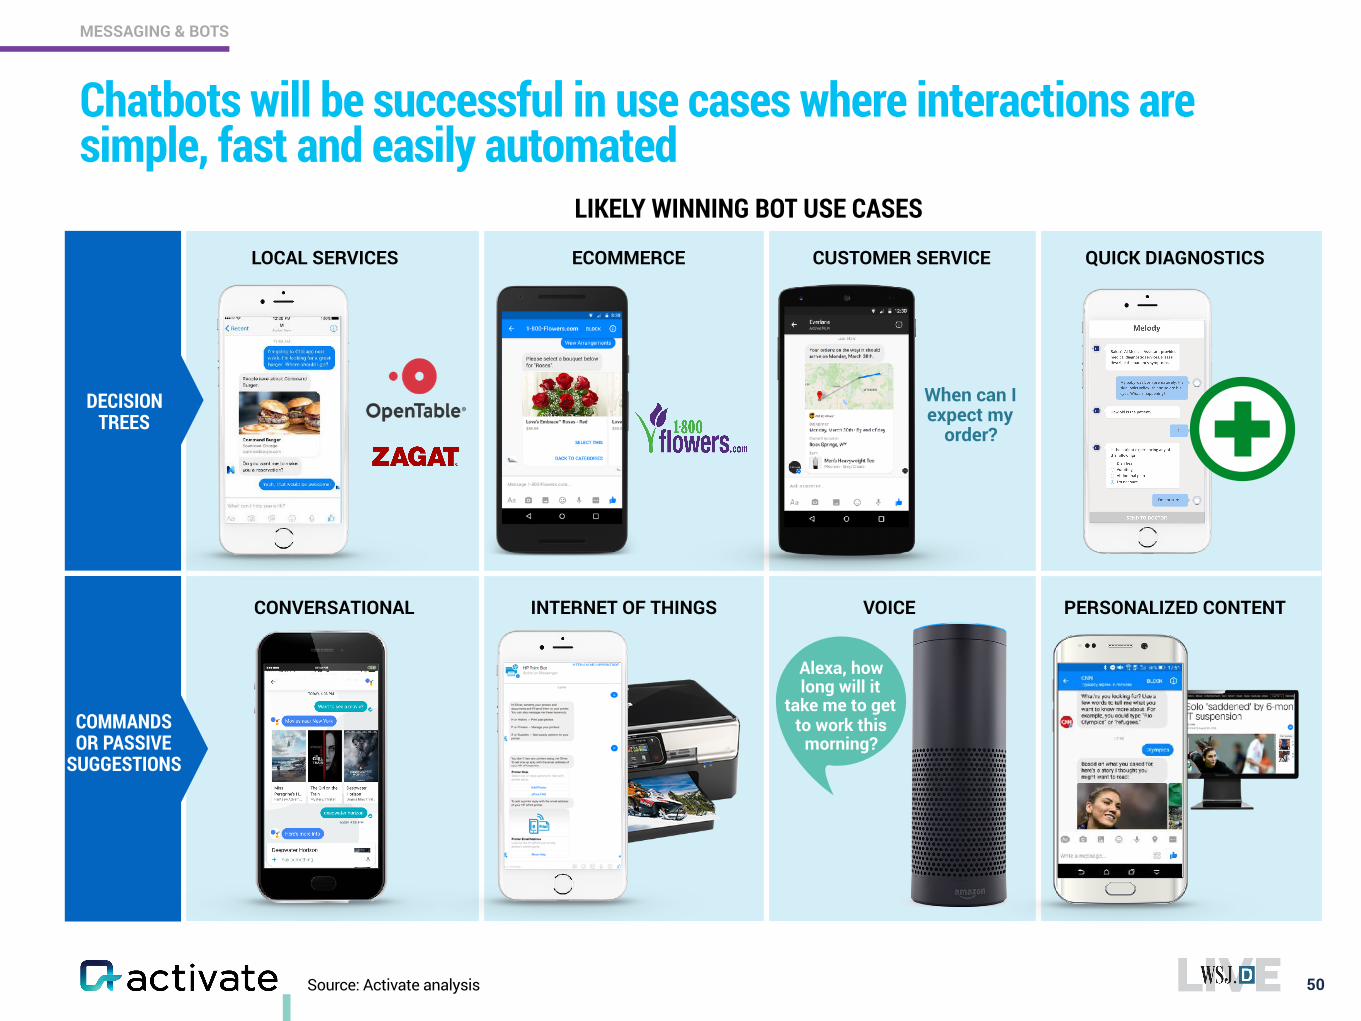
Chatbots will be successful in use cases where interactions are simple, fast and easily automated
50
MESSAGING & BOTS
INTERNET OF THINGSCONVERSATIONAL
LOCAL SERVICES
PERSONALIZED CONTENTVOICE
Alexa, how long will it
take me to get to work this
morning?
CUSTOMER SERVICE
When can I expect my
order?
QUICK DIAGNOSTICSECOMMERCE
LIKELY WINNING BOT USE CASES
DECISION TREES
COMMANDS OR PASSIVE
SUGGESTIONS
Sources: Activate analysis, Wired
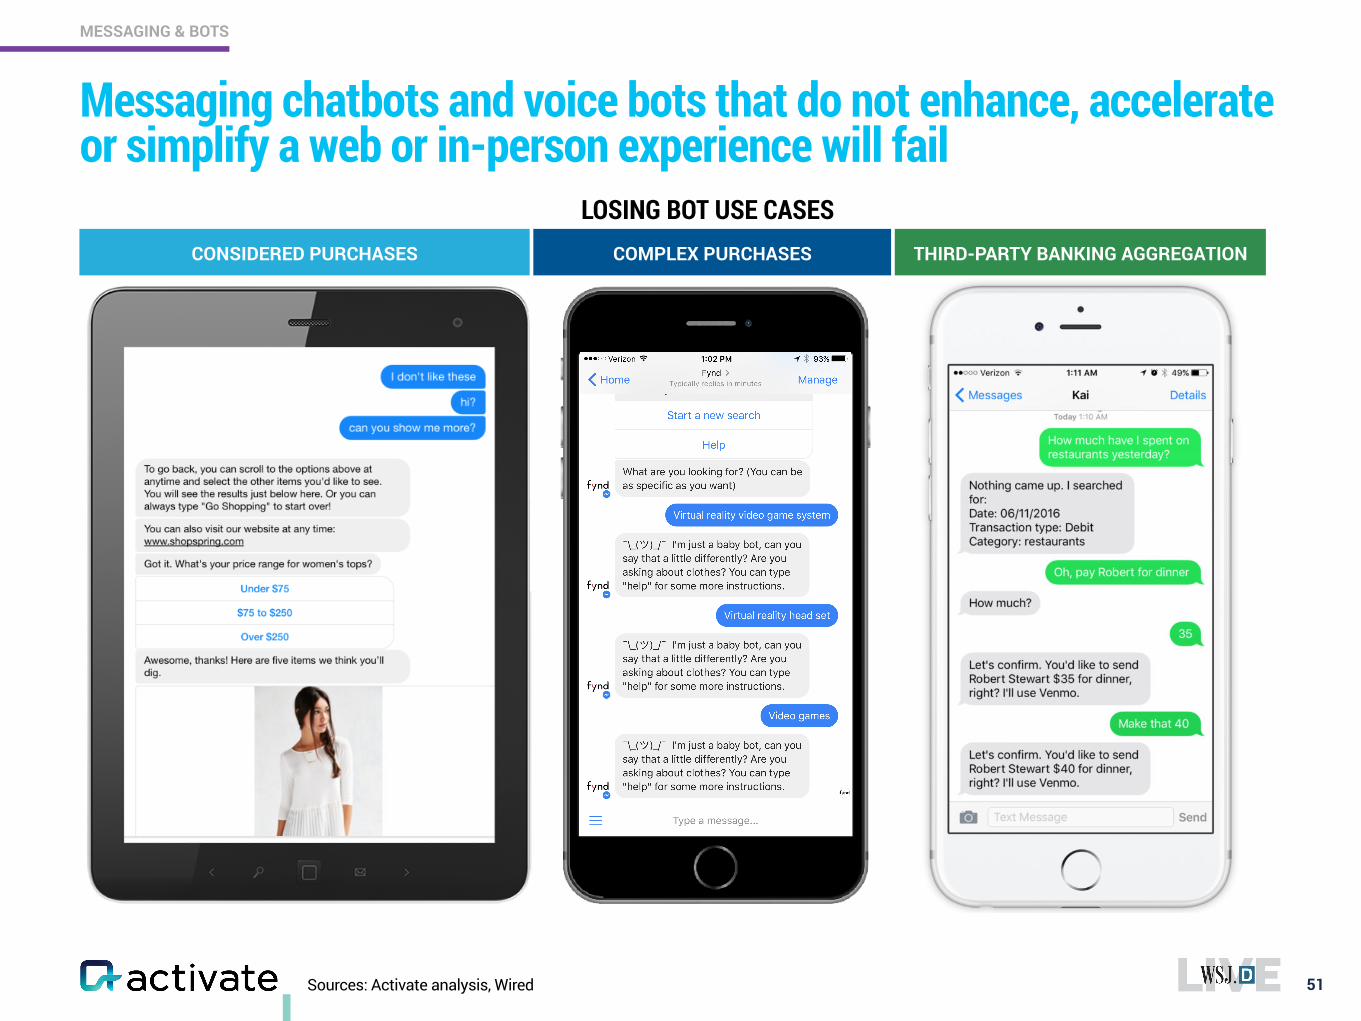
Messaging chatbots and voice bots that do not enhance, accelerate or simplify a web or in-person experience will fail
51
MESSAGING & BOTS
CONSIDERED PURCHASES COMPLEX PURCHASES THIRD-PARTY BANKING AGGREGATION
LOSING BOT USE CASES
Sources: Activate analysis, CB Insights, Company press releases, Company websites, CrunchBase, TechCrunch
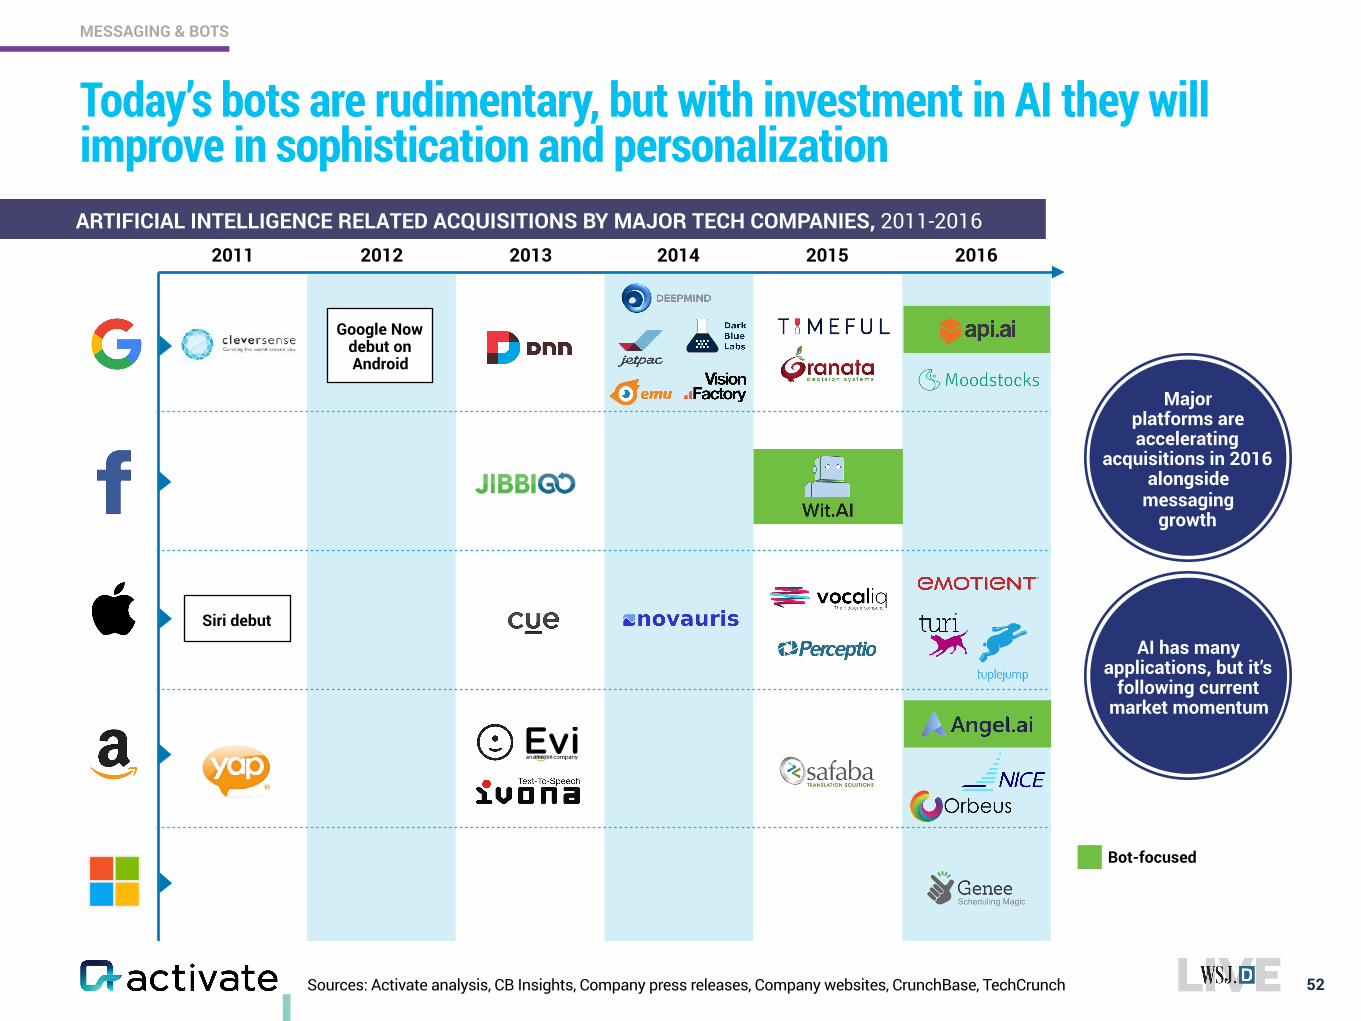
Today’s bots are rudimentary, but with investment in AI they will improve in sophistication and personalization
52
MESSAGING & BOTS
2011 2012 2013 2014 2015 2016
Siri debut
Google Now debut on Android
AI has many applications, but it’s
following current market momentum
Major platforms are accelerating
acquisitions in 2016 alongside
messaging growth
Bot-focused
ARTIFICIAL INTELLIGENCE RELATED ACQUISITIONS BY MAJOR TECH COMPANIES, 2011-2016
Source: Activate analysis
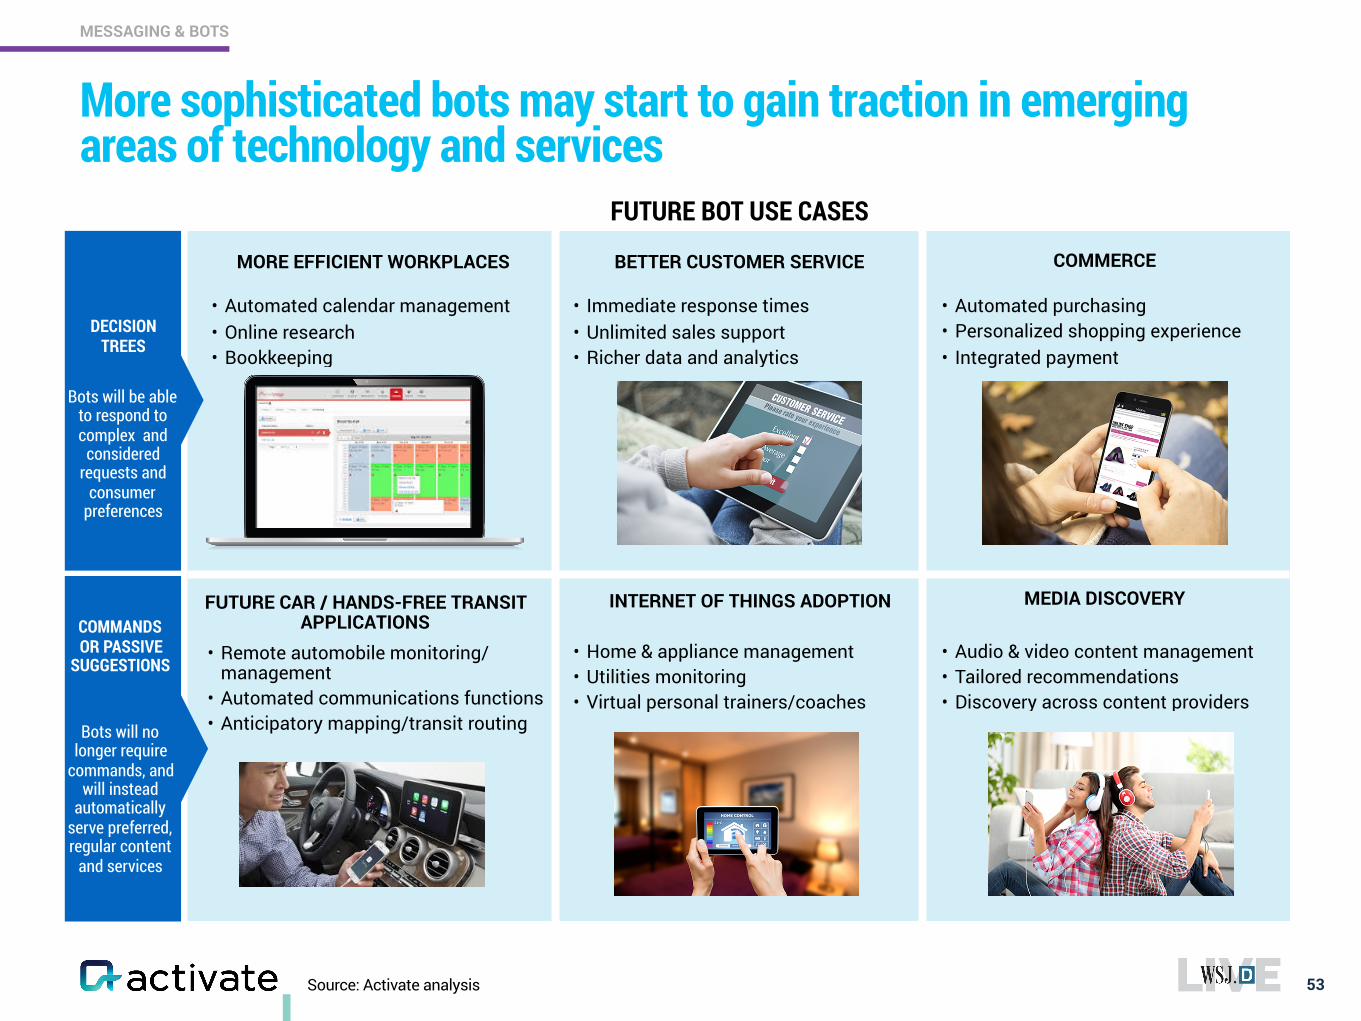
More sophisticated bots may start to gain traction in emerging areas of technology and services
53
MESSAGING & BOTS
FUTURE CAR / HANDS-FREE TRANSIT APPLICATIONS
• Remote automobile monitoring/management
• Automated communications functions • Anticipatory mapping/transit routing
MEDIA DISCOVERY
• Audio & video content management • Tailored recommendations • Discovery across content providers
BETTER CUSTOMER SERVICE
• Immediate response times • Unlimited sales support • Richer data and analytics
INTERNET OF THINGS ADOPTION
• Home & appliance management • Utilities monitoring • Virtual personal trainers/coaches
COMMERCE
• Automated purchasing • Personalized shopping experience • Integrated payment
MORE EFFICIENT WORKPLACES
• Automated calendar management • Online research • Bookkeeping
DECISION TREES
COMMANDS OR PASSIVE
SUGGESTIONS
FUTURE BOT USE CASES
Bots will no longer require
commands, and will instead
automatically serve preferred, regular content
and services
Bots will be able to respond to complex and
considered requests and
consumer preferences
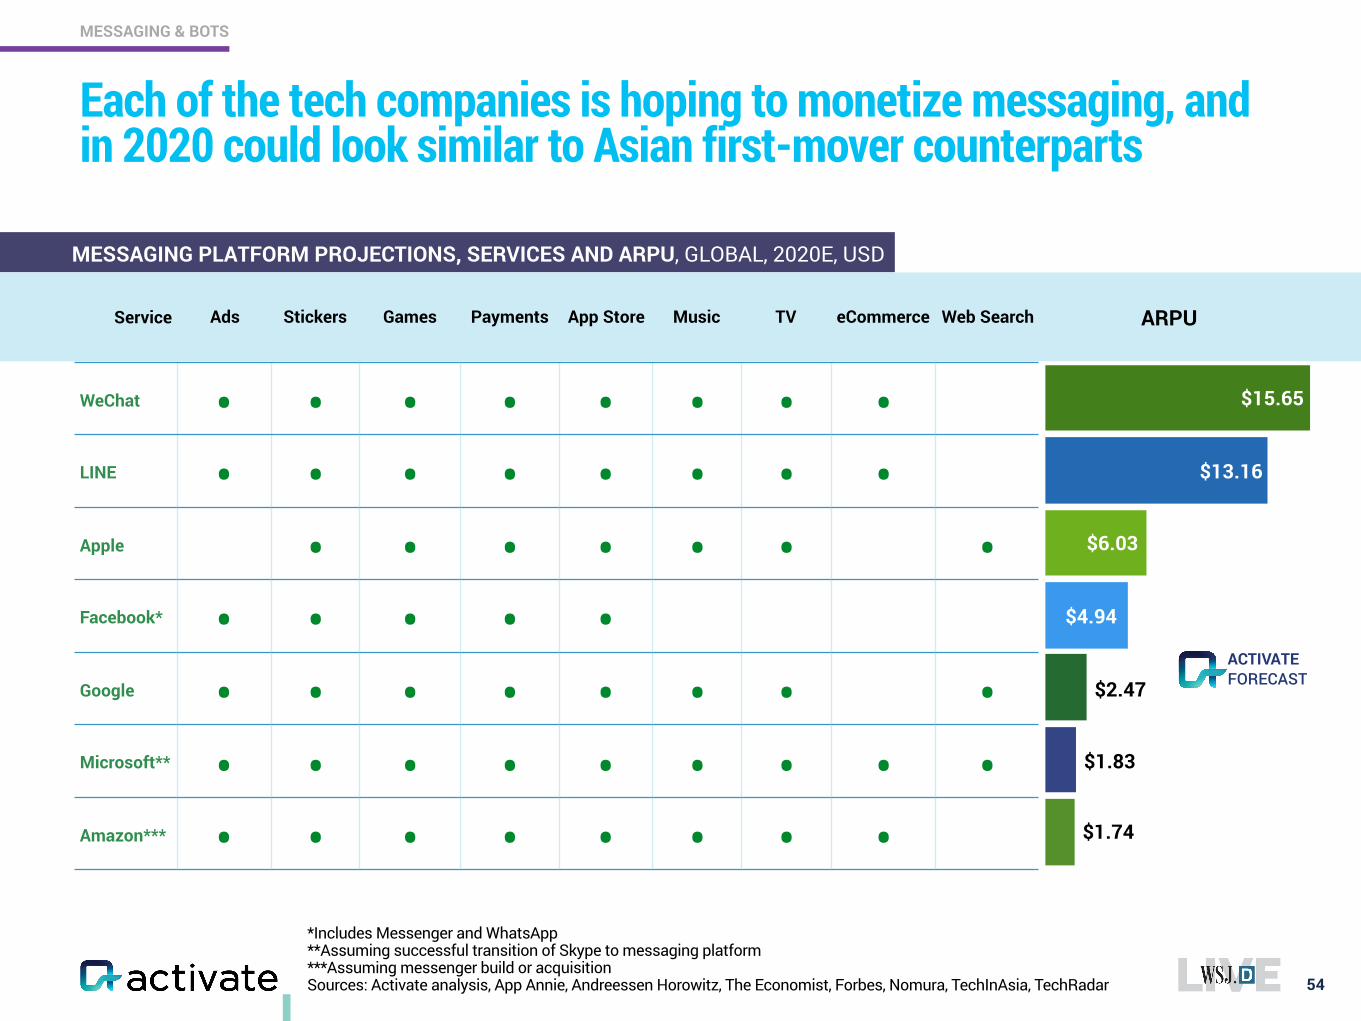
*Includes Messenger and WhatsApp **Assuming successful transition of Skype to messaging platform ***Assuming messenger build or acquisition Sources: Activate analysis, App Annie, Andreessen Horowitz, The Economist, Forbes, Nomura, TechInAsia, TechRadar
Each of the tech companies is hoping to monetize messaging, and in 2020 could look similar to Asian first-mover counterparts
54
MESSAGING & BOTS
MESSAGING PLATFORM PROJECTIONS, SERVICES AND ARPU, GLOBAL, 2020E, USD
ARPUService Ads Stickers Games Payments App Store Music TV eCommerce Web Search
WeChat • • • • • • • •LINE • • • • • • • •Apple • • • • • • •Facebook* • • • • •Google • • • • • • • •Microsoft** • • • • • • • • •Amazon*** • • • • • • • •
$15.65
$13.16
$6.03
$4.94
$2.47
$1.83
$1.74
FORECASTACTIVATE
Sources: Activate analysis, AdWeek, Line, Quartz, Tencent, Yahoo Finance
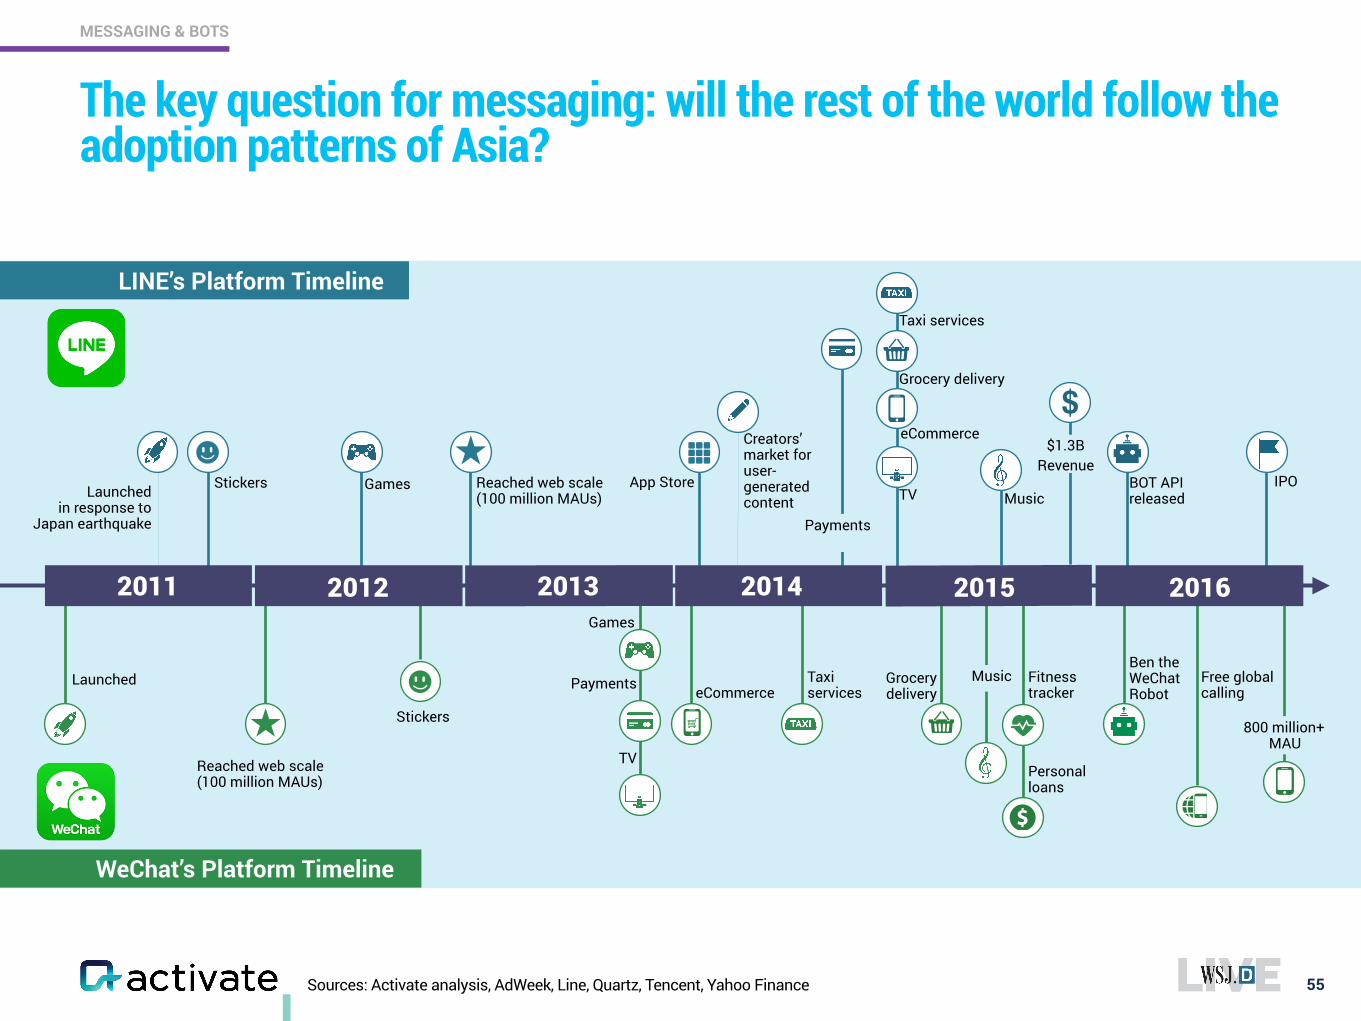
The key question for messaging: will the rest of the world follow the adoption patterns of Asia?
55
MESSAGING & BOTS
Free global calling
LINE’s Platform Timeline
WeChat’s Platform Timeline
Reached web scale(100 million MAUs)
App StoreLaunched in response to
Japan earthquake
Reached web scale (100 million MAUs)
Launched
Games
Stickers
Creators’ market for user-generated content
Taxi services
Fitness tracker
MusicGames
Grocery deliveryeCommerce
JUN JUN JAN 2011 2013 2015 2016
IPOBOT API released
2016
Ben the WeChat Robot
Music
Personal loans
Payments
TV
Taxi services
Grocery delivery
eCommerce
TV
800 million+ MAU
$1.3B Revenue
$
Stickers
2012 2014
Payments
Sources: Activate analysis, eMarketer, GlobalWebIndex, Medium, TechCrunch, TechinAsia, The Economist, We Are Social, World Bank
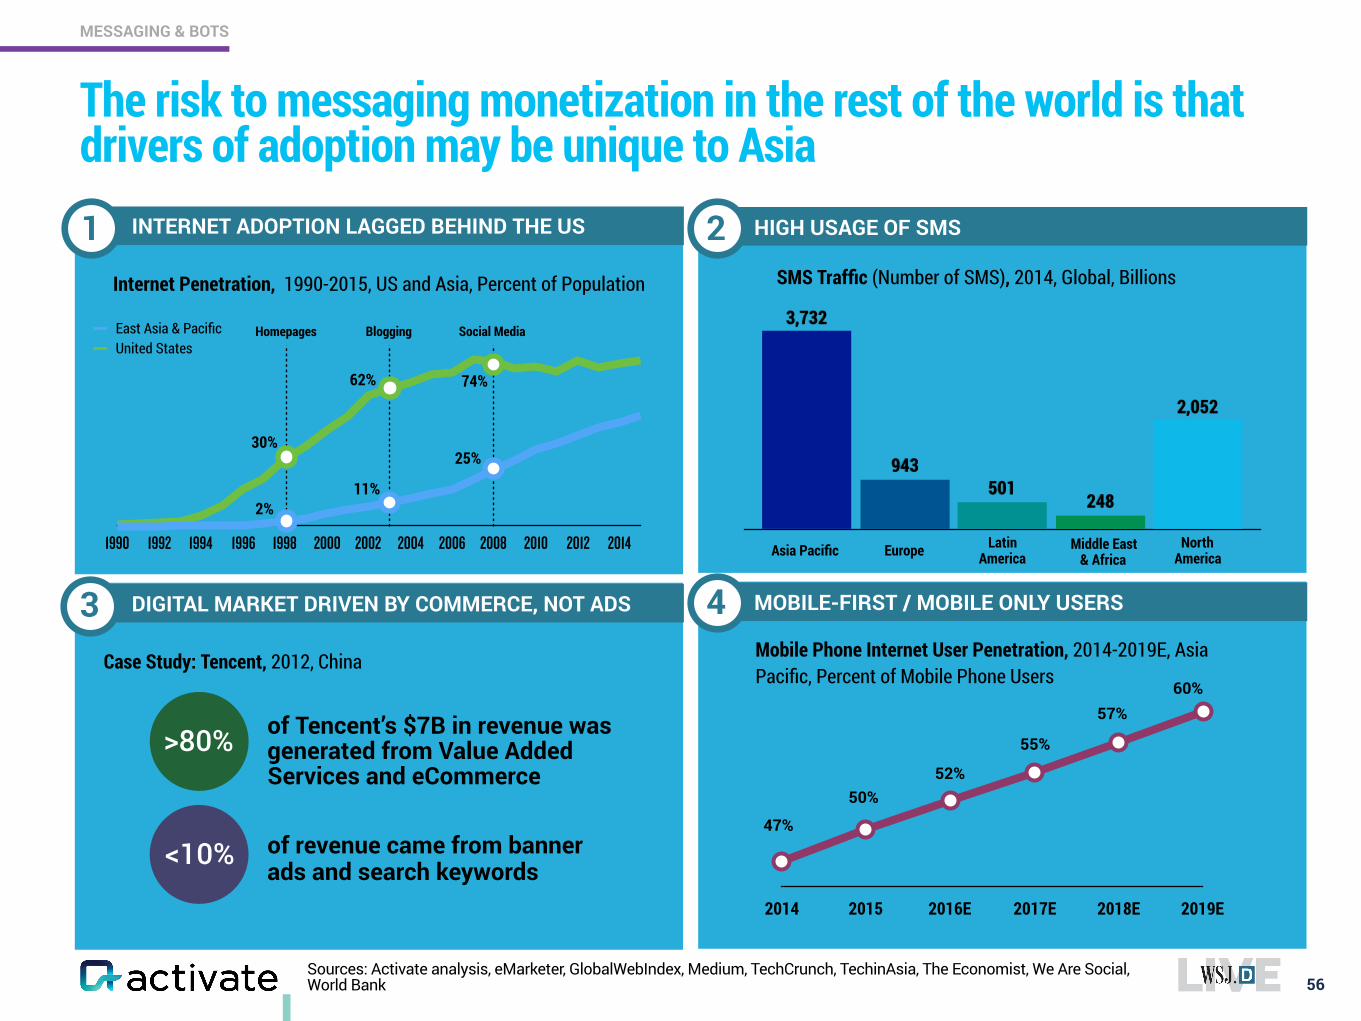
The risk to messaging monetization in the rest of the world is that drivers of adoption may be unique to Asia
56
MESSAGING & BOTS
1990 1992 1994 1996 1998 2000 2002 2004 2006 2008 2010 2012 2014
East Asia & PacificUnited States
Internet Penetration, 1990-2015, US and Asia, Percent of Population
INTERNET ADOPTION LAGGED BEHIND THE US HIGH USAGE OF SMS
DIGITAL MARKET DRIVEN BY COMMERCE, NOT ADS MOBILE-FIRST / MOBILE ONLY USERS
Homepages Blogging Social Media
30%
62% 74%
2%11%
25%
Case Study: Tencent, 2012, China
>80% of Tencent’s $7B in revenue was generated from Value Added Services and eCommerce
<10% of revenue came from banner ads and search keywords
SMS Traffic (Number of SMS), 2014, Global, Billions
1
3
2014 2015 2016E 2017E 2018E 2019E
47%
50%52%
55%
57%60%
Mobile Phone Internet User Penetration, 2014-2019E, Asia Pacific, Percent of Mobile Phone Users
2,052
248501
943
3,732
Asia Pacific Europe Latin America
Middle East & Africa
North America
2
3 4

Sources: Activate analysis, Quartz
For successful messaging monetization, services will need to address payment and eCommerce adoption in messaging
57
MESSAGING & BOTS
FACTORS DRIVING MESSAGING MONETIZATION SUCCESS IN ASIA
1
SMS POPULARITY
High adoption rates of both mobile and SMS in Asia and North America propelled messaging to be the dominant form of communication in
those regions
YES
2
STICKERS AND EMOJI
Visual messaging short-hand e.g.,
emoji, emoticons and stickers drives
messaging engagement by enabling quick
interactions
YES
3
MESSAGING PAYMENT ADOPTION
Messaging payment adoption in Asia has
been driven by cultural watershed moments
e.g., Q Coin and the Red Envelope phenomenon
with WeChat
NOT YET
4
MESSAGING ECOMMERCE
ADOPTION
Messaging commerce has translated into
success for shopping use cases in messaging
NOT YETTrue outside
of Asia?
*Note: Indexed against United States SMS costs, normalized for median household income & purchasing power parity 2015 Sources: Activate analysis, China Internet Network Information Center (CNNIC), eMarketer, Forbes, Gallup Global Data Insights, OECD, Twilio, U.S. Census Bureau, We Are Social, World Bank
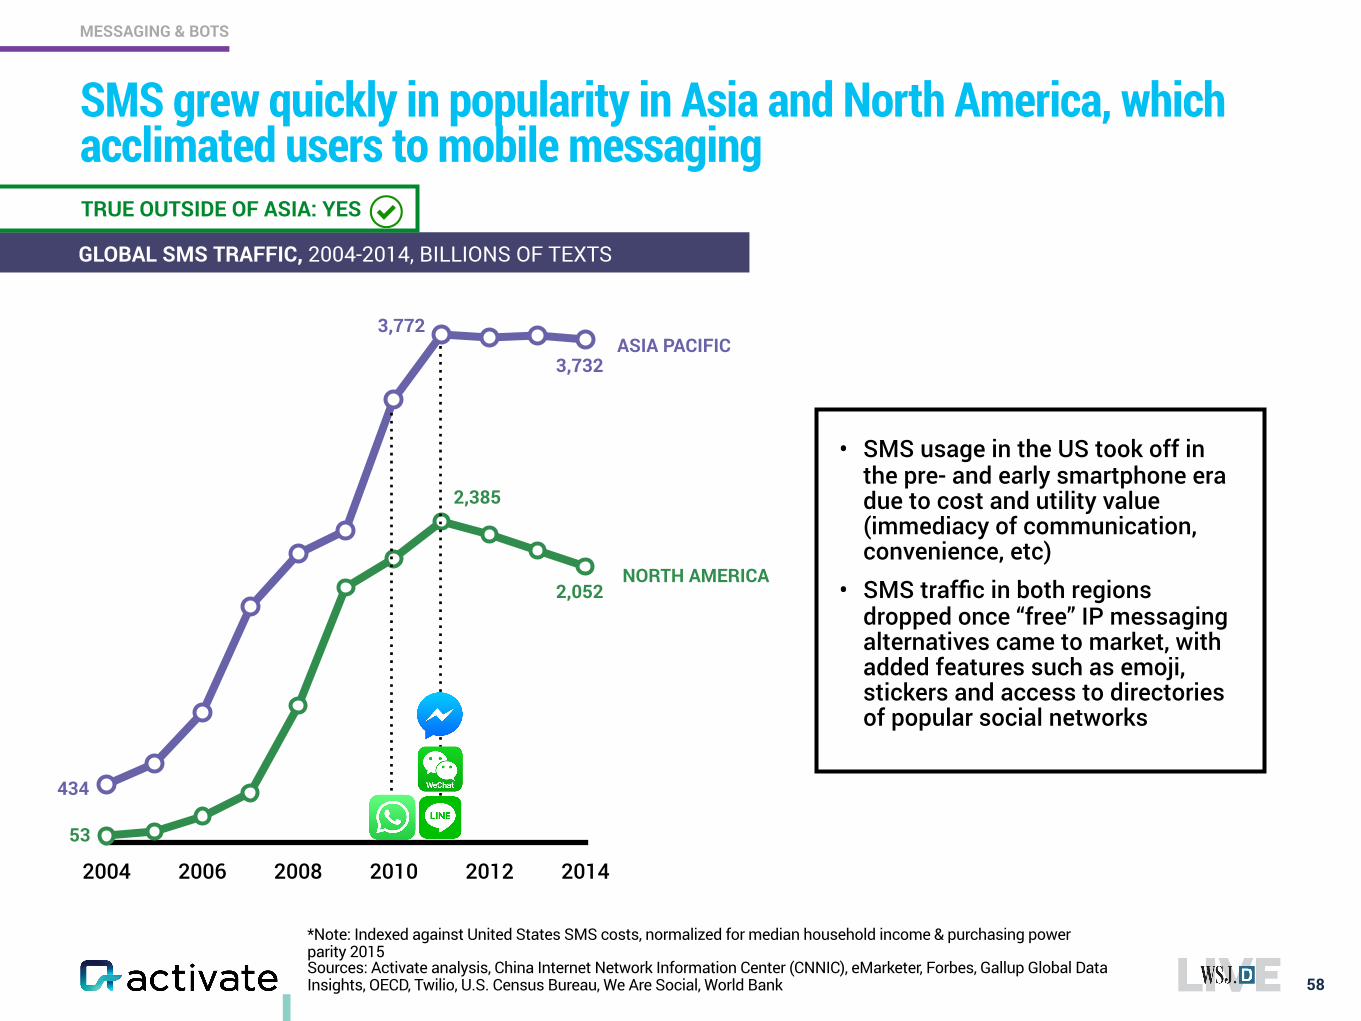
SMS grew quickly in popularity in Asia and North America, which acclimated users to mobile messaging
58
MESSAGING & BOTS
GLOBAL SMS TRAFFIC, 2004-2014, BILLIONS OF TEXTS
• SMS usage in the US took off in the pre- and early smartphone era due to cost and utility value (immediacy of communication, convenience, etc)
• SMS traffic in both regions dropped once “free” IP messaging alternatives came to market, with added features such as emoji, stickers and access to directories of popular social networks
2004 2006 2008 2010 2012 2014
NORTH AMERICA
ASIA PACIFIC
434
53
3,772
2,385
3,732
2,052
TRUE OUTSIDE OF ASIA: YES
Sources: Activate analysis, eMarketer, LINE SEC filing
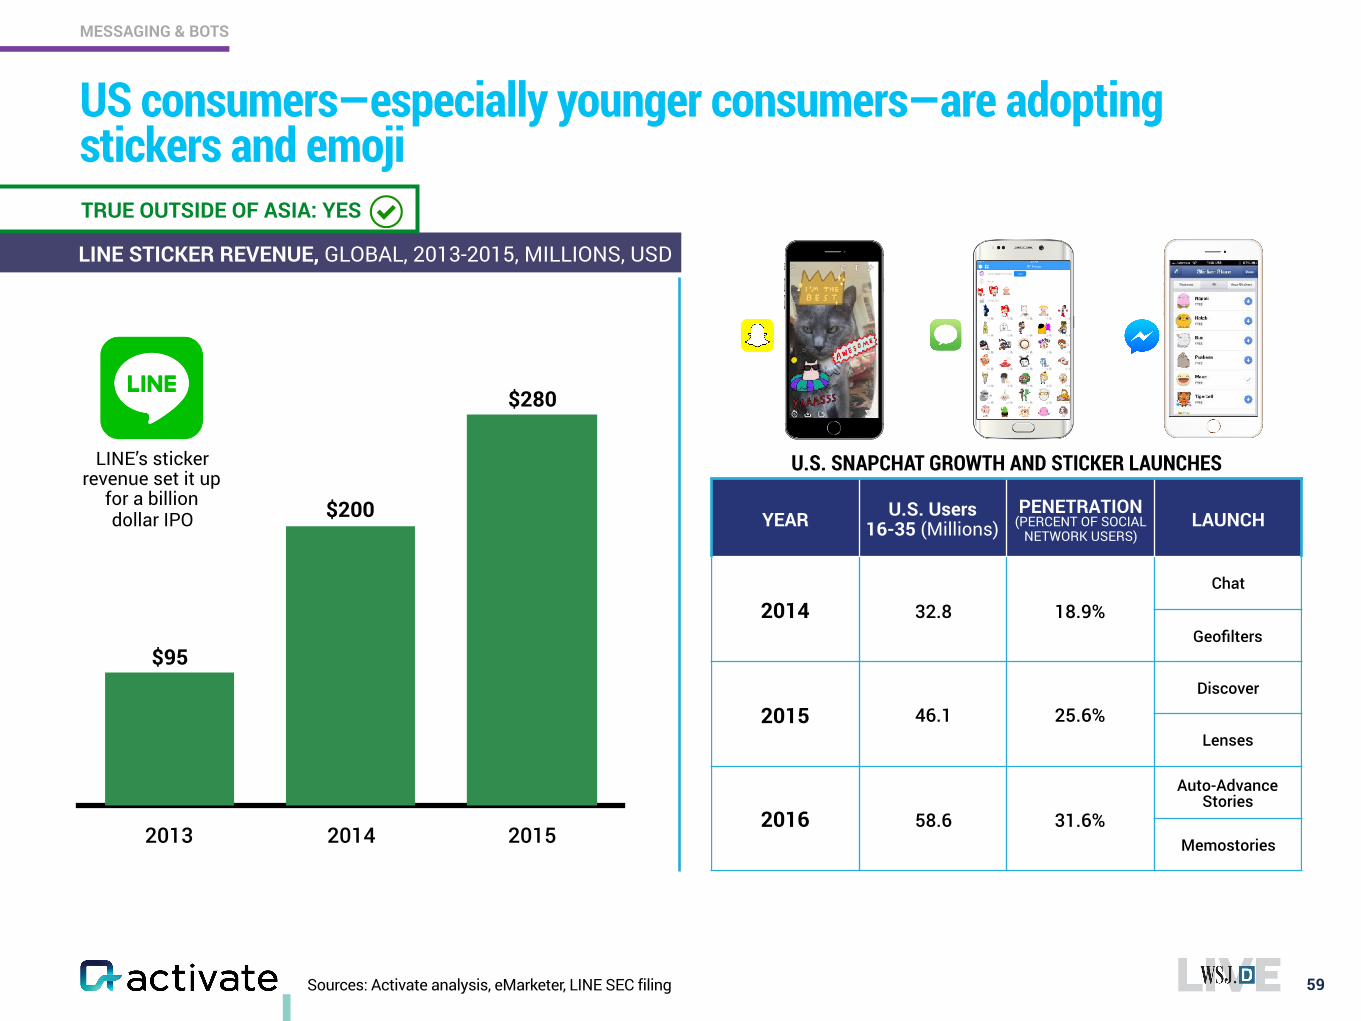
US consumers—especially younger consumers—are adopting stickers and emoji
59
MESSAGING & BOTS
2013 2014 2015
$280
$200
$95
LINE’s sticker revenue set it up
for a billion dollar IPO YEAR U.S. Users
16-35 (Millions)PENETRATION
(PERCENT OF SOCIAL NETWORK USERS)
LAUNCH
2014 32.8 18.9%Chat
Geofilters
2015 46.1 25.6%Discover
Lenses
2016 58.6 31.6%
Auto-Advance Stories
Memostories
U.S. SNAPCHAT GROWTH AND STICKER LAUNCHES
LINE STICKER REVENUE, GLOBAL, 2013-2015, MILLIONS, USD
TRUE OUTSIDE OF ASIA: YES
Sources: Activate analysis, Jefferies, Quartz, WeChat, Wall Street Journal
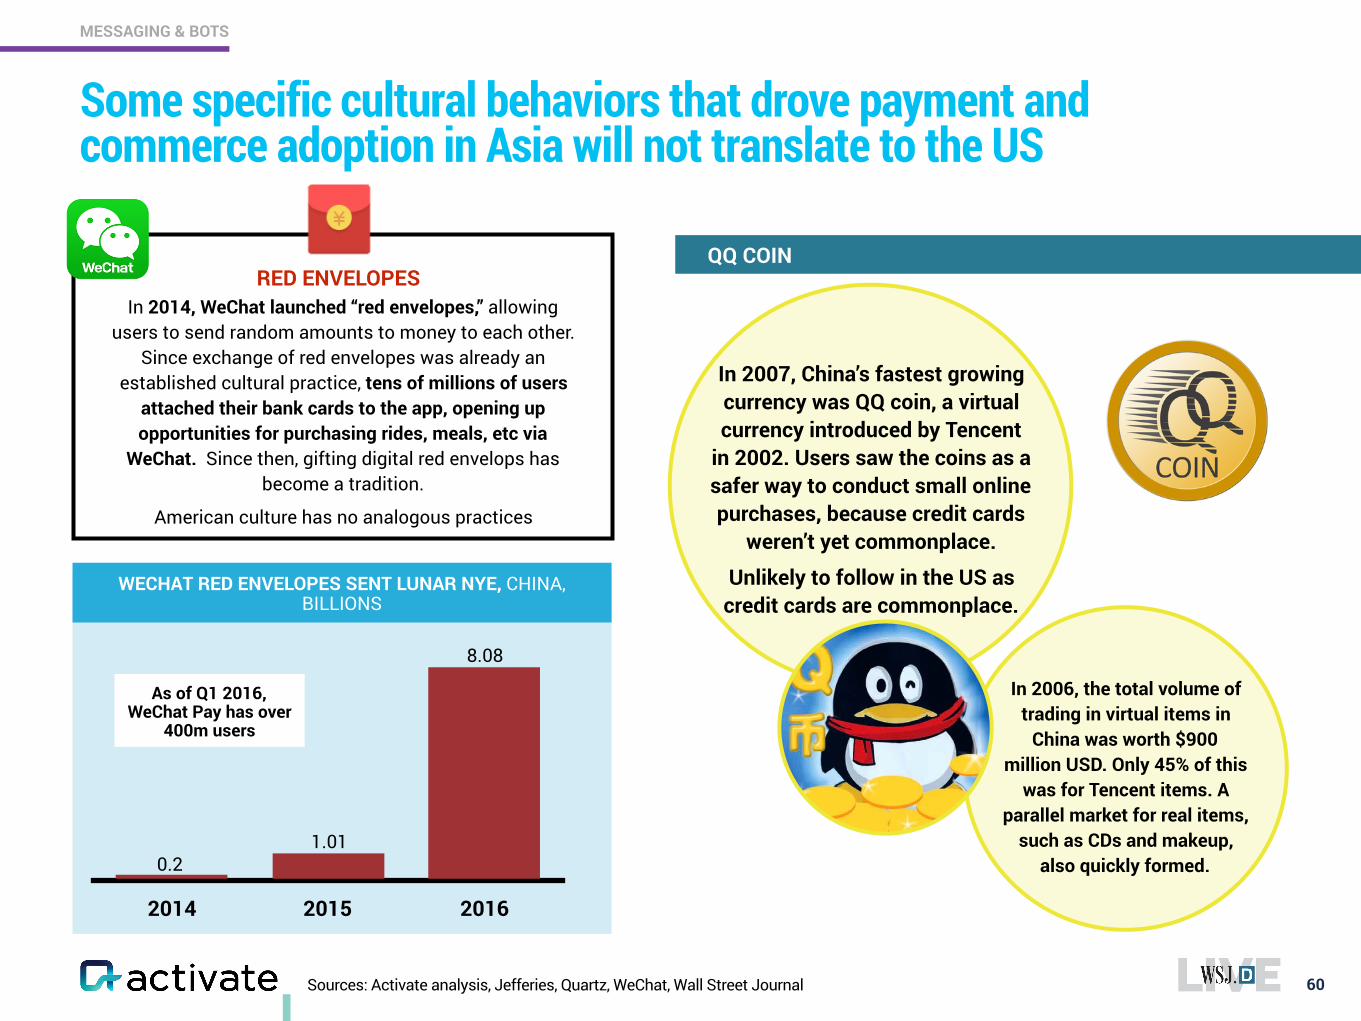
Some specific cultural behaviors that drove payment and commerce adoption in Asia will not translate to the US
60
MESSAGING & BOTS
In 2007, China’s fastest growing currency was QQ coin, a virtual currency introduced by Tencent
in 2002. Users saw the coins as a safer way to conduct small online purchases, because credit cards
weren’t yet commonplace.
Unlikely to follow in the US as credit cards are commonplace.
In 2006, the total volume of trading in virtual items in
China was worth $900 million USD. Only 45% of this
was for Tencent items. A parallel market for real items,
such as CDs and makeup, also quickly formed.
2014 2015 2016
0.2
WECHAT RED ENVELOPES SENT LUNAR NYE, CHINA, BILLIONS
1.01
8.08
As of Q1 2016, WeChat Pay has over
400m users
In 2014, WeChat launched “red envelopes,” allowing users to send random amounts to money to each other.
Since exchange of red envelopes was already an established cultural practice, tens of millions of users
attached their bank cards to the app, opening up opportunities for purchasing rides, meals, etc via
WeChat. Since then, gifting digital red envelops has become a tradition.
American culture has no analogous practices
RED ENVELOPESQQ COIN
Sources: Activate analysis, Accenture, eMarketer
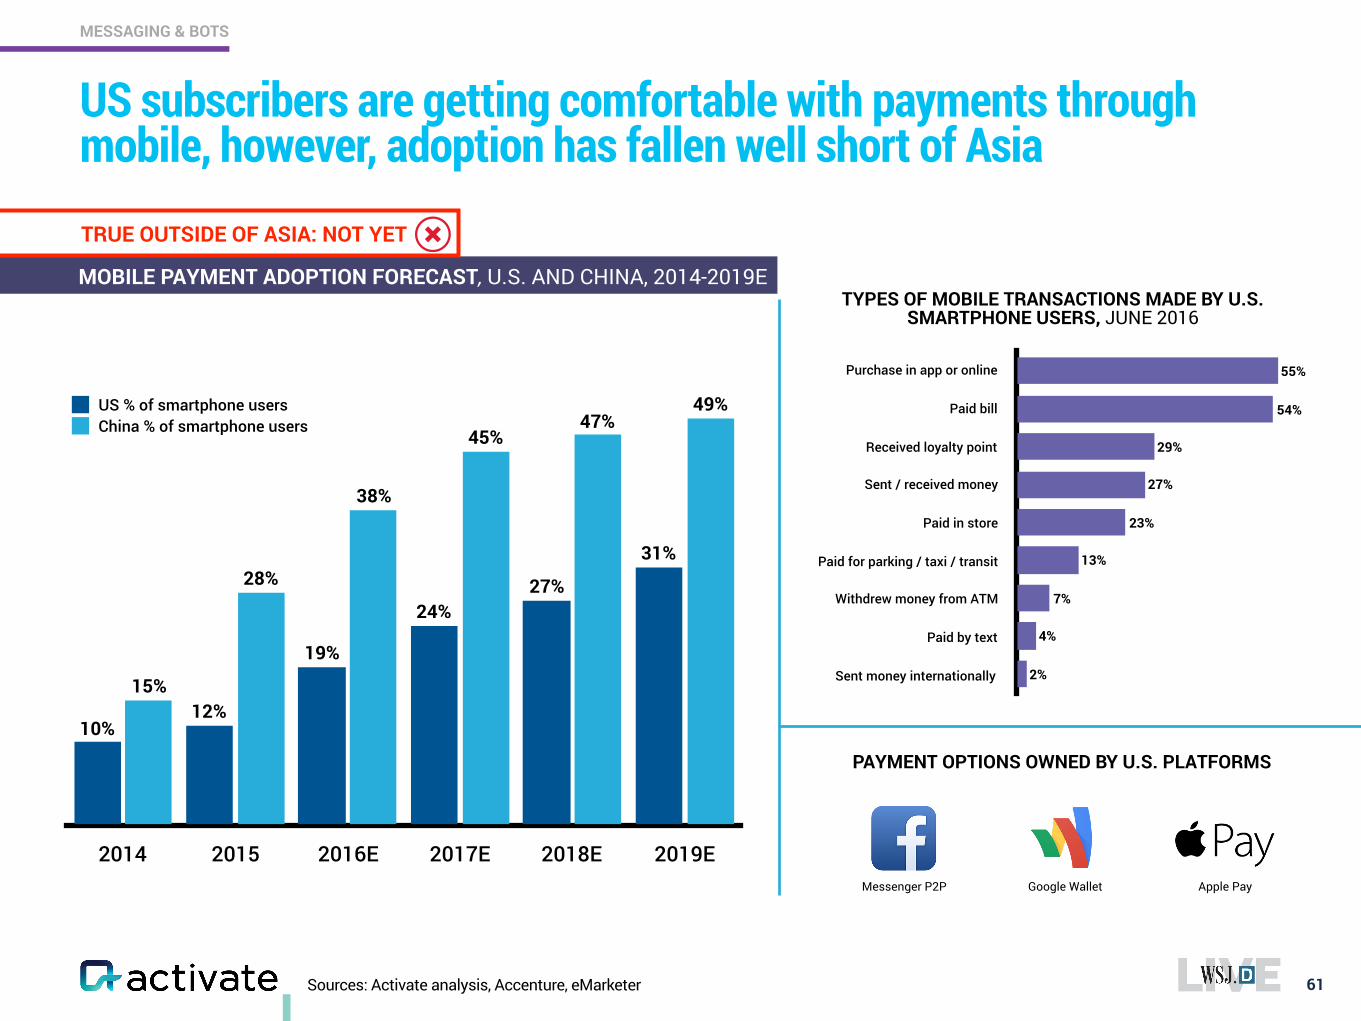
US subscribers are getting comfortable with payments through mobile, however, adoption has fallen well short of Asia
61
MESSAGING & BOTS
2014 2015 2016E 2017E 2018E 2019E
49%47%
45%
38%
28%
15%
31%
27%24%
19%
12%10%
US % of smartphone usersChina % of smartphone users
TYPES OF MOBILE TRANSACTIONS MADE BY U.S. SMARTPHONE USERS, JUNE 2016
Purchase in app or online
Paid bill
Received loyalty point
Sent / received money
Paid in store
Paid for parking / taxi / transit
Withdrew money from ATM
Paid by text
Sent money internationally 2%
4%
7%
13%
23%
27%
29%
54%
55%
PAYMENT OPTIONS OWNED BY U.S. PLATFORMS
Apple PayGoogle WalletMessenger P2P
MOBILE PAYMENT ADOPTION FORECAST, U.S. AND CHINA, 2014-2019E
TRUE OUTSIDE OF ASIA: NOT YET
Sources: Activate analysis, TechCrunch, TechinAsia
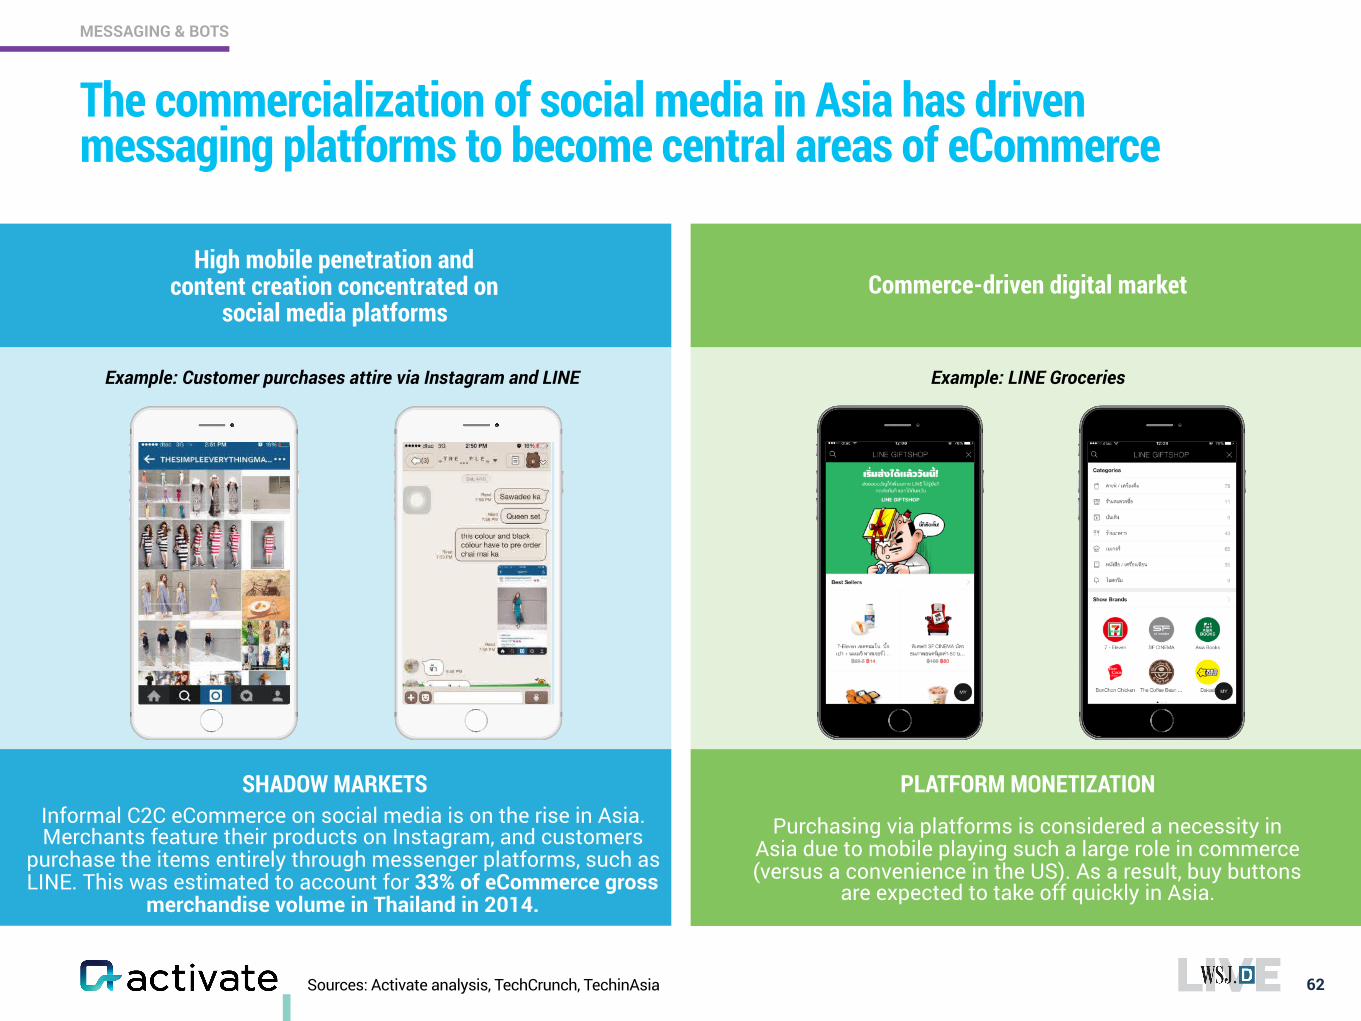
The commercialization of social media in Asia has driven messaging platforms to become central areas of eCommerce
62
MESSAGING & BOTS
Purchasing via platforms is considered a necessity in Asia due to mobile playing such a large role in commerce (versus a convenience in the US). As a result, buy buttons
are expected to take off quickly in Asia.
Informal C2C eCommerce on social media is on the rise in Asia. Merchants feature their products on Instagram, and customers
purchase the items entirely through messenger platforms, such as LINE. This was estimated to account for 33% of eCommerce gross
merchandise volume in Thailand in 2014.
High mobile penetration and content creation concentrated on
social media platforms
SHADOW MARKETS PLATFORM MONETIZATION
Commerce-driven digital market
Example: LINE GroceriesExample: Customer purchases attire via Instagram and LINE
Sources: Activate analysis, Activate 2016 Consumer Tech & Media Research Study (n=1,003), Critero State of Mobile Quarterly Reports, Gartner, Goldman Sachs
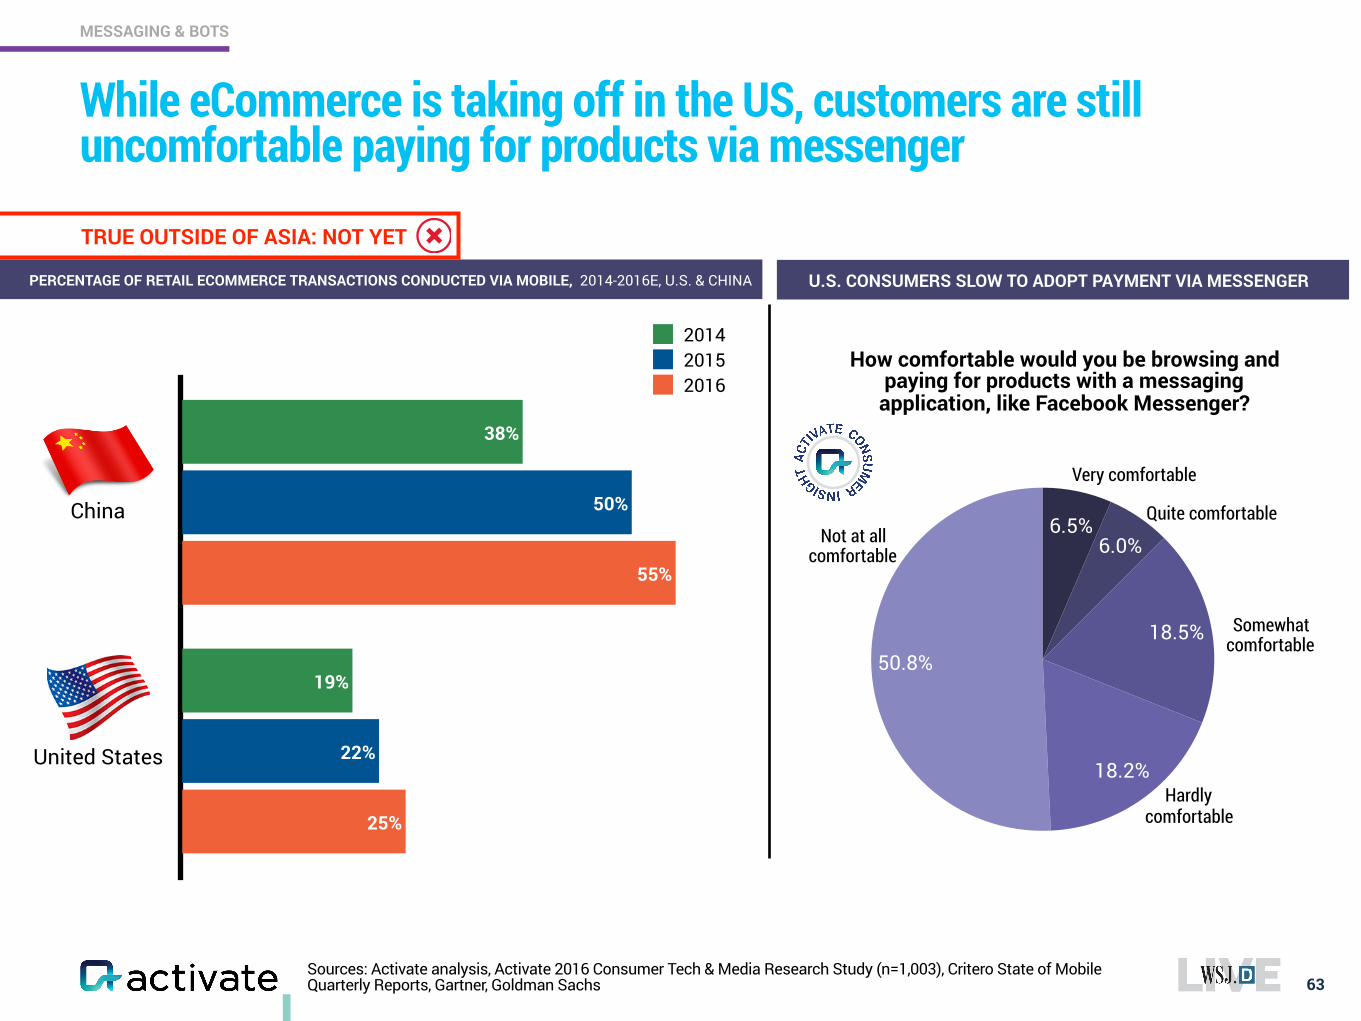
While eCommerce is taking off in the US, customers are still uncomfortable paying for products via messenger
63
MESSAGING & BOTS
TRUE OUTSIDE OF ASIA: NOT YET
PERCENTAGE OF RETAIL ECOMMERCE TRANSACTIONS CONDUCTED VIA MOBILE, 2014-2016E, U.S. & CHINA
25%
55%
22%
50%
19%
38%
201420152016
China
United States
50.8%
18.2%
18.5%
6.0%6.5%
How comfortable would you be browsing and paying for products with a messaging
application, like Facebook Messenger?
Very comfortable
Quite comfortable
Somewhat comfortable
Hardly comfortable
Not at all comfortable
U.S. CONSUMERS SLOW TO ADOPT PAYMENT VIA MESSENGER
64www.activate.com
The 9 Most Important Insights for Tech and Media in 2017
Super-serve the Super-users and Chase the Attention Unicorns
Subscriptions will Feed the World (or at least Internet and Media Businesses)
Learn to Live with the Discovery Oligopoly
The Bot Battles are about Winning the Great Messaging War
eSports is the Next Tech Phenomenon
You Already Know the New Winners in Pay TV
Video Streaming: The Bundle is the Future
Audio: Smart Speakers, Gray Music
Post-Household America: A New Era of Users
Sources: Activate analysis, Activate 2016 Consumer Tech & Media Research Study (n=4,000), Newzoo, Nielsen, SuperData Research
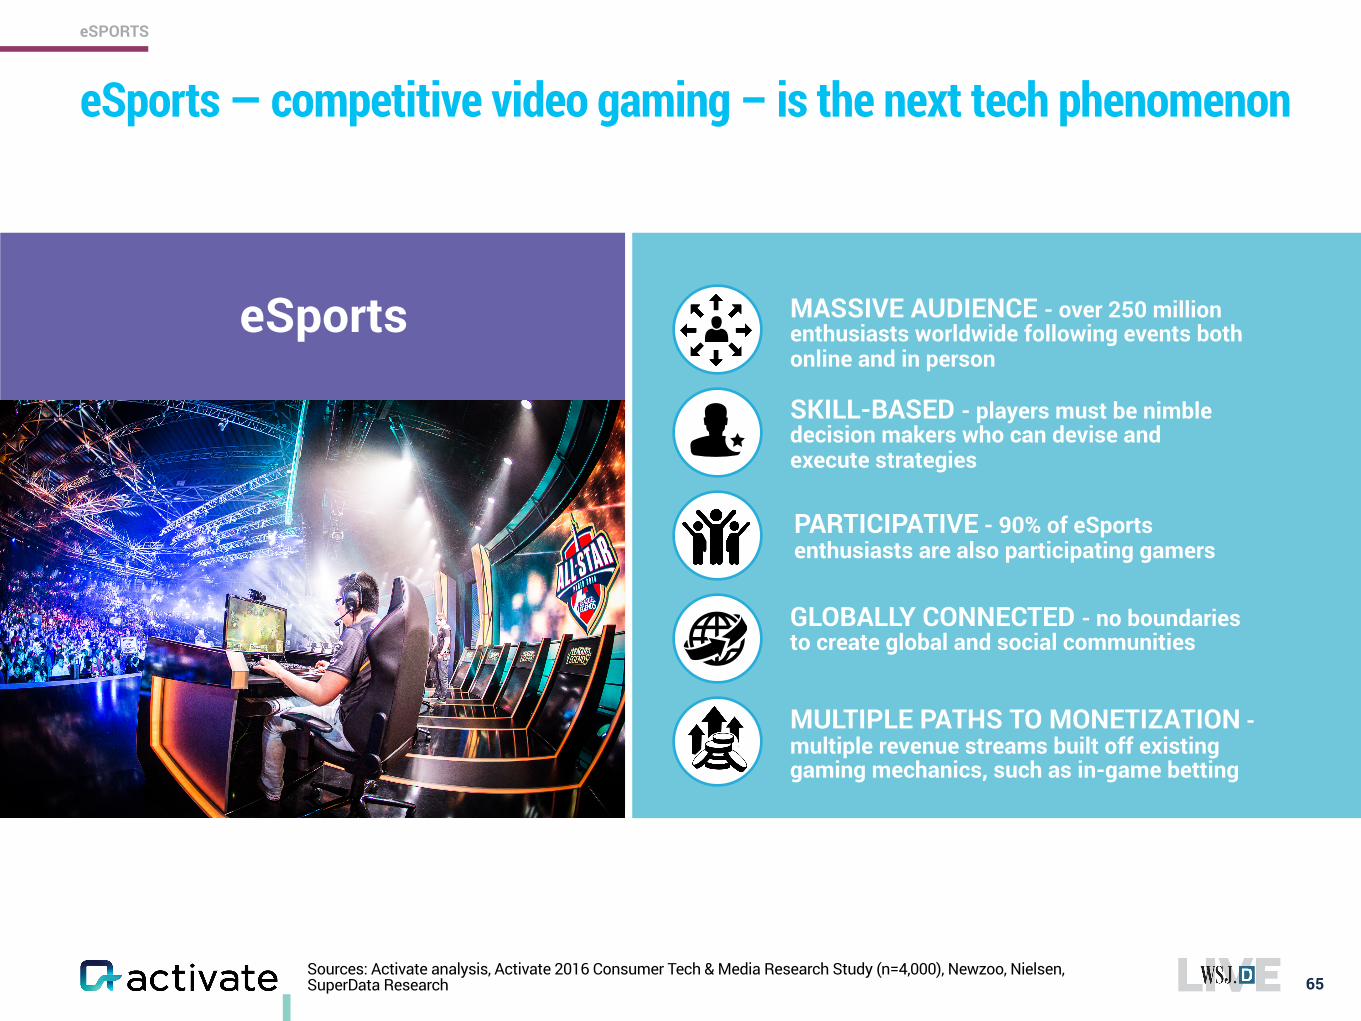
eSports — competitive video gaming – is the next tech phenomenon
65
eSPORTS
eSports
SKILL-BASED - players must be nimble decision makers who can devise and execute strategies
GLOBALLY CONNECTED - no boundaries to create global and social communities
PARTICIPATIVE - 90% of eSports enthusiasts are also participating gamers
MULTIPLE PATHS TO MONETIZATION - multiple revenue streams built off existing gaming mechanics, such as in-game betting
MASSIVE AUDIENCE - over 250 million enthusiasts worldwide following events both online and in person
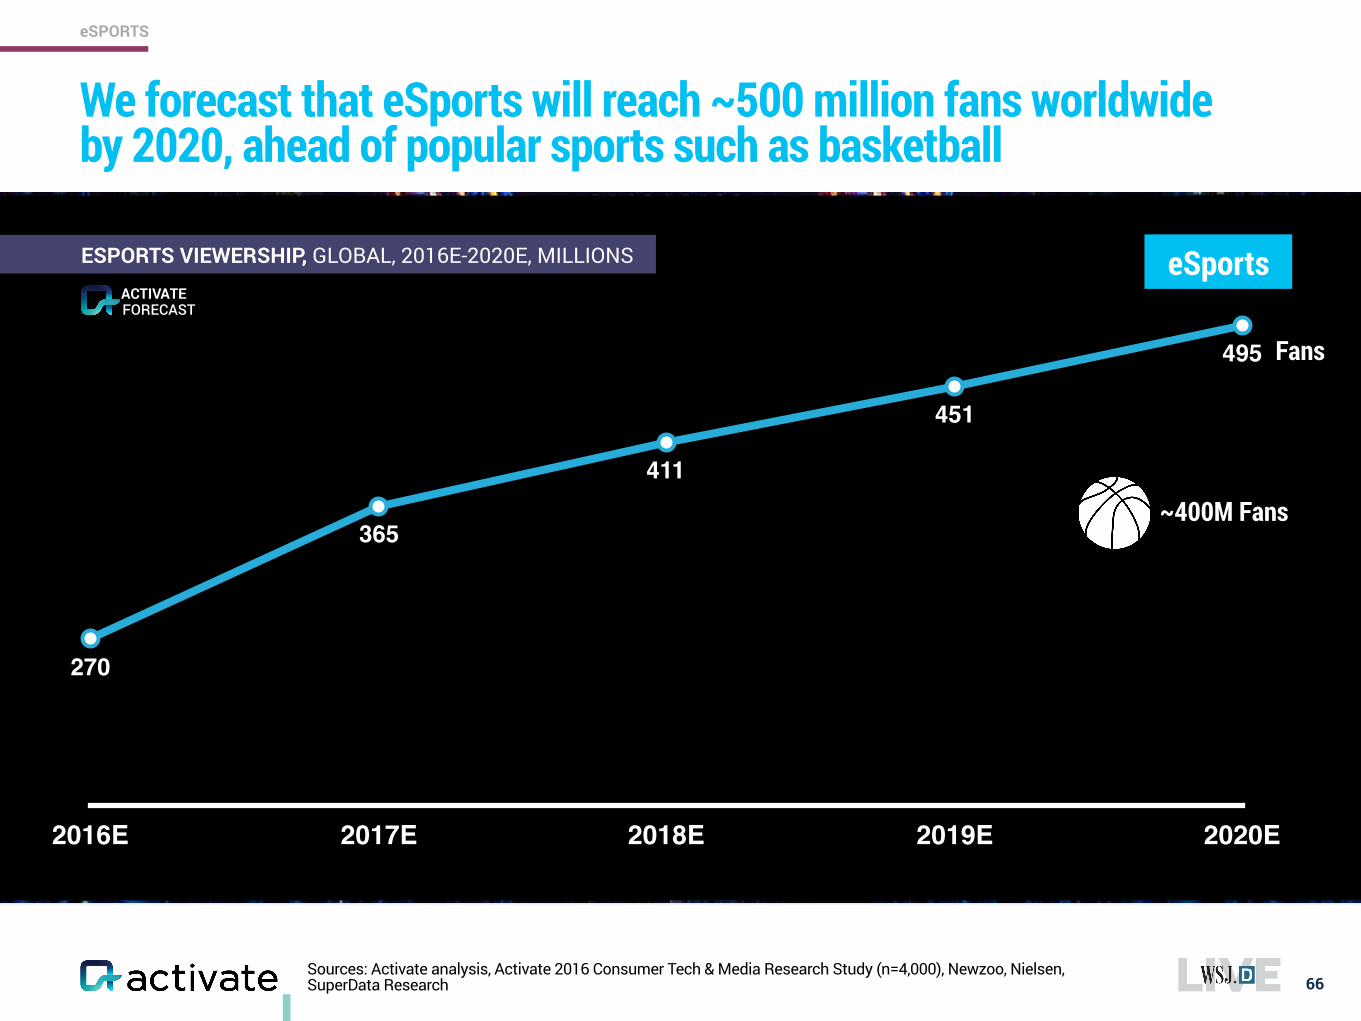
We forecast that eSports will reach ~500 million fans worldwide by 2020, ahead of popular sports such as basketball
66
eSPORTS
2016E 2017E 2018E 2019E 2020E
270
365
411
451
495
ESPORTS VIEWERSHIP, GLOBAL, 2016E-2020E, MILLIONS eSports
~400M Fans
Sources: Activate analysis, Activate 2016 Consumer Tech & Media Research Study (n=4,000), Newzoo, Nielsen, SuperData Research
Fans
FORECASTACTIVATE
67
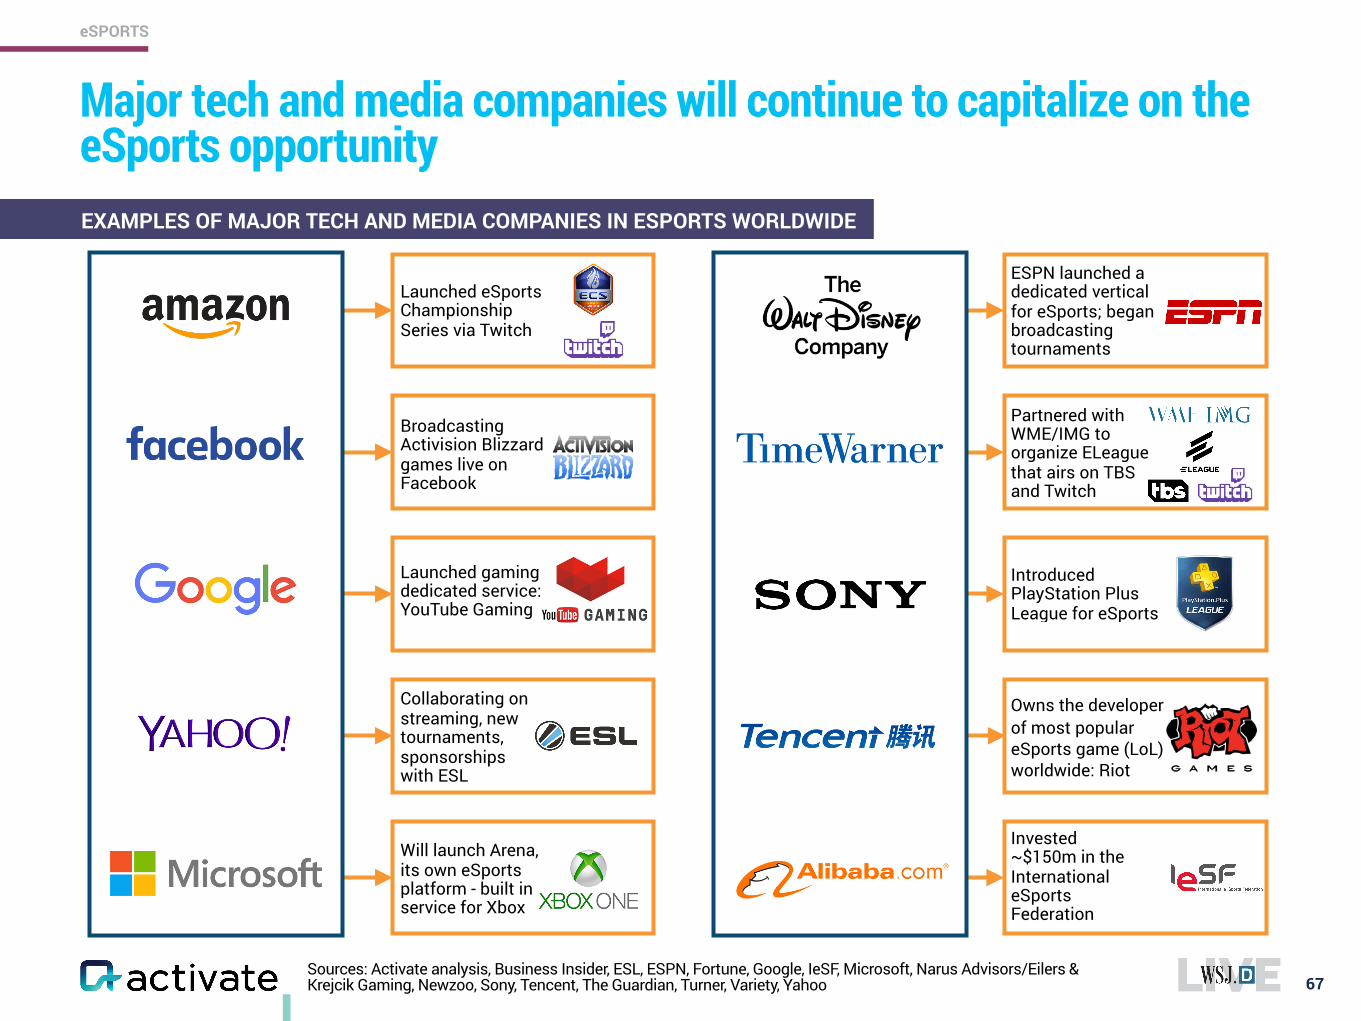
Major tech and media companies will continue to capitalize on the eSports opportunityEXAMPLES OF MAJOR TECH AND MEDIA COMPANIES IN ESPORTS WORLDWIDE
Sources: Activate analysis, Business Insider, ESL, ESPN, Fortune, Google, IeSF, Microsoft, Narus Advisors/Eilers & Krejcik Gaming, Newzoo, Sony, Tencent, The Guardian, Turner, Variety, Yahoo
eSPORTS
Launched eSports Championship Series via Twitch
Launched gaming dedicated service: YouTube Gaming
Broadcasting Activision Blizzard games live on Facebook
Collaborating on streaming, new tournaments, sponsorships with ESL
Will launch Arena, its own eSports platform - built in service for Xbox
Introduced PlayStation Plus League for eSports
Partnered with WME/IMG to organize ELeague that airs on TBS and Twitch
Invested ~$150m in the International eSports Federation
Owns the developer of most popular eSports game (LoL) worldwide: Riot
ESPN launched a dedicated vertical for eSports; began broadcasting tournaments
68
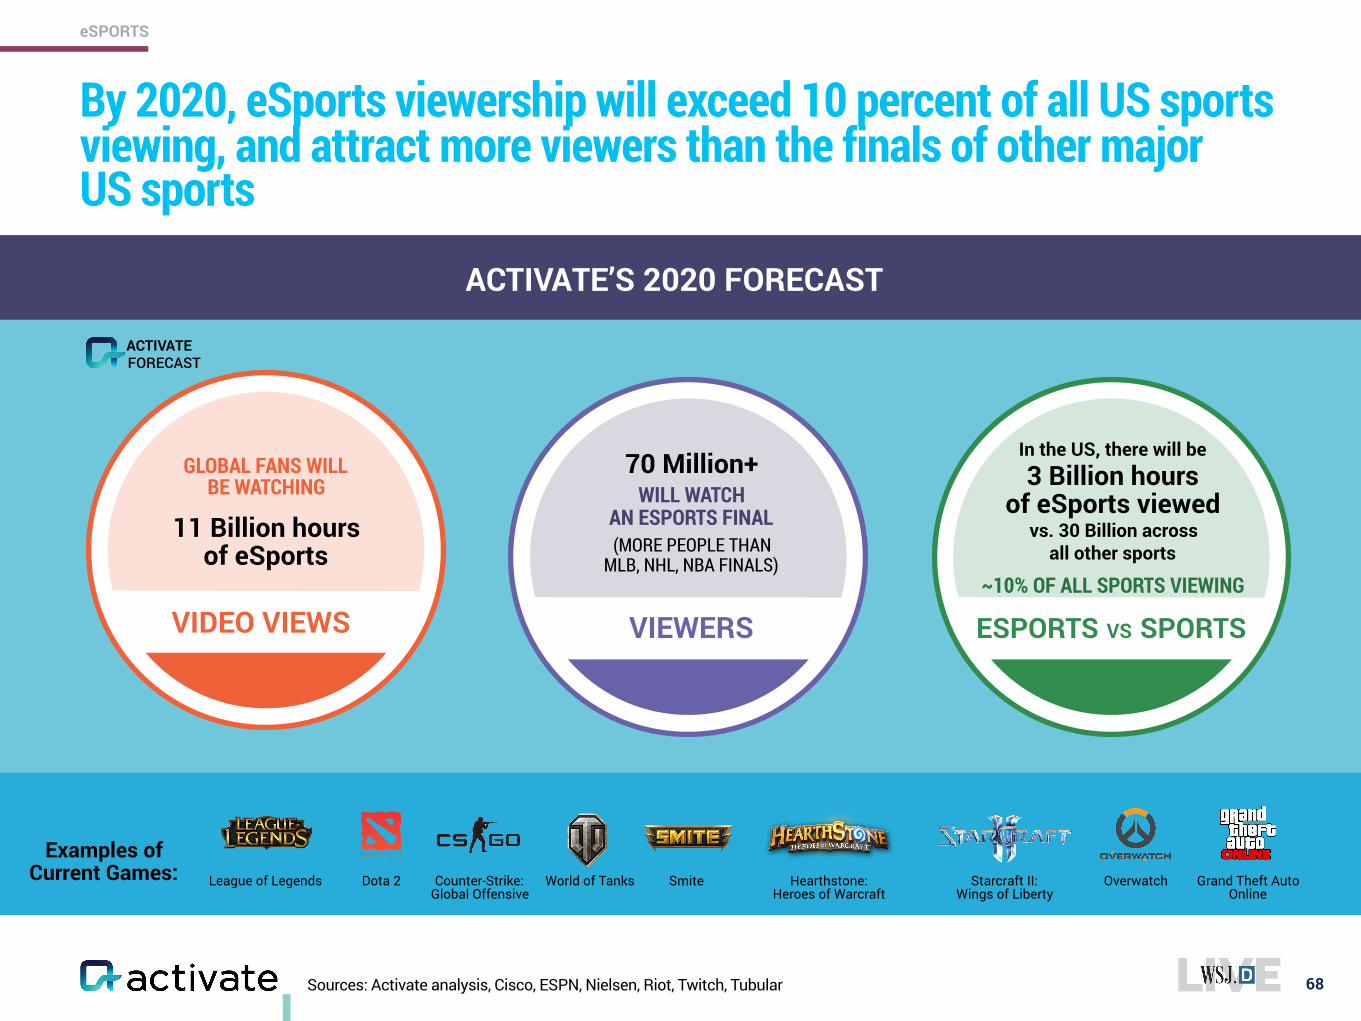
By 2020, eSports viewership will exceed 10 percent of all US sports viewing, and attract more viewers than the finals of other major US sports
Examples of Current Games:
ACTIVATE’S 2020 FORECAST
League of Legends Dota 2 Counter-Strike: Global Offensive
World of Tanks Smite Hearthstone: Heroes of Warcraft
Starcraft II: Wings of Liberty
Overwatch Grand Theft Auto Online
Sources: Activate analysis, Cisco, ESPN, Nielsen, Riot, Twitch, Tubular
VIDEO VIEWS
GLOBAL FANS WILL BE WATCHING
11 Billion hoursof eSports
VIEWERS
70 Million+ WILL WATCH
AN ESPORTS FINAL (MORE PEOPLE THAN
MLB, NHL, NBA FINALS)
ESPORTS VS SPORTS
In the US, there will be 3 Billion hours
of eSports viewed vs. 30 Billion across
all other sports
~10% OF ALL SPORTS VIEWING
eSPORTS
FORECASTACTIVATE
69
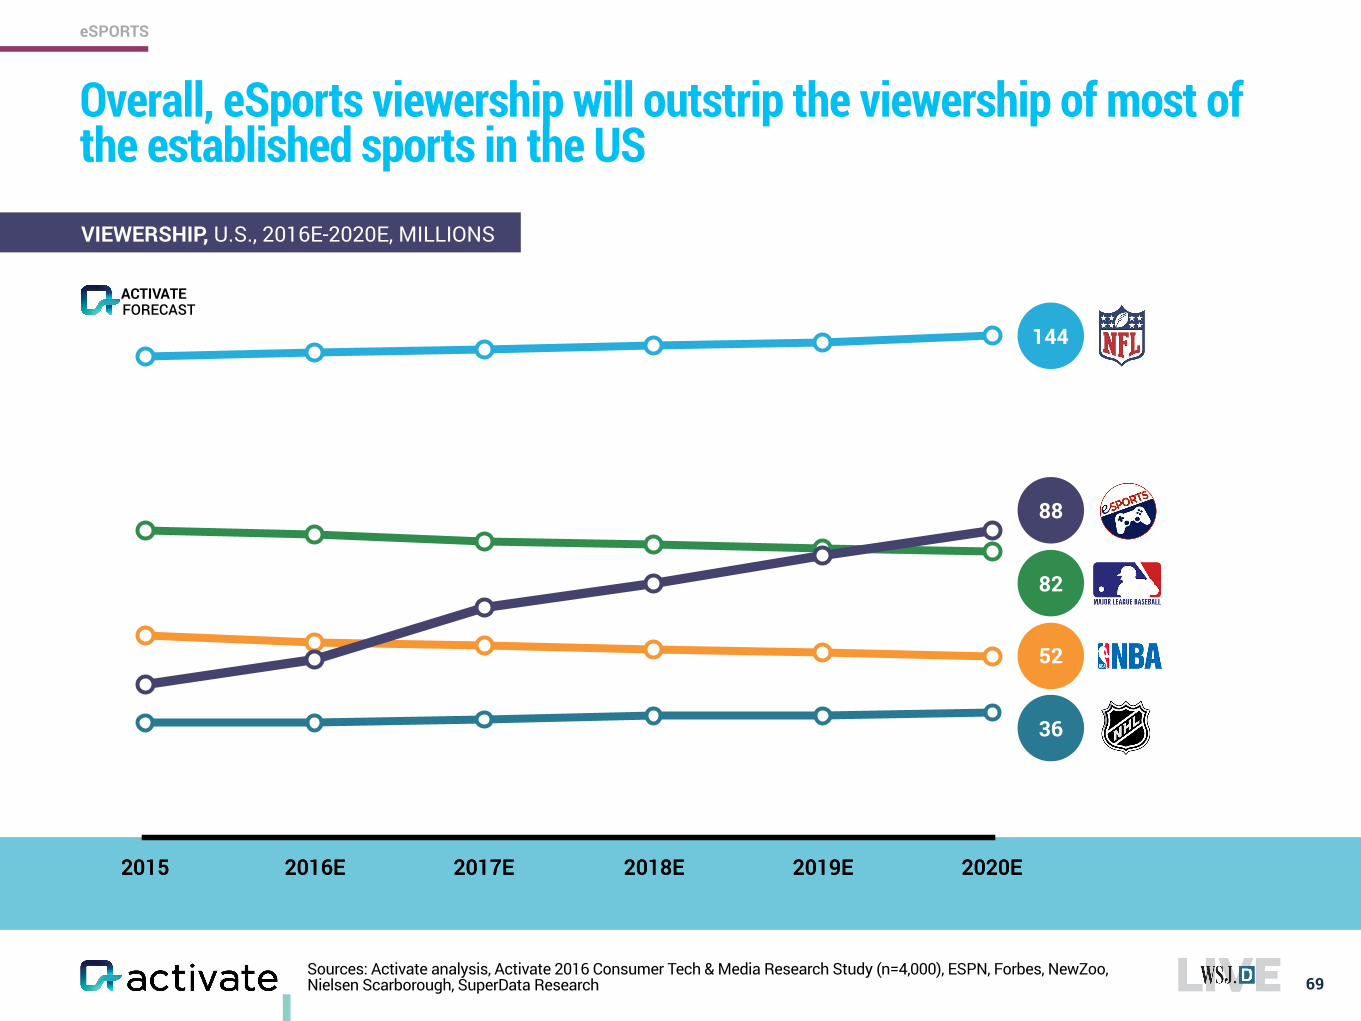
Overall, eSports viewership will outstrip the viewership of most of the established sports in the US
2015 2016E 2017E 2018E 2019E 2020E
VIEWERSHIP, U.S., 2016E-2020E, MILLIONS
144
88
82
52
36
Sources: Activate analysis, Activate 2016 Consumer Tech & Media Research Study (n=4,000), ESPN, Forbes, NewZoo, Nielsen Scarborough, SuperData Research
eSPORTS
FORECASTACTIVATE
2015 2016E 2017E 2018E 2019E 2020E
*Revenues include sponsorship and advertising, prize pools, eSports betting, ticketing, merchandise, and media rights Sources: Activate analysis, Activate 2016 Consumer Tech & Media Research Study (n=4,000), ESPN, Forbes, H1 Gambling Capital, IEG, Narus Advisors/Eilers & Krejcik Gaming, NewZoo, Nielsen Scarborough, SuperData Research
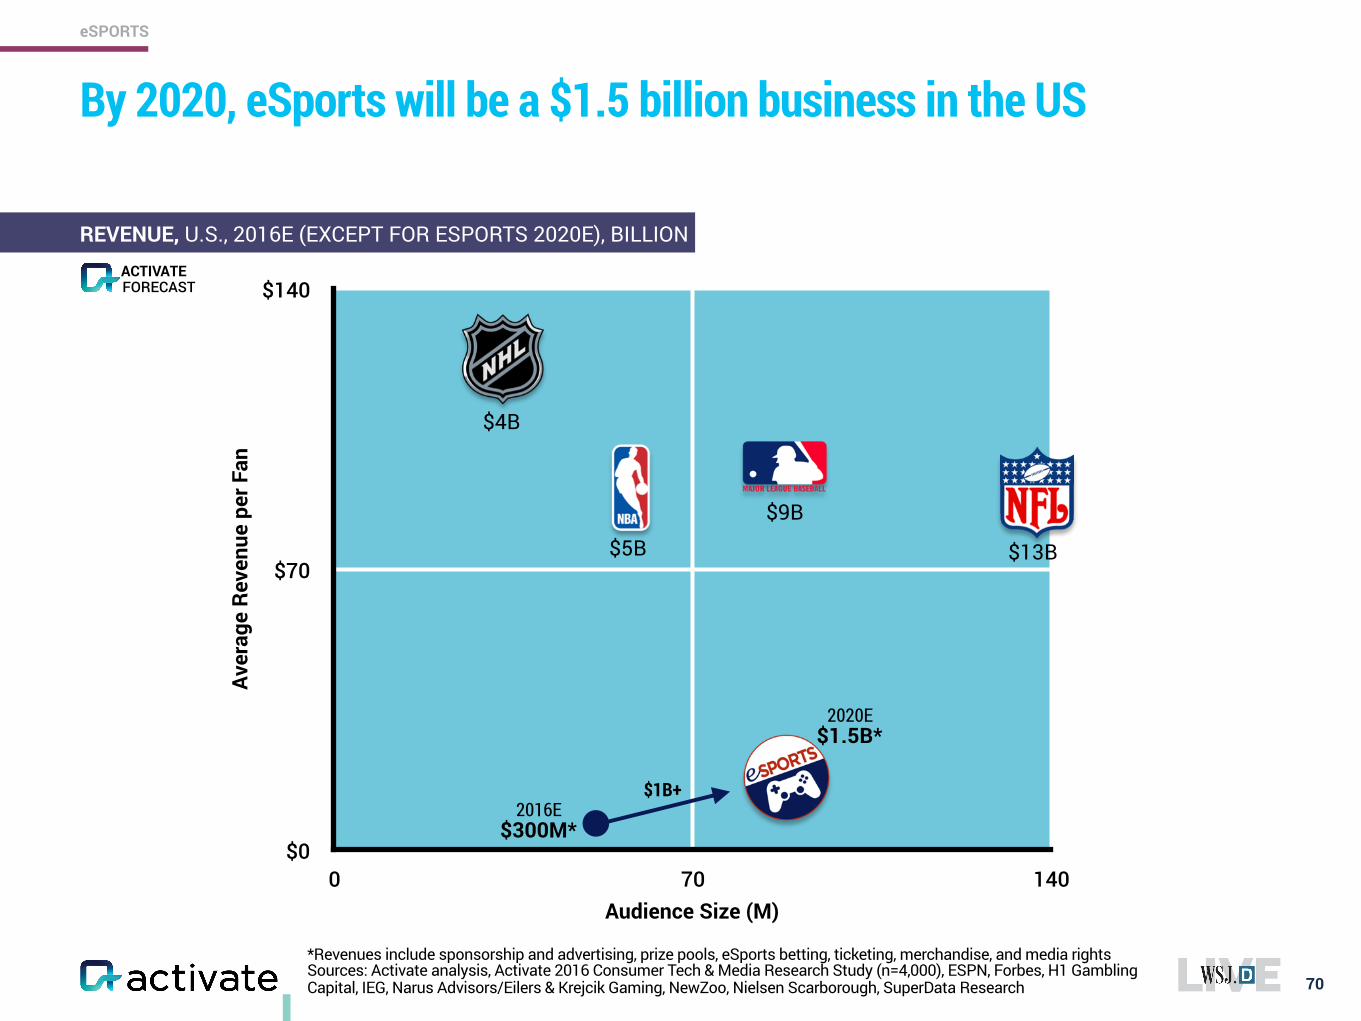
By 2020, eSports will be a $1.5 billion business in the US
70
eSPORTS
REVENUE, U.S., 2016E (EXCEPT FOR ESPORTS 2020E), BILLION
$0
$70
$140
0 70 140
Aver
age
Reve
nue
per F
an
Audience Size (M)
2020E$1.5B*
$4B
$5B
$9B
$13B
2016E$300M*
$1B+
FORECASTACTIVATE
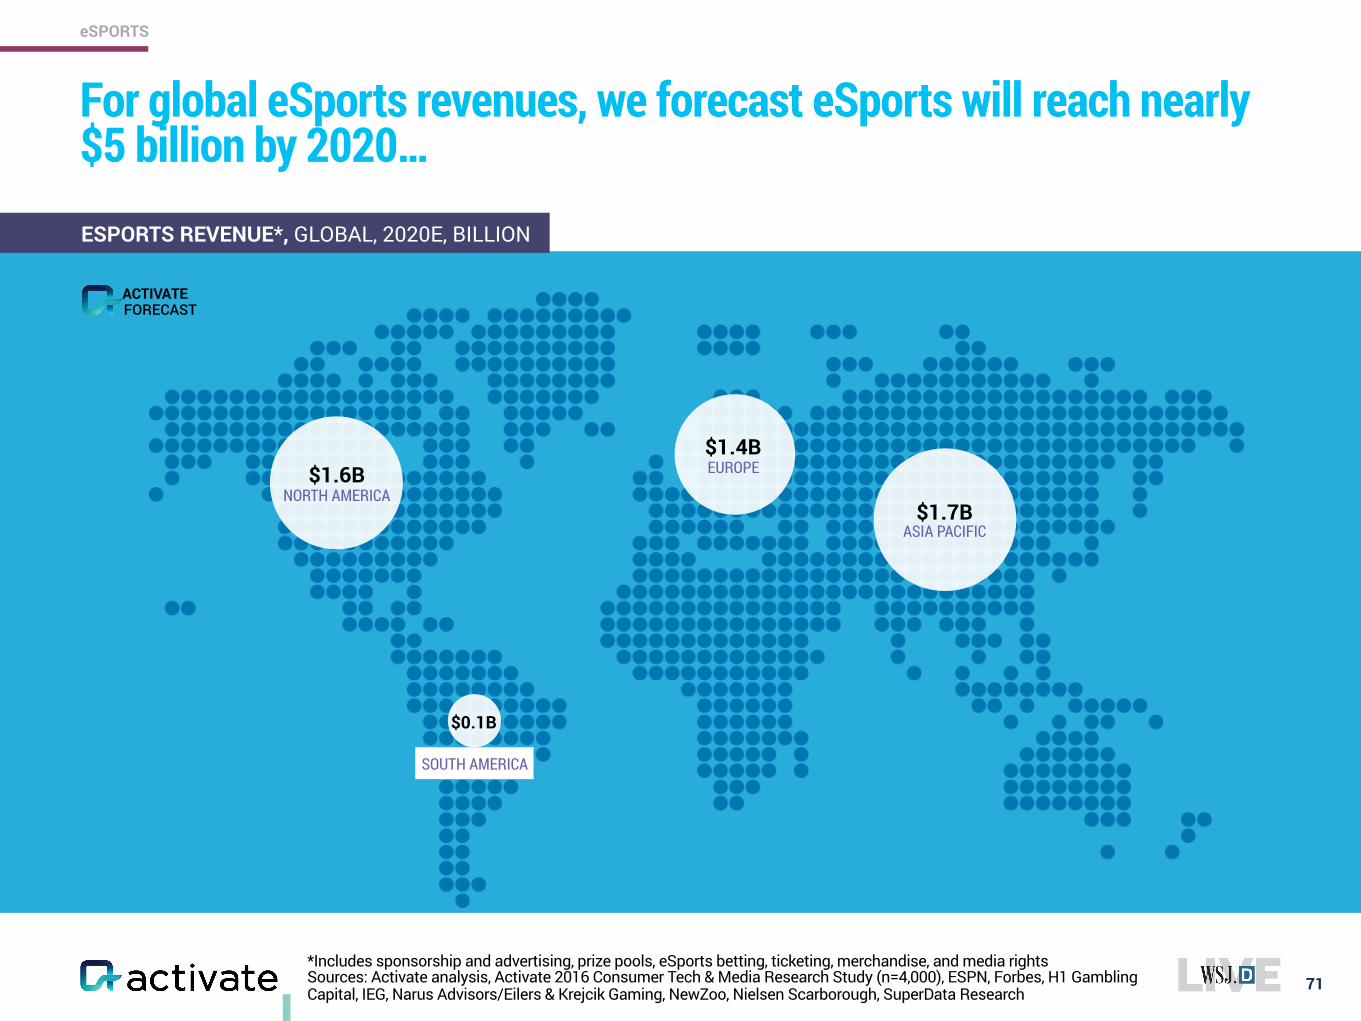
For global eSports revenues, we forecast eSports will reach nearly $5 billion by 2020…
71
eSPORTS
ESPORTS REVENUE*, GLOBAL, 2020E, BILLION
$1.6B NORTH AMERICA
$1.7B ASIA PACIFIC
$0.1B
$1.4B EUROPE
*Includes sponsorship and advertising, prize pools, eSports betting, ticketing, merchandise, and media rights Sources: Activate analysis, Activate 2016 Consumer Tech & Media Research Study (n=4,000), ESPN, Forbes, H1 Gambling Capital, IEG, Narus Advisors/Eilers & Krejcik Gaming, NewZoo, Nielsen Scarborough, SuperData Research
FORECASTACTIVATE
SOUTH AMERICA
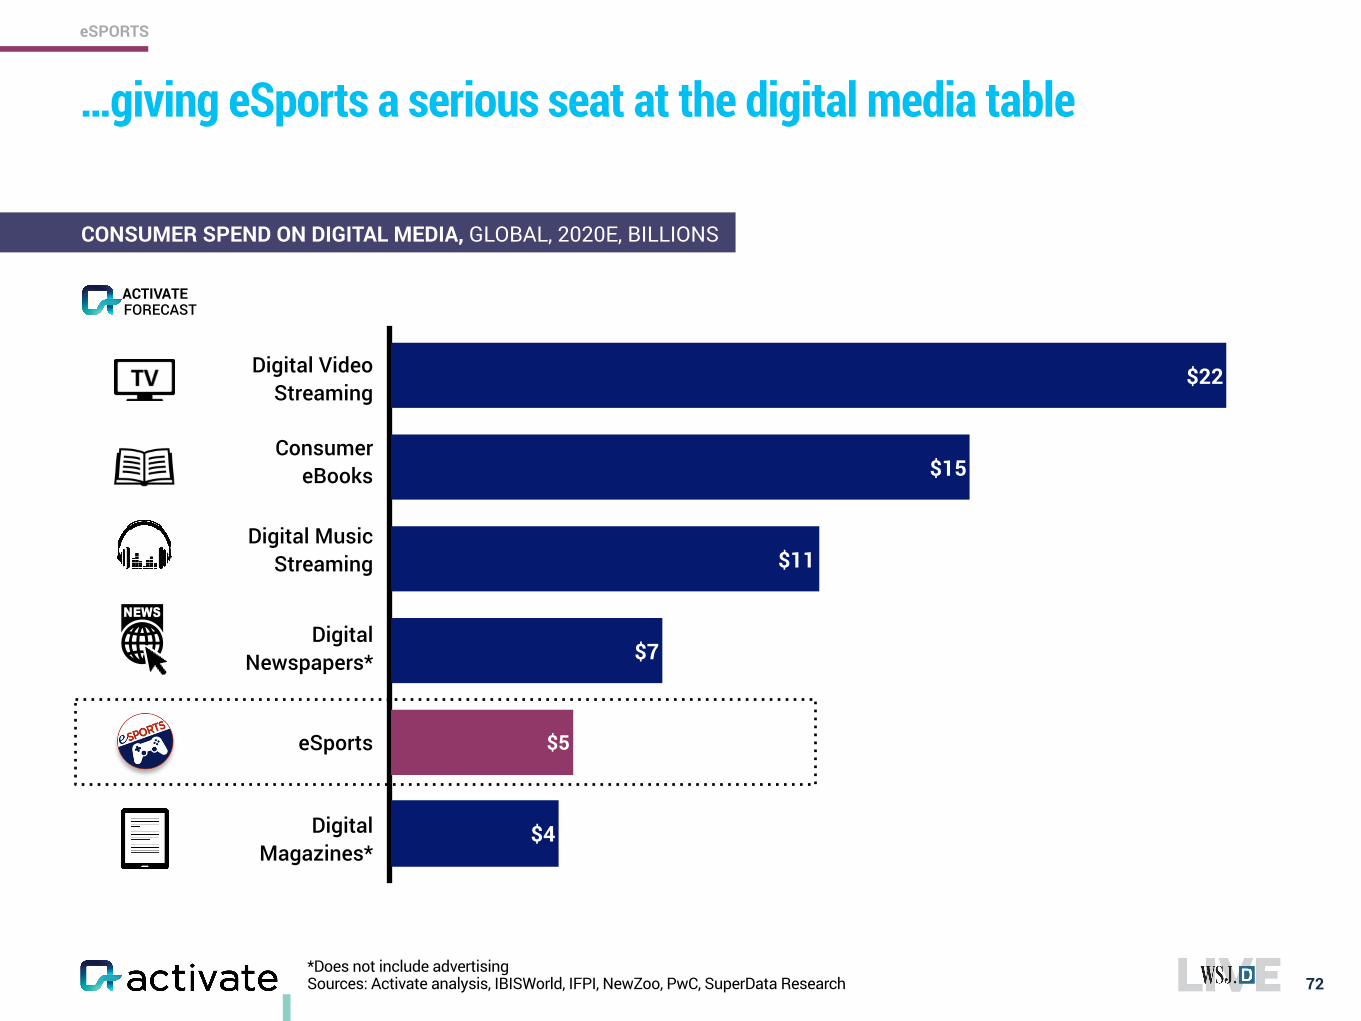
…giving eSports a serious seat at the digital media table
72
eSPORTS
CONSUMER SPEND ON DIGITAL MEDIA, GLOBAL, 2020E, BILLIONS
$5
$4
$7
$11
$15
$22
Digital Music Streaming
eSports
Digital Video Streaming
Consumer eBooks
Digital Magazines*
Digital Newspapers*
*Does not include advertising Sources: Activate analysis, IBISWorld, IFPI, NewZoo, PwC, SuperData Research
FORECASTACTIVATE
30
60
0 30 60
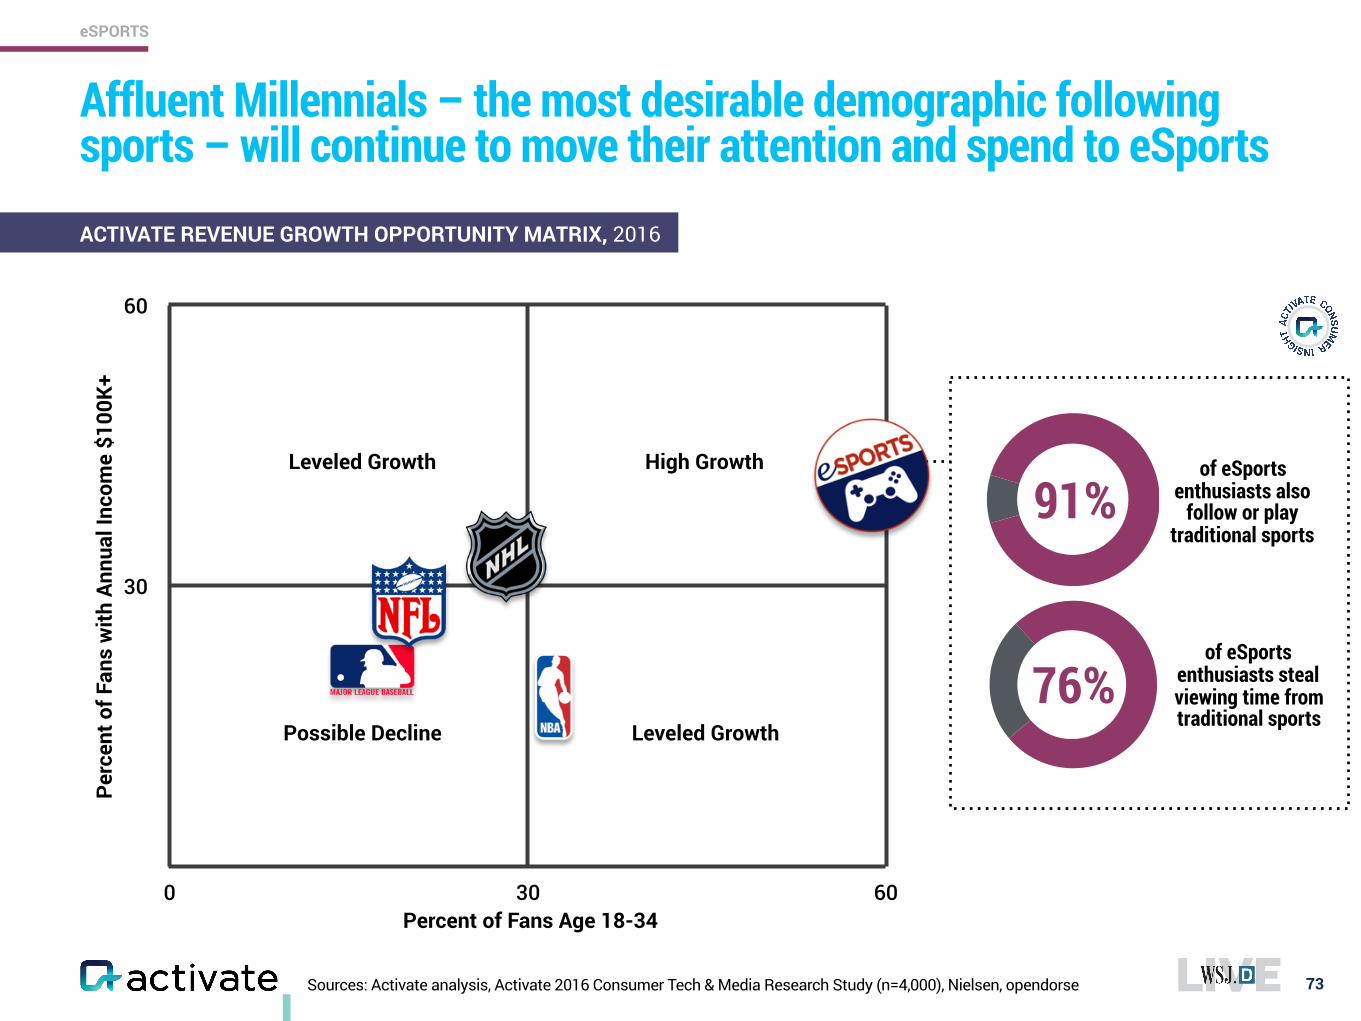
Affluent Millennials – the most desirable demographic following sports – will continue to move their attention and spend to eSports
73
eSPORTS
ACTIVATE REVENUE GROWTH OPPORTUNITY MATRIX, 2016
Perc
ent o
f Fan
s w
ith A
nnua
l Inc
ome
$100
K+
Percent of Fans Age 18-34
High GrowthLeveled Growth
Leveled GrowthPossible Decline
of eSports enthusiasts also
follow or play traditional sports
of eSports enthusiasts steal viewing time from traditional sports
76%
91%
Sources: Activate analysis, Activate 2016 Consumer Tech & Media Research Study (n=4,000), Nielsen, opendorse
74
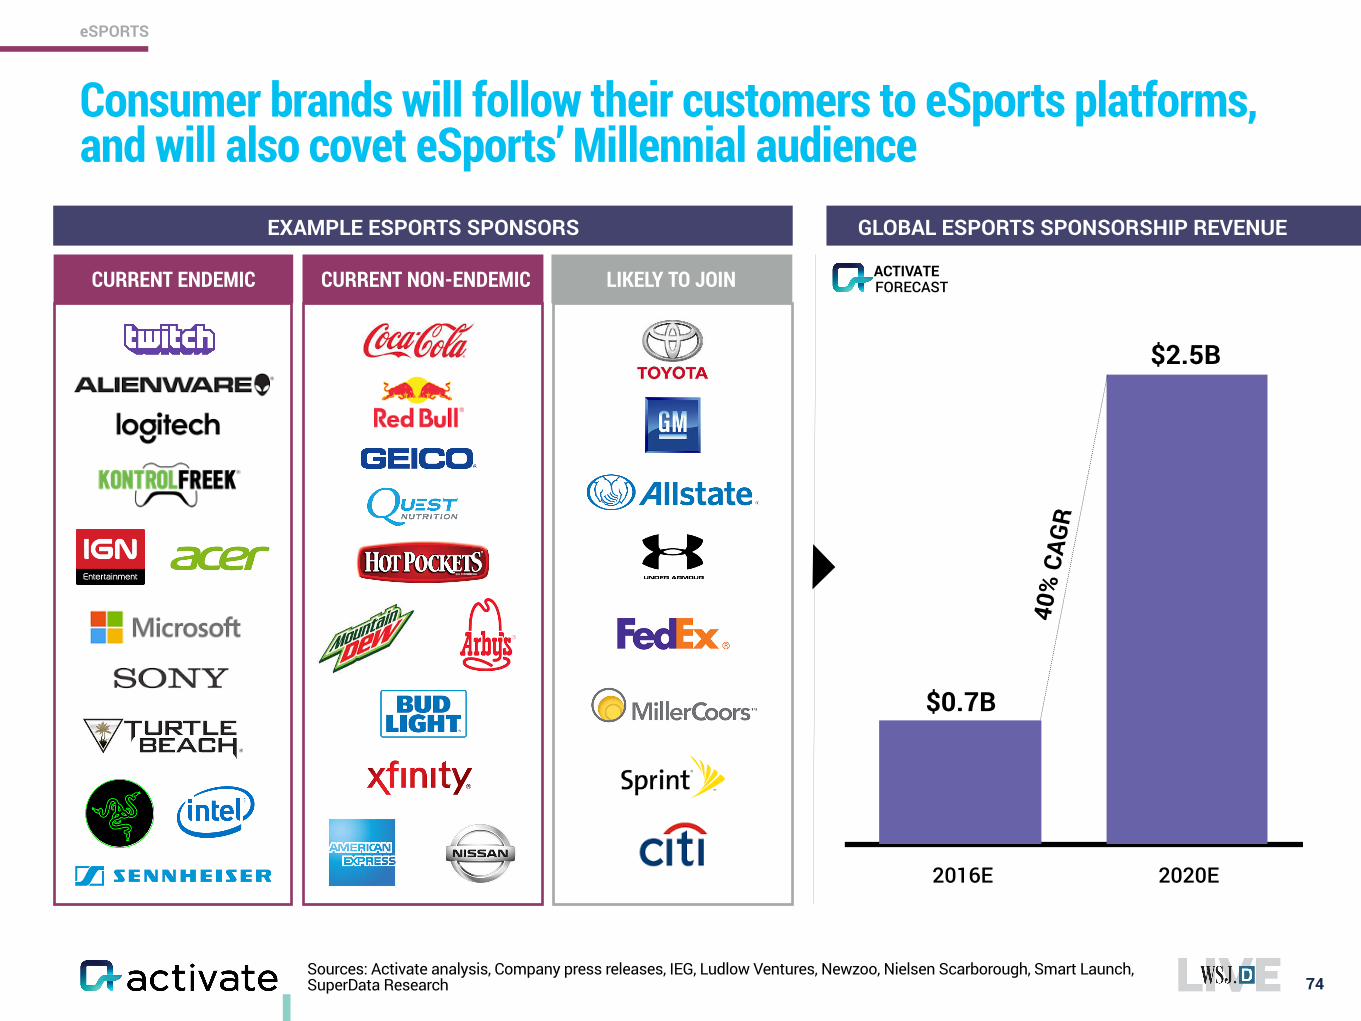
Consumer brands will follow their customers to eSports platforms, and will also covet eSports’ Millennial audience
EXAMPLE ESPORTS SPONSORS GLOBAL ESPORTS SPONSORSHIP REVENUE
2016E 2020E
$0.7B
$2.5B
40%
CAG
R
CURRENT ENDEMIC CURRENT NON-ENDEMIC LIKELY TO JOIN
Sources: Activate analysis, Company press releases, IEG, Ludlow Ventures, Newzoo, Nielsen Scarborough, Smart Launch, SuperData Research
eSPORTS
FORECASTACTIVATE
LoL Season 3 Smite World The International Wimbledon Players Championship Daytona 500
Sources: Activate analysis, eSports Earnings, Sports Blog Nation, Wimbledon 75
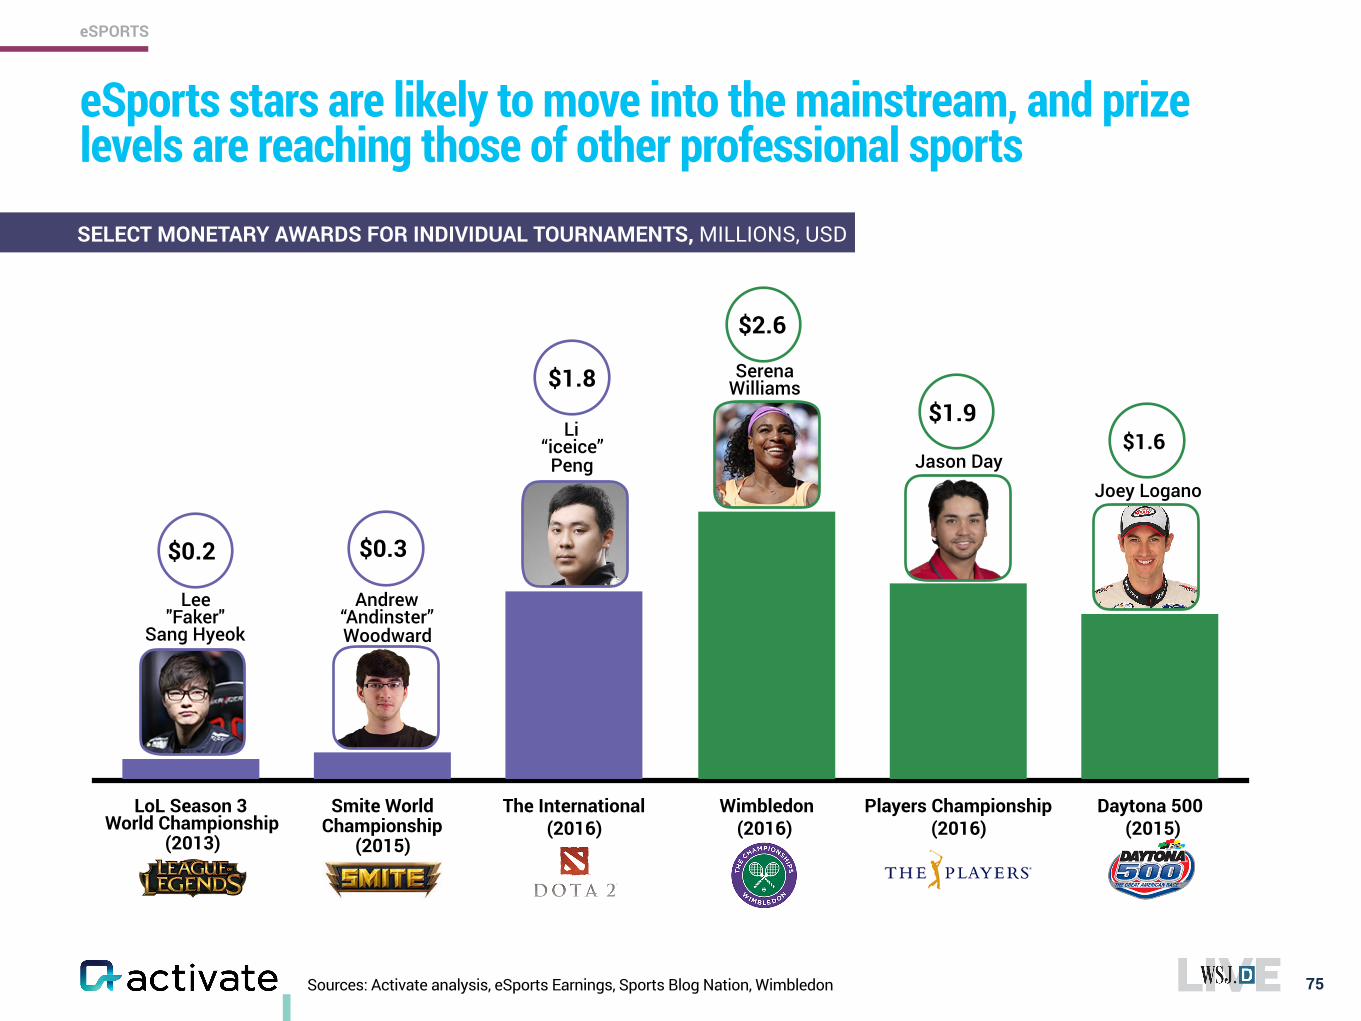
eSports stars are likely to move into the mainstream, and prize levels are reaching those of other professional sports
SELECT MONETARY AWARDS FOR INDIVIDUAL TOURNAMENTS, MILLIONS, USD
Serena Williams
$1.6$1.9
$2.6
$1.8
$0.3$0.2
World Championship (2013)
Championship
Jason DayJoey Logano
Li “iceice”
Peng
Lee "Faker"
Sang Hyeok
Andrew “Andinster” Woodward
(2016)(2015)
(2016) (2016) (2015)
eSPORTS
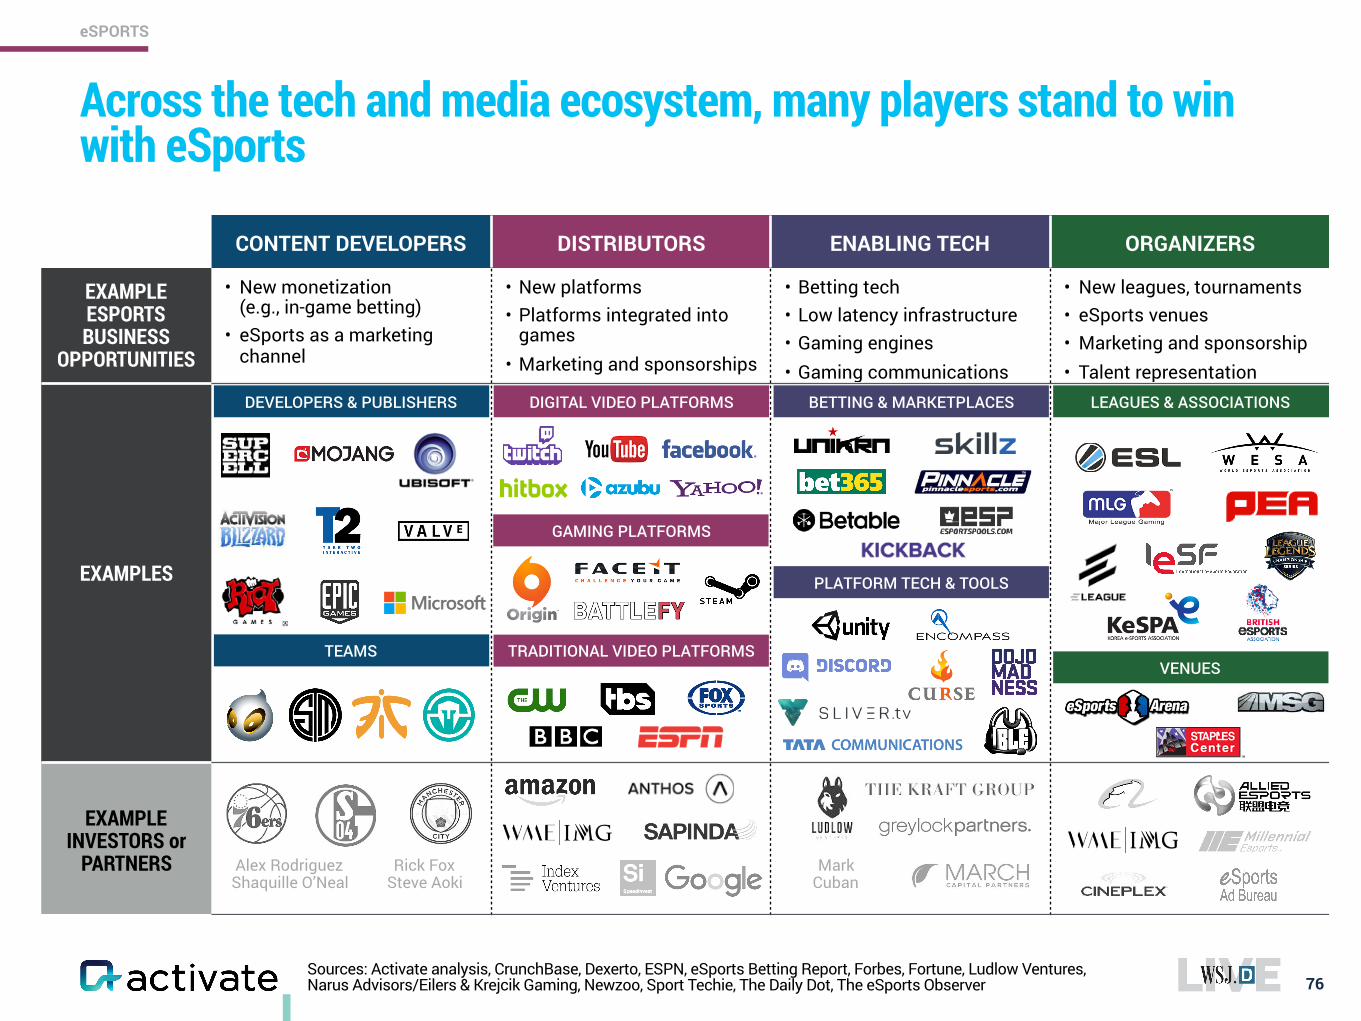
76Sources: Activate analysis, CrunchBase, Dexerto, ESPN, eSports Betting Report, Forbes, Fortune, Ludlow Ventures, Narus Advisors/Eilers & Krejcik Gaming, Newzoo, Sport Techie, The Daily Dot, The eSports Observer
CONTENT DEVELOPERS DISTRIBUTORS ENABLING TECH ORGANIZERS
EXAMPLE ESPORTS BUSINESS
OPPORTUNITIES
• New monetization (e.g., in-game betting)
• eSports as a marketing channel
• New platforms • Platforms integrated into
games • Marketing and sponsorships
• Betting tech • Low latency infrastructure • Gaming engines • Gaming communications
• New leagues, tournaments • eSports venues • Marketing and sponsorship • Talent representation
EXAMPLES
EXAMPLE INVESTORS or
PARTNERS
DEVELOPERS & PUBLISHERS
TEAMS
DIGITAL VIDEO PLATFORMS
GAMING PLATFORMS
TRADITIONAL VIDEO PLATFORMS
BETTING & MARKETPLACES LEAGUES & ASSOCIATIONS
VENUES
Alex Rodriguez Shaquille O’Neal
Rick Fox Steve Aoki
Mark Cuban
PLATFORM TECH & TOOLS
Across the tech and media ecosystem, many players stand to win with eSports
eSPORTS
77
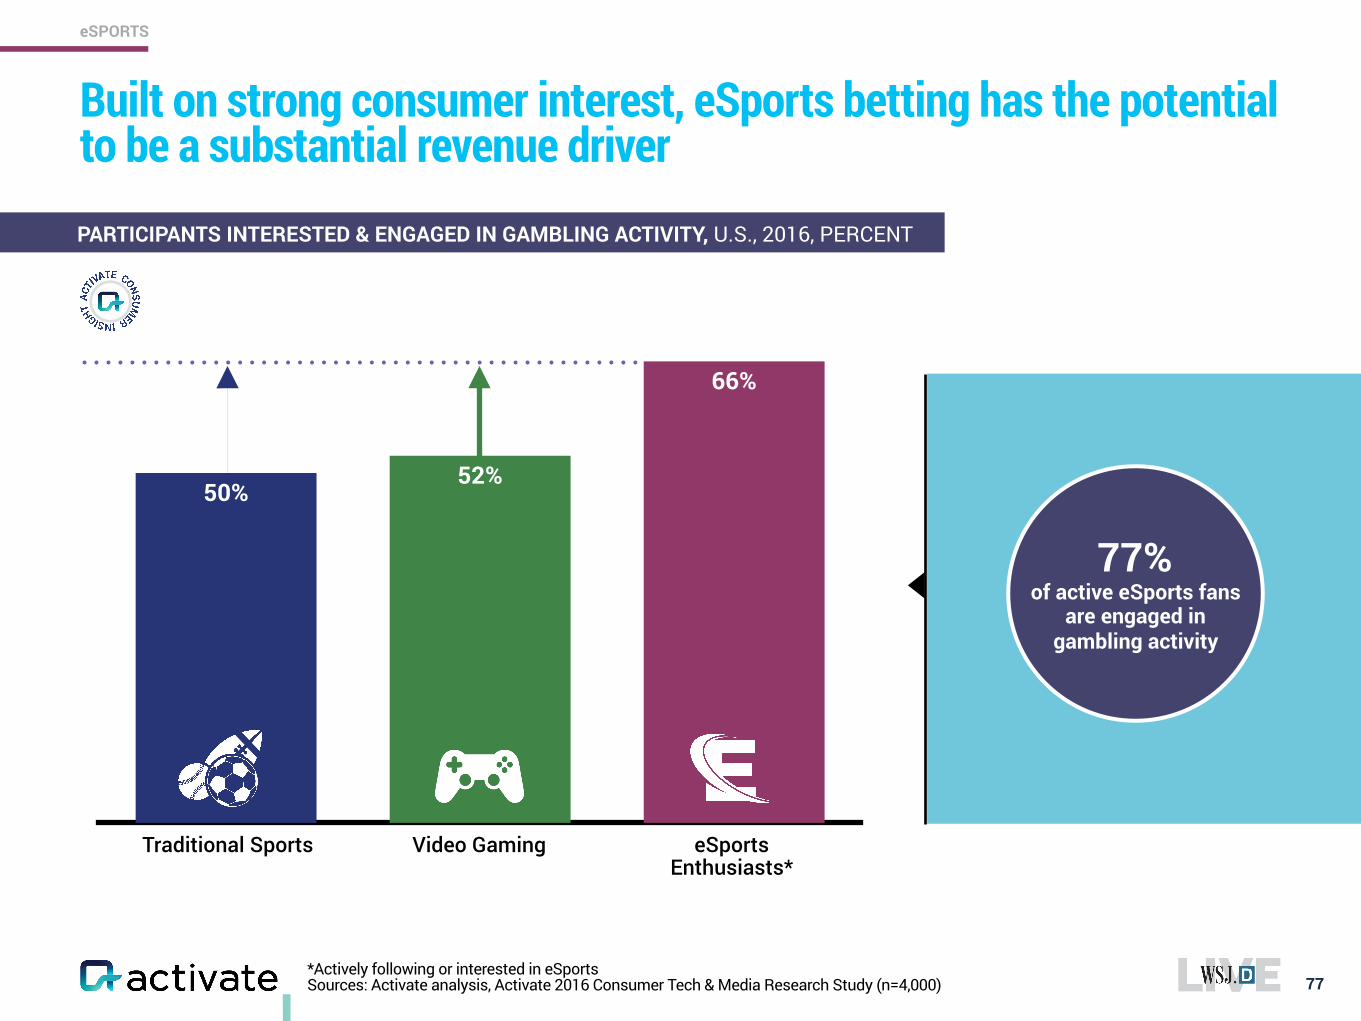
Built on strong consumer interest, eSports betting has the potential to be a substantial revenue driver
PARTICIPANTS INTERESTED & ENGAGED IN GAMBLING ACTIVITY, U.S., 2016, PERCENT
66%
52%50%
Traditional Sports Video Gaming eSports Enthusiasts*
77% of active eSports fans
are engaged in gambling activity
*Actively following or interested in eSports Sources: Activate analysis, Activate 2016 Consumer Tech & Media Research Study (n=4,000)
eSPORTS
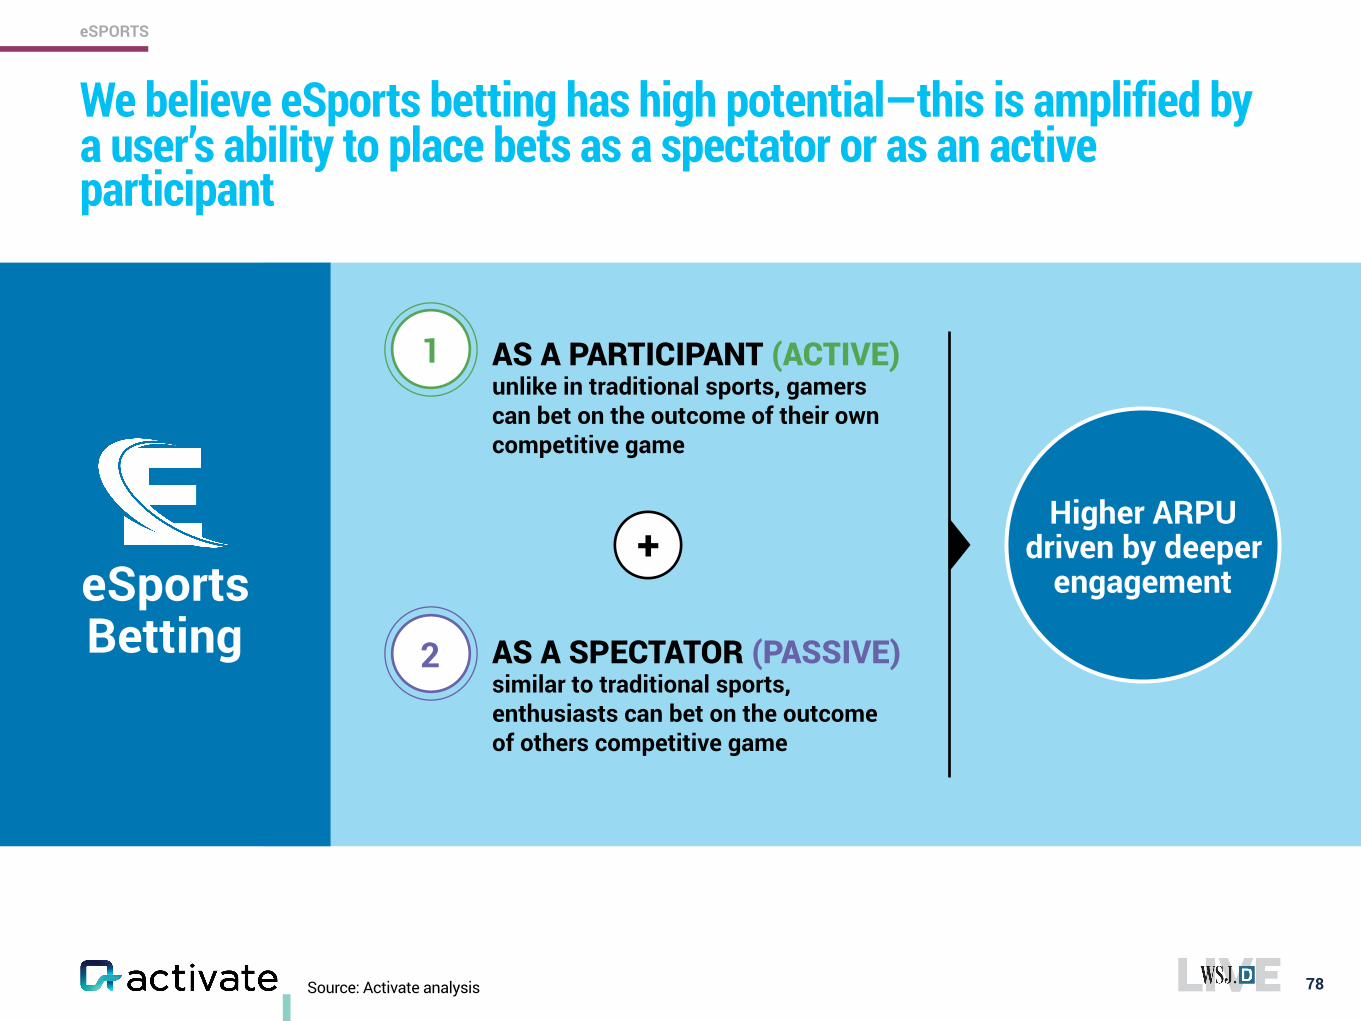
We believe eSports betting has high potential—this is amplified by a user’s ability to place bets as a spectator or as an active participant
78
eSPORTS
AS A PARTICIPANT (ACTIVE) unlike in traditional sports, gamers can bet on the outcome of their own competitive game
AS A SPECTATOR (PASSIVE) similar to traditional sports, enthusiasts can bet on the outcome of others competitive game
1
2
eSports Betting
+Higher ARPU
driven by deeper engagement
Source: Activate analysis
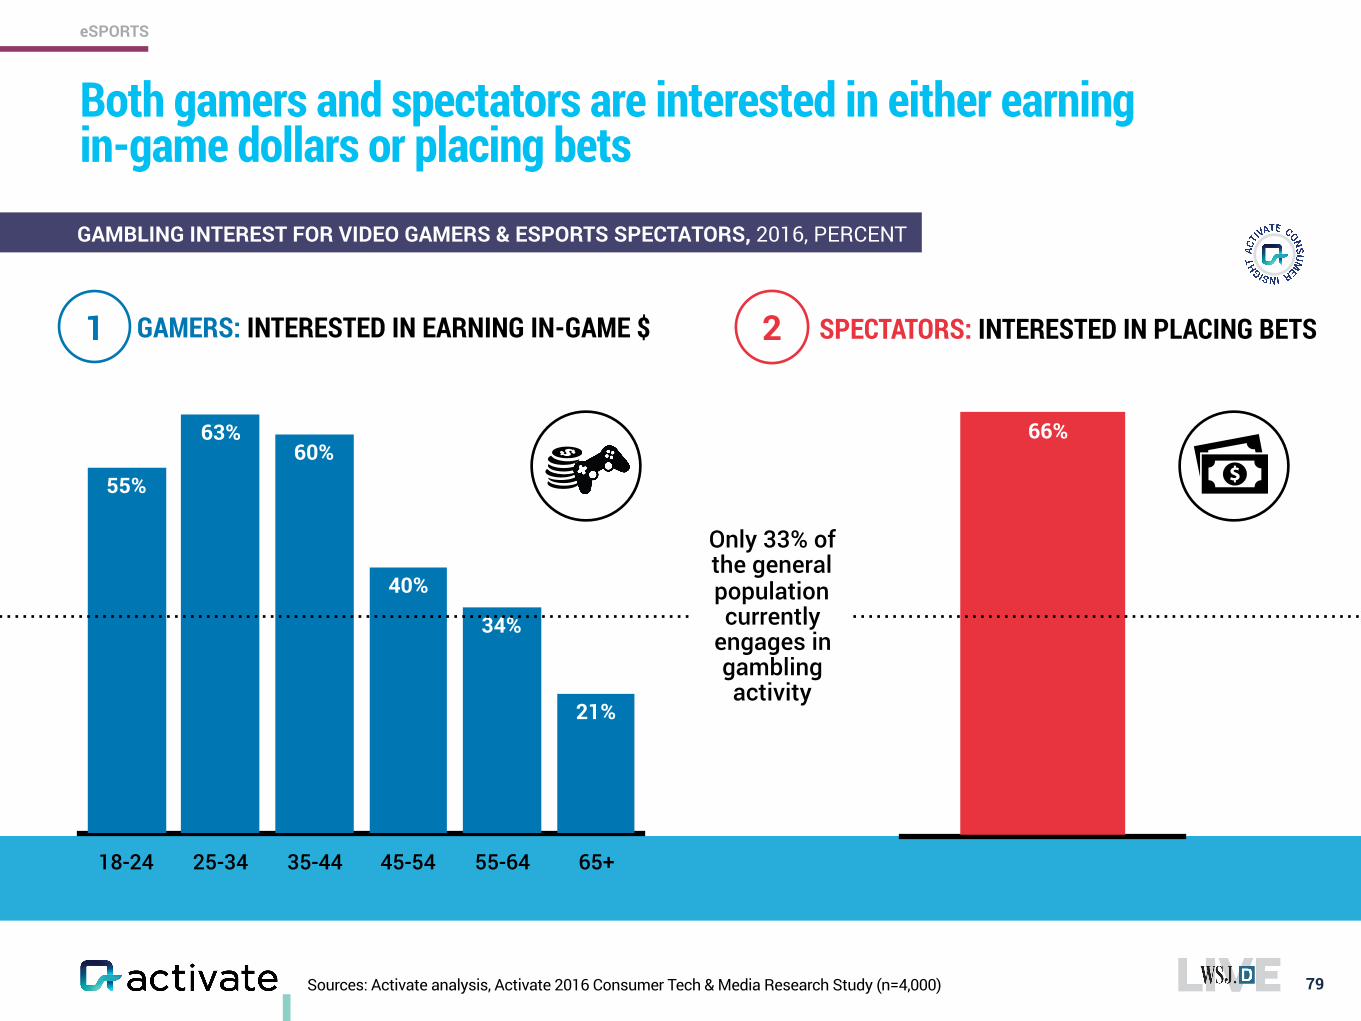
18-24 25-34 35-44 45-54 55-64 65+
21%
34%
40%
60%63%
55%
79
Both gamers and spectators are interested in either earning in-game dollars or placing bets
GAMBLING INTEREST FOR VIDEO GAMERS & ESPORTS SPECTATORS, 2016, PERCENT
GAMERS: INTERESTED IN EARNING IN-GAME $
66%
Only 33% of the general population currently
engages in gambling activity
SPECTATORS: INTERESTED IN PLACING BETS
Sources: Activate analysis, Activate 2016 Consumer Tech & Media Research Study (n=4,000)
1 2
eSPORTS
80
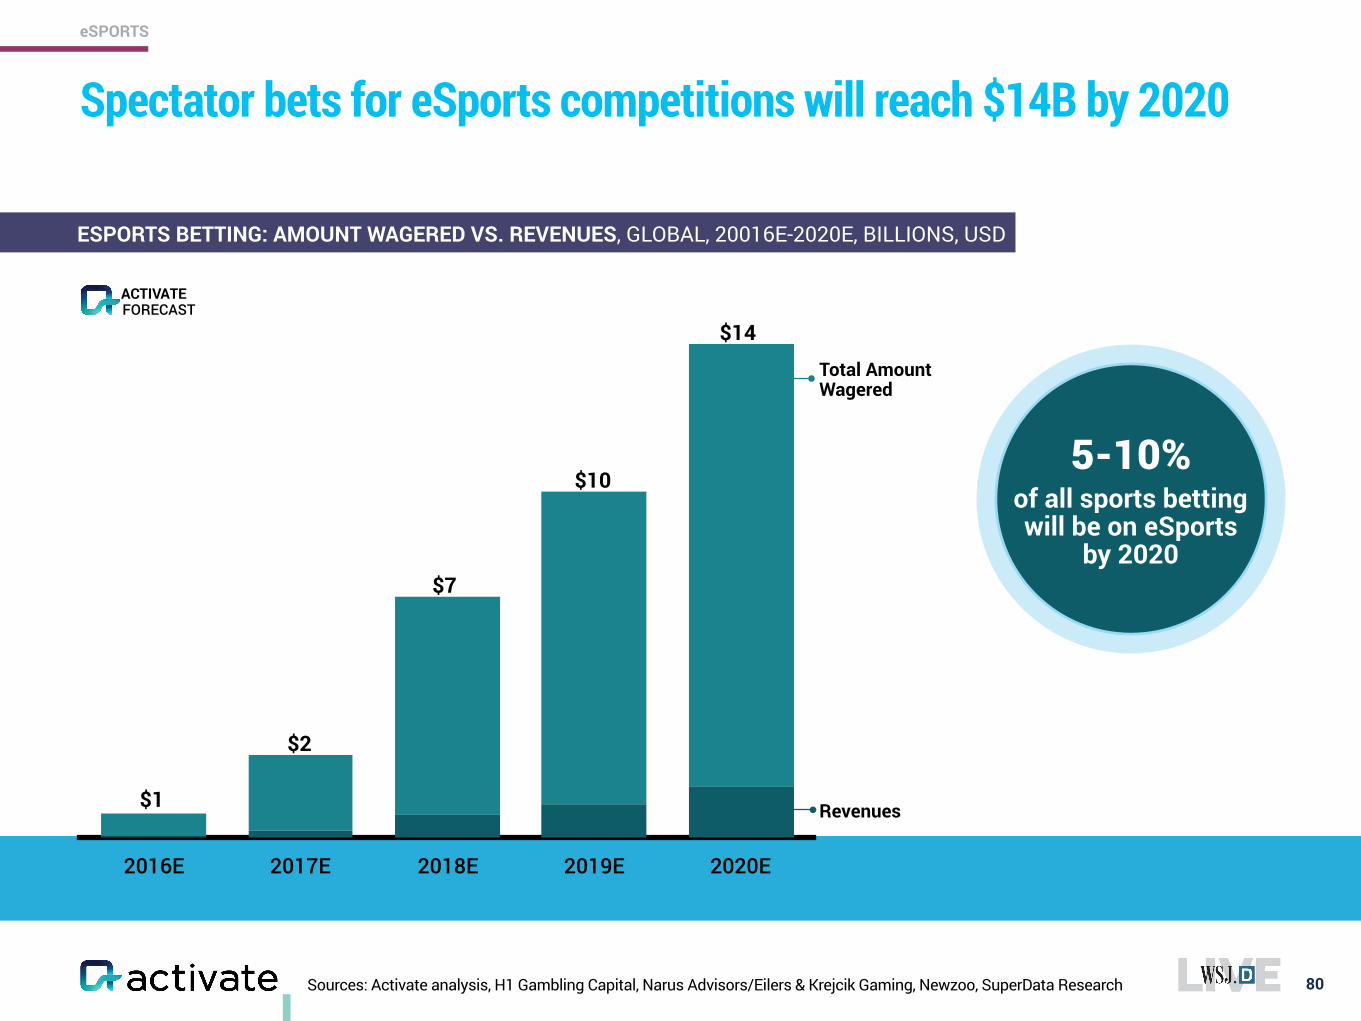
Spectator bets for eSports competitions will reach $14B by 2020
ESPORTS BETTING: AMOUNT WAGERED VS. REVENUES, GLOBAL, 20016E-2020E, BILLIONS, USD
2016E 2017E 2018E 2019E 2020E
5-10% of all sports betting will be on eSports
by 2020
$1
$2
$7
$10
$14
Total Amount Wagered
Revenues
eSPORTS
Sources: Activate analysis, H1 Gambling Capital, Narus Advisors/Eilers & Krejcik Gaming, Newzoo, SuperData Research
FORECASTACTIVATE
81
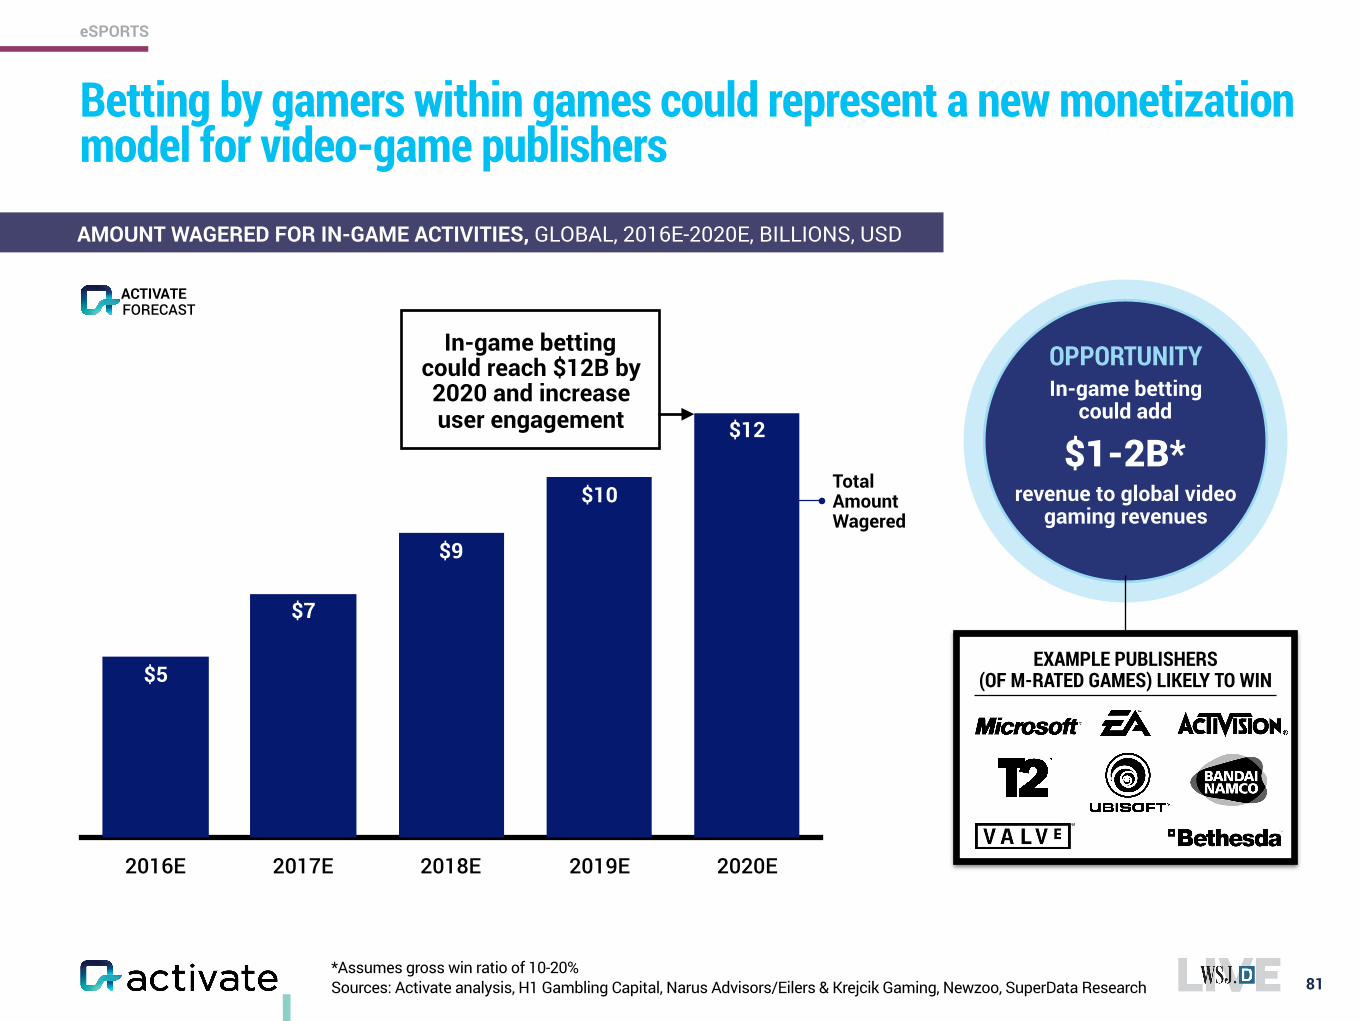
AMOUNT WAGERED FOR IN-GAME ACTIVITIES, GLOBAL, 2016E-2020E, BILLIONS, USD
Betting by gamers within games could represent a new monetization model for video-game publishers
eSPORTS
FORECASTACTIVATE
2016E 2017E 2018E 2019E 2020E
$12
$10
$9
$7
$5
Sources: Activate analysis, H1 Gambling Capital, Narus Advisors/Eilers & Krejcik Gaming, Newzoo, SuperData Research
In-game betting could add
$1-2B* revenue to global video
gaming revenues
OPPORTUNITYIn-game betting could reach $12B by 2020 and increase user engagement
Total Amount Wagered
*Assumes gross win ratio of 10-20%
EXAMPLE PUBLISHERS (OF M-RATED GAMES) LIKELY TO WIN
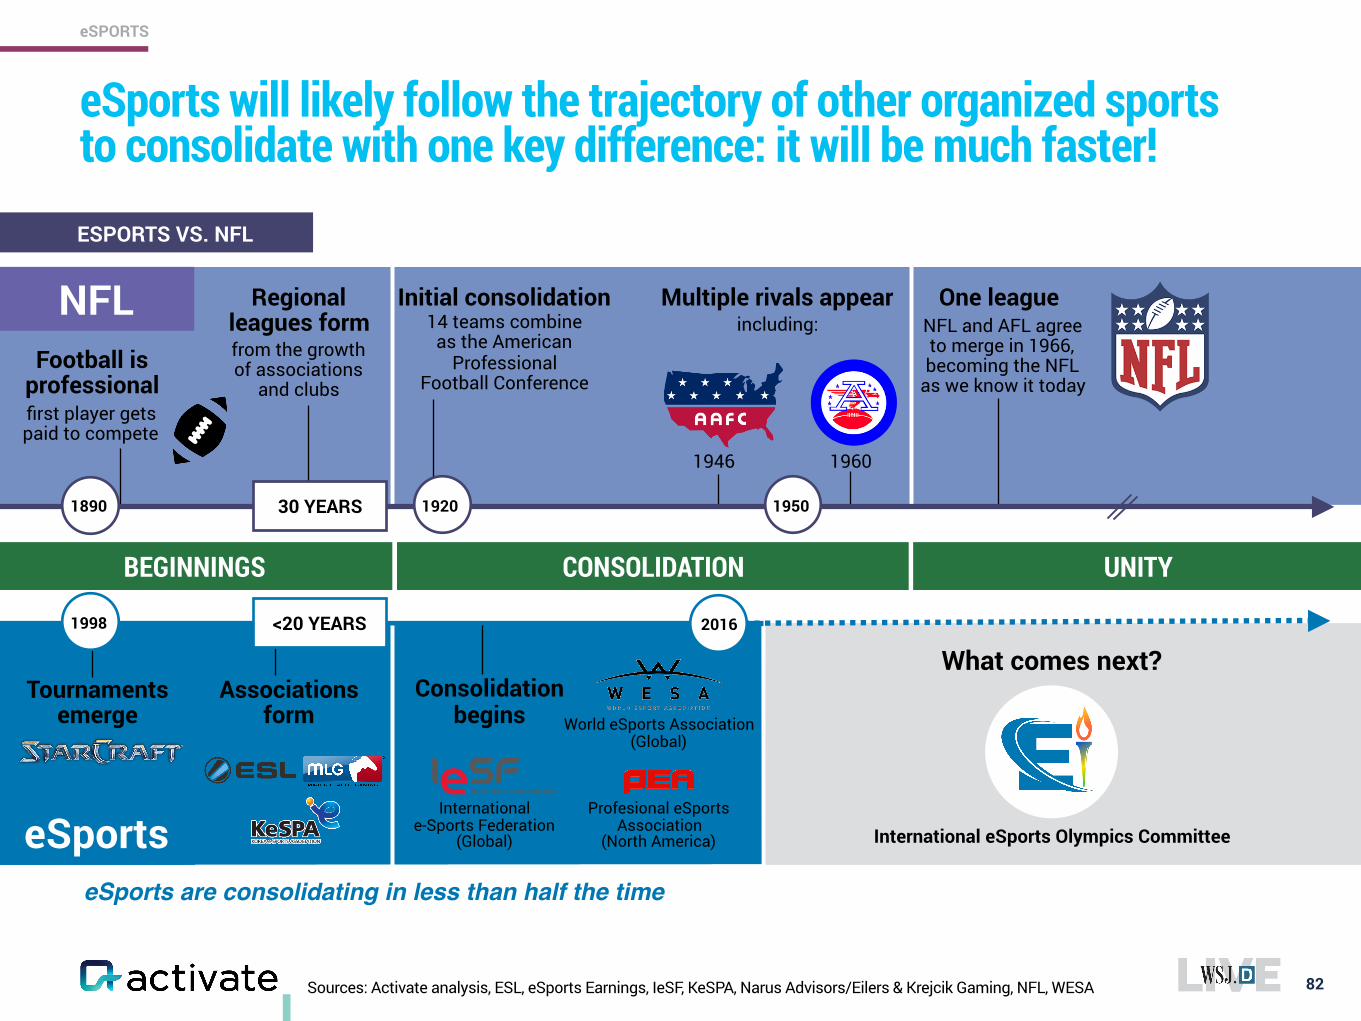
eSports will likely follow the trajectory of other organized sports to consolidate with one key difference: it will be much faster!
82
eSPORTS
ESPORTS VS. NFL
1890 1920 1950
14 teams combine as the American
Professional Football Conference
What comes next?
UNITYBEGINNINGS CONSOLIDATION
first player gets paid to compete
from the growth of associations
and clubs
International eSports Olympics Committee
eSports are consolidating in less than half the time
1998 2016
NFL
eSports
Football is professional
Regional leagues form
Multiple rivals appear
Tournaments emerge
30 YEARS
<20 YEARS
Associations form
One leagueNFL and AFL agree to merge in 1966, becoming the NFL
as we know it today
Consolidation begins
International e-Sports Federation
(Global)
Profesional eSports Association
(North America)
World eSports Association (Global)
Initial consolidationincluding:
1946 1960
Sources: Activate analysis, ESL, eSports Earnings, IeSF, KeSPA, Narus Advisors/Eilers & Krejcik Gaming, NFL, WESA
Source: Activate analysis 83
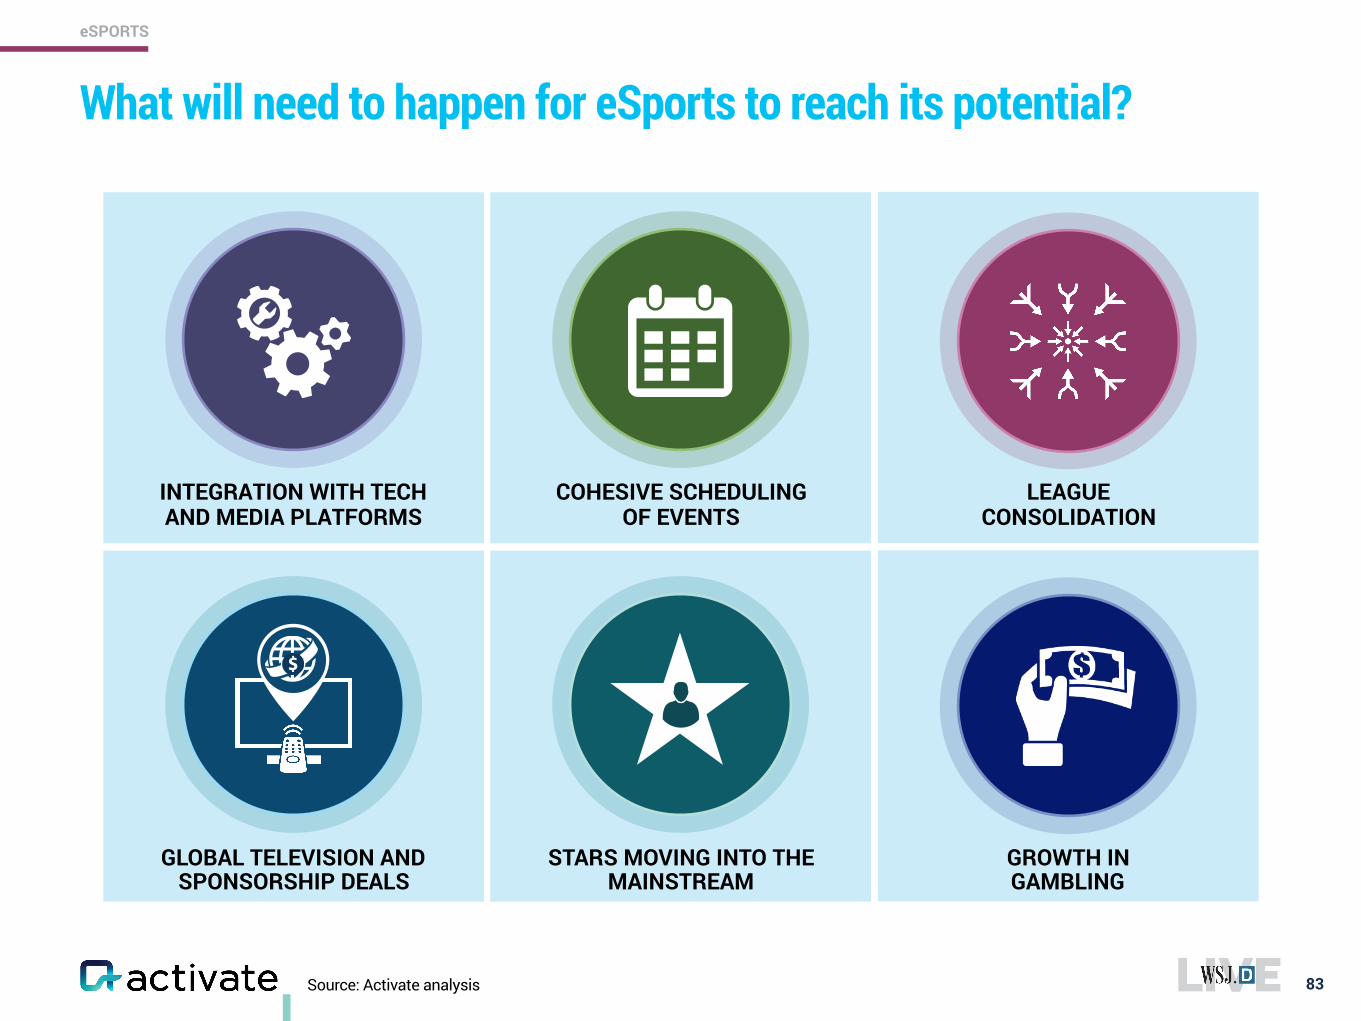
What will need to happen for eSports to reach its potential?
INTEGRATION WITH TECH AND MEDIA PLATFORMS
COHESIVE SCHEDULING OF EVENTS
LEAGUE CONSOLIDATION
GLOBAL TELEVISION AND SPONSORSHIP DEALS
STARS MOVING INTO THE MAINSTREAM
GROWTH IN GAMBLING
eSPORTS
84www.activate.com
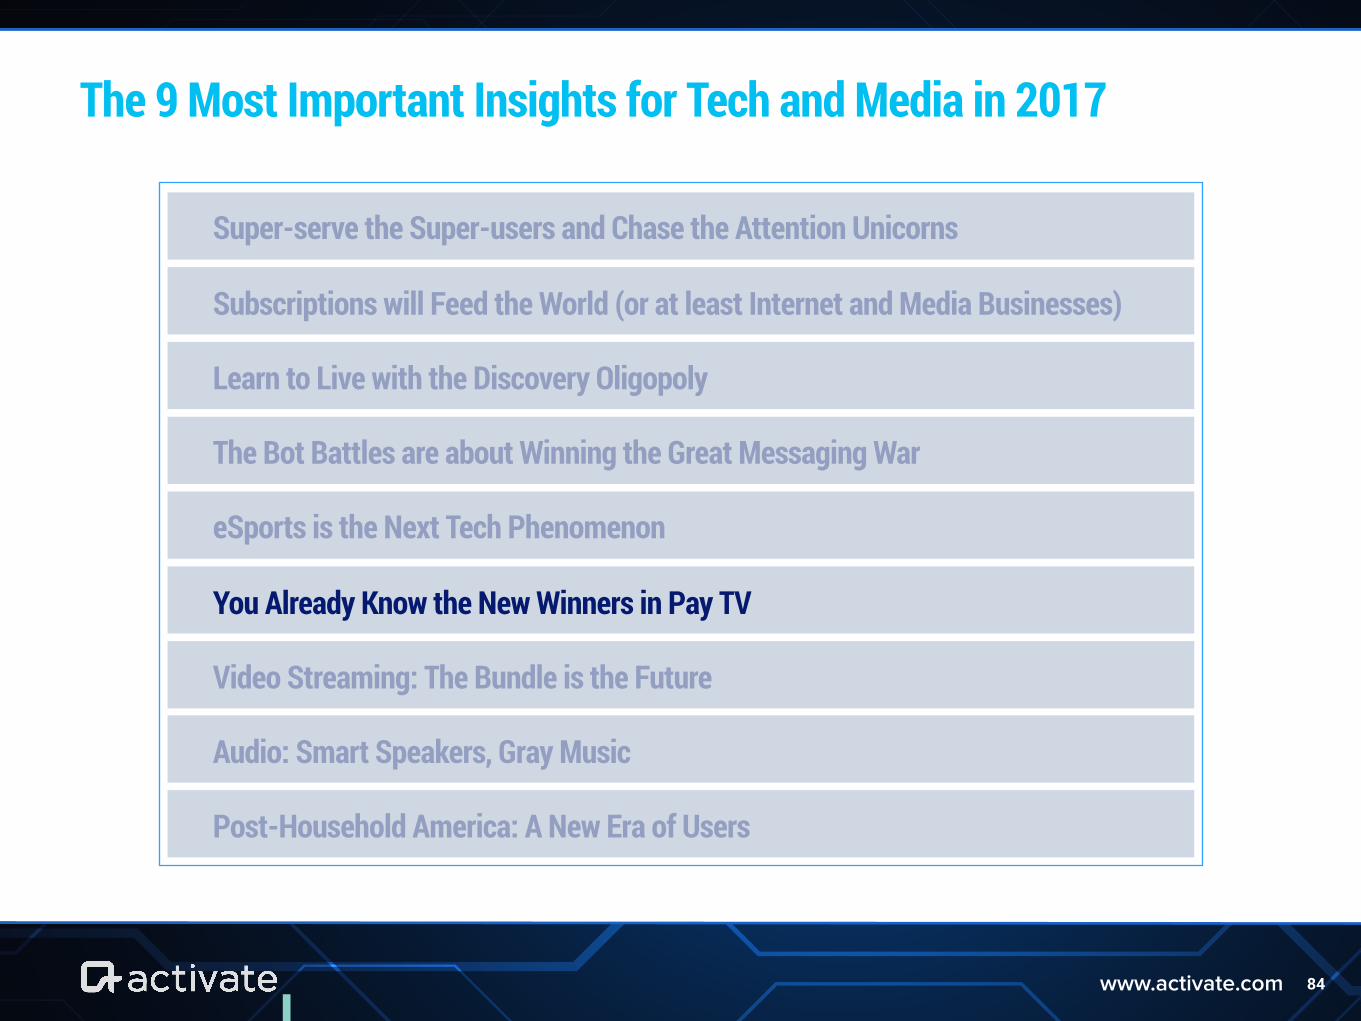
The 9 Most Important Insights for Tech and Media in 2017
Super-serve the Super-users and Chase the Attention Unicorns
Subscriptions will Feed the World (or at least Internet and Media Businesses)
Learn to Live with the Discovery Oligopoly
The Bot Battles are about Winning the Great Messaging War
eSports is the Next Tech Phenomenon
You Already Know the New Winners in Pay TV
Video Streaming: The Bundle is the Future
Audio: Smart Speakers, Gray Music
Post-Household America: A New Era of Users
Traditional TV Digital Video
Sources: Activate analysis, eMarketer, MediaREDEF, Netflix, Nielsen, Parks Associates, Sandvine, ZenithOptimedia
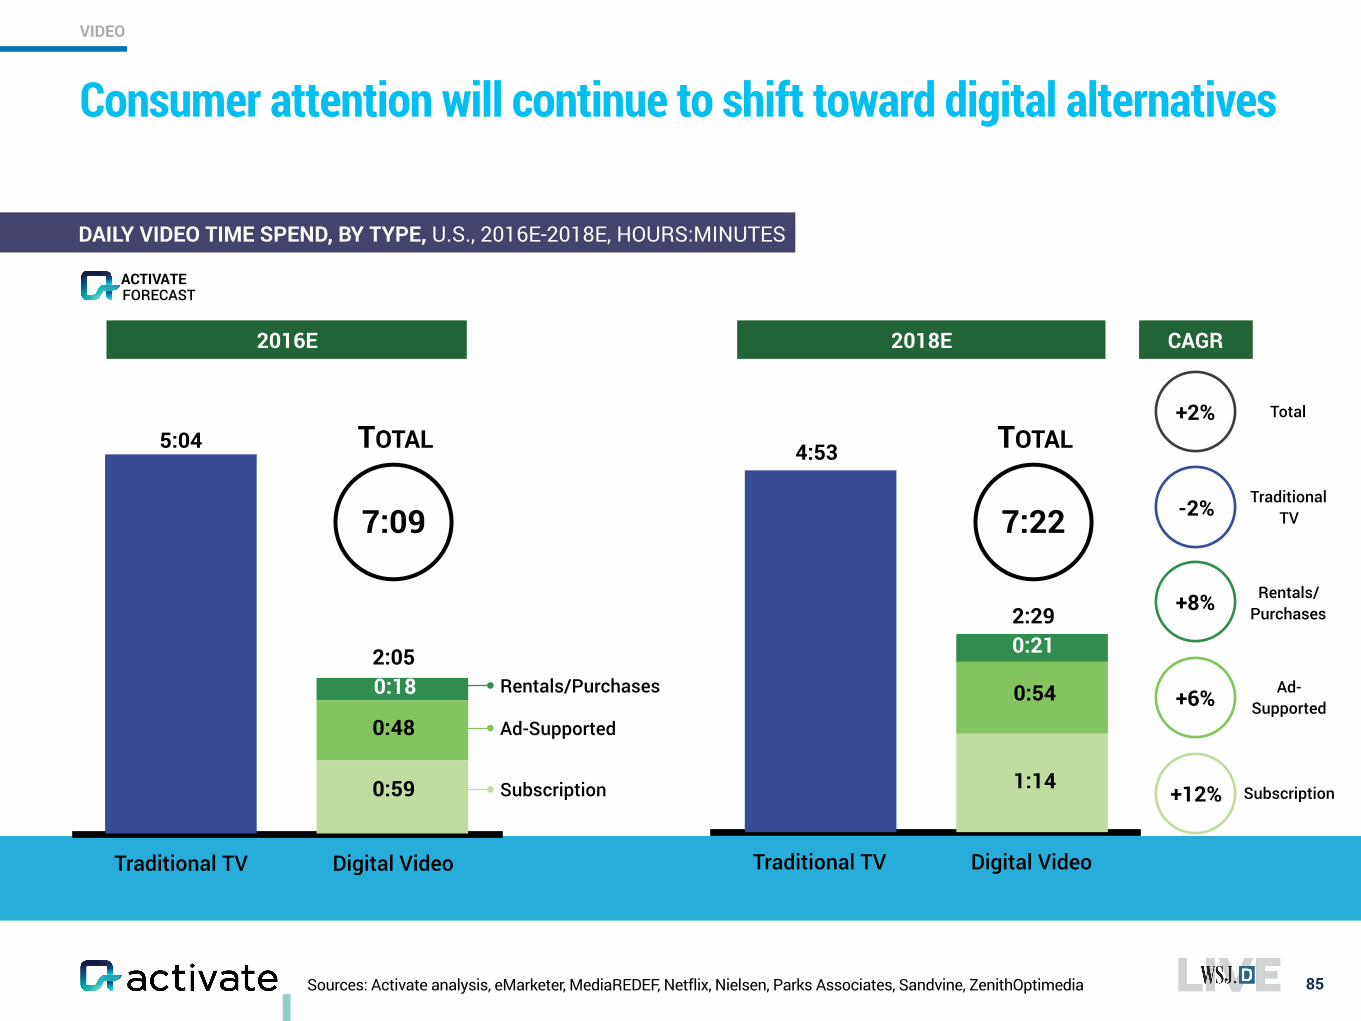
Consumer attention will continue to shift toward digital alternatives
85
DAILY VIDEO TIME SPEND, BY TYPE, U.S., 2016E-2018E, HOURS:MINUTES
2016E 2018E
0:59
0:48
0:18
5:04
2:05Rentals/Purchases
Ad-Supported
Subscription
Traditional TV Digital Video
4:53
1:14
0:54
0:212:29
CAGR
-2%
+6%
+12%
+8%
7:09
TOTAL
7:22
TOTAL
VIDEO
FORECASTACTIVATE
Traditional TV
Rentals/Purchases
Ad-Supported
Subscription
+2% Total
Sources: Activate analysis, Experian, Leichtman Research Group, U.S. Census Bureau
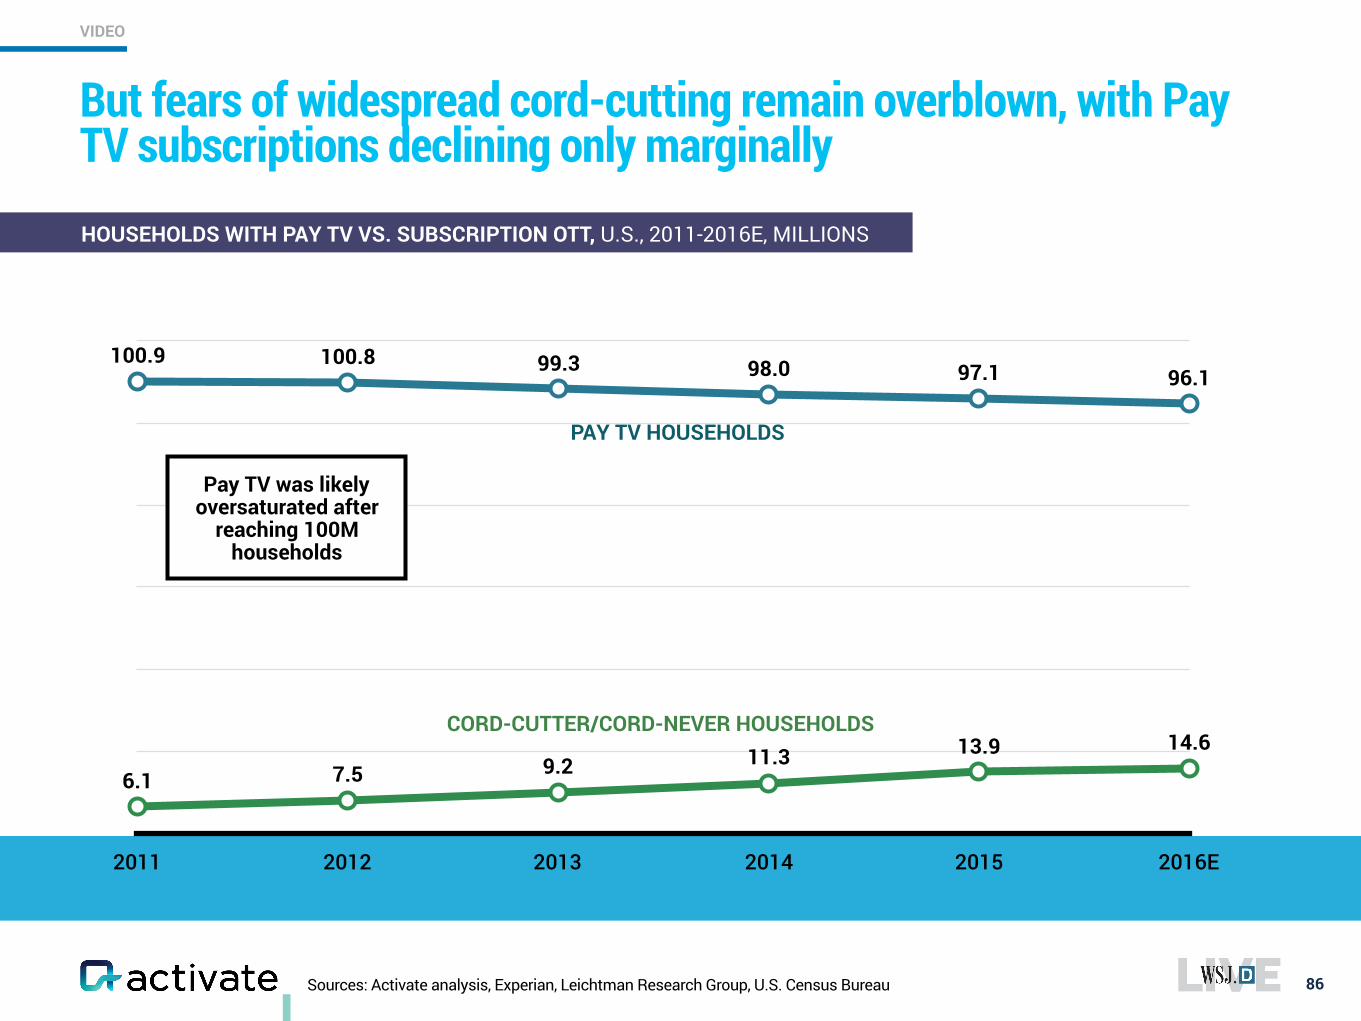
But fears of widespread cord-cutting remain overblown, with Pay TV subscriptions declining only marginally
86
HOUSEHOLDS WITH PAY TV VS. SUBSCRIPTION OTT, U.S., 2011-2016E, MILLIONS
2011 2012 2013 2014 2015 2016E
6.1 7.5 9.2 11.3 13.9 14.6
100.9 100.8 99.3 98.0 97.1 96.1
CORD-CUTTER/CORD-NEVER HOUSEHOLDS
PAY TV HOUSEHOLDS
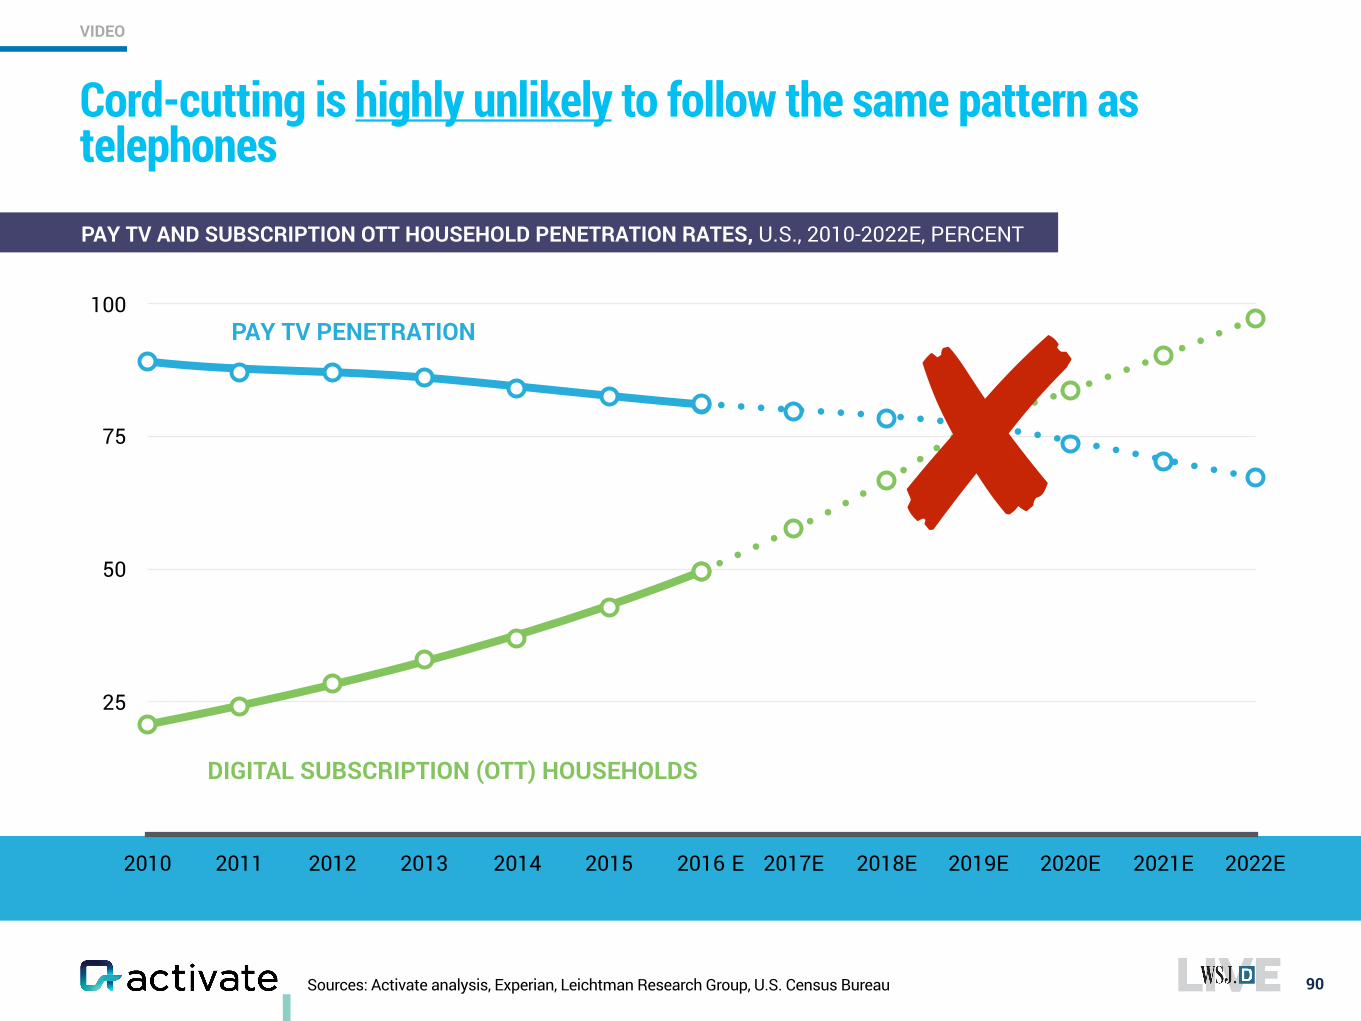
Pay TV was likely oversaturated after
reaching 100M households
VIDEO
*Pay TV service that allows subscribers to watch content online **Includes all respondents selecting “Unsure”, “Somewhat Unlikely,” and “Very Unlikely.” Sources: Activate analysis, Activate 2016 Consumer Tech & Media Research Study (n=4,000)
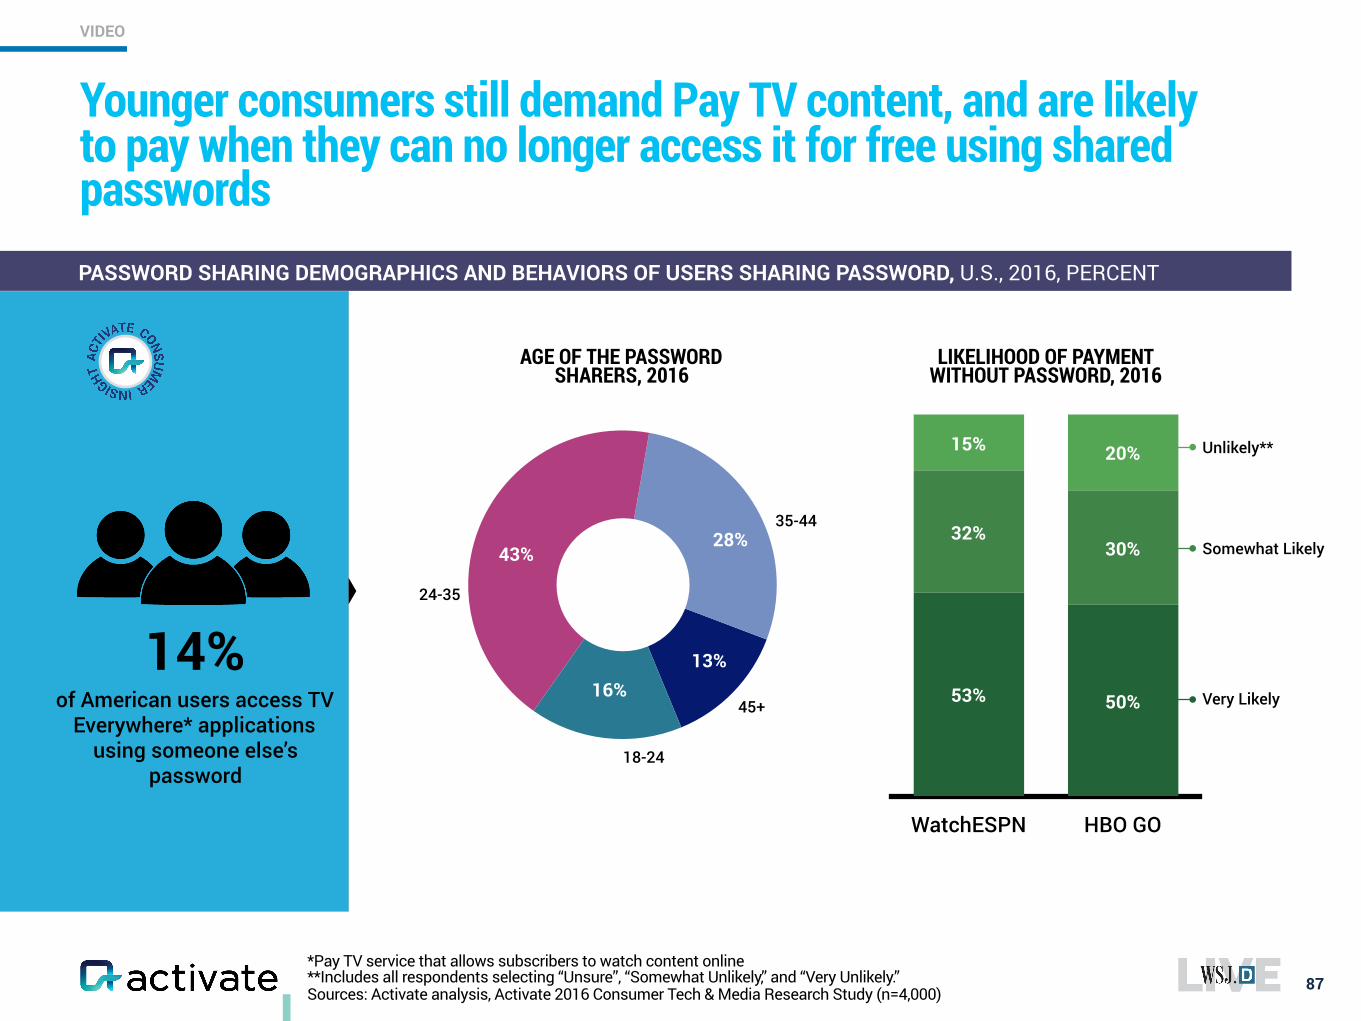
Younger consumers still demand Pay TV content, and are likely to pay when they can no longer access it for free using shared passwords
14% of American users access TV
Everywhere* applications using someone else’s
password
43%28%
WatchESPN HBO GO
20%15%
30%32%
50%53% Very Likely
Somewhat Likely
Unlikely**
AGE OF THE PASSWORD SHARERS, 2016
LIKELIHOOD OF PAYMENT WITHOUT PASSWORD, 2016
24-35
35-44
13%16%
18-24
45+
VIDEO
87
PASSWORD SHARING DEMOGRAPHICS AND BEHAVIORS OF USERS SHARING PASSWORD, U.S., 2016, PERCENT
88
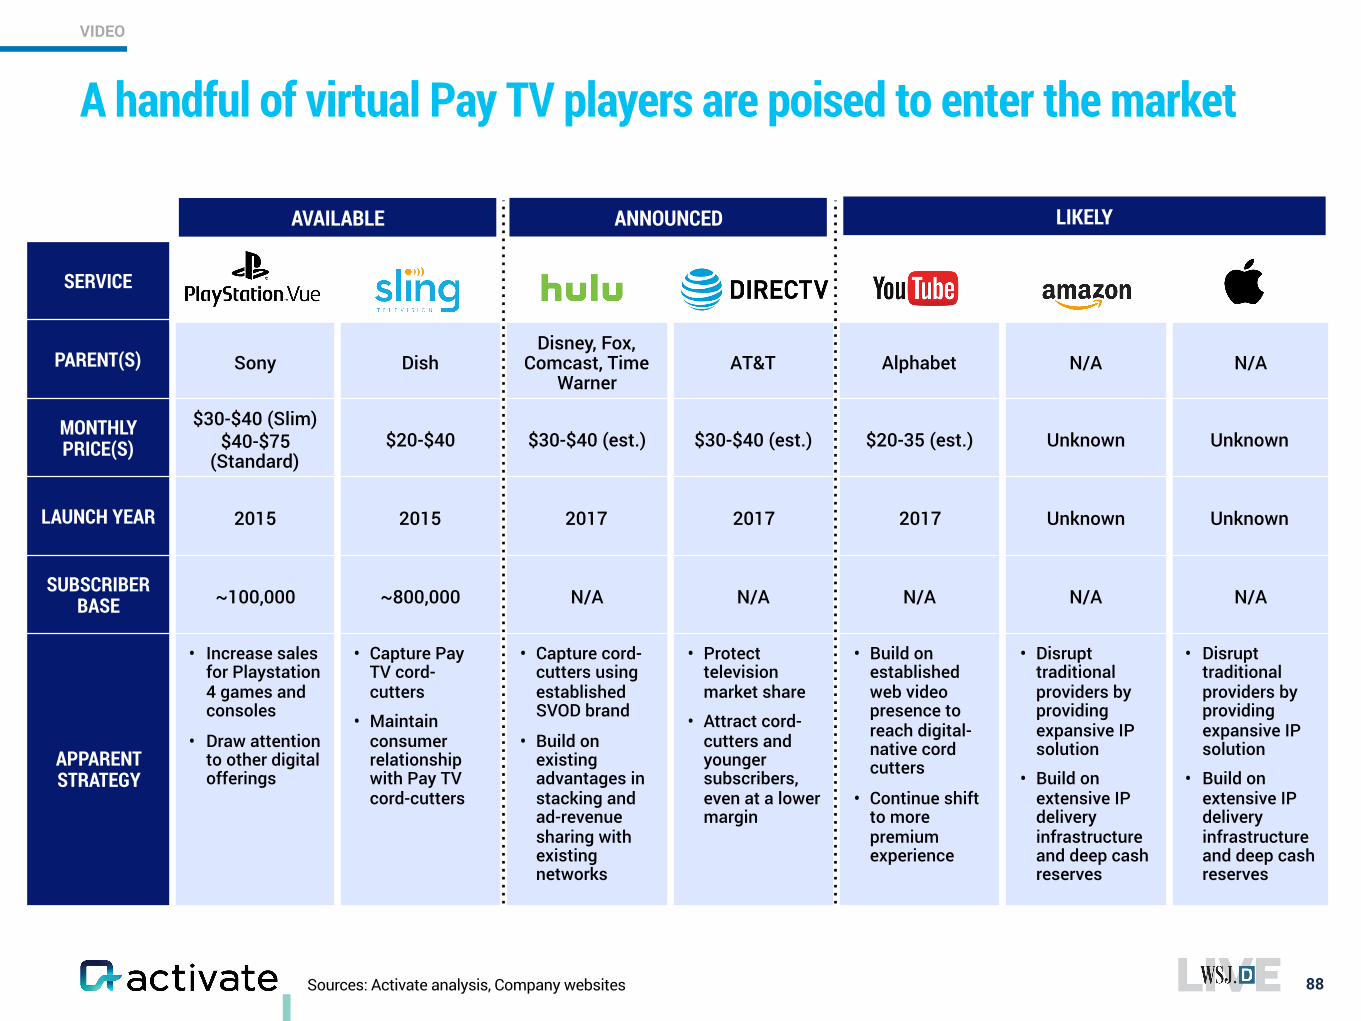
SERVICE
PARENT(S) Sony DishDisney, Fox,
Comcast, Time Warner
AT&T Alphabet N/A N/A
MONTHLY PRICE(S)
$30-$40 (Slim) $40-$75
(Standard)$20-$40 $30-$40 (est.) $30-$40 (est.) $20-35 (est.) Unknown Unknown
LAUNCH YEAR 2015 2015 2017 2017 2017 Unknown Unknown
SUBSCRIBER BASE ~100,000 ~800,000 N/A N/A N/A N/A N/A
APPARENT STRATEGY
• Increase sales for Playstation 4 games and consoles
• Draw attention to other digital offerings
• Capture Pay TV cord-cutters
• Maintain consumer relationship with Pay TV cord-cutters
• Capture cord-cutters using established SVOD brand
• Build on existing advantages in stacking and ad-revenue sharing with existing networks
• Protect television market share
• Attract cord-cutters and younger subscribers, even at a lower margin
• Build on established web video presence to reach digital-native cord cutters
• Continue shift to more premium experience
• Disrupt traditional providers by providing expansive IP solution
• Build on extensive IP delivery infrastructure and deep cash reserves
• Disrupt traditional providers by providing expansive IP solution
• Build on extensive IP delivery infrastructure and deep cash reserves
AVAILABLE ANNOUNCED LIKELY
A handful of virtual Pay TV players are poised to enter the market
VIDEO
Sources: Activate analysis, Company websites
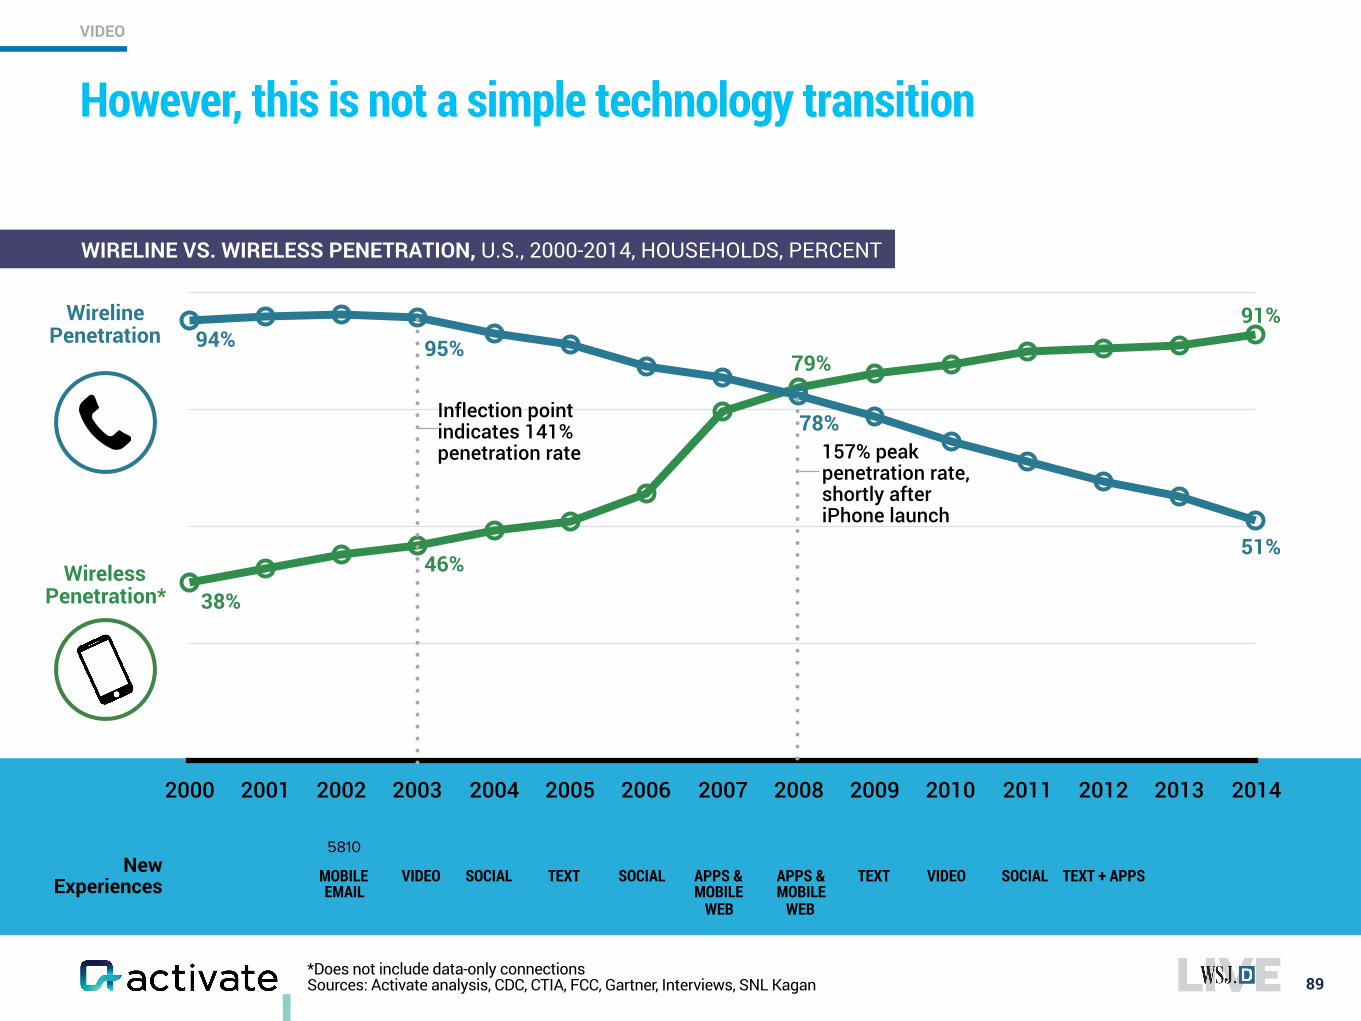
However, this is not a simple technology transition
5810New
Experiences VIDEO SOCIAL TEXT SOCIAL APPS &MOBILE
WEB
TEXT VIDEO SOCIAL TEXT + APPSAPPS &MOBILE
WEB
MOBILE EMAIL
*Does not include data-only connections Sources: Activate analysis, CDC, CTIA, FCC, Gartner, Interviews, SNL Kagan 89
WIRELINE VS. WIRELESS PENETRATION, U.S., 2000-2014, HOUSEHOLDS, PERCENT
25
50
75
100
2000 2001 2002 2003 2004 2005 2006 2007 2008 2009 2010 2011 2012 2013 2014
Wireline Penetration 94%
51%
91%
Wireless Penetration* 38%
157% peak penetration rate, shortly after iPhone launch
Inflection point indicates 141% penetration rate
VIDEO
95%
46%
78%
79%
Sources: Activate analysis, Experian, Leichtman Research Group, U.S. Census Bureau
Cord-cutting is highly unlikely to follow the same pattern as telephones
90
PAY TV AND SUBSCRIPTION OTT HOUSEHOLD PENETRATION RATES, U.S., 2010-2022E, PERCENT
VIDEO
25
50
75
100
2010 2011 2012 2013 2014 2015 2016 2017E 2018E 2019E 2020E 2021E 2022E
PAY TV PENETRATION
DIGITAL SUBSCRIPTION (OTT) HOUSEHOLDS
✘
E
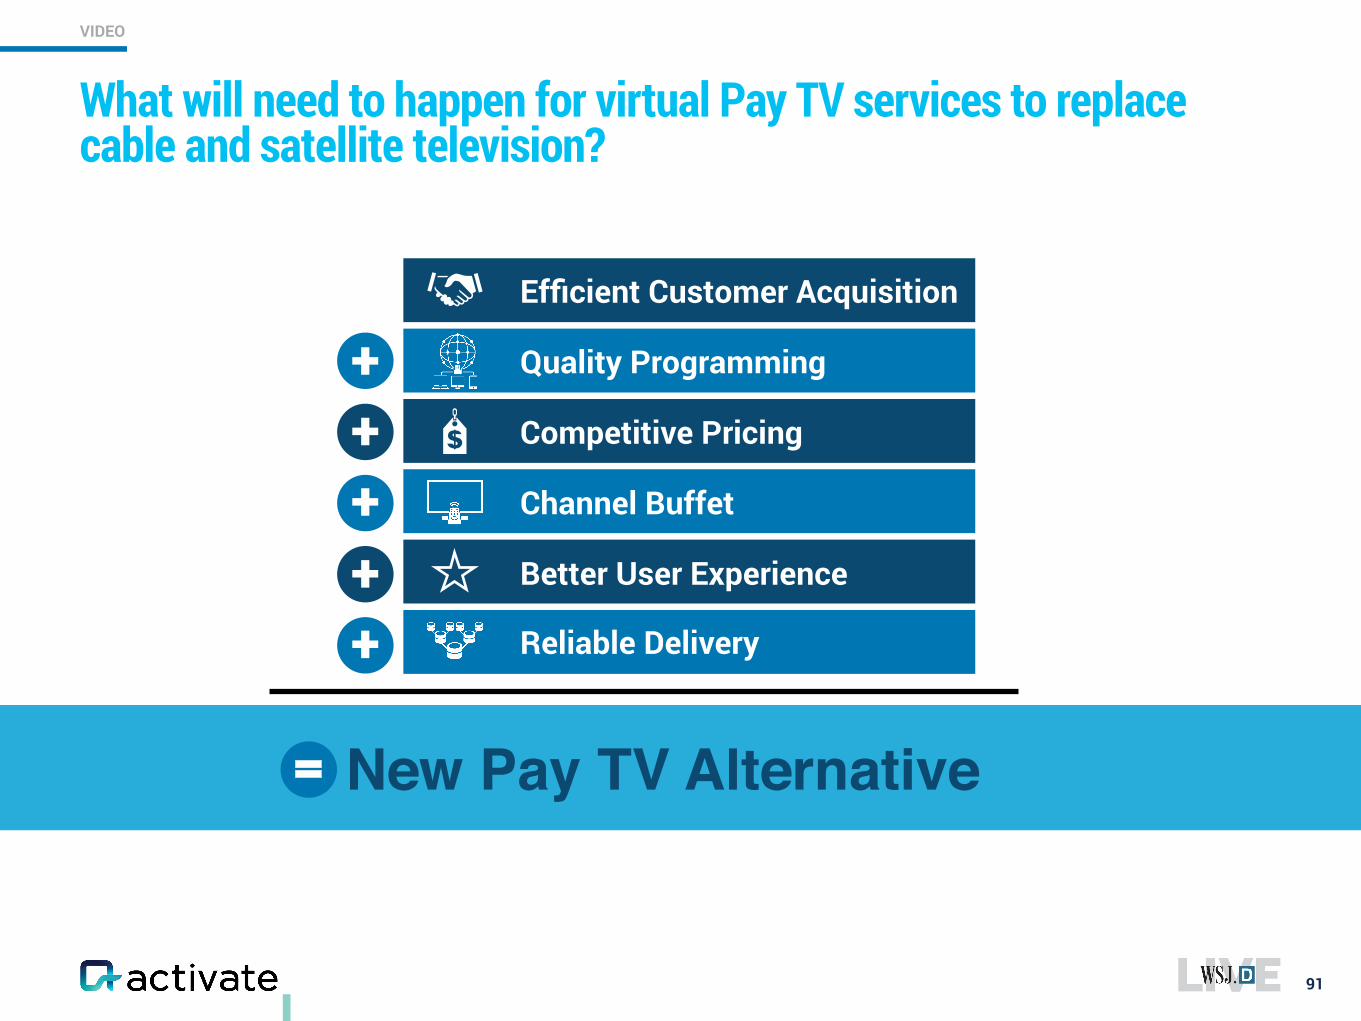
What will need to happen for virtual Pay TV services to replace cable and satellite television?
91
VIDEO
Better User Experience
Channel Buffet
Competitive Pricing
Efficient Customer Acquisition
Reliable Delivery
Quality Programming
+++++
New Pay TV Alternative
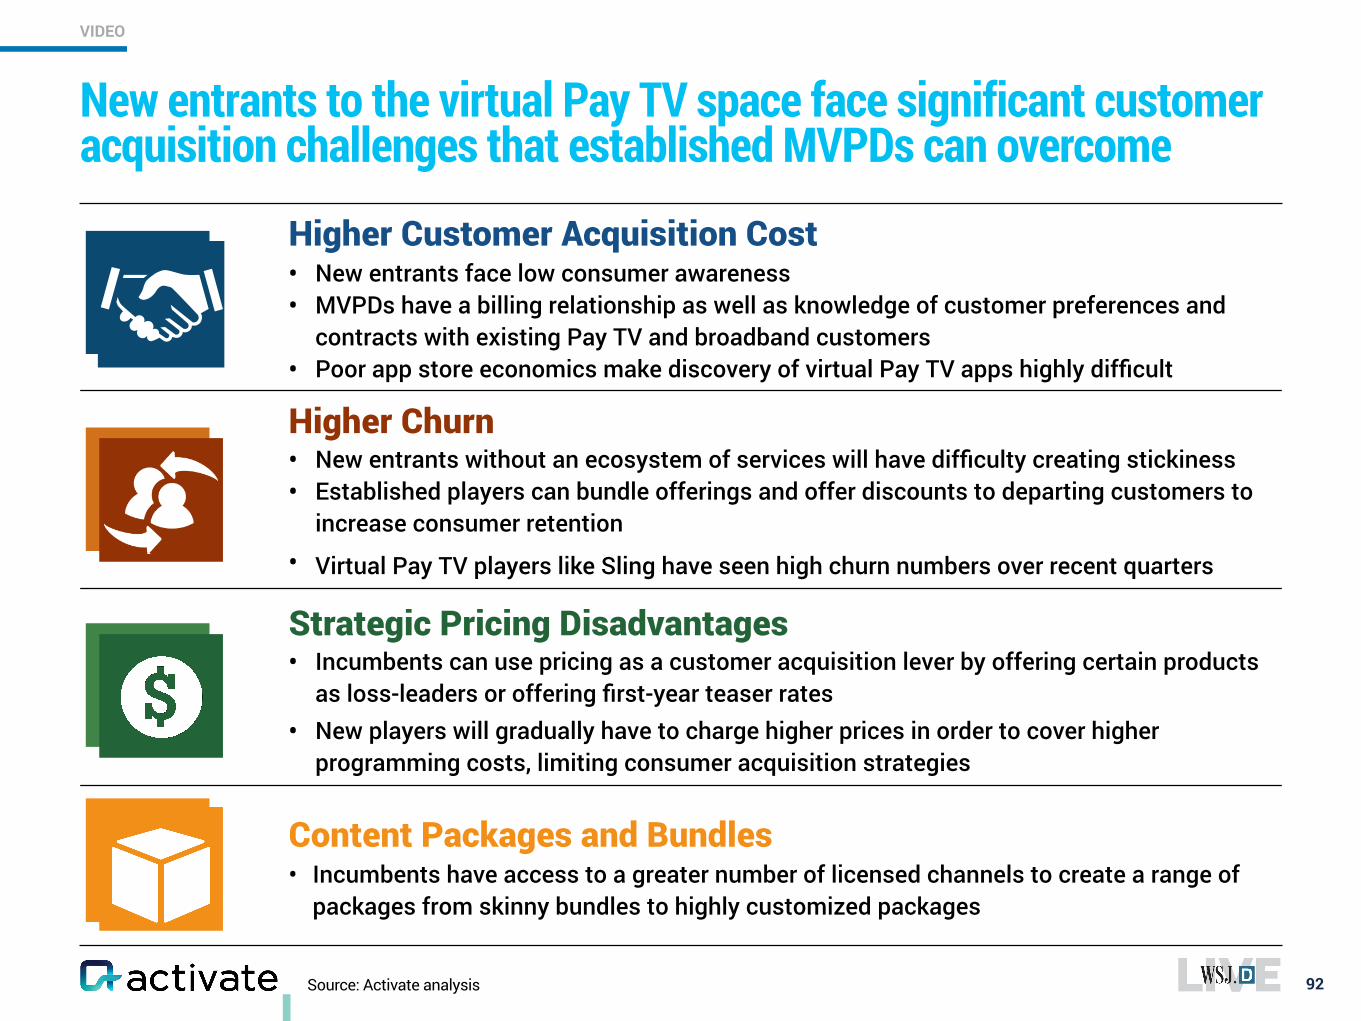
Higher Customer Acquisition Cost • New entrants face low consumer awareness • MVPDs have a billing relationship as well as knowledge of customer preferences and
contracts with existing Pay TV and broadband customers • Poor app store economics make discovery of virtual Pay TV apps highly difficult
Higher Churn • New entrants without an ecosystem of services will have difficulty creating stickiness • Established players can bundle offerings and offer discounts to departing customers to
increase consumer retention • Virtual Pay TV players like Sling have seen high churn numbers over recent quarters Strategic Pricing Disadvantages • Incumbents can use pricing as a customer acquisition lever by offering certain products
as loss-leaders or offering first-year teaser rates • New players will gradually have to charge higher prices in order to cover higher
programming costs, limiting consumer acquisition strategies
Content Packages and Bundles • Incumbents have access to a greater number of licensed channels to create a range of
packages from skinny bundles to highly customized packages
92
New entrants to the virtual Pay TV space face significant customer acquisition challenges that established MVPDs can overcome
VIDEO
Source: Activate analysis
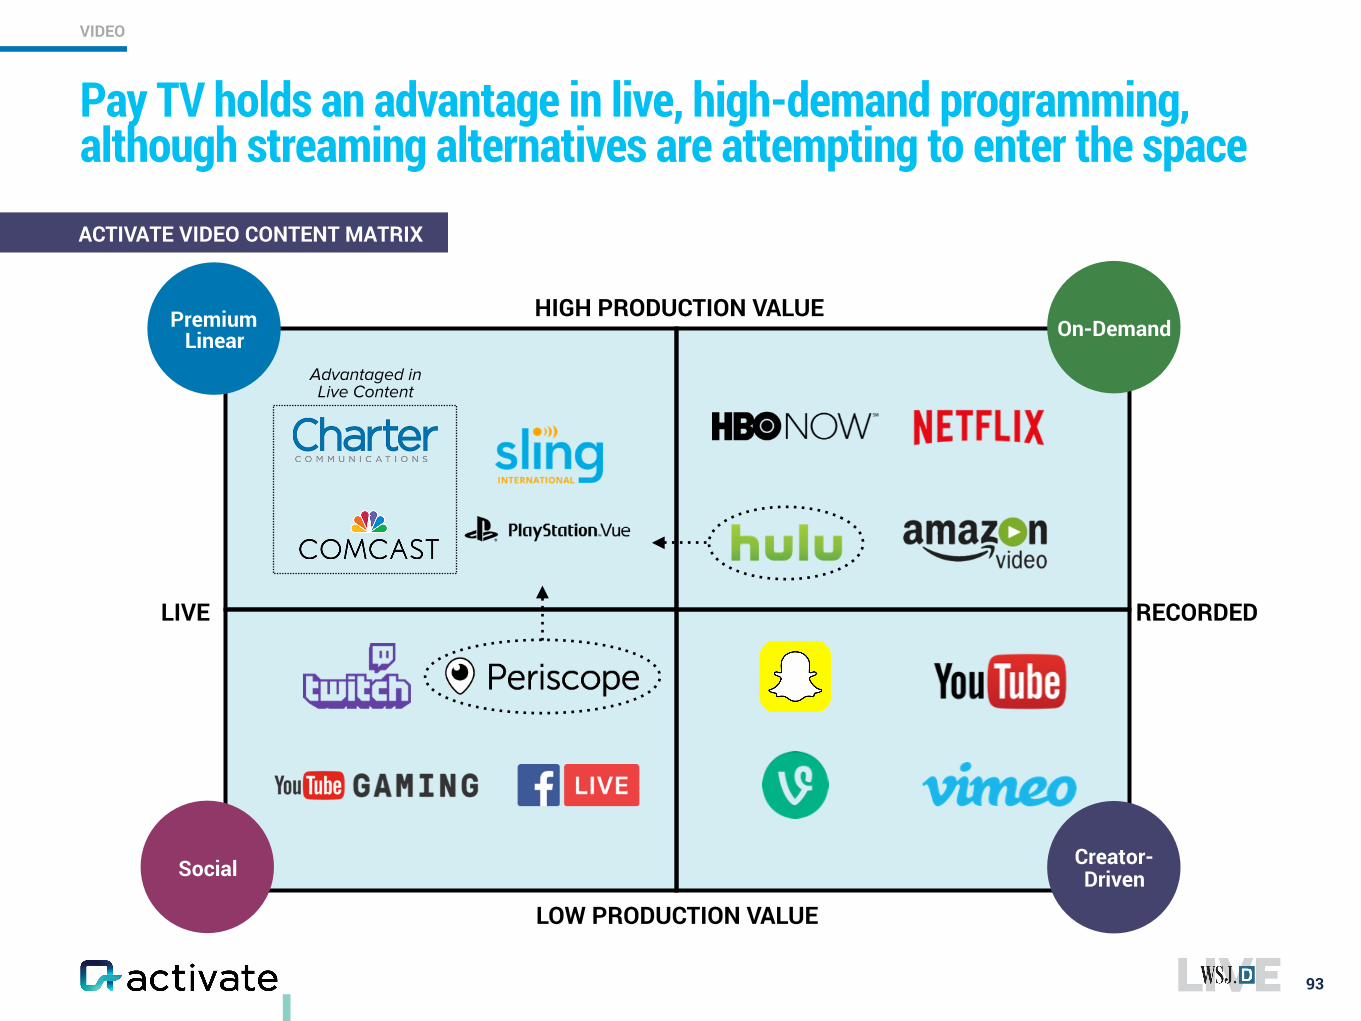
Pay TV holds an advantage in live, high-demand programming, although streaming alternatives are attempting to enter the space
93
VIDEO
RECORDEDLIVE
HIGH PRODUCTION VALUE
LOW PRODUCTION VALUE
Social
On-DemandPremium Linear
Creator-Driven
Advantaged in Live Content
ACTIVATE VIDEO CONTENT MATRIX
94
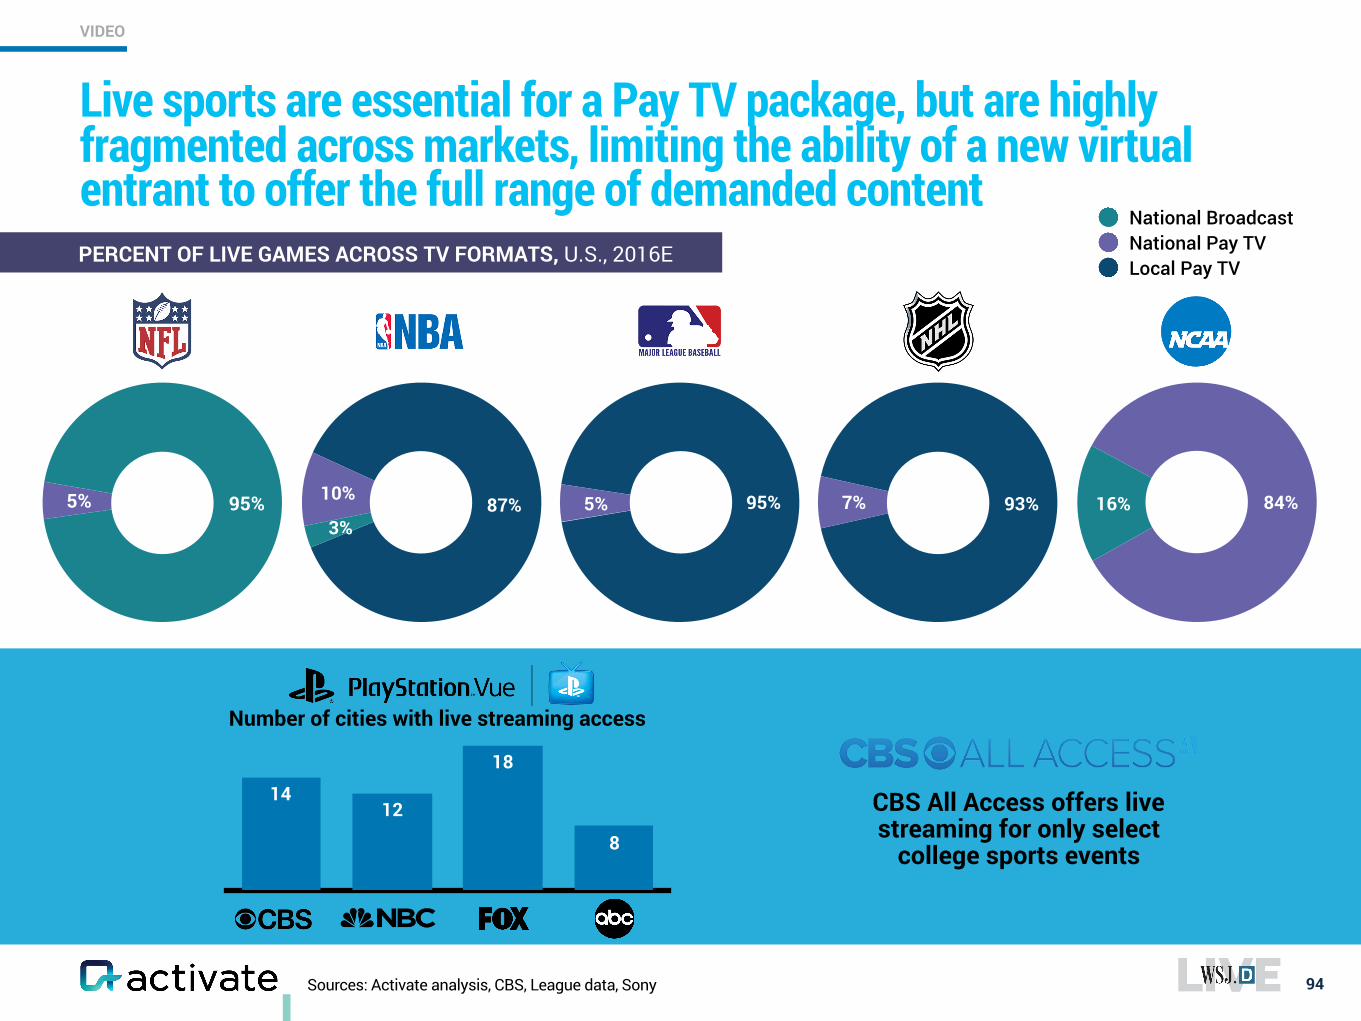
PERCENT OF LIVE GAMES ACROSS TV FORMATS, U.S., 2016E
5% 95%
National BroadcastNational Pay TVLocal Pay TV
87%10%
3%95%5% 93%7% 84%16%
8
18
1214
Number of cities with live streaming access
CBS All Access offers live streaming for only select
college sports events
Live sports are essential for a Pay TV package, but are highly fragmented across markets, limiting the ability of a new virtual entrant to offer the full range of demanded content
Sources: Activate analysis, CBS, League data, Sony
VIDEO
*Monthly prices, 2015 and 2016 extrapolated from historical trends Sources: Activate analysis, Activate 2016 Consumer Tech & Media Research Study (n=4,000), FCC
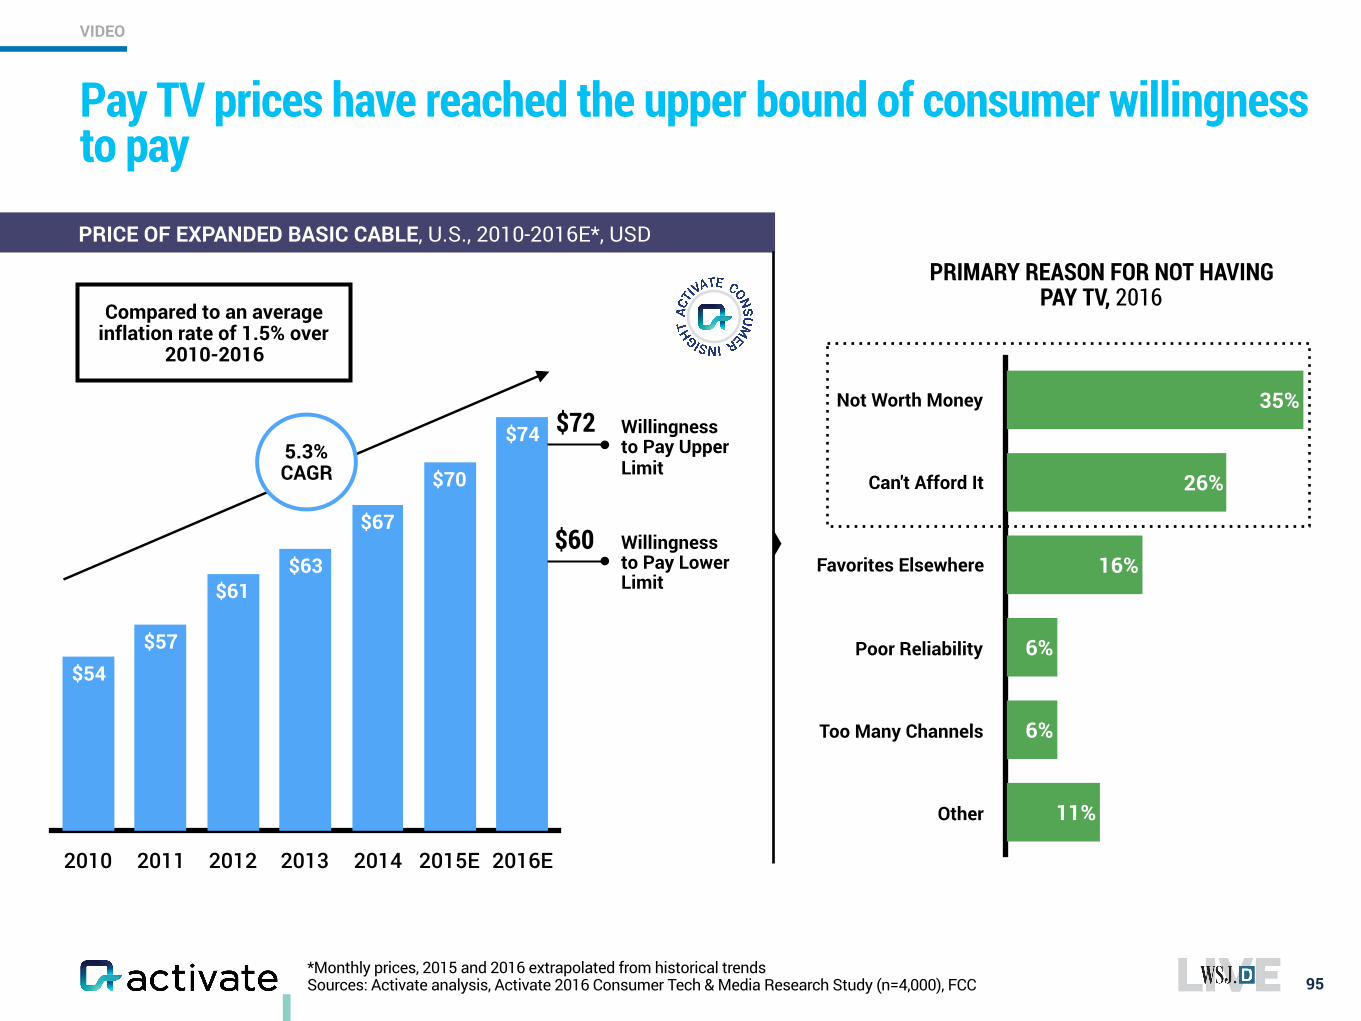
Pay TV prices have reached the upper bound of consumer willingness to pay
95
PRICE OF EXPANDED BASIC CABLE, U.S., 2010-2016E*, USD
2010 2011 2012 2013 2014 2015E 2016E
$74
$70
$67
$63$61
$57$54
5.3% CAGR
Compared to an average inflation rate of 1.5% over
2010-2016
Not Worth Money
Can't Afford It
Favorites Elsewhere
Poor Reliability
Too Many Channels
Other 11%
6%
6%
16%
26%
35%
PRIMARY REASON FOR NOT HAVING PAY TV, 2016
Willingness to Pay Lower Limit
Willingness to Pay Upper Limit
$72
$60
VIDEO
Sources: Activate analysis, Activate 2016 Consumer Tech & Media Research Study (n=4,000)
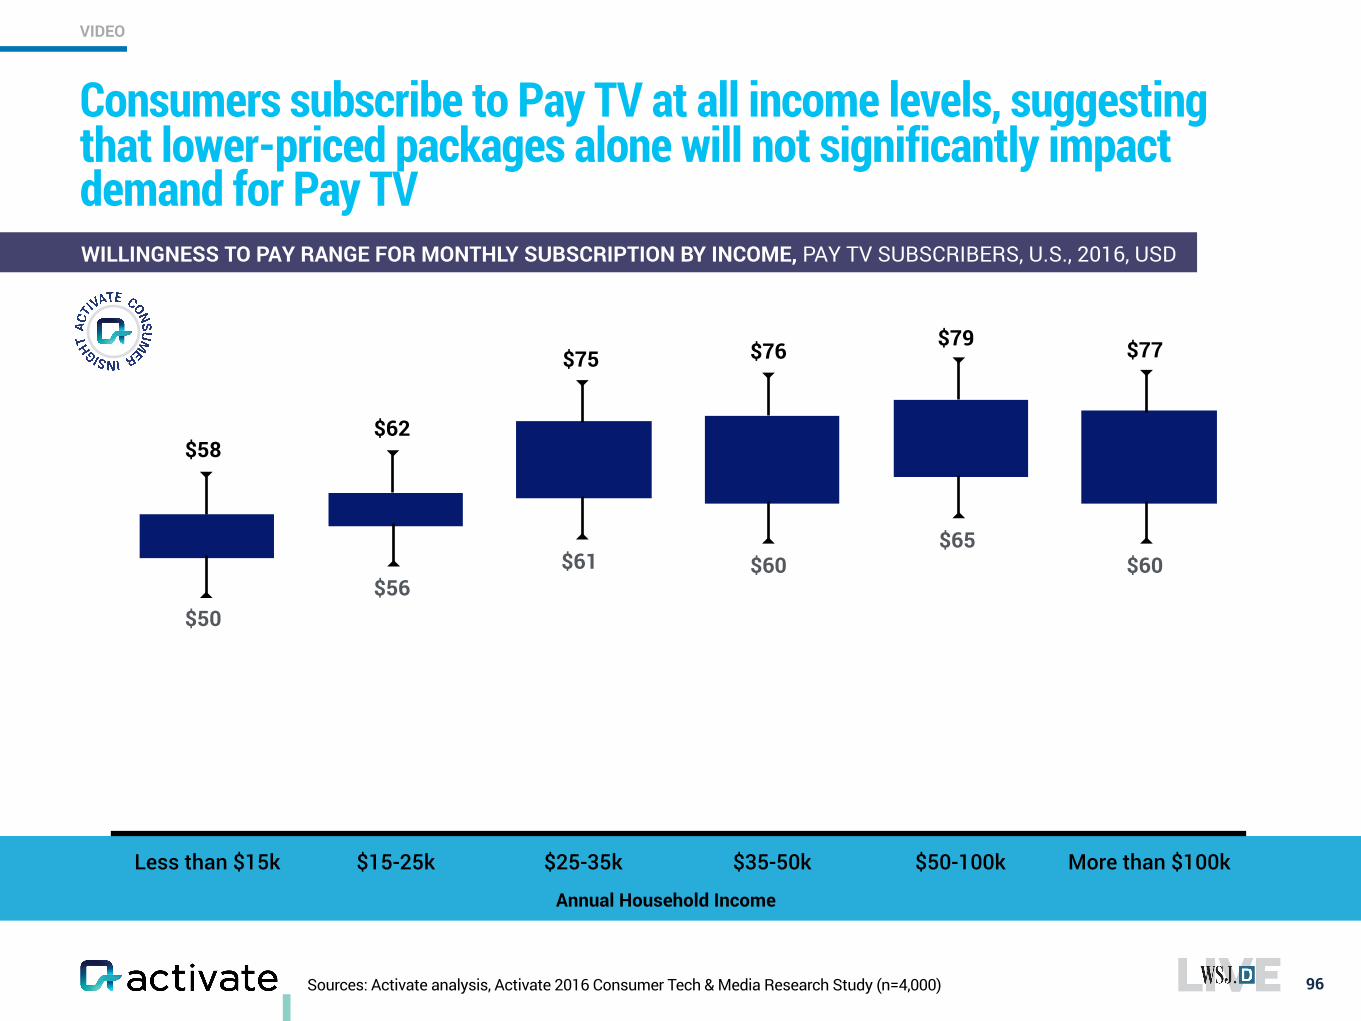
Consumers subscribe to Pay TV at all income levels, suggesting that lower-priced packages alone will not significantly impact demand for Pay TV
96
WILLINGNESS TO PAY RANGE FOR MONTHLY SUBSCRIPTION BY INCOME, PAY TV SUBSCRIBERS, U.S., 2016, USD
Less than $15k $15-25k $25-35k $35-50k $50-100k More than $100k
$50$56
$61 $60$65
$60
$58$62
$75 $76 $79 $77
VIDEO
Annual Household Income
Sources: Activate analysis, Activate 2016 Consumer Tech & Media Research Study (n=4,000)
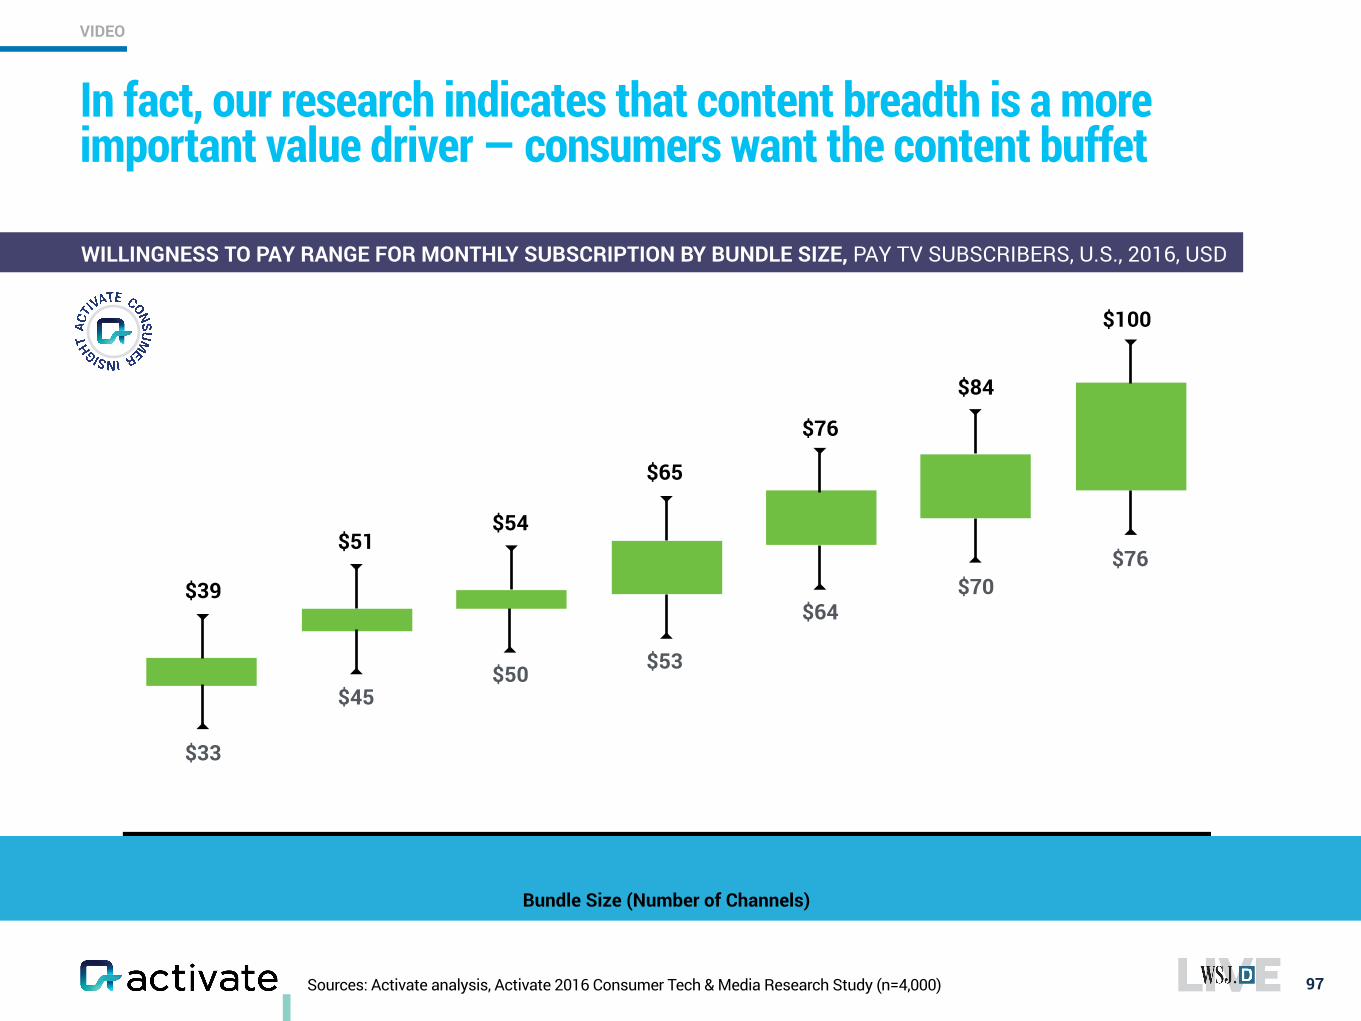
In fact, our research indicates that content breadth is a more important value driver — consumers want the content buffet
97
0-25 25-50 50-75 75-100 100-200 200-300 300+
$33
$45$50 $53
$64$70
$76$39
$51$54
$65
$76
$84
$100
VIDEO
WILLINGNESS TO PAY RANGE FOR MONTHLY SUBSCRIPTION BY BUNDLE SIZE, PAY TV SUBSCRIBERS, U.S., 2016, USD
Bundle Size (Number of Channels)
Sources: Activate analysis, Activate 2016 Consumer Tech & Media Research Study (n=4,000)
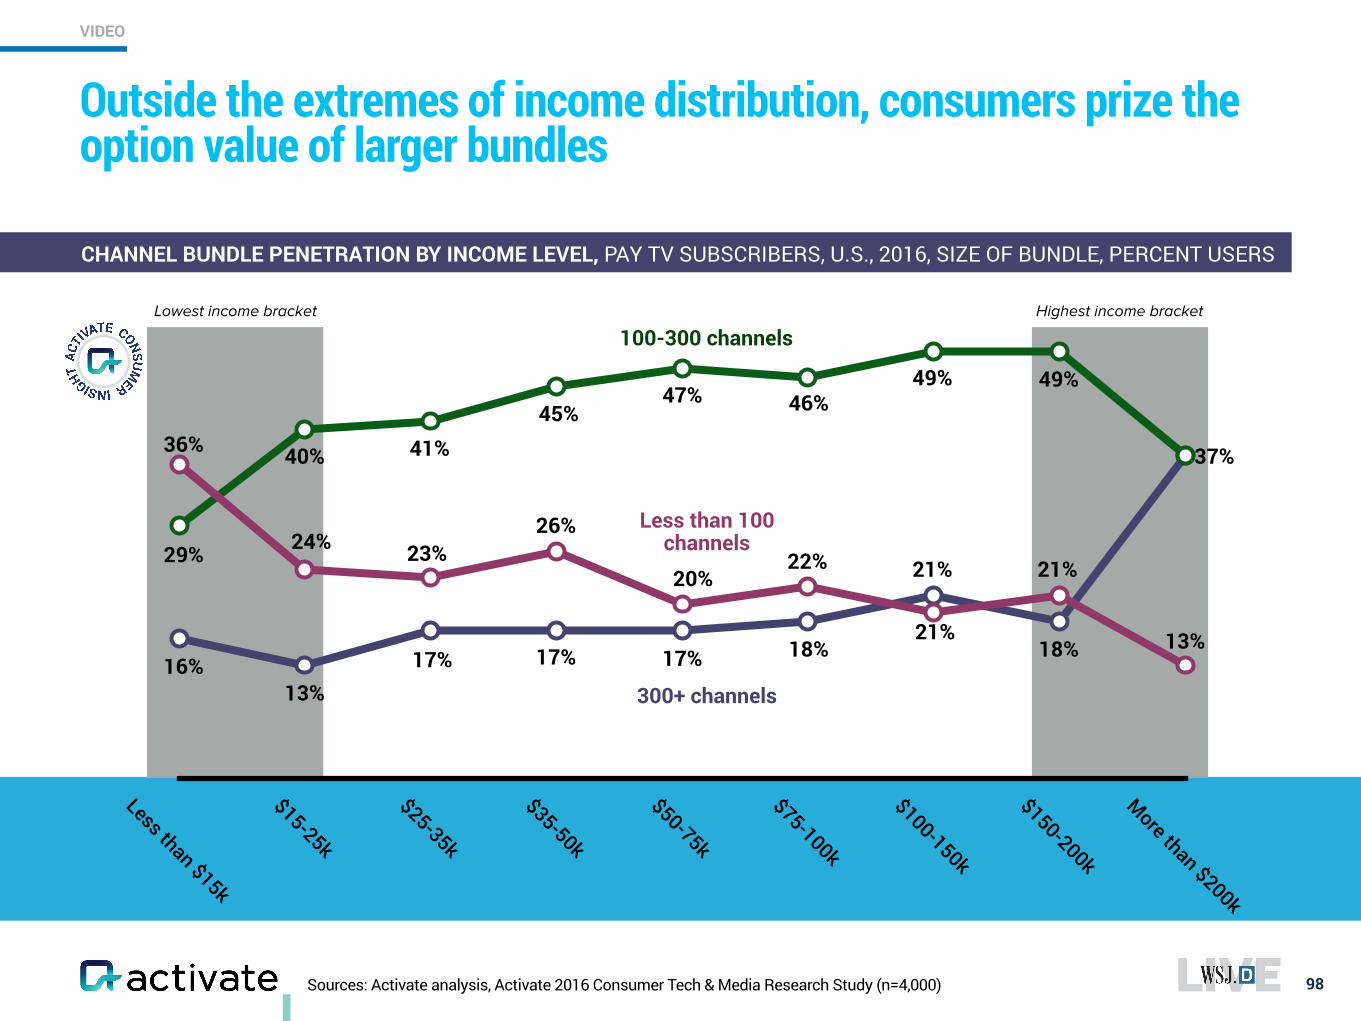
Outside the extremes of income distribution, consumers prize the option value of larger bundles
98
CHANNEL BUNDLE PENETRATION BY INCOME LEVEL, PAY TV SUBSCRIBERS, U.S., 2016, SIZE OF BUNDLE, PERCENT USERS
Less than $15k
$15-25k
$25-35k
$35-50k
$50-75k
$75-100k
$100-150k
$150-200k
More than $200k
Lowest income bracket Highest income bracket
100-300 channels
300+ channels
Less than 100 channels
VIDEO
36%
24% 23%26%
20%22% 21% 21%
13%16%
13%17% 17% 17% 18%
21%18%
29%
40% 41%45%
47% 46%49% 49%
37%
Sources: Activate analysis, AT&T, Charter, Comcast, Time Warner Cable, Verizon
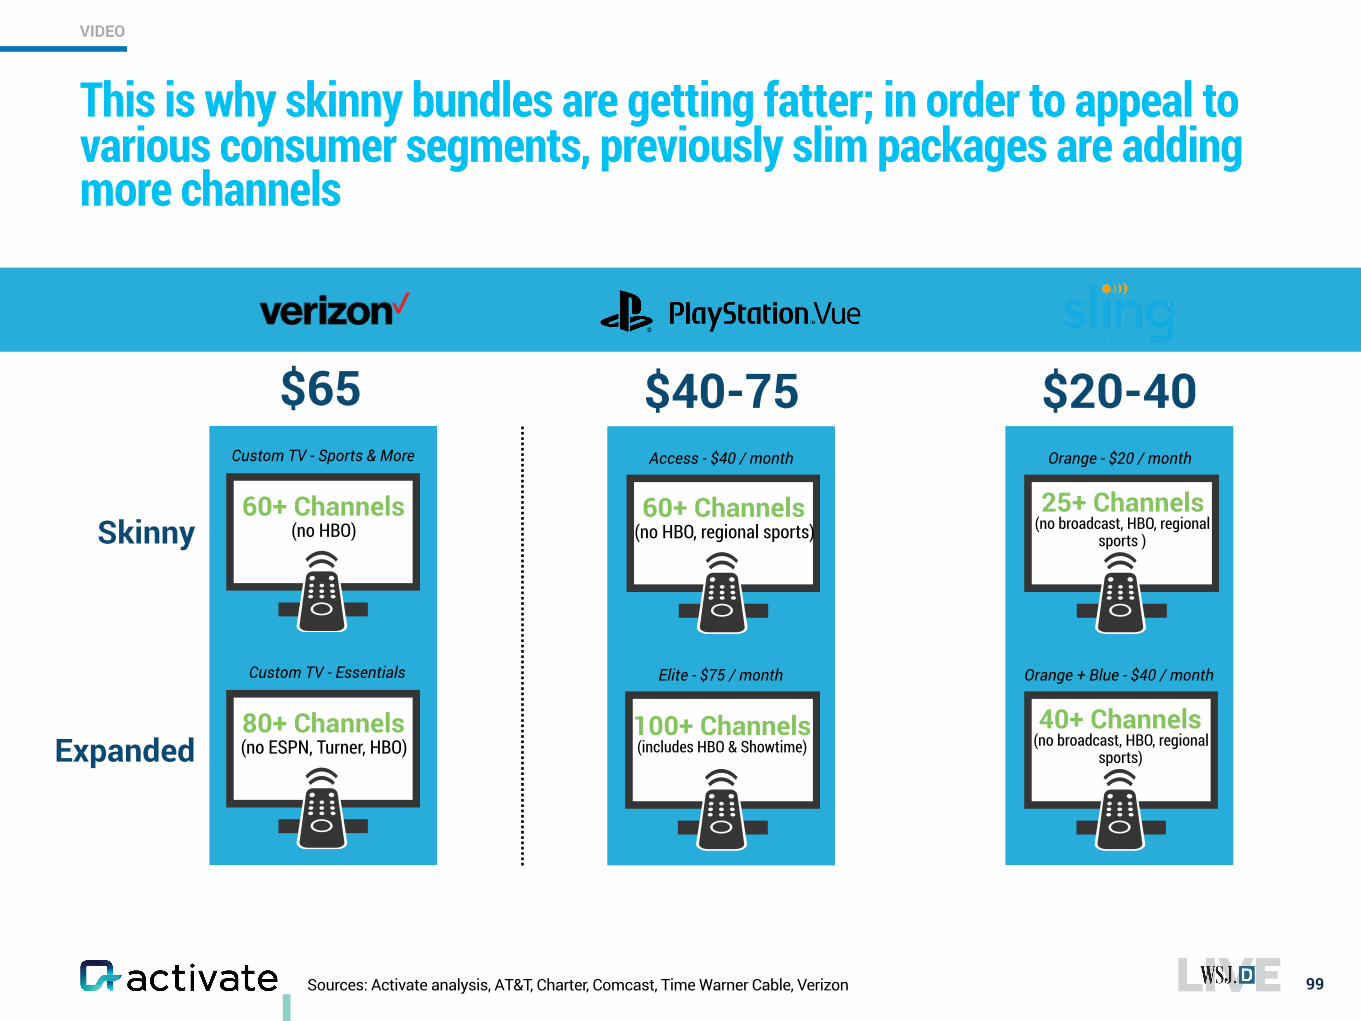
This is why skinny bundles are getting fatter; in order to appeal to various consumer segments, previously slim packages are adding more channels
99
$65 $40-75
80+ Channels (no ESPN, Turner, HBO)
Custom TV - Essentials
60+ Channels (no HBO)
Custom TV - Sports & More
60+ Channels (no HBO, regional sports)
Access - $40 / month
100+ Channels (includes HBO & Showtime)
Elite - $75 / month
$20-40
25+ Channels (no broadcast, HBO, regional
sports )
Orange - $20 / month
40+ Channels (no broadcast, HBO, regional
sports)
Orange + Blue - $40 / month
Skinny
Expanded
VIDEO
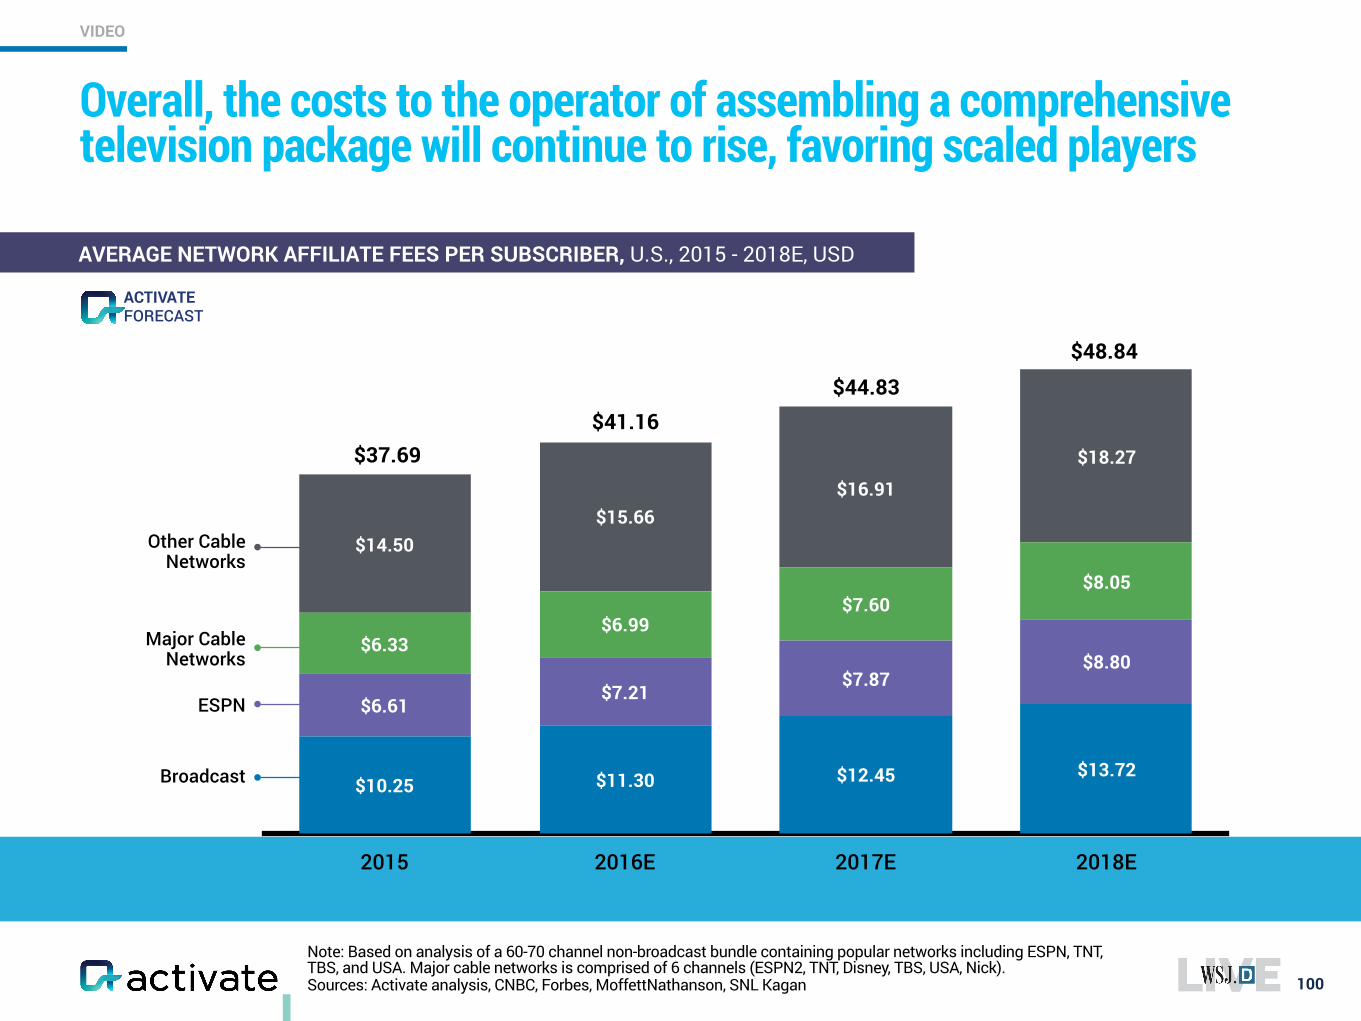
$25.01
2015 2016E 2017E 2018E
$18.27
$16.91$15.66
$14.50
$8.05$7.60
$6.99$6.33
$8.80$7.87
$7.21$6.61
$13.72$12.45$11.30$10.25
$41.16$44.83
$48.84
100
AVERAGE NETWORK AFFILIATE FEES PER SUBSCRIBER, U.S., 2015 - 2018E, USD
Broadcast
ESPN
Major Cable Networks
$37.69
Other Cable Networks
Overall, the costs to the operator of assembling a comprehensive television package will continue to rise, favoring scaled players
Note: Based on analysis of a 60-70 channel non-broadcast bundle containing popular networks including ESPN, TNT, TBS, and USA. Major cable networks is comprised of 6 channels (ESPN2, TNT, Disney, TBS, USA, Nick). Sources: Activate analysis, CNBC, Forbes, MoffettNathanson, SNL Kagan
FORECASTACTIVATE
VIDEO
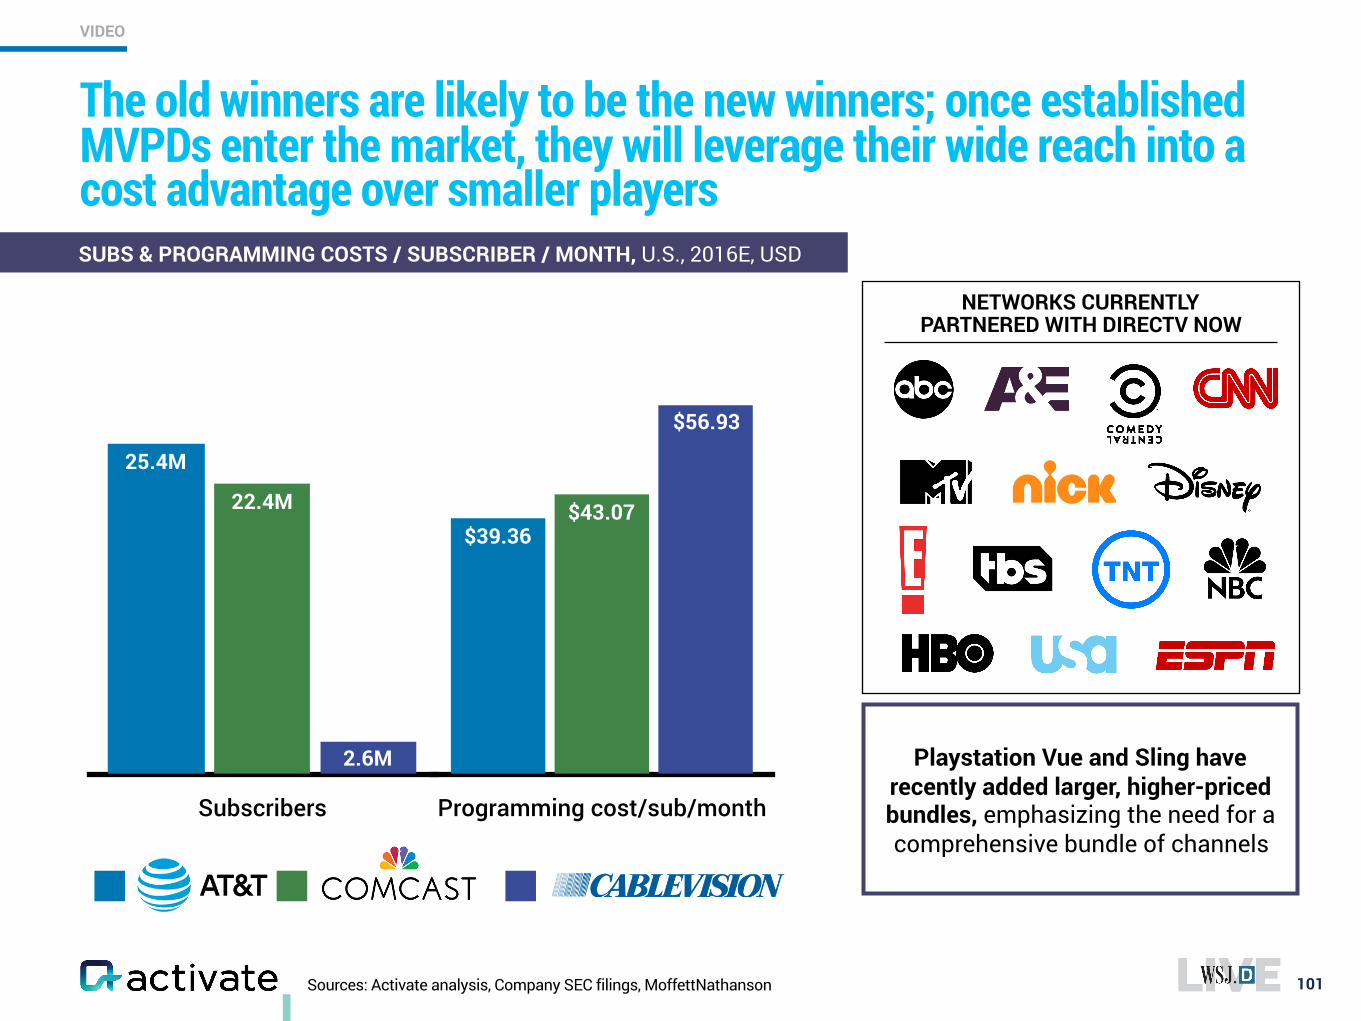
Sources: Activate analysis, Company SEC filings, MoffettNathanson 101
SUBS & PROGRAMMING COSTS / SUBSCRIBER / MONTH, U.S., 2016E, USD
NETWORKS CURRENTLY PARTNERED WITH DIRECTV NOW
Playstation Vue and Sling have recently added larger, higher-priced bundles, emphasizing the need for a comprehensive bundle of channels
Subscribers
2.6M
22.4M
25.4M
Programming cost/sub/month
$56.93
$43.07$39.36
AT&T Comcast Cablevision
The old winners are likely to be the new winners; once established MVPDs enter the market, they will leverage their wide reach into a cost advantage over smaller players
VIDEO
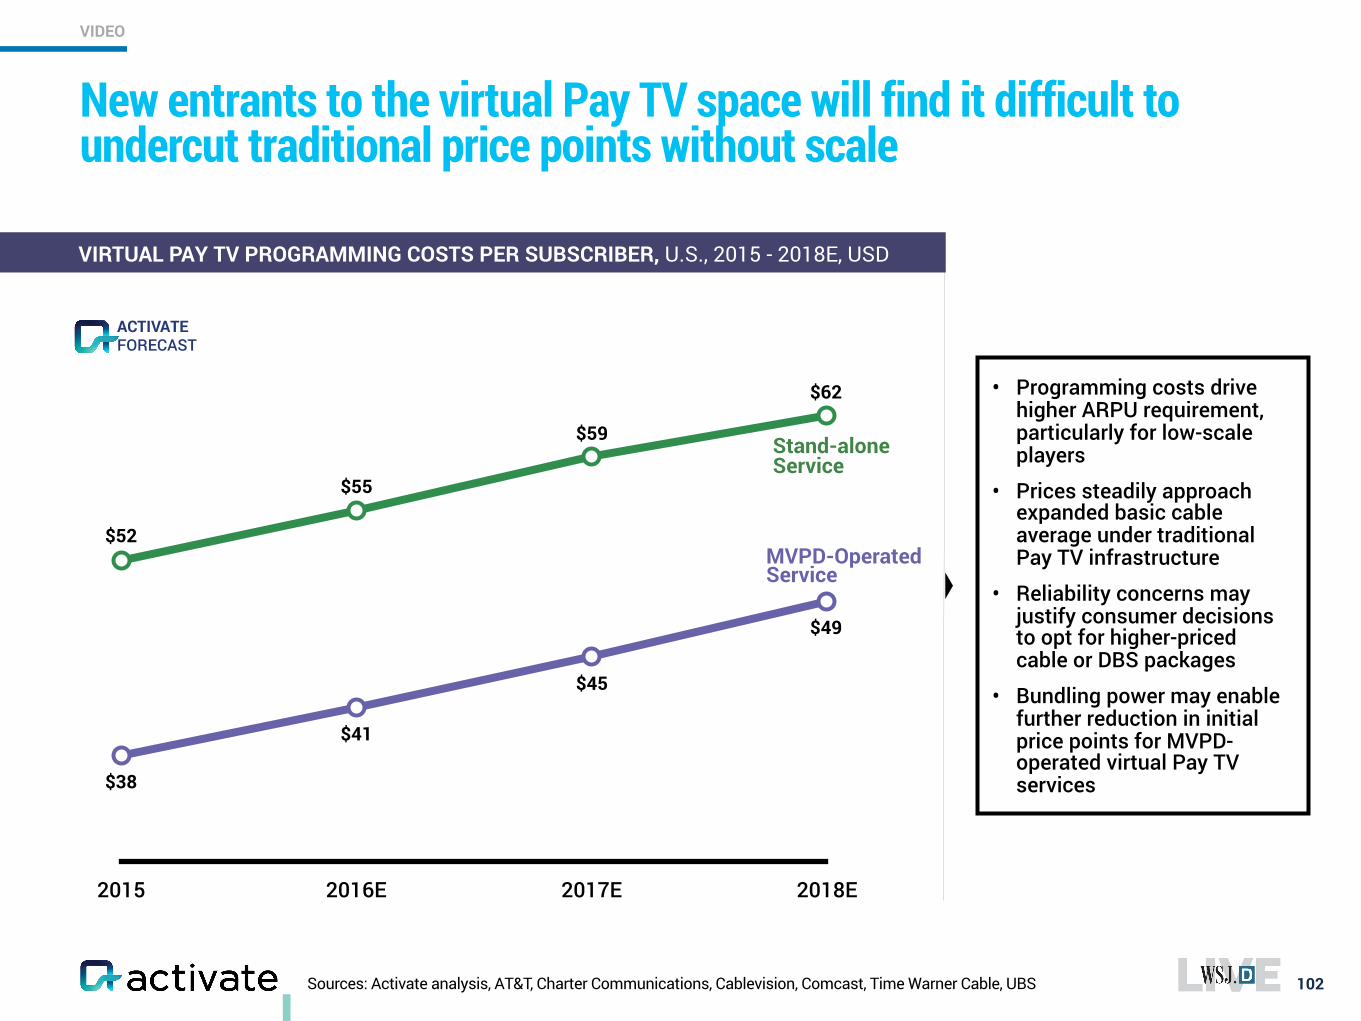
102
VIRTUAL PAY TV PROGRAMMING COSTS PER SUBSCRIBER, U.S., 2015 - 2018E, USD
2015 2016E 2017E 2018E
$52
$55
$59
$62
$38
$41
$45
$49
• Programming costs drive higher ARPU requirement, particularly for low-scale players
• Prices steadily approach expanded basic cable average under traditional Pay TV infrastructure
• Reliability concerns may justify consumer decisions to opt for higher-priced cable or DBS packages
• Bundling power may enable further reduction in initial price points for MVPD-operated virtual Pay TV services
Stand-alone Service
MVPD-Operated Service
New entrants to the virtual Pay TV space will find it difficult to undercut traditional price points without scale
Sources: Activate analysis, AT&T, Charter Communications, Cablevision, Comcast, Time Warner Cable, UBS
FORECASTACTIVATE
VIDEO
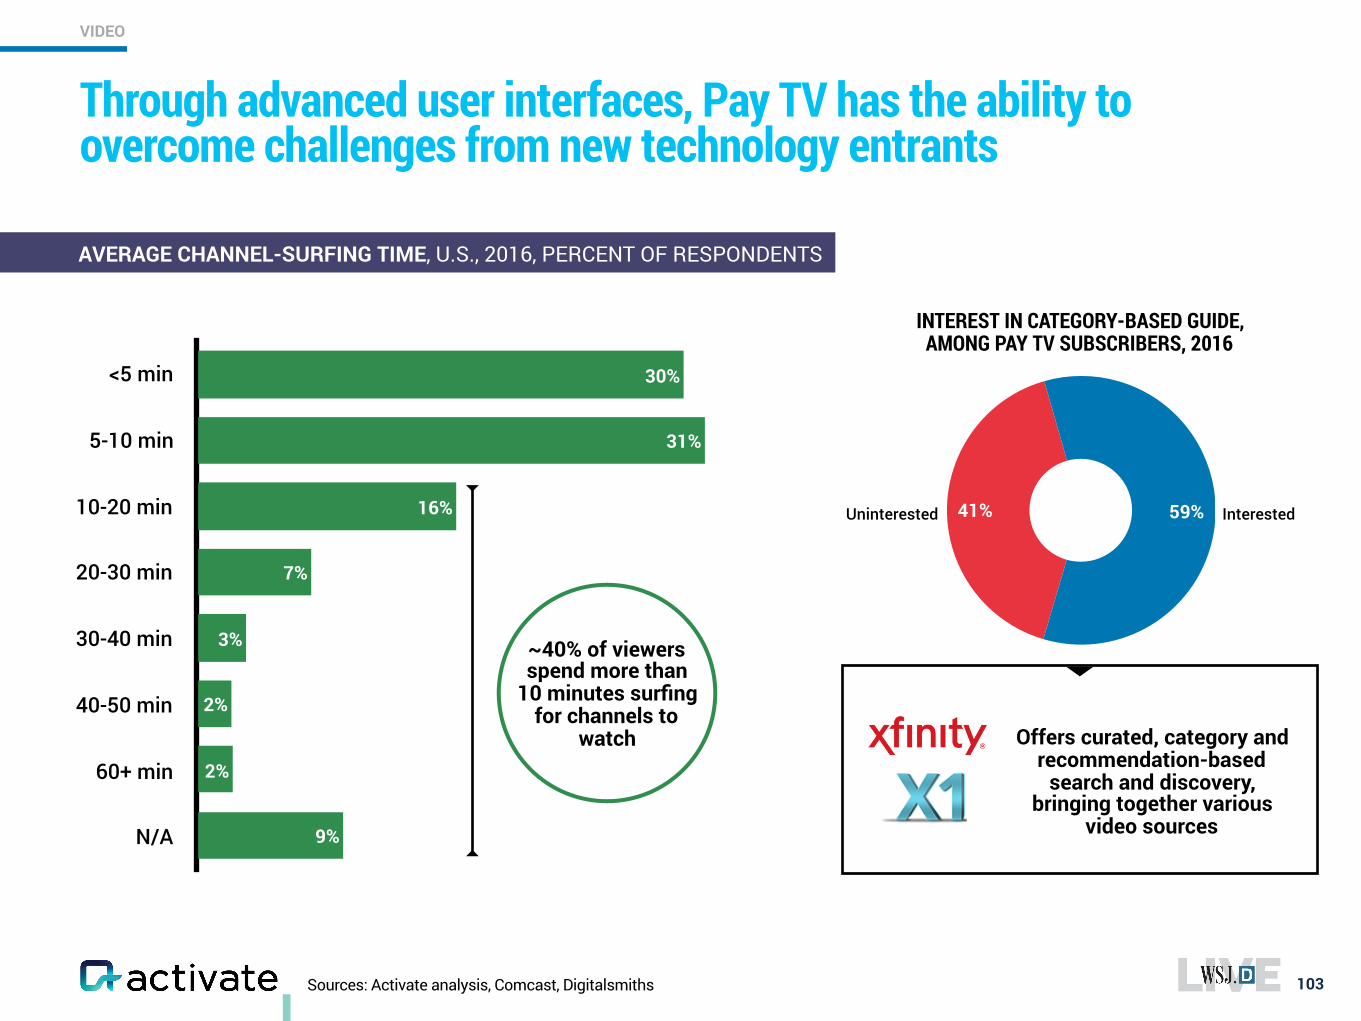
Sources: Activate analysis, Comcast, Digitalsmiths
Through advanced user interfaces, Pay TV has the ability to overcome challenges from new technology entrants
103
AVERAGE CHANNEL-SURFING TIME, U.S., 2016, PERCENT OF RESPONDENTS
<5 min
5-10 min
10-20 min
20-30 min
30-40 min
40-50 min
60+ min
N/A 9%
2%
2%
3%
7%
16%
31%
30%
~40% of viewers spend more than
10 minutes surfing for channels to
watch
41% 59% InterestedUninterested
INTEREST IN CATEGORY-BASED GUIDE, AMONG PAY TV SUBSCRIBERS, 2016
Offers curated, category and recommendation-based
search and discovery, bringing together various
video sources
VIDEO
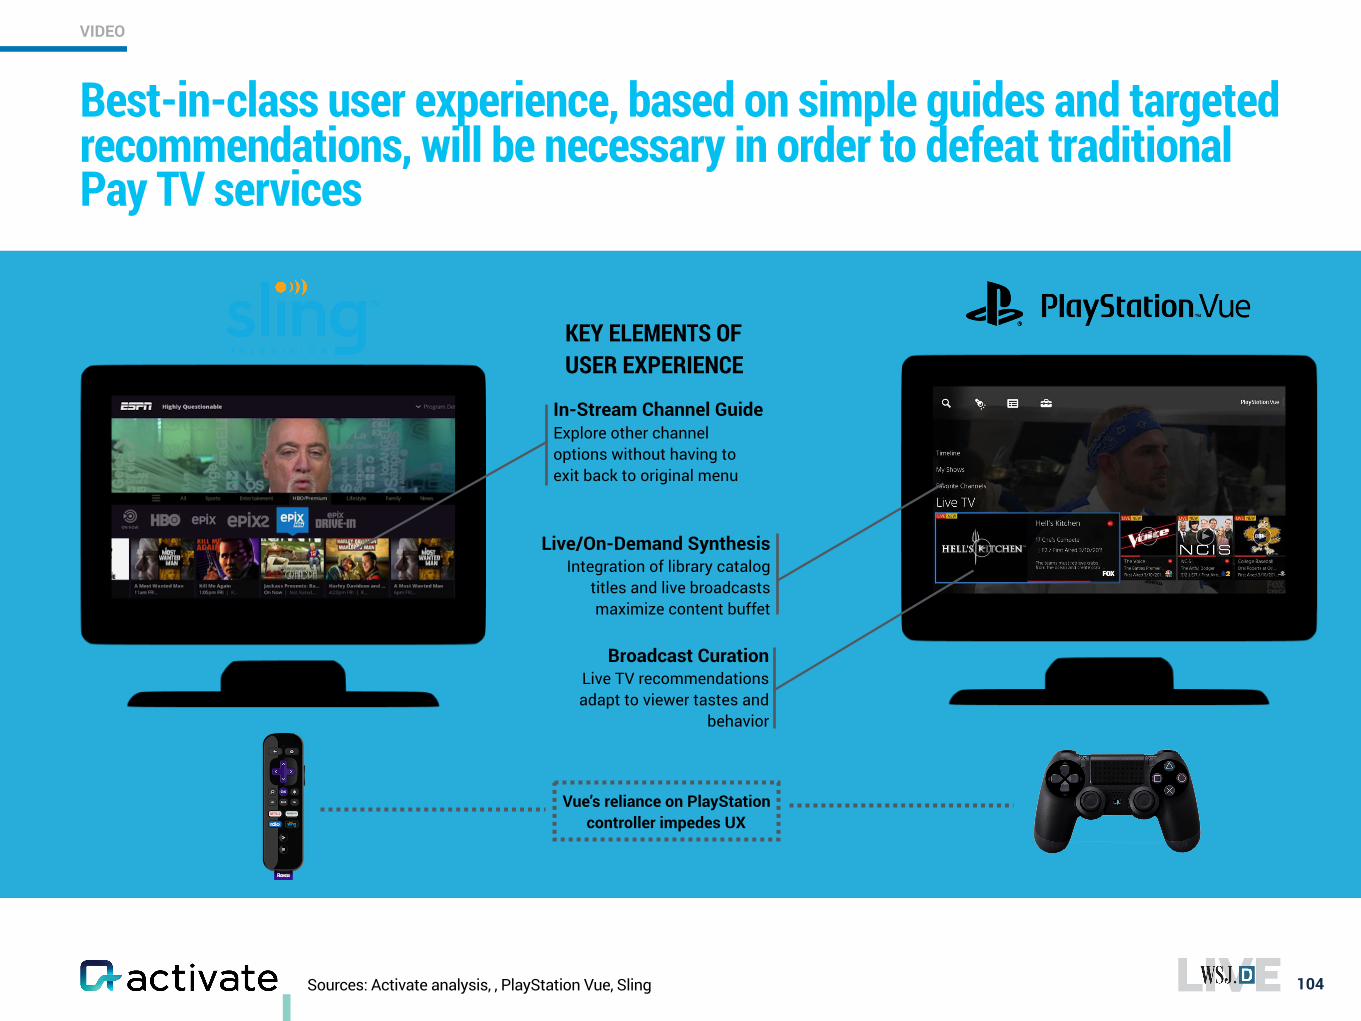
Sources: Activate analysis, , PlayStation Vue, Sling
Best-in-class user experience, based on simple guides and targeted recommendations, will be necessary in order to defeat traditional Pay TV services
104
VIDEO
Broadcast Curation Live TV recommendations adapt to viewer tastes and
behavior
Live/On-Demand Synthesis Integration of library catalog
titles and live broadcasts maximize content buffet
In-Stream Channel Guide Explore other channel options without having to exit back to original menu
KEY ELEMENTS OF USER EXPERIENCE
Vue’s reliance on PlayStation controller impedes UX
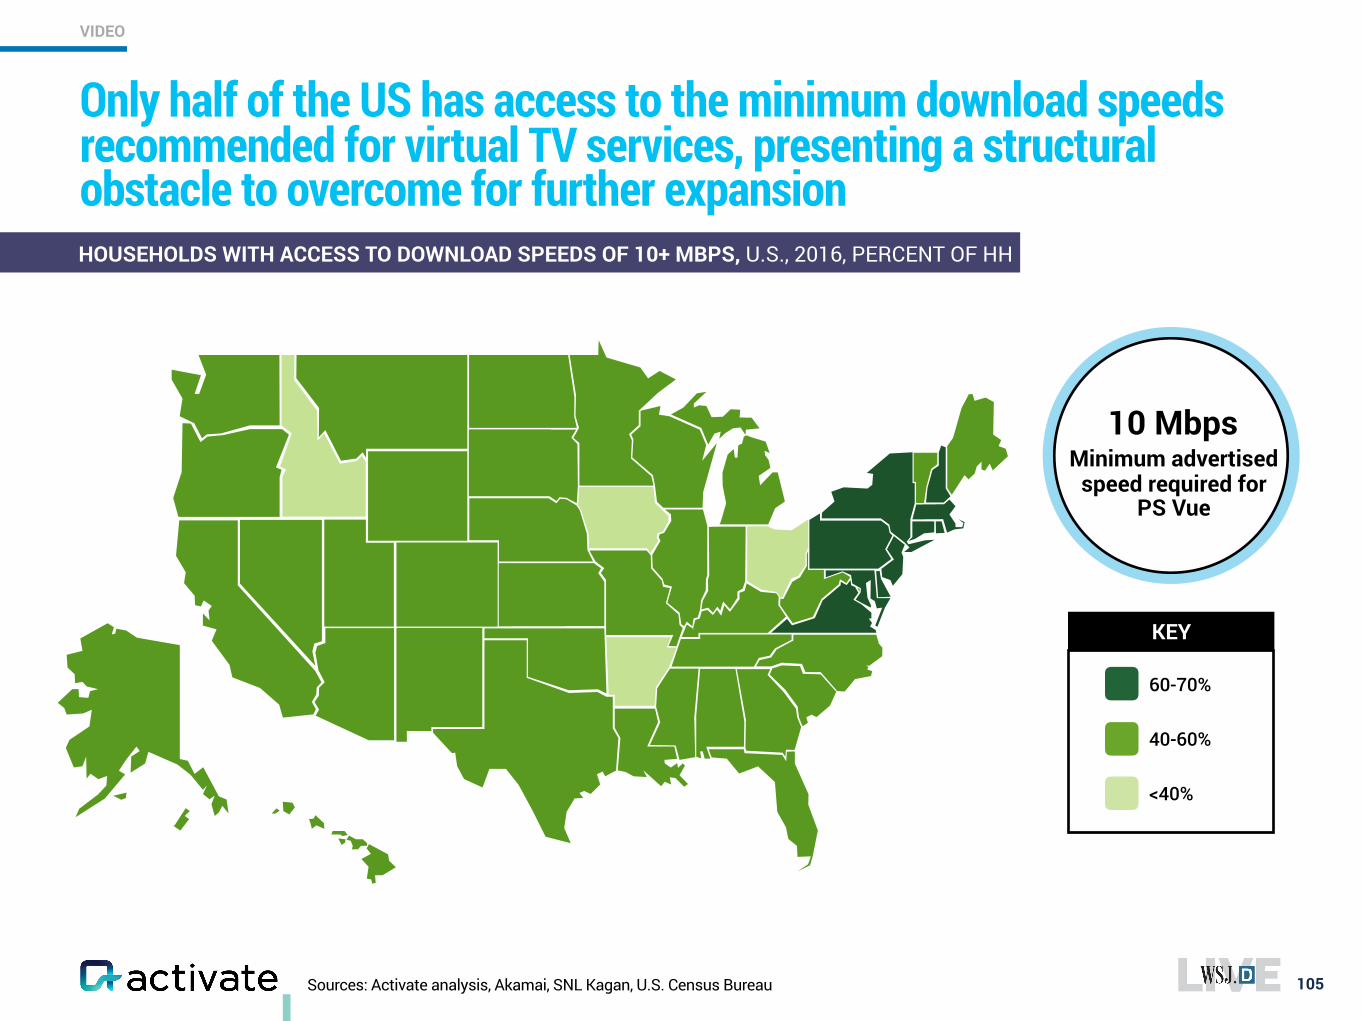
Sources: Activate analysis, Akamai, SNL Kagan, U.S. Census Bureau 105
HOUSEHOLDS WITH ACCESS TO DOWNLOAD SPEEDS OF 10+ MBPS, U.S., 2016, PERCENT OF HH
10 Mbps Minimum advertised
speed required forPS Vue
60-70%
40-60%
<40%
KEY
Only half of the US has access to the minimum download speeds recommended for virtual TV services, presenting a structural obstacle to overcome for further expansion
VIDEO
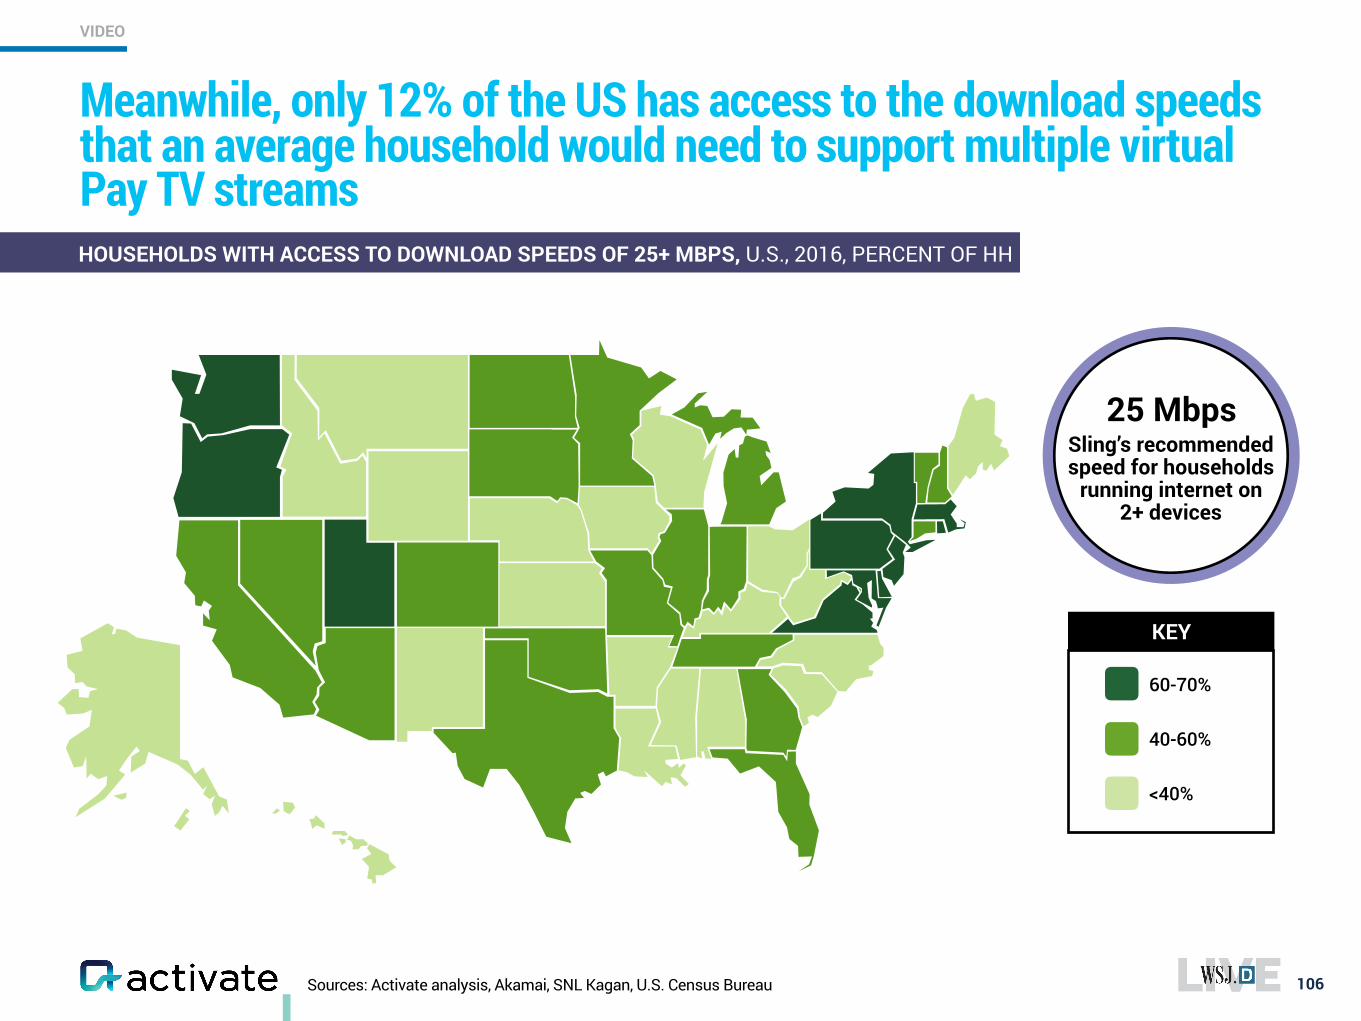
Sources: Activate analysis, Akamai, SNL Kagan, U.S. Census Bureau
Meanwhile, only 12% of the US has access to the download speeds that an average household would need to support multiple virtual Pay TV streams
106
VIDEO
HOUSEHOLDS WITH ACCESS TO DOWNLOAD SPEEDS OF 25+ MBPS, U.S., 2016, PERCENT OF HH
25 Mbps Sling’s recommended speed for households
running internet on 2+ devices
60-70%
40-60%
<40%
KEY
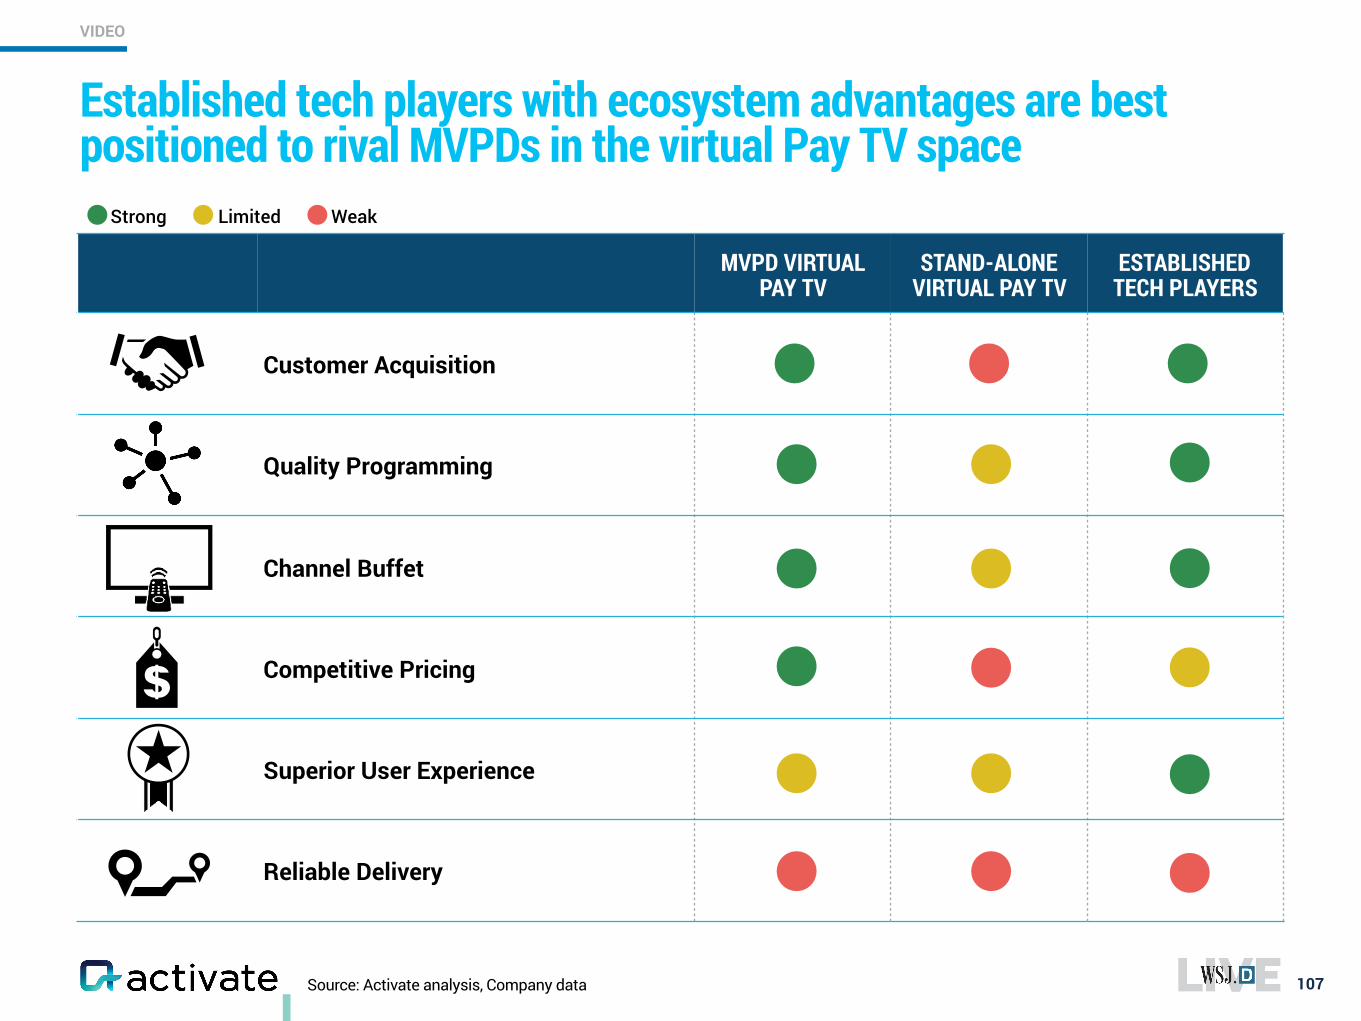
Source: Activate analysis, Company data
Established tech players with ecosystem advantages are best positioned to rival MVPDs in the virtual Pay TV space
107
VIDEO
MVPD VIRTUAL PAY TV
STAND-ALONE VIRTUAL PAY TV
ESTABLISHED TECH PLAYERS
Customer Acquisition
Quality Programming
Channel Buffet
Competitive Pricing
Superior User Experience
Reliable Delivery
Strong Limited Weak
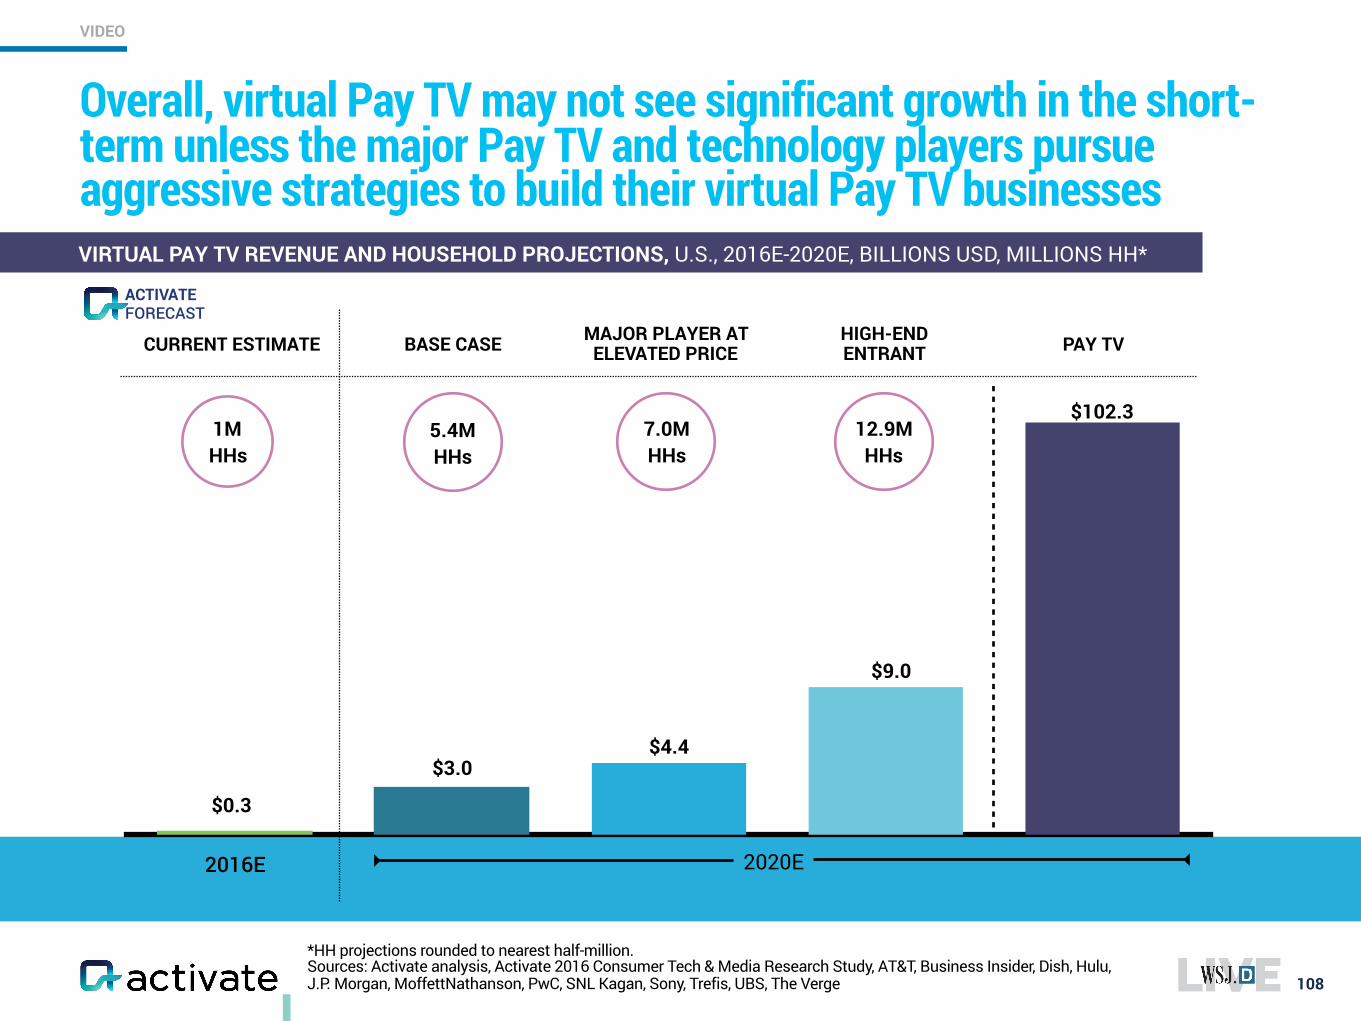
Overall, virtual Pay TV may not see significant growth in the short-term unless the major Pay TV and technology players pursue aggressive strategies to build their virtual Pay TV businesses
108
VIDEO
2016E
$0.3
$3.0$4.4
$9.0
BASE CASE MAJOR PLAYER AT ELEVATED PRICE
HIGH-END ENTRANT PAY TV
$102.3
VIRTUAL PAY TV REVENUE AND HOUSEHOLD PROJECTIONS, U.S., 2016E-2020E, BILLIONS USD, MILLIONS HH*
2020E
CURRENT ESTIMATE
5.4M HHs
1M HHs
7.0M HHs
12.9M HHs
*HH projections rounded to nearest half-million. Sources: Activate analysis, Activate 2016 Consumer Tech & Media Research Study, AT&T, Business Insider, Dish, Hulu, J.P. Morgan, MoffettNathanson, PwC, SNL Kagan, Sony, Trefis, UBS, The Verge
FORECASTACTIVATE
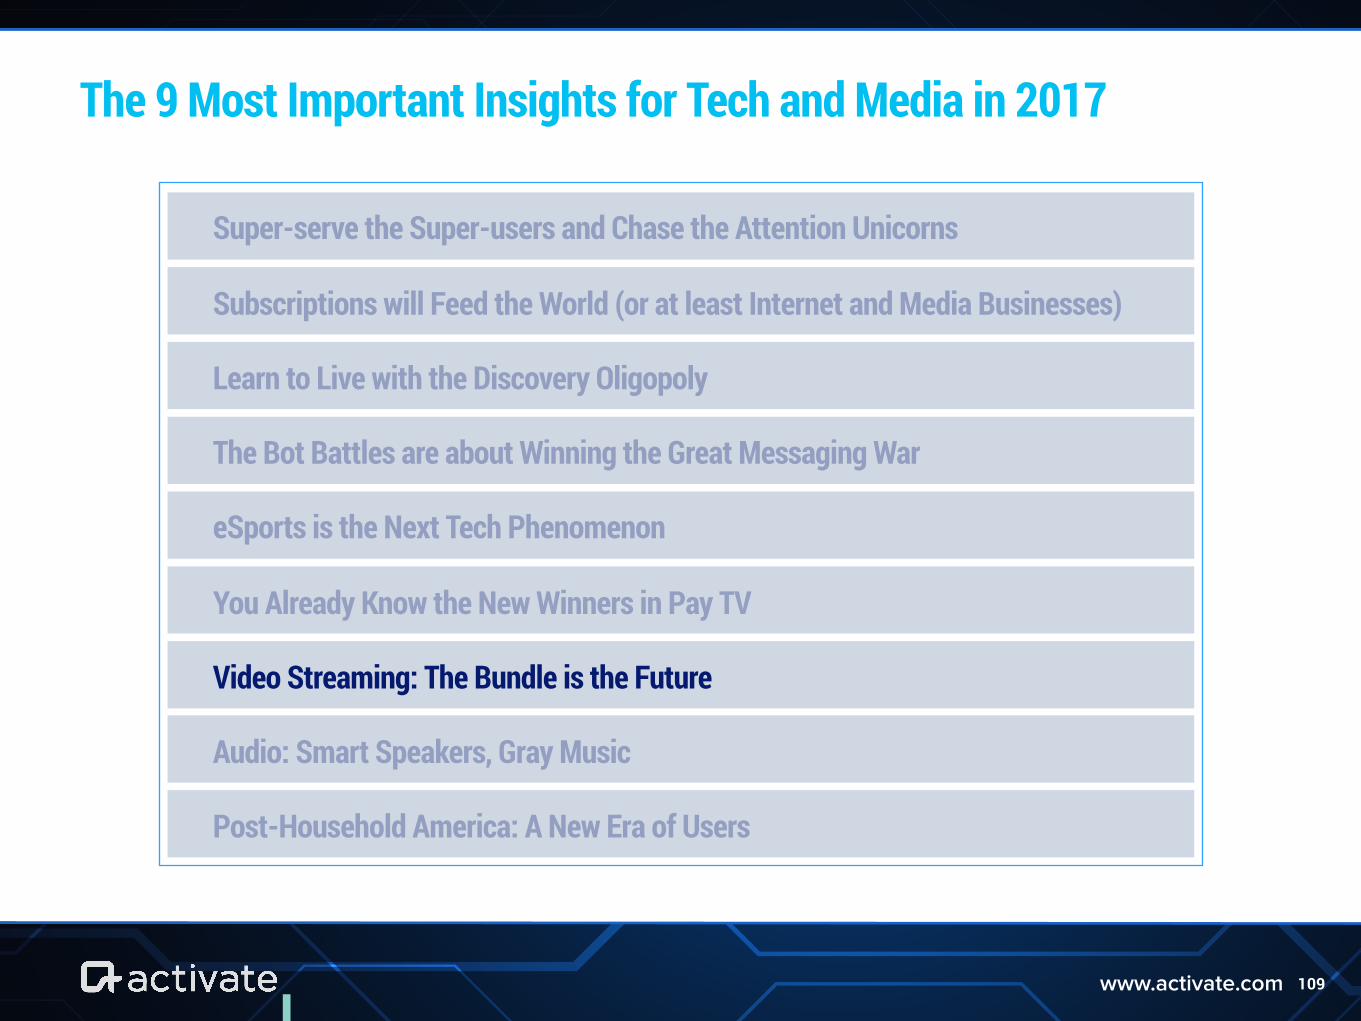
109www.activate.com
The 9 Most Important Insights for Tech and Media in 2017
Super-serve the Super-users and Chase the Attention Unicorns
Subscriptions will Feed the World (or at least Internet and Media Businesses)
Learn to Live with the Discovery Oligopoly
The Bot Battles are about Winning the Great Messaging War
eSports is the Next Tech Phenomenon
You Already Know the New Winners in Pay TV
Video Streaming: The Bundle is the Future
Audio: Smart Speakers, Gray Music
Post-Household America: A New Era of Users
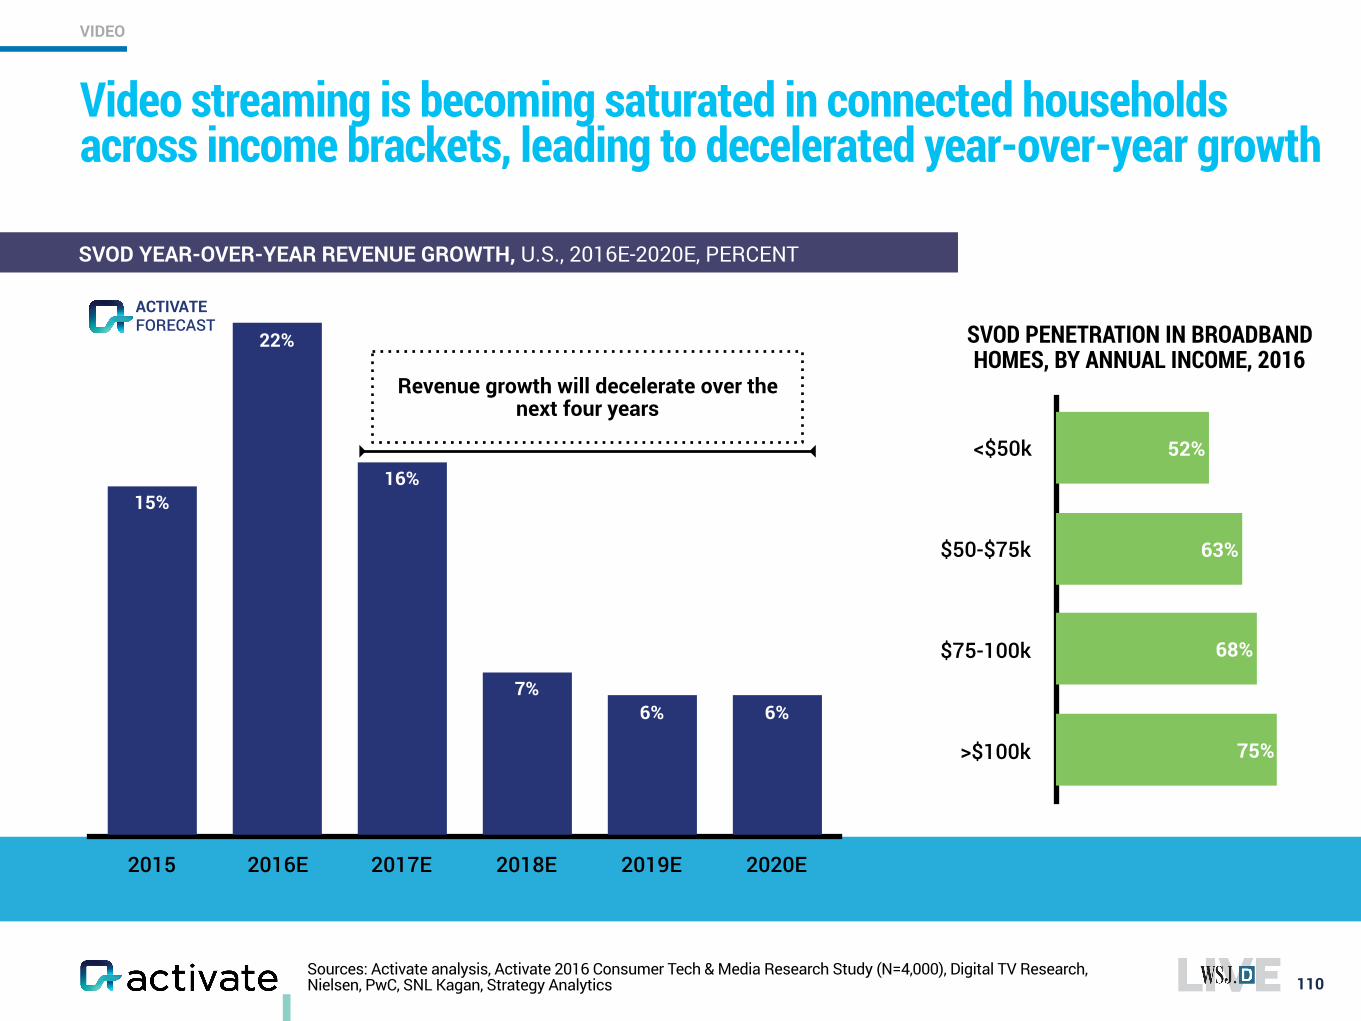
Sources: Activate analysis, Activate 2016 Consumer Tech & Media Research Study (N=4,000), Digital TV Research, Nielsen, PwC, SNL Kagan, Strategy Analytics
Video streaming is becoming saturated in connected households across income brackets, leading to decelerated year-over-year growth
110
SVOD YEAR-OVER-YEAR REVENUE GROWTH, U.S., 2016E-2020E, PERCENT
2015 2016E 2017E 2018E 2019E 2020E
6%6%7%
16%
22%
15%
SVOD PENETRATION IN BROADBAND HOMES, BY ANNUAL INCOME, 2016
<$50k
$50-$75k
$75-100k
>$100k 75%
68%
63%
52%
Revenue growth will decelerate over the next four years
FORECASTACTIVATE
VIDEO
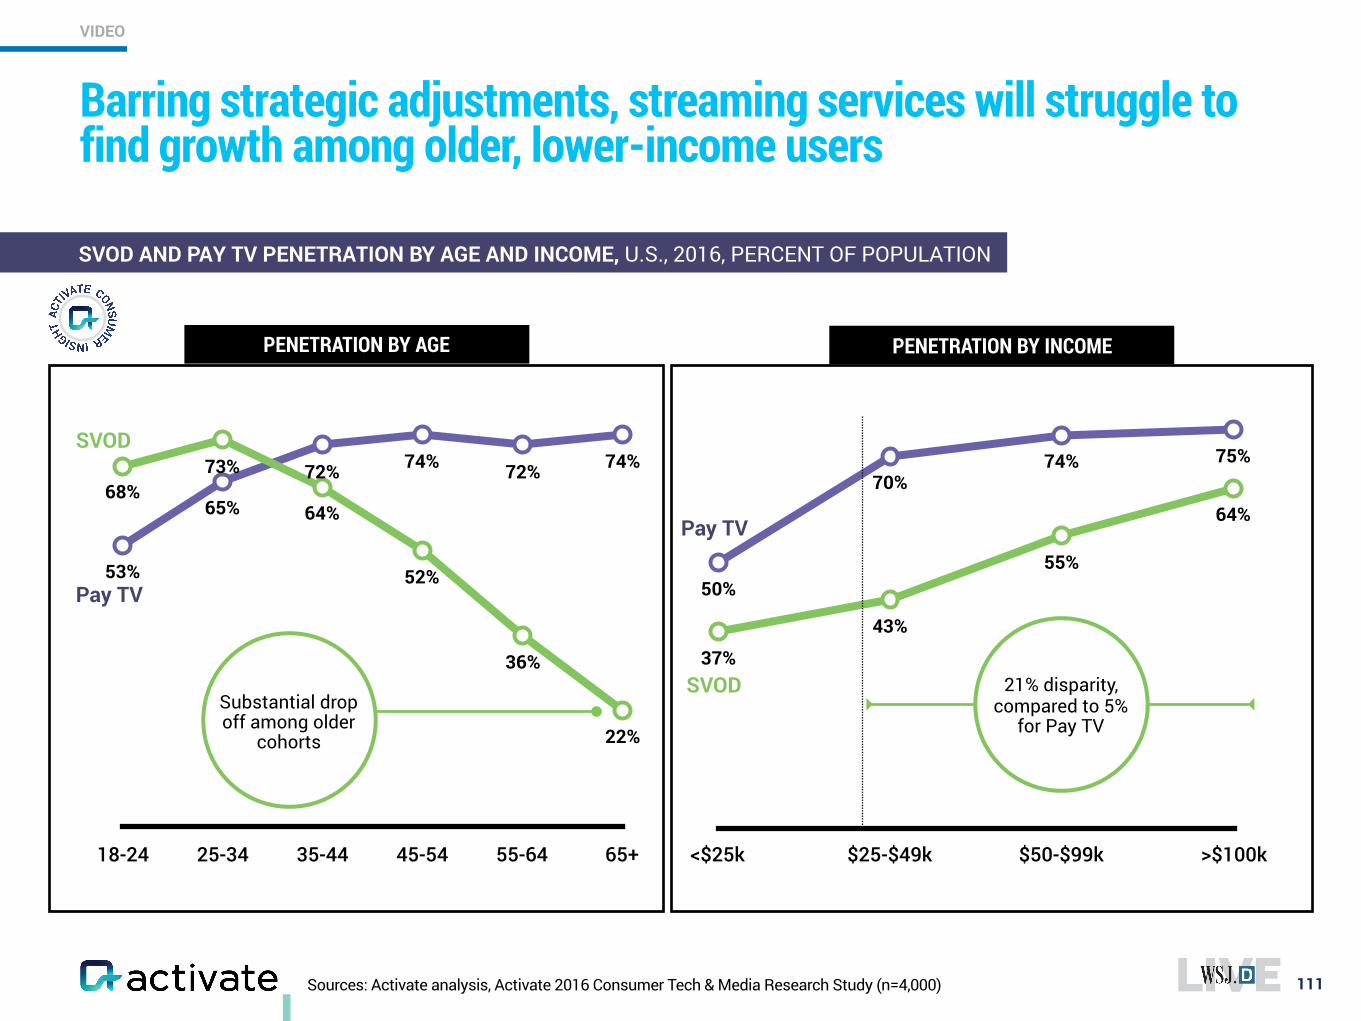
<$25k $25-$49k $50-$99k >$100k
50%
70%74% 75%
37%
43%
55%
64%
Sources: Activate analysis, Activate 2016 Consumer Tech & Media Research Study (n=4,000)
Barring strategic adjustments, streaming services will struggle to find growth among older, lower-income users
111
SVOD AND PAY TV PENETRATION BY AGE AND INCOME, U.S., 2016, PERCENT OF POPULATION
18-24 25-34 35-44 45-54 55-64 65+
53%
65%
72% 74% 72% 74%68%
73%
64%
52%
36%
22%
Substantial drop off among older
cohorts
PENETRATION BY AGE PENETRATION BY INCOME
21% disparity, compared to 5%
for Pay TV
SVOD
Pay TV
VIDEO
SVOD
Pay TV
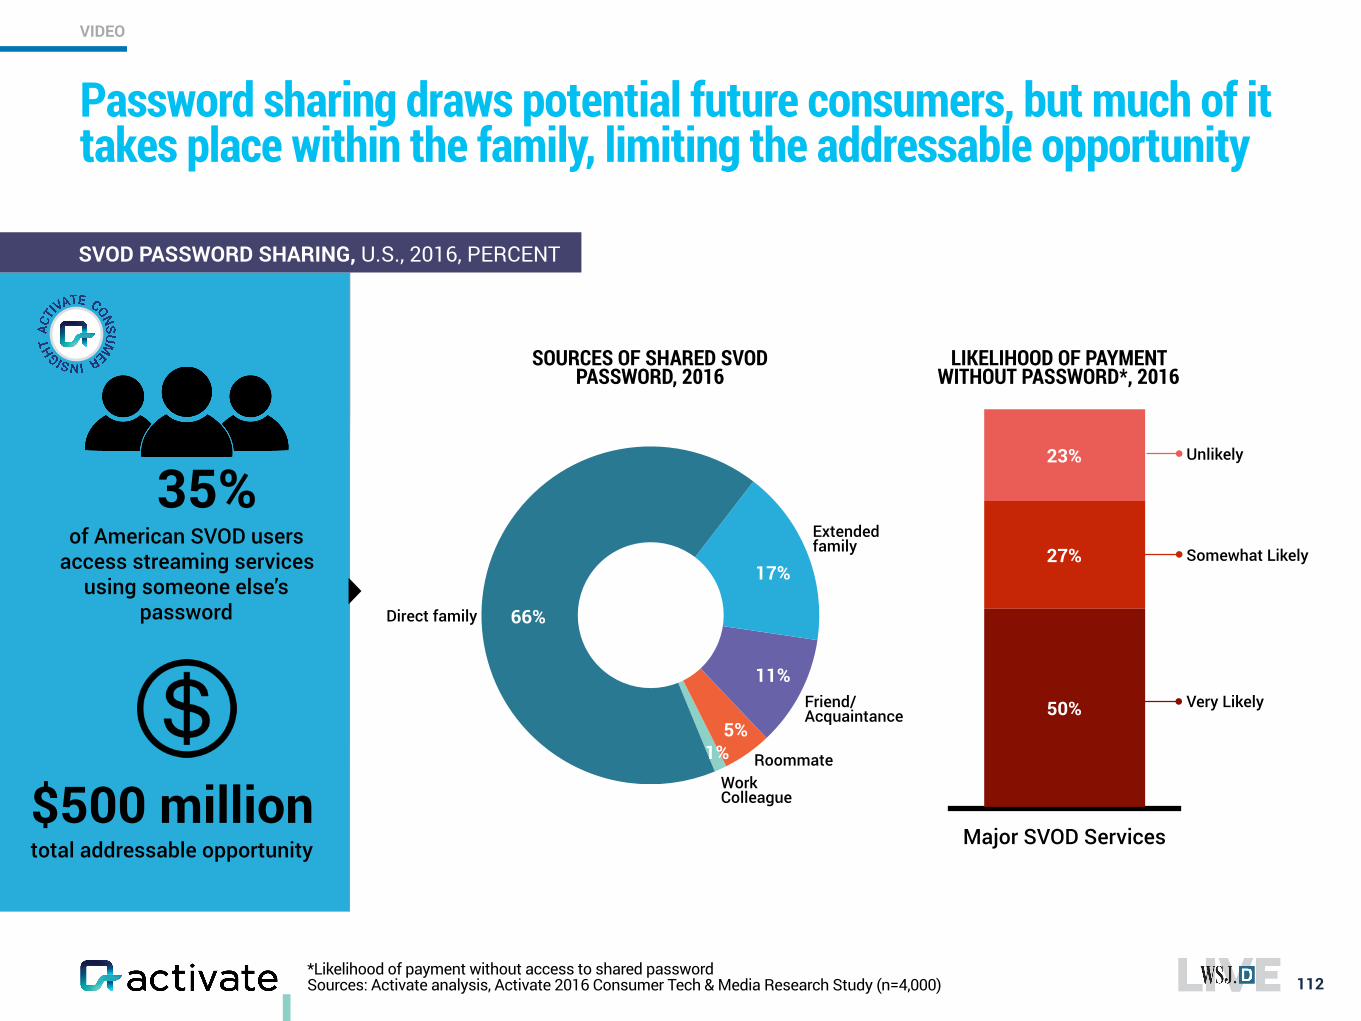
Major SVOD Services
23%
27%
50%
*Likelihood of payment without access to shared password Sources: Activate analysis, Activate 2016 Consumer Tech & Media Research Study (n=4,000)
Password sharing draws potential future consumers, but much of it takes place within the family, limiting the addressable opportunity
112
SVOD PASSWORD SHARING, U.S., 2016, PERCENT
35% of American SVOD users
access streaming services using someone else’s
password
LIKELIHOOD OF PAYMENT WITHOUT PASSWORD*, 2016
Very Likely
Somewhat Likely
Unlikely
Direct family 66%
17%
11%
5%1%
SOURCES OF SHARED SVOD PASSWORD, 2016
Extended family
Friend/Acquaintance
RoommateWork Colleague$500 million
total addressable opportunity
VIDEO
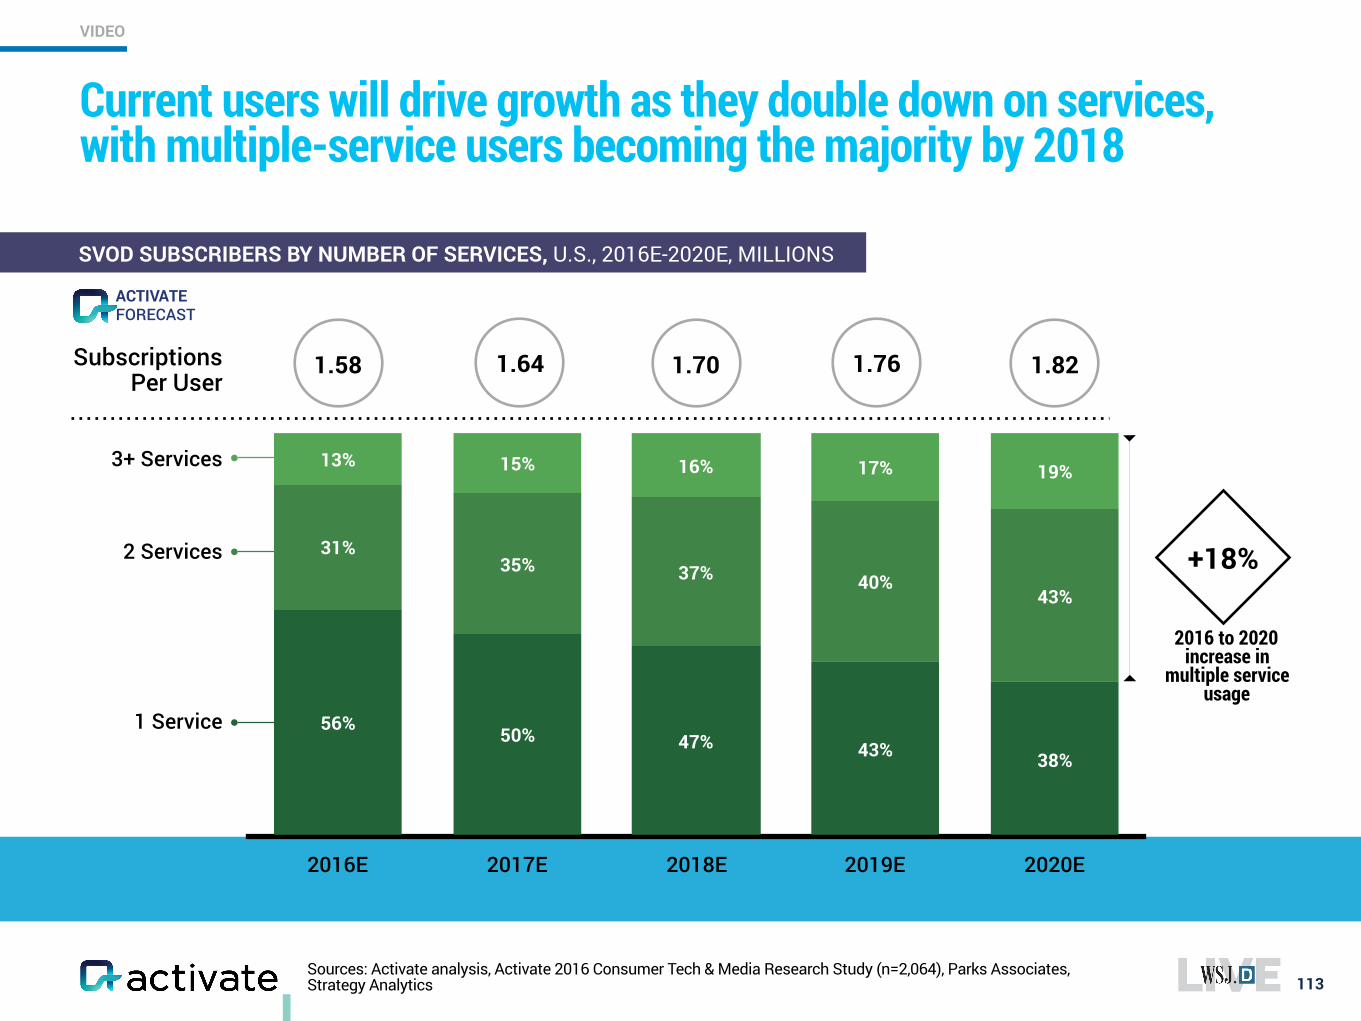
Sources: Activate analysis, Activate 2016 Consumer Tech & Media Research Study (n=2,064), Parks Associates, Strategy Analytics
Current users will drive growth as they double down on services, with multiple-service users becoming the majority by 2018
113
SVOD SUBSCRIBERS BY NUMBER OF SERVICES, U.S., 2016E-2020E, MILLIONS
2016E 2017E 2018E 2019E 2020E
19%17%16%15%13%
43%40%37%35%
31%
38%43%47%50%56%
3+ Services
2 Services
1 Service
2016 to 2020 increase in
multiple service usage
+18%
1.58 1.64 1.70 1.76Subscriptions Per User
1.82
FORECASTACTIVATE
VIDEO
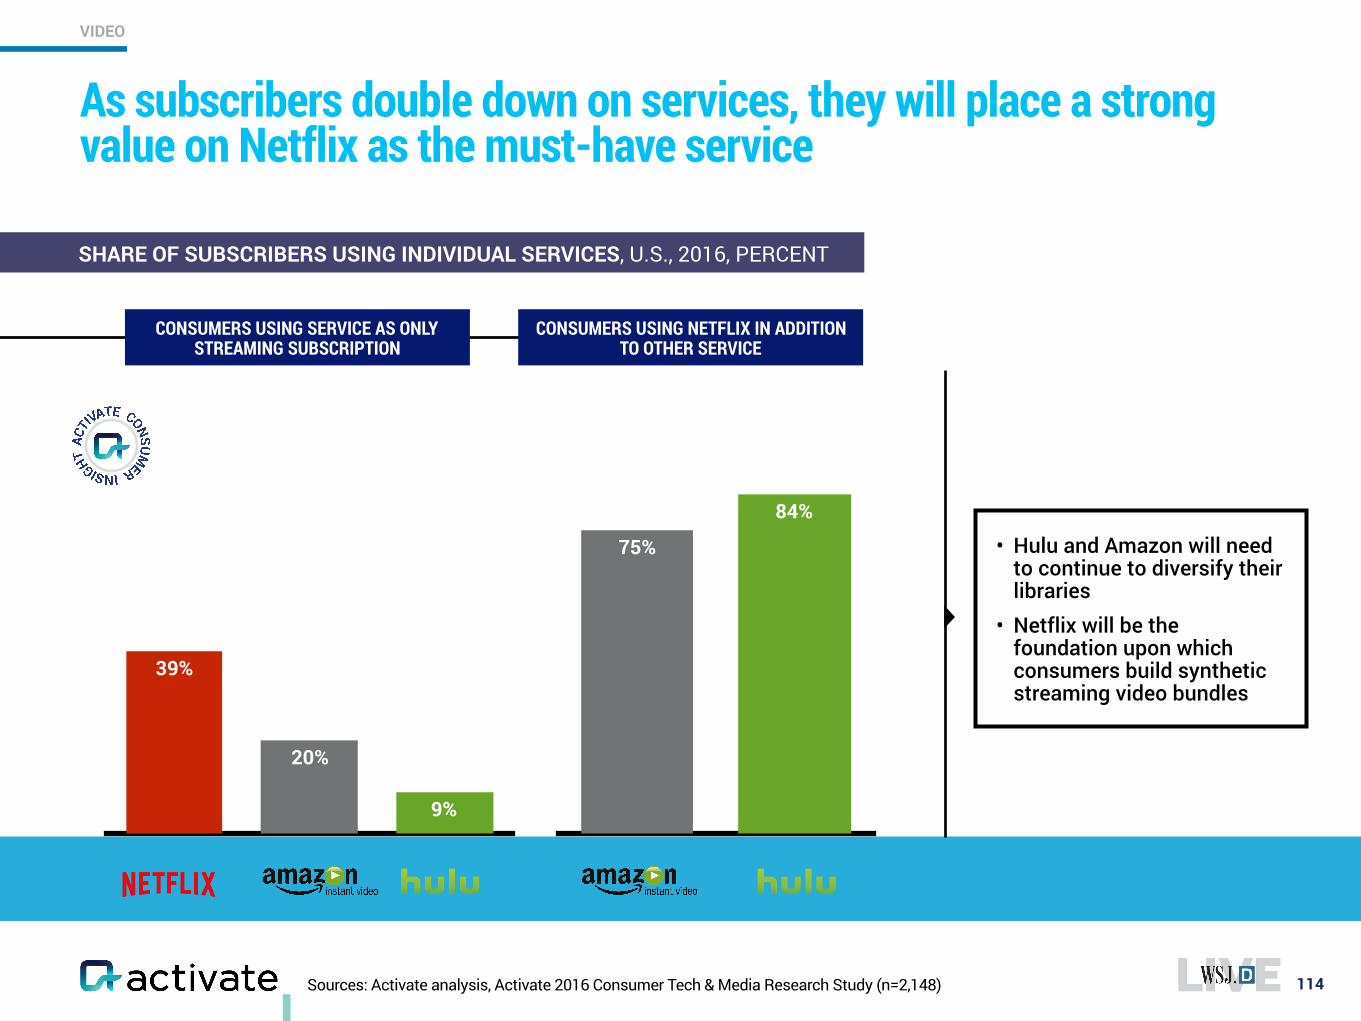
Sources: Activate analysis, Activate 2016 Consumer Tech & Media Research Study (n=2,148)
As subscribers double down on services, they will place a strong value on Netflix as the must-have service
114
SHARE OF SUBSCRIBERS USING INDIVIDUAL SERVICES, U.S., 2016, PERCENT
9%
20%
39%
75%
84%
CONSUMERS USING SERVICE AS ONLY STREAMING SUBSCRIPTION
CONSUMERS USING NETFLIX IN ADDITION TO OTHER SERVICE
• Hulu and Amazon will need to continue to diversify their libraries
• Netflix will be the foundation upon which consumers build synthetic streaming video bundles
VIDEO
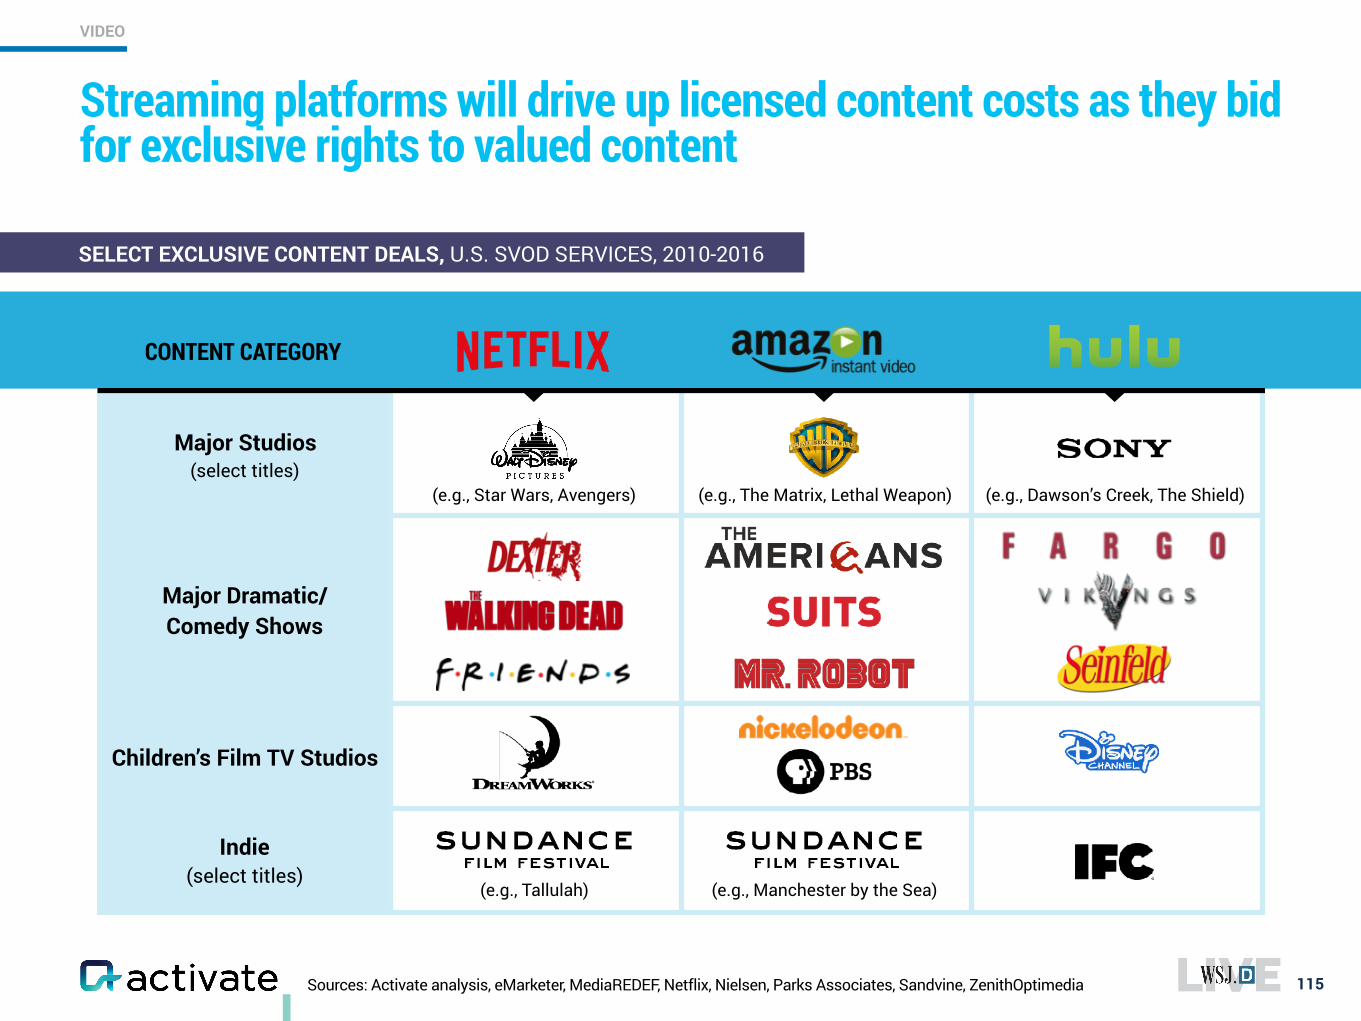
Major Studios (select titles)
Major Dramatic/Comedy Shows
Children’s Film TV Studios
Indie (select titles)
Sources: Activate analysis, eMarketer, MediaREDEF, Netflix, Nielsen, Parks Associates, Sandvine, ZenithOptimedia
Streaming platforms will drive up licensed content costs as they bid for exclusive rights to valued content
115
SELECT EXCLUSIVE CONTENT DEALS, U.S. SVOD SERVICES, 2010-2016
CONTENT CATEGORY
VIDEO
(e.g., Tallulah) (e.g., Manchester by the Sea)
(e.g., Star Wars, Avengers) (e.g., The Matrix, Lethal Weapon) (e.g., Dawson’s Creek, The Shield)
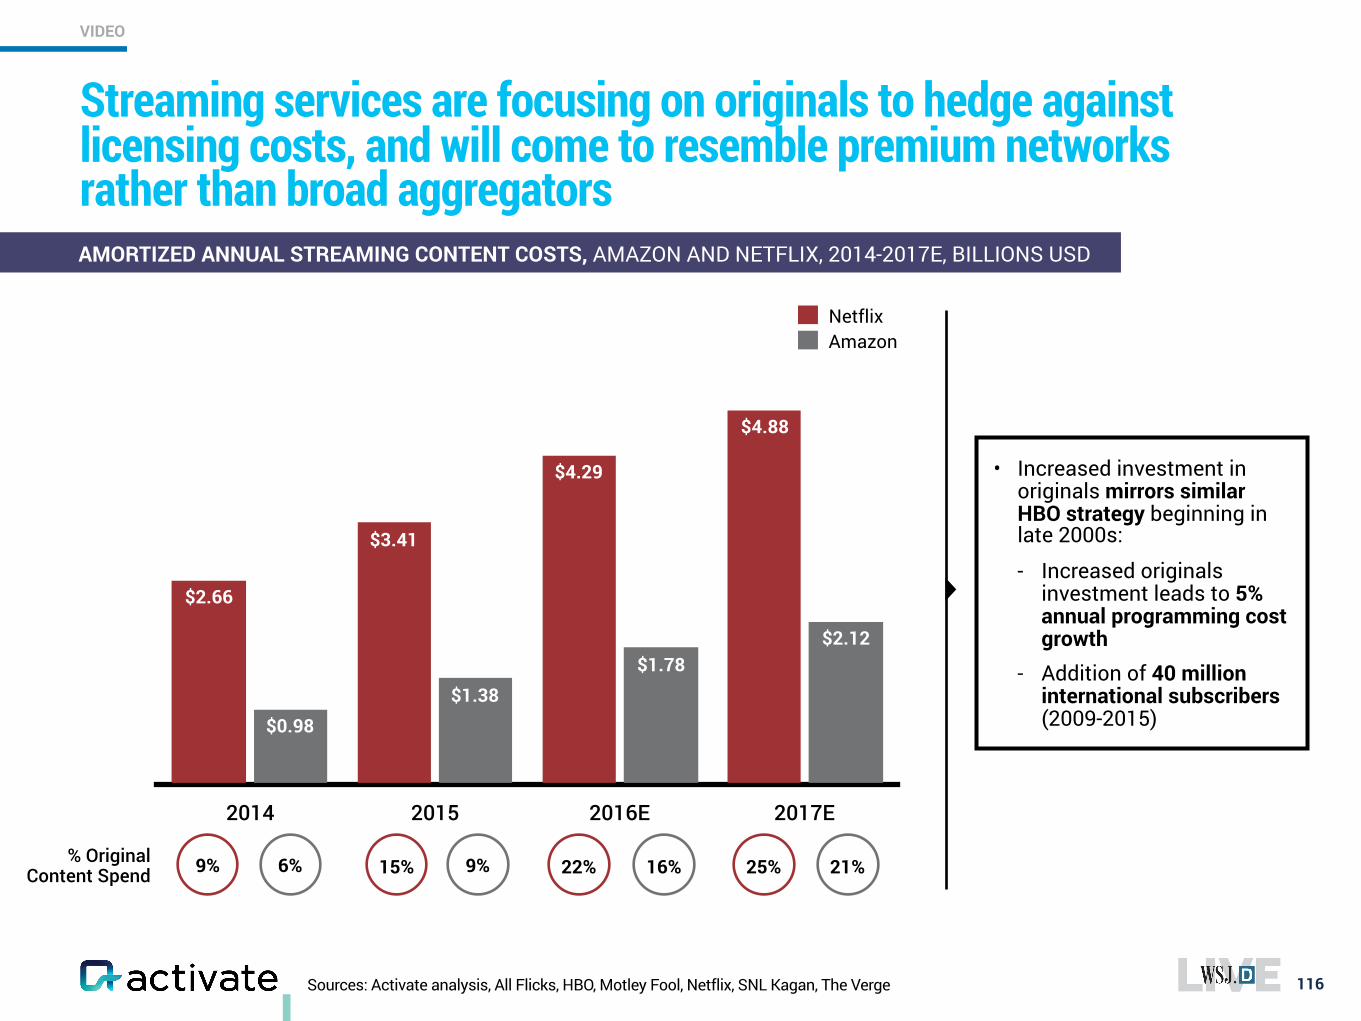
Sources: Activate analysis, All Flicks, HBO, Motley Fool, Netflix, SNL Kagan, The Verge 116
AMORTIZED ANNUAL STREAMING CONTENT COSTS, AMAZON AND NETFLIX, 2014-2017E, BILLIONS USD
2014 2015 2016E 2017E
$2.12$1.78
$1.38$0.98
$4.88
$4.29
$3.41
$2.66
NetflixAmazon
• Increased investment in originals mirrors similar HBO strategy beginning in late 2000s:
- Increased originals investment leads to 5% annual programming cost growth
- Addition of 40 million international subscribers (2009-2015)
% Original Content Spend
Streaming services are focusing on originals to hedge against licensing costs, and will come to resemble premium networks rather than broad aggregators
9% 15% 22% 25%6% 9% 16% 21%
VIDEO
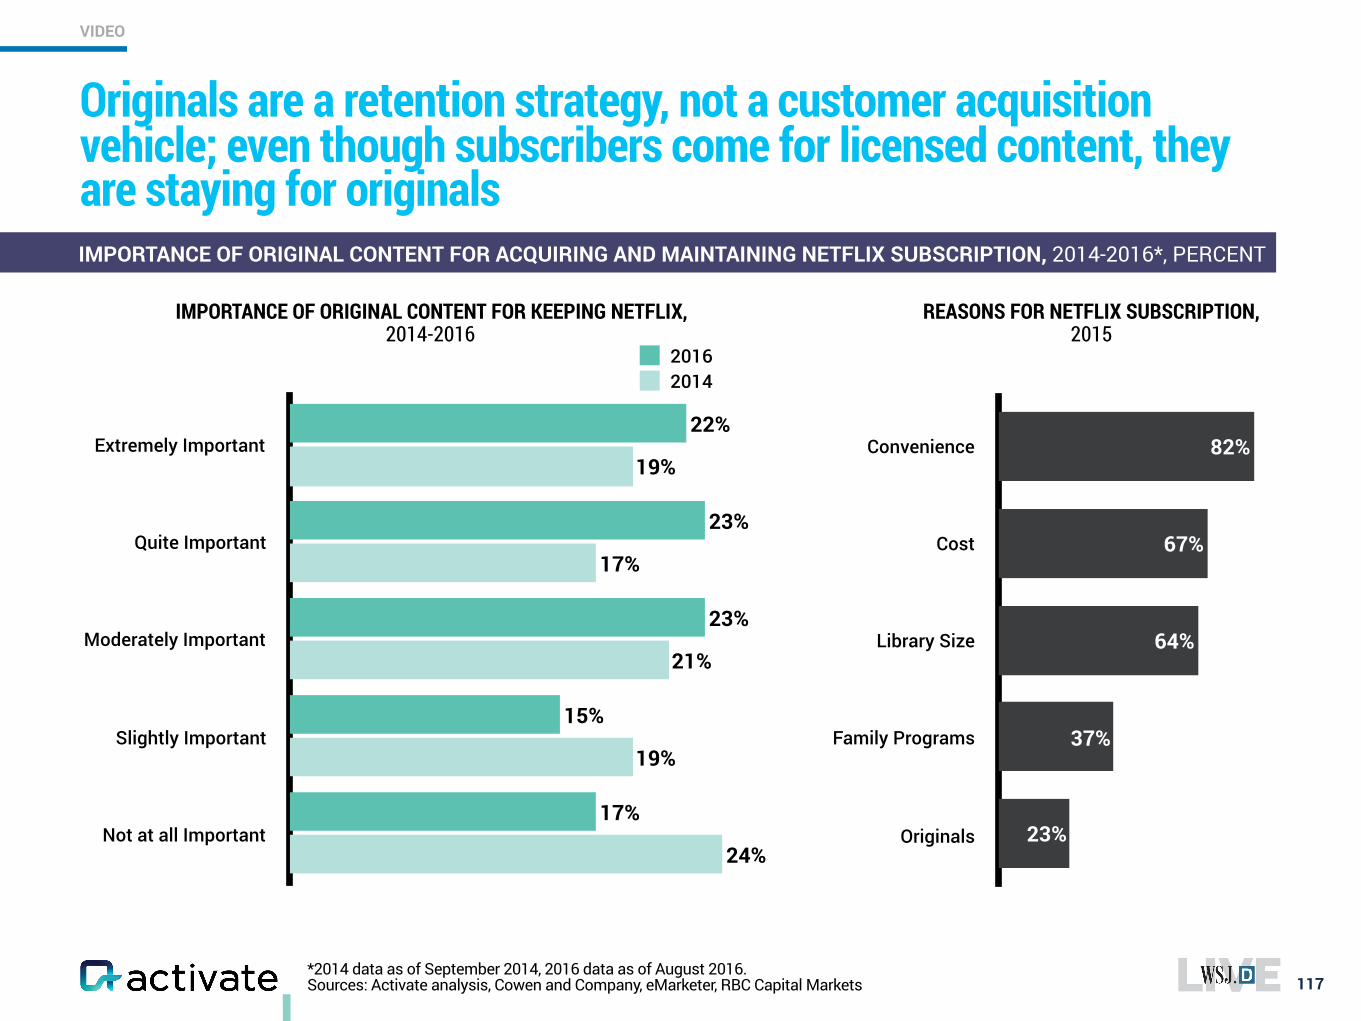
*2014 data as of September 2014, 2016 data as of August 2016. Sources: Activate analysis, Cowen and Company, eMarketer, RBC Capital Markets
Originals are a retention strategy, not a customer acquisition vehicle; even though subscribers come for licensed content, they are staying for originals
117
IMPORTANCE OF ORIGINAL CONTENT FOR ACQUIRING AND MAINTAINING NETFLIX SUBSCRIPTION, 2014-2016*, PERCENT
Extremely Important
Quite Important
Moderately Important
Slightly Important
Not at all Important24%
19%
21%
17%
19%
17%
15%
23%
23%
22%
20162014
Convenience
Cost
Library Size
Family Programs
Originals 23%
37%
64%
67%
82%
IMPORTANCE OF ORIGINAL CONTENT FOR KEEPING NETFLIX, 2014-2016
REASONS FOR NETFLIX SUBSCRIPTION, 2015
VIDEO
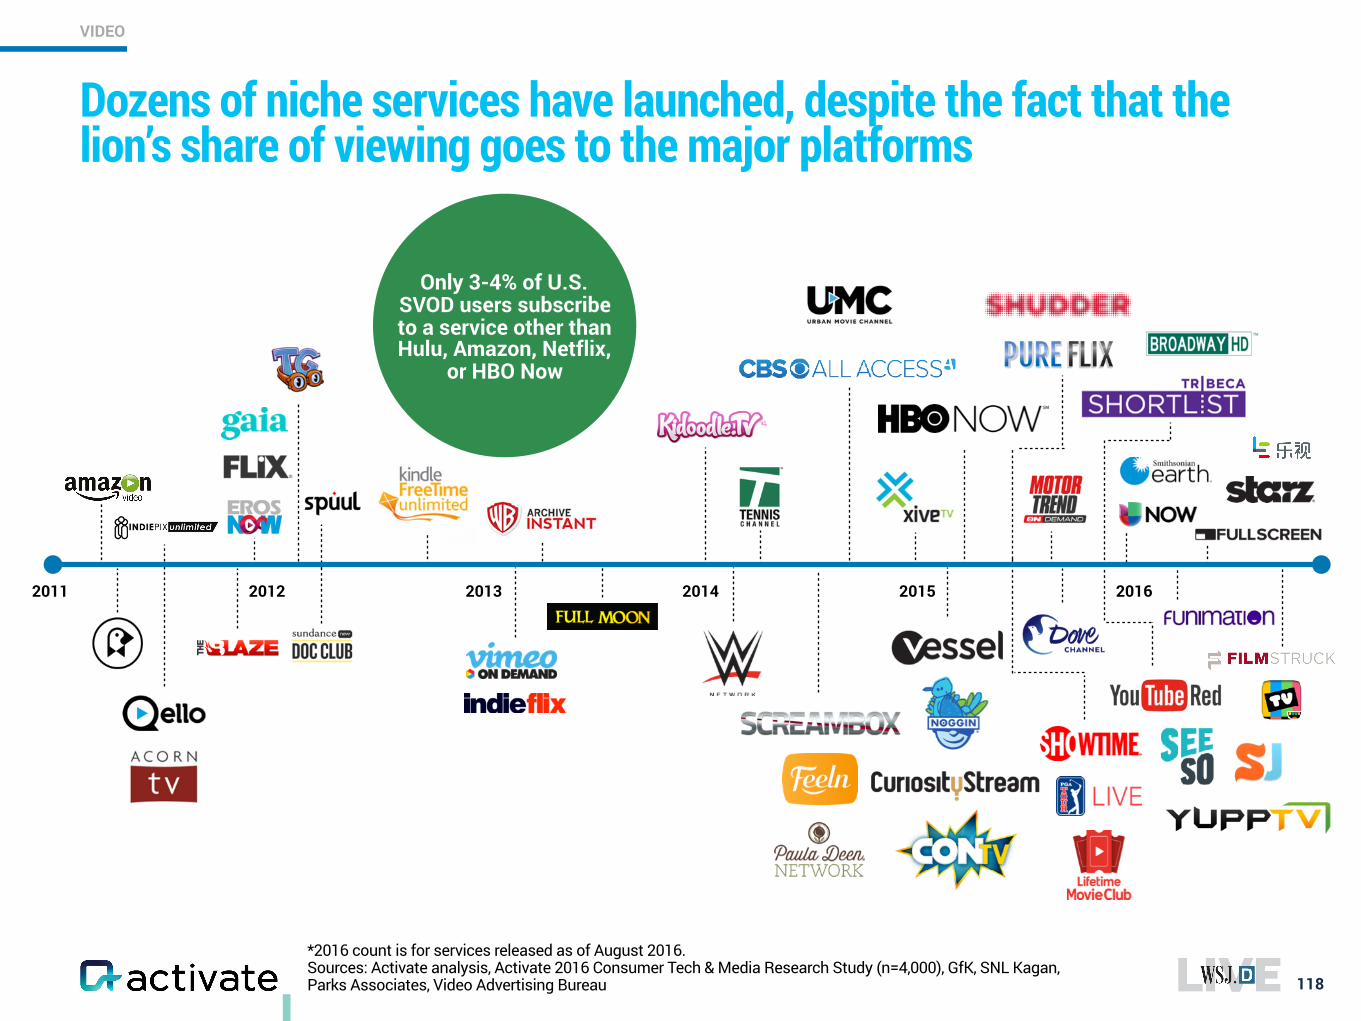
*2016 count is for services released as of August 2016. Sources: Activate analysis, Activate 2016 Consumer Tech & Media Research Study (n=4,000), GfK, SNL Kagan, Parks Associates, Video Advertising Bureau
Dozens of niche services have launched, despite the fact that the lion’s share of viewing goes to the major platforms
118
2011 20162015201420132012
Only 3-4% of U.S. SVOD users subscribe to a service other than Hulu, Amazon, Netflix,
or HBO Now
VIDEO
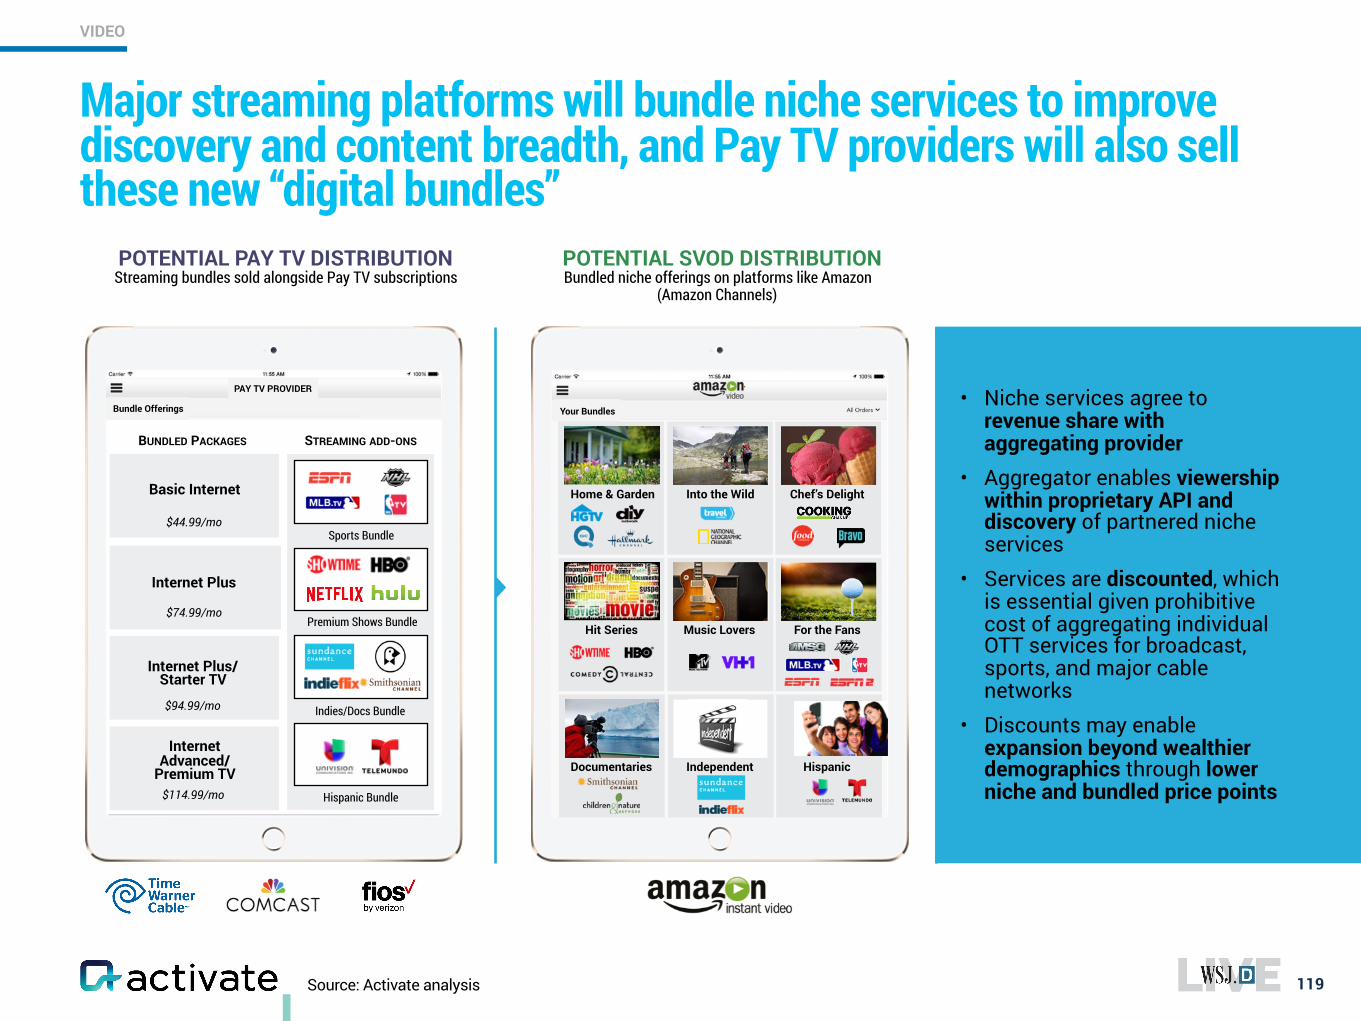
Major streaming platforms will bundle niche services to improve discovery and content breadth, and Pay TV providers will also sell these new “digital bundles”
119
VIDEO
POTENTIAL PAY TV DISTRIBUTION Streaming bundles sold alongside Pay TV subscriptions
POTENTIAL SVOD DISTRIBUTION Bundled niche offerings on platforms like Amazon
(Amazon Channels)
Your Bundles
Home & Garden
Hit Series Music Lovers
Chef’s DelightInto the Wild
For the Fans
Documentaries Independent Hispanic
• Niche services agree to revenue share with aggregating provider
• Aggregator enables viewership within proprietary API and discovery of partnered niche services
• Services are discounted, which is essential given prohibitive cost of aggregating individual OTT services for broadcast, sports, and major cable networks
• Discounts may enable expansion beyond wealthier demographics through lower niche and bundled price points
Bundle Offerings
$44.99/mo
Basic Internet
PAY TV PROVIDER
Internet Plus
$74.99/mo
Internet Plus/Starter TV
$94.99/mo
Internet Advanced/
Premium TV$114.99/mo
BUNDLED PACKAGES STREAMING ADD-ONS
Sports Bundle
Premium Shows Bundle
Indies/Docs Bundle
Hispanic Bundle
Source: Activate analysis
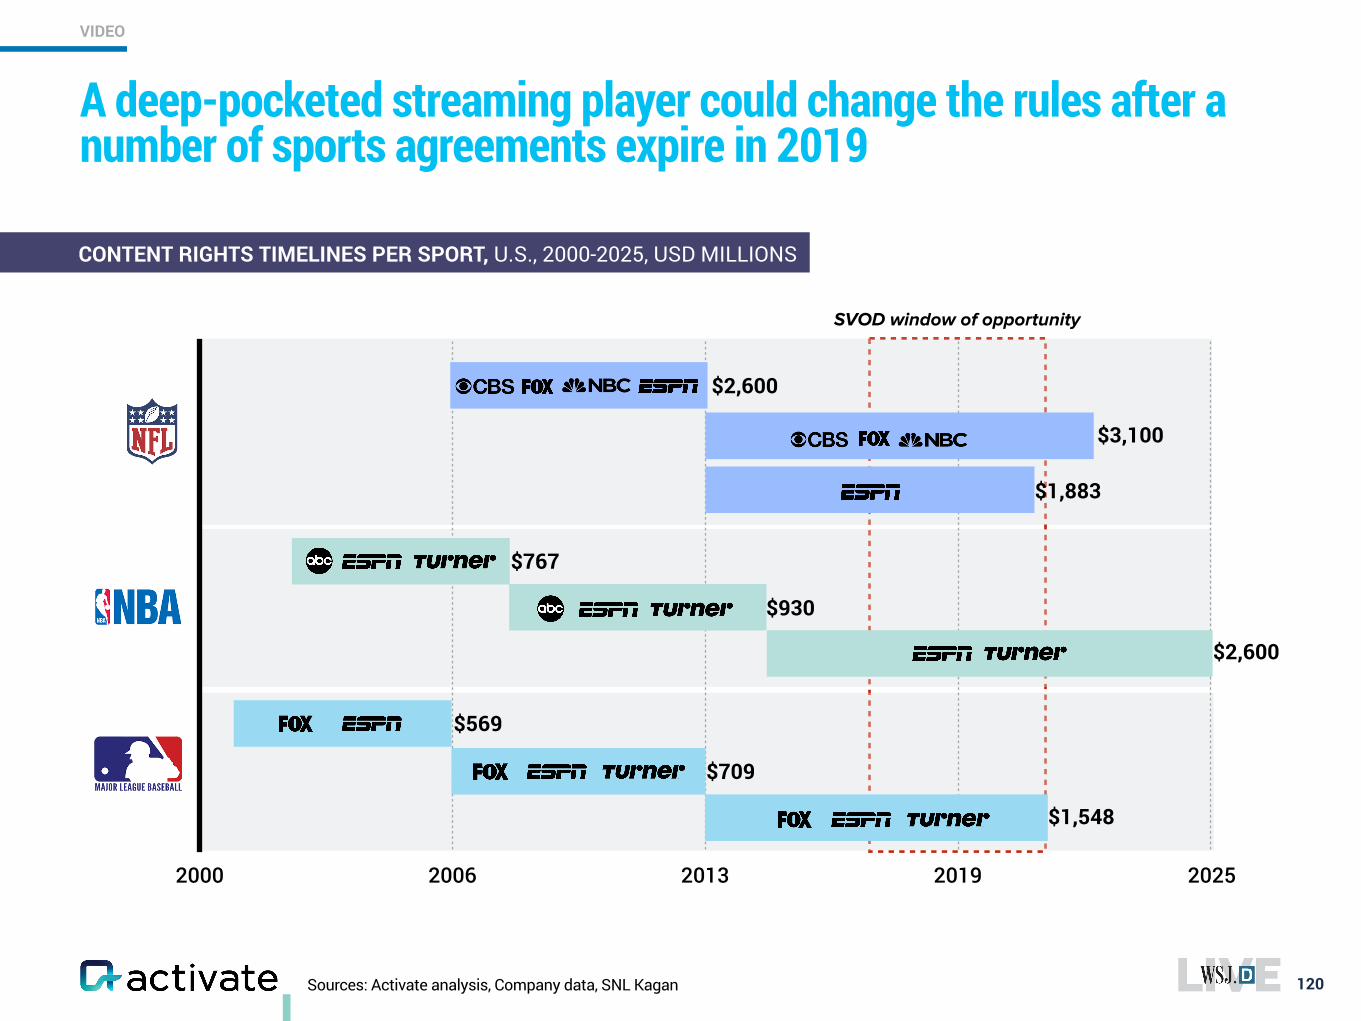
Sources: Activate analysis, Company data, SNL Kagan
A deep-pocketed streaming player could change the rules after a number of sports agreements expire in 2019
120
VIDEO
CONTENT RIGHTS TIMELINES PER SPORT, U.S., 2000-2025, USD MILLIONS
2000 2006 2013 2019 2025
$569
$709
$1,548
$767
$930
$2,600
$2,600
$1,883
$3,100
SVOD window of opportunity
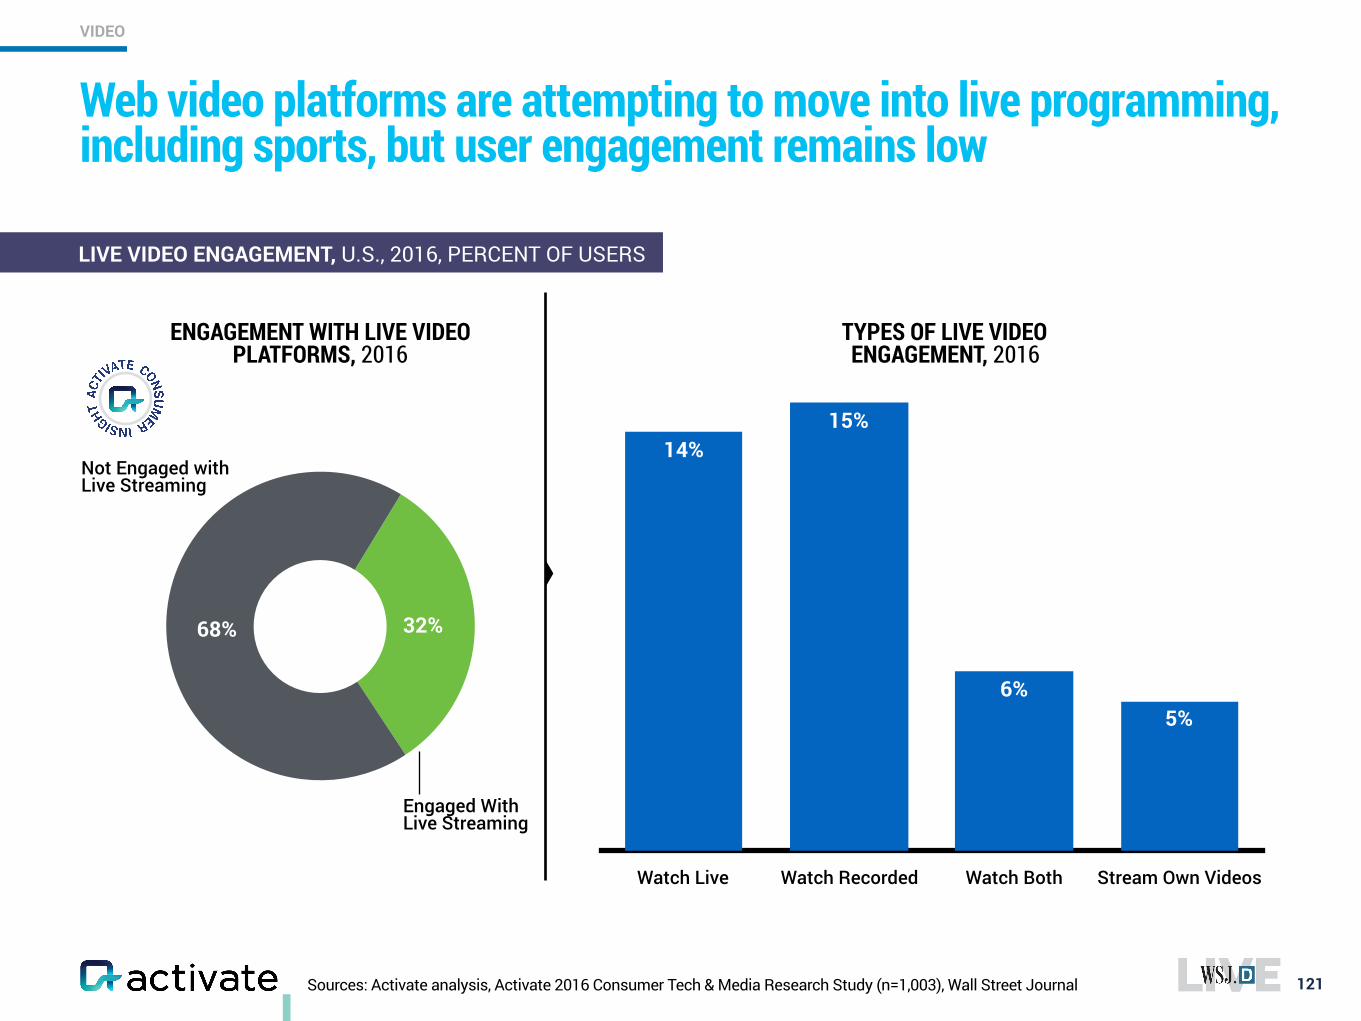
Sources: Activate analysis, Activate 2016 Consumer Tech & Media Research Study (n=1,003), Wall Street Journal
Web video platforms are attempting to move into live programming, including sports, but user engagement remains low
121
LIVE VIDEO ENGAGEMENT, U.S., 2016, PERCENT OF USERS
32%68%
ENGAGEMENT WITH LIVE VIDEO PLATFORMS, 2016
Engaged With Live Streaming
Not Engaged with Live Streaming
Watch Live Watch Recorded Watch Both Stream Own Videos
5%6%
15%14%
TYPES OF LIVE VIDEO ENGAGEMENT, 2016
VIDEO
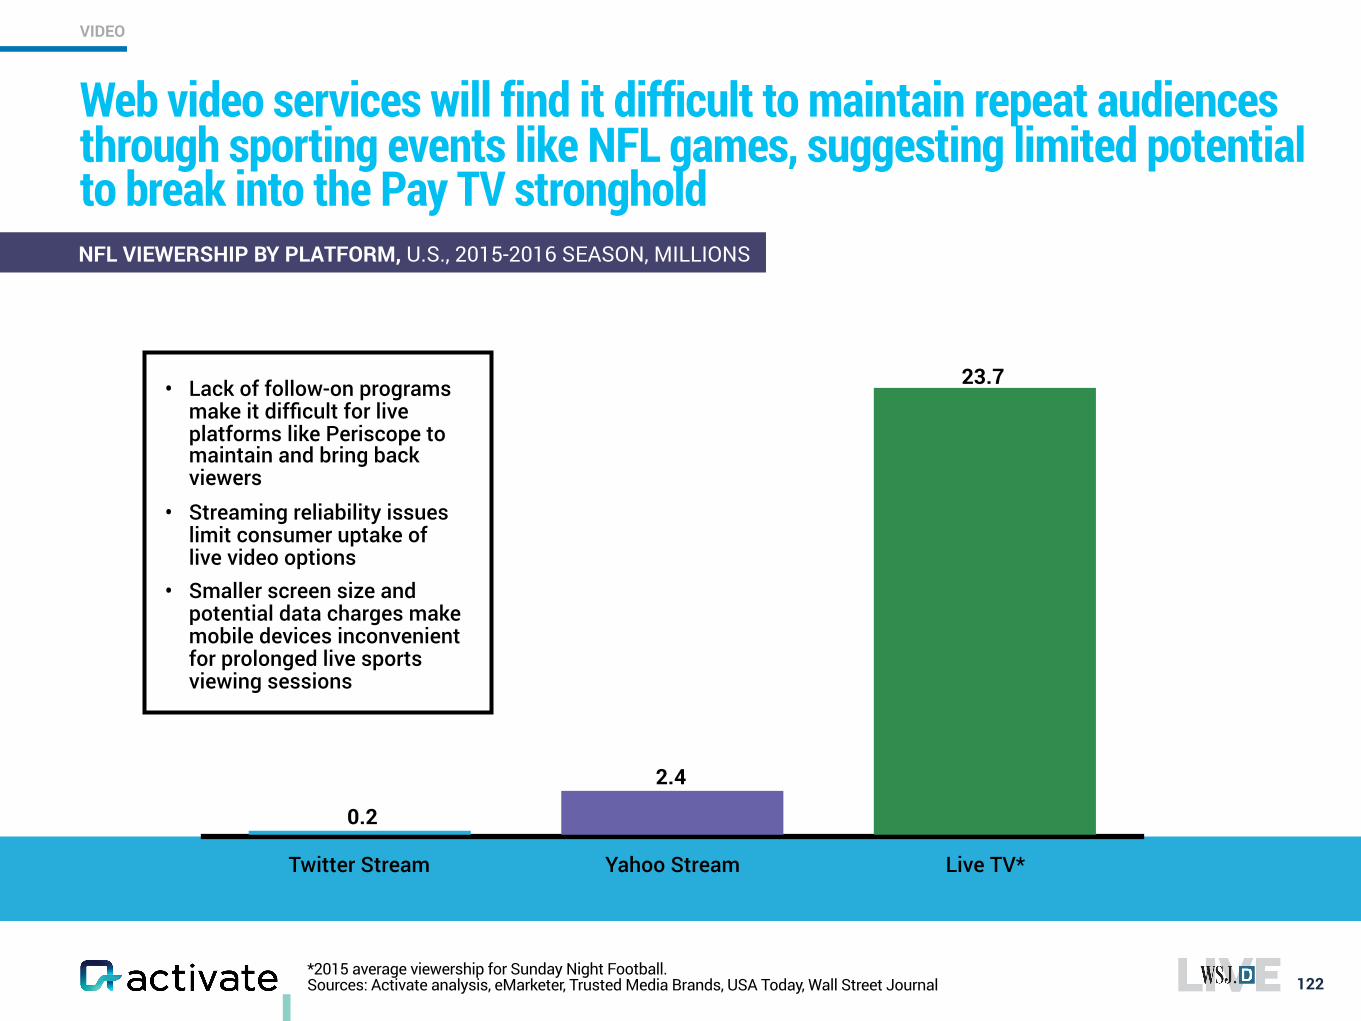
*2015 average viewership for Sunday Night Football. Sources: Activate analysis, eMarketer, Trusted Media Brands, USA Today, Wall Street Journal
Web video services will find it difficult to maintain repeat audiences through sporting events like NFL games, suggesting limited potential to break into the Pay TV stronghold
122
NFL VIEWERSHIP BY PLATFORM, U.S., 2015-2016 SEASON, MILLIONS
• Lack of follow-on programs make it difficult for live platforms like Periscope to maintain and bring back viewers
• Streaming reliability issues limit consumer uptake of live video options
• Smaller screen size and potential data charges make mobile devices inconvenient for prolonged live sports viewing sessions
Twitter Stream Yahoo Stream Live TV*
0.2
2.4
23.7
VIDEO
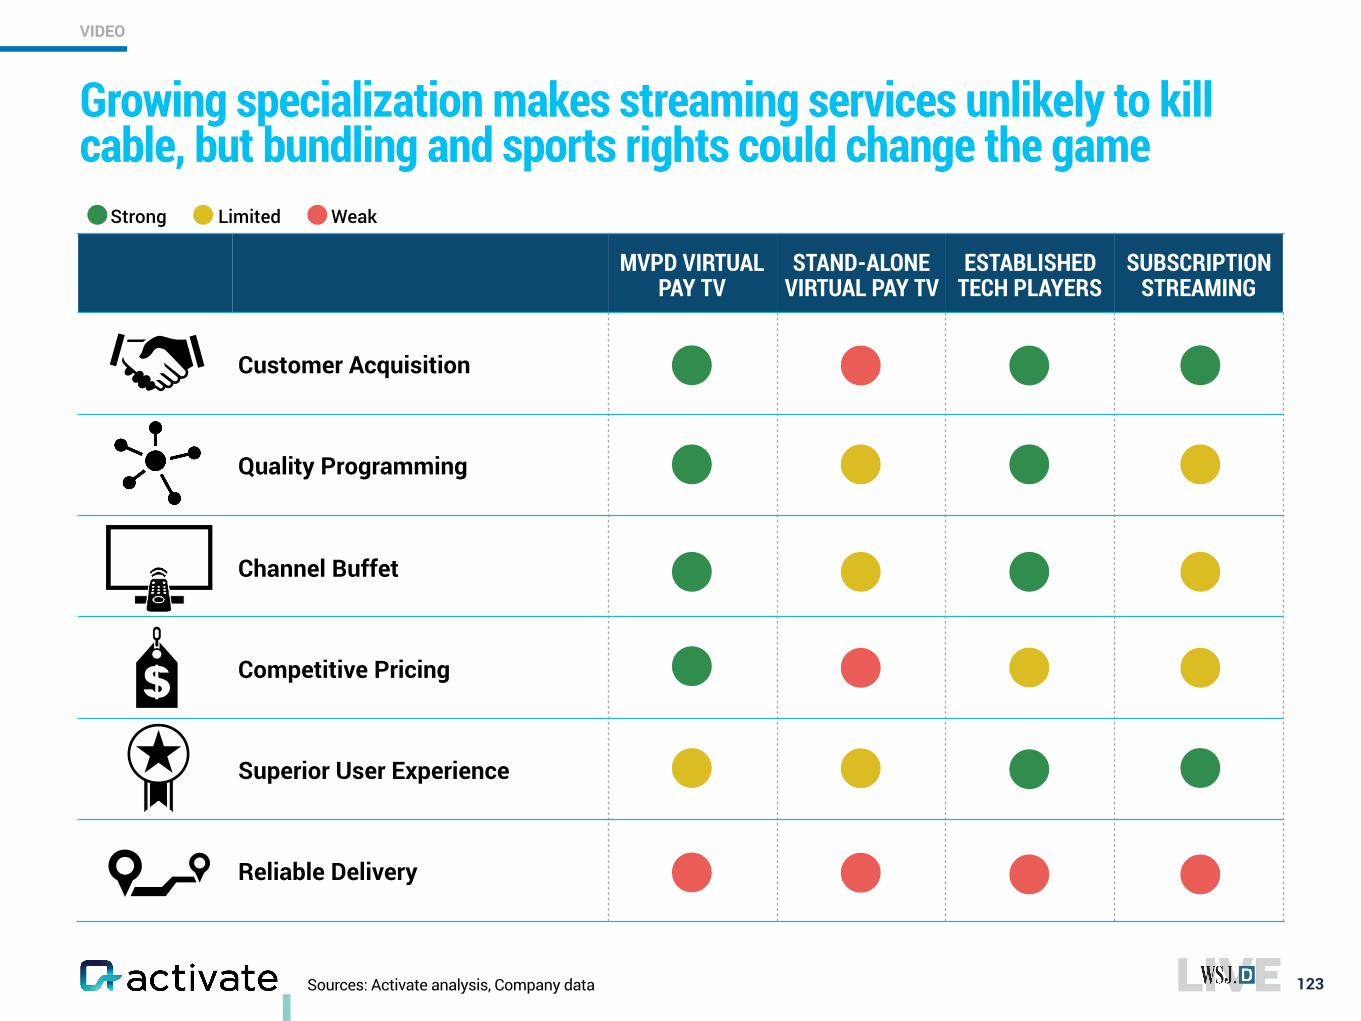
Sources: Activate analysis, Company data
Growing specialization makes streaming services unlikely to kill cable, but bundling and sports rights could change the game
123
VIDEO
MVPD VIRTUAL PAY TV
STAND-ALONE VIRTUAL PAY TV
ESTABLISHED TECH PLAYERS
SUBSCRIPTION STREAMING
Customer Acquisition
Quality Programming
Channel Buffet
Competitive Pricing
Superior User Experience
Reliable Delivery
Strong Limited Weak
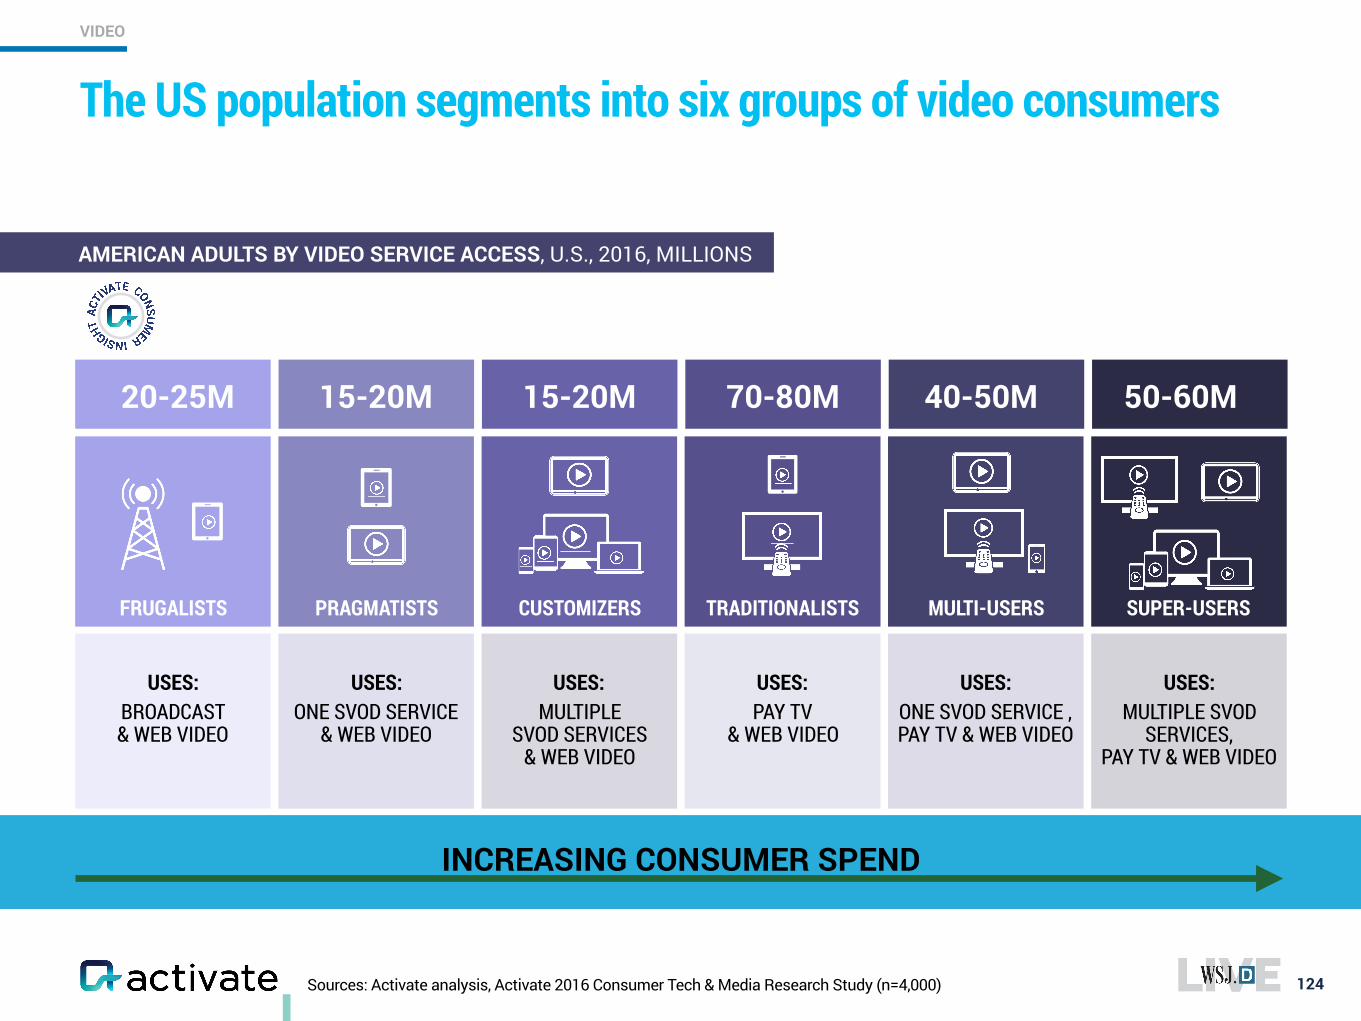
USES: BROADCAST & WEB VIDEO
USES: PAY TV
& WEB VIDEO
USES: ONE SVOD SERVICE
& WEB VIDEO
USES: MULTIPLE
SVOD SERVICES & WEB VIDEO
USES: MULTIPLE SVOD
SERVICES, PAY TV & WEB VIDEO
USES: ONE SVOD SERVICE , PAY TV & WEB VIDEO
Sources: Activate analysis, Activate 2016 Consumer Tech & Media Research Study (n=4,000)
The US population segments into six groups of video consumers
124
FRUGALISTS TRADITIONALISTSPRAGMATISTS CUSTOMIZERS SUPER-USERSMULTI-USERS
20-25M 15-20M 15-20M 70-80M 40-50M 50-60M
AMERICAN ADULTS BY VIDEO SERVICE ACCESS, U.S., 2016, MILLIONS
INCREASING CONSUMER SPEND
VIDEO
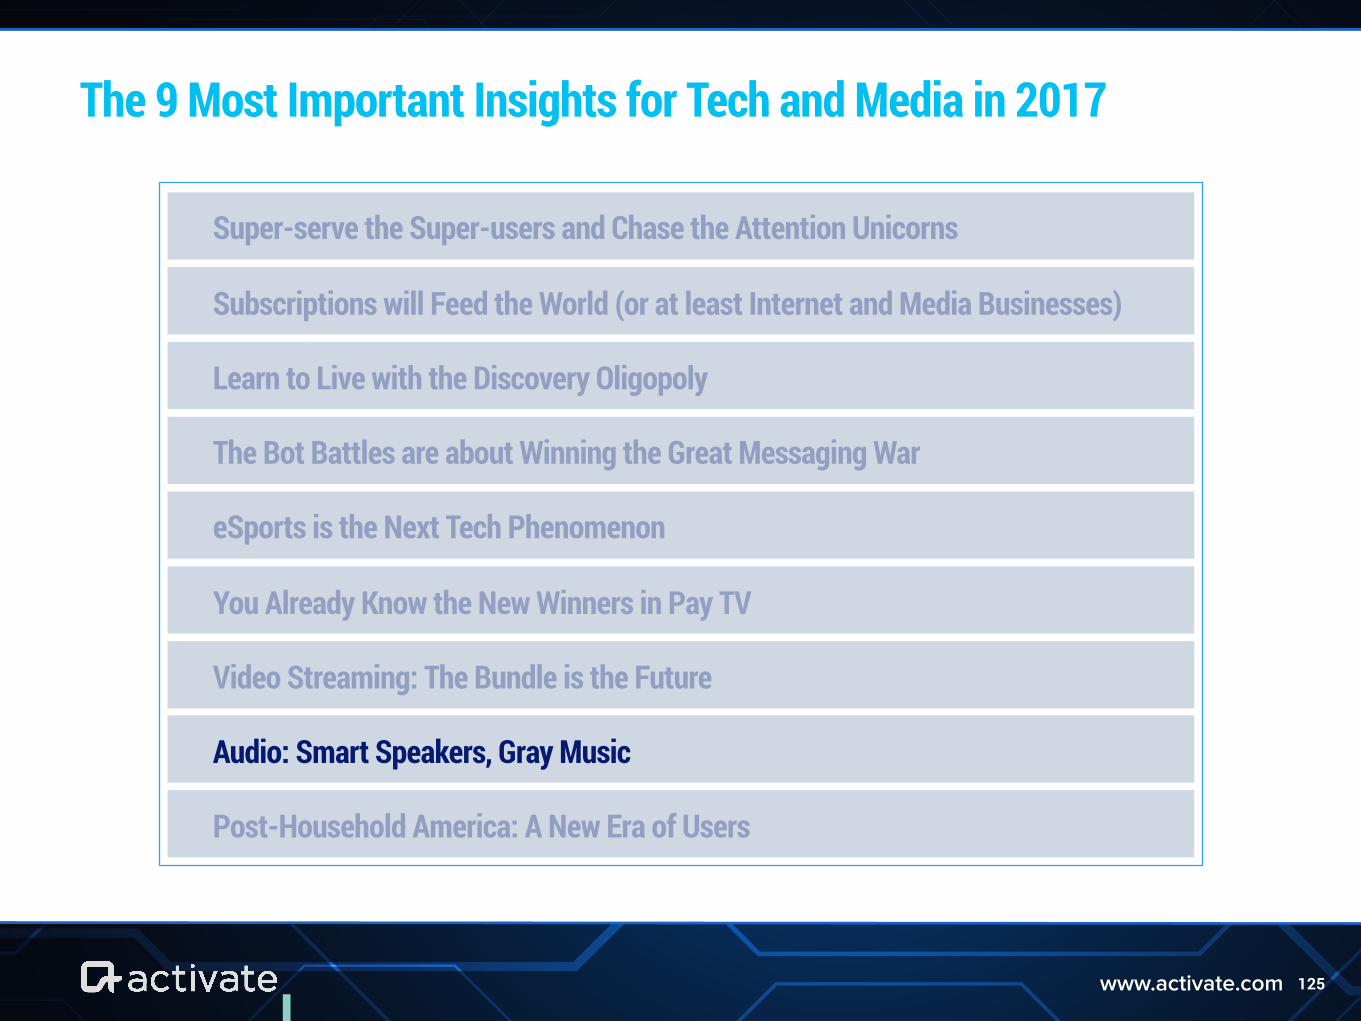
125www.activate.com
The 9 Most Important Insights for Tech and Media in 2017
Super-serve the Super-users and Chase the Attention Unicorns
Subscriptions will Feed the World (or at least Internet and Media Businesses)
Learn to Live with the Discovery Oligopoly
The Bot Battles are about Winning the Great Messaging War
eSports is the Next Tech Phenomenon
You Already Know the New Winners in Pay TV
Video Streaming: The Bundle is the Future
Audio: Smart Speakers, Gray Music
Post-Household America: A New Era of Users
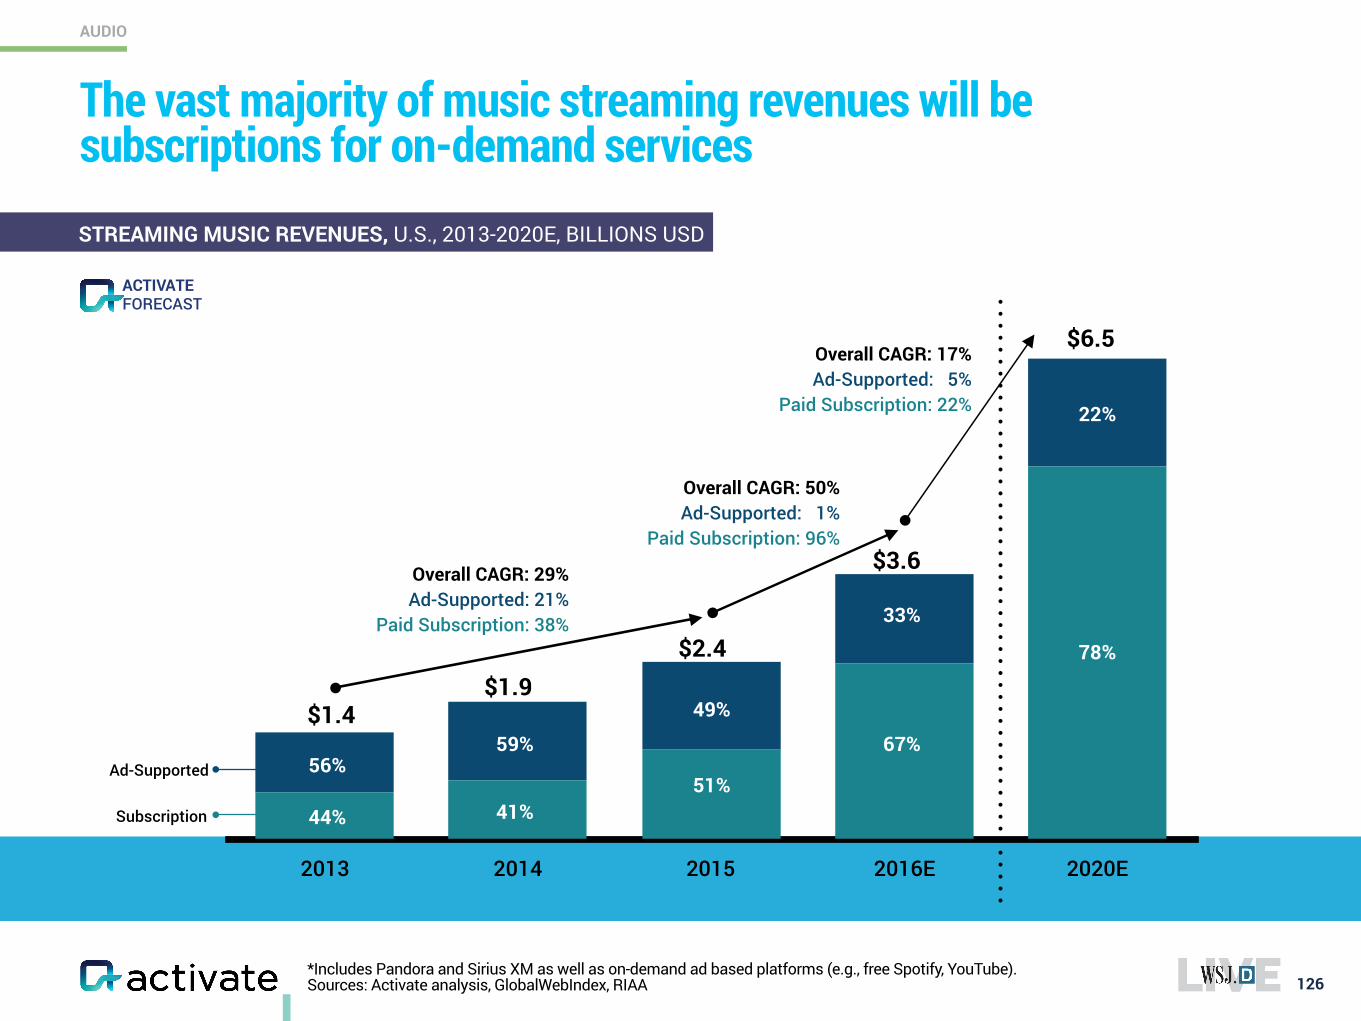
*Includes Pandora and Sirius XM as well as on-demand ad based platforms (e.g., free Spotify, YouTube). Sources: Activate analysis, GlobalWebIndex, RIAA 126
The vast majority of music streaming revenues will be subscriptions for on-demand services
2013 2014 2015 2016E 2020E
$1.4
$3.6
$6.5
33%
67%Ad-Supported
Subscription 44%
56%
78%
22%
41%
59%
51%
49%
$2.4$1.9
STREAMING MUSIC REVENUES, U.S., 2013-2020E, BILLIONS USD
Overall CAGR: 29% Ad-Supported: 21%
Paid Subscription: 38%
Overall CAGR: 50% Ad-Supported: 1%
Paid Subscription: 96%
Overall CAGR: 17% Ad-Supported: 5%
Paid Subscription: 22%
FORECASTACTIVATE
AUDIO
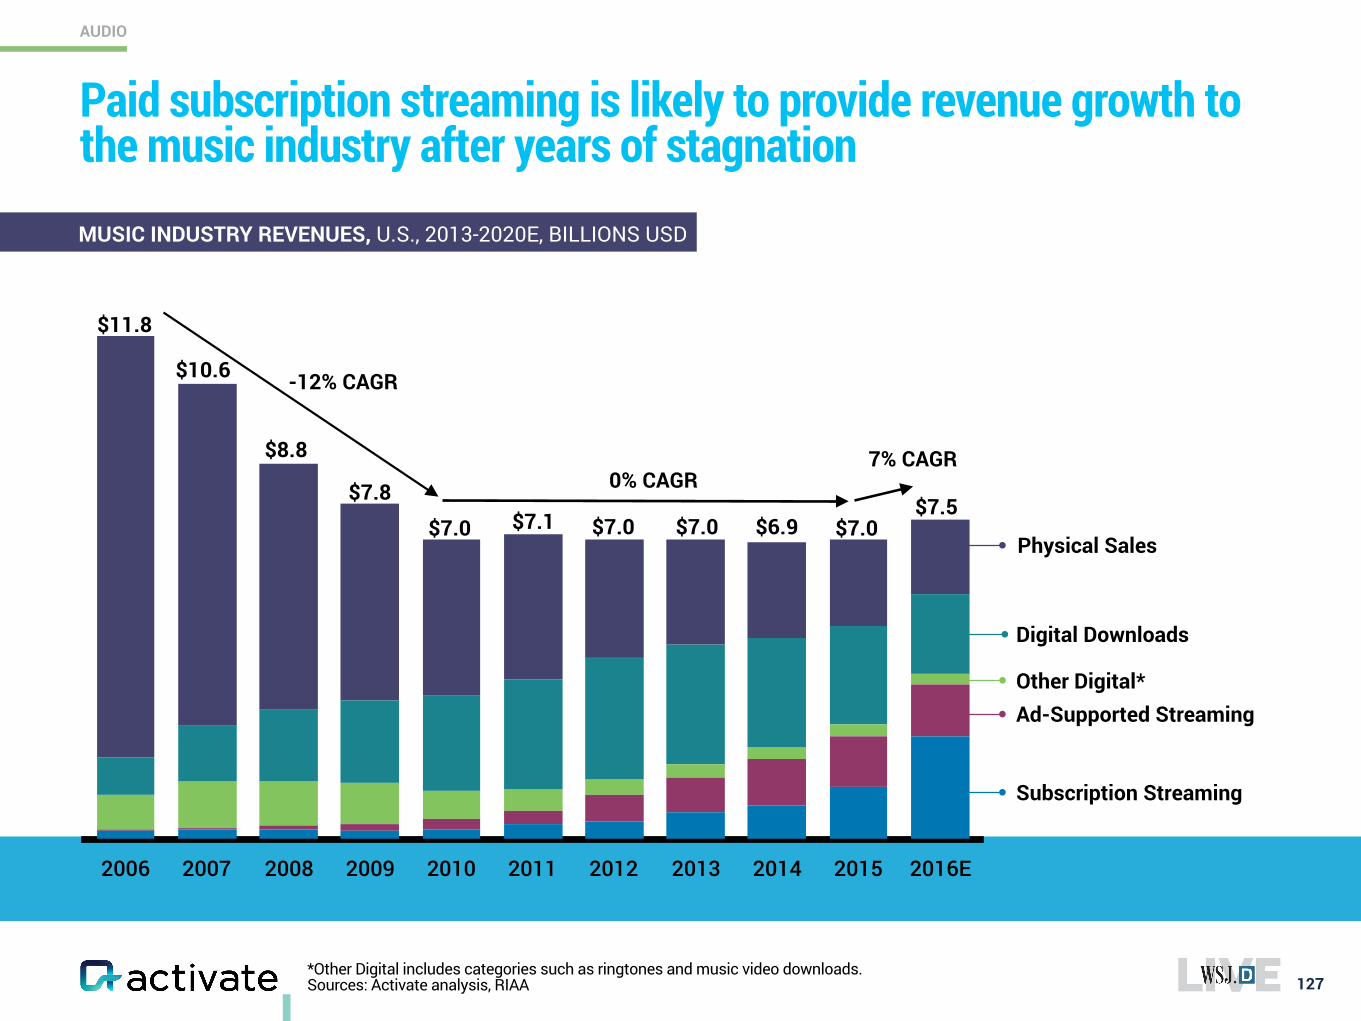
*Other Digital includes categories such as ringtones and music video downloads. Sources: Activate analysis, RIAA
Paid subscription streaming is likely to provide revenue growth to the music industry after years of stagnation
127
AUDIO
2006 2007 2008 2009 2010 2011 2012 2013 2014 2015 2016E
Physical Sales
Digital Downloads
Subscription Streaming
$11.8
$7.0$7.5
$10.6
$8.8
$7.8$7.1 $7.0 $7.0 $6.9 $7.0
0% CAGR
-12% CAGR
7% CAGR
MUSIC INDUSTRY REVENUES, U.S., 2013-2020E, BILLIONS USD
Ad-Supported StreamingOther Digital*
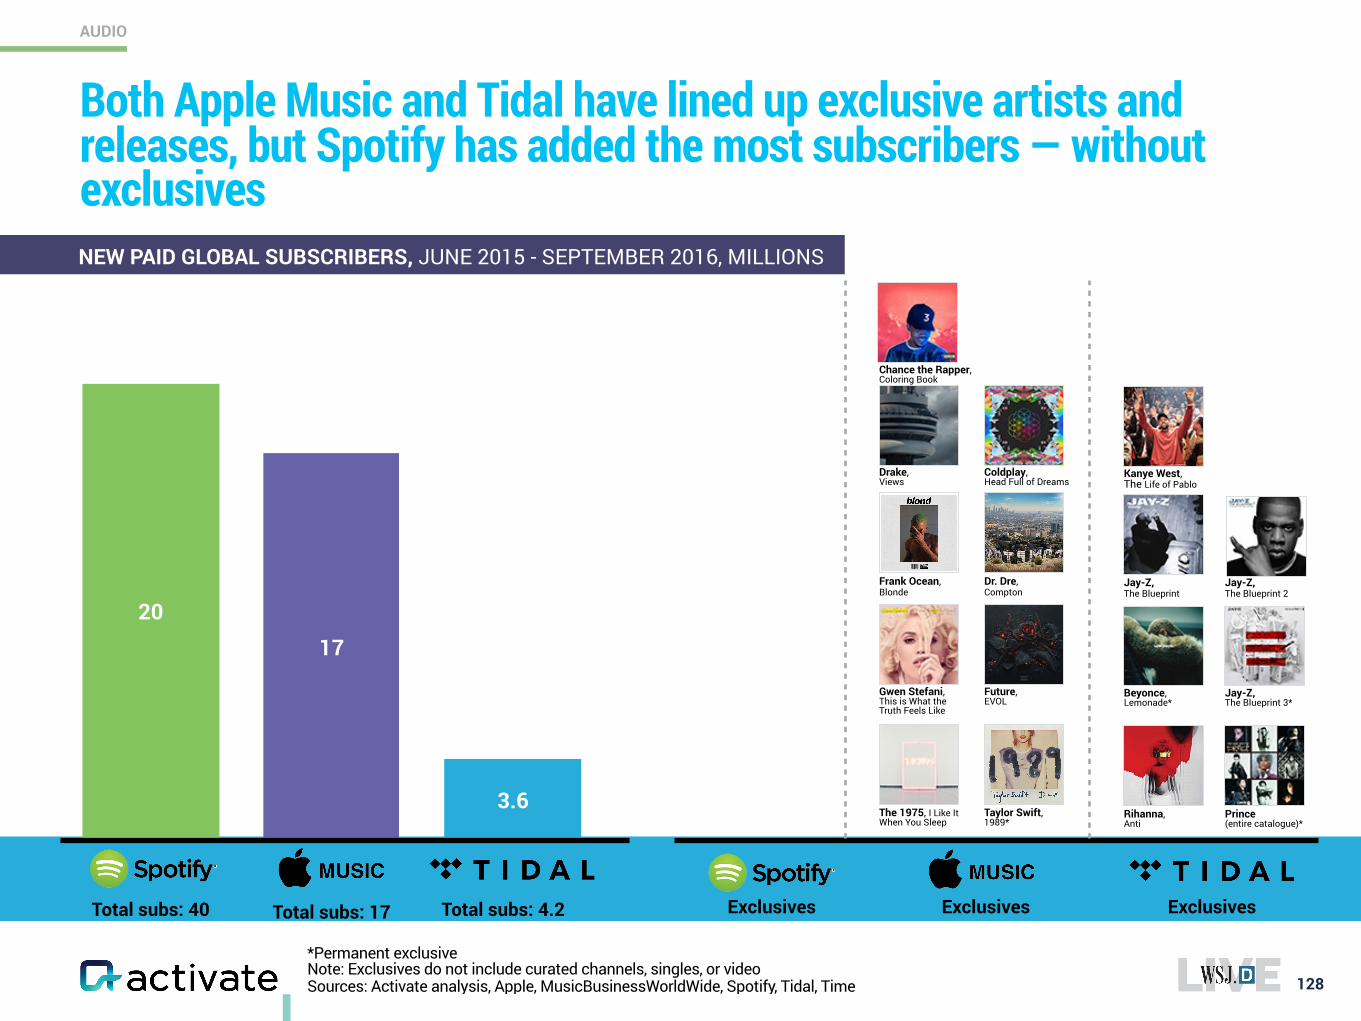
Both Apple Music and Tidal have lined up exclusive artists and releases, but Spotify has added the most subscribers — without exclusives
128
AUDIO
*Permanent exclusive Note: Exclusives do not include curated channels, singles, or video Sources: Activate analysis, Apple, MusicBusinessWorldWide, Spotify, Tidal, Time
20
300%
17
Chance the Rapper, Coloring Book
Exclusives
1,580%
3.6
Exclusives
Kanye West, The Life of Pablo
The 1975, I Like It When You Sleep
Taylor Swift, 1989*
Gwen Stefani, This is What the Truth Feels Like
Future, EVOL
Frank Ocean, Blonde
Dr. Dre, Compton
Drake, Views
Coldplay, Head Full of Dreams
Rihanna, Anti
Prince (entire catalogue)*
Beyonce, Lemonade*
Jay-Z, The Blueprint 2
Jay-Z, The Blueprint 3*
Jay-Z, The Blueprint
NEW PAID GLOBAL SUBSCRIBERS, JUNE 2015 - SEPTEMBER 2016, MILLIONS
Total subs: 40 Total subs: 17 Total subs: 4.2 Exclusives
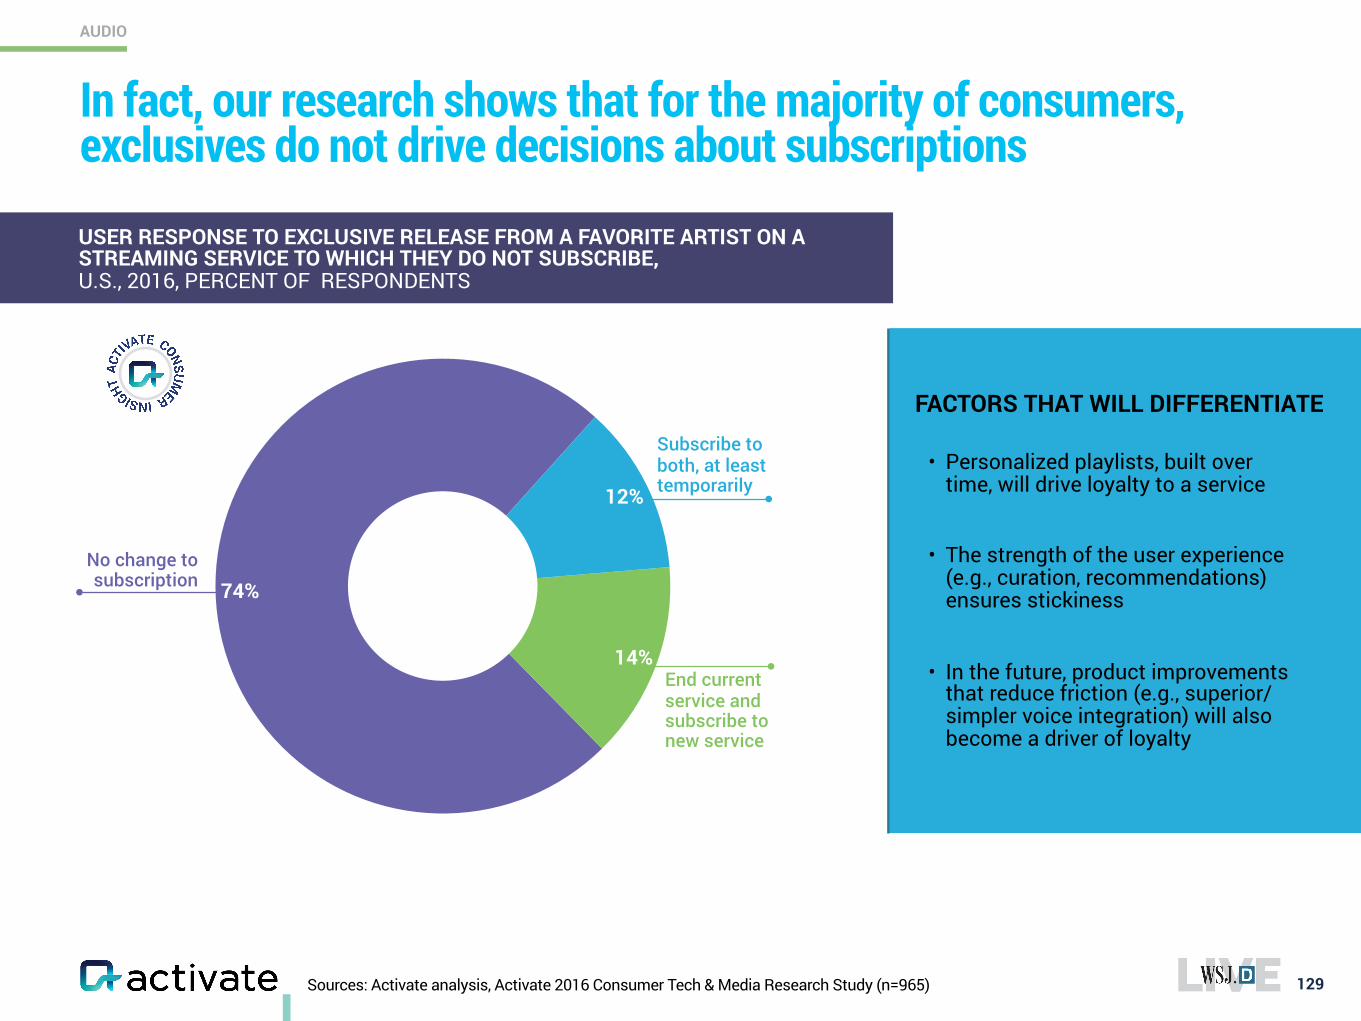
End current service and subscribe to new service
Sources: Activate analysis, Activate 2016 Consumer Tech & Media Research Study (n=965) 129
In fact, our research shows that for the majority of consumers, exclusives do not drive decisions about subscriptions
Subscribe to both, at least temporarily
74%
14%
12%
No change to subscription
• Personalized playlists, built over time, will drive loyalty to a service
• The strength of the user experience (e.g., curation, recommendations) ensures stickiness
• In the future, product improvements that reduce friction (e.g., superior/ simpler voice integration) will also become a driver of loyalty
USER RESPONSE TO EXCLUSIVE RELEASE FROM A FAVORITE ARTIST ON A STREAMING SERVICE TO WHICH THEY DO NOT SUBSCRIBE, U.S., 2016, PERCENT OF RESPONDENTS
FACTORS THAT WILL DIFFERENTIATE
AUDIO
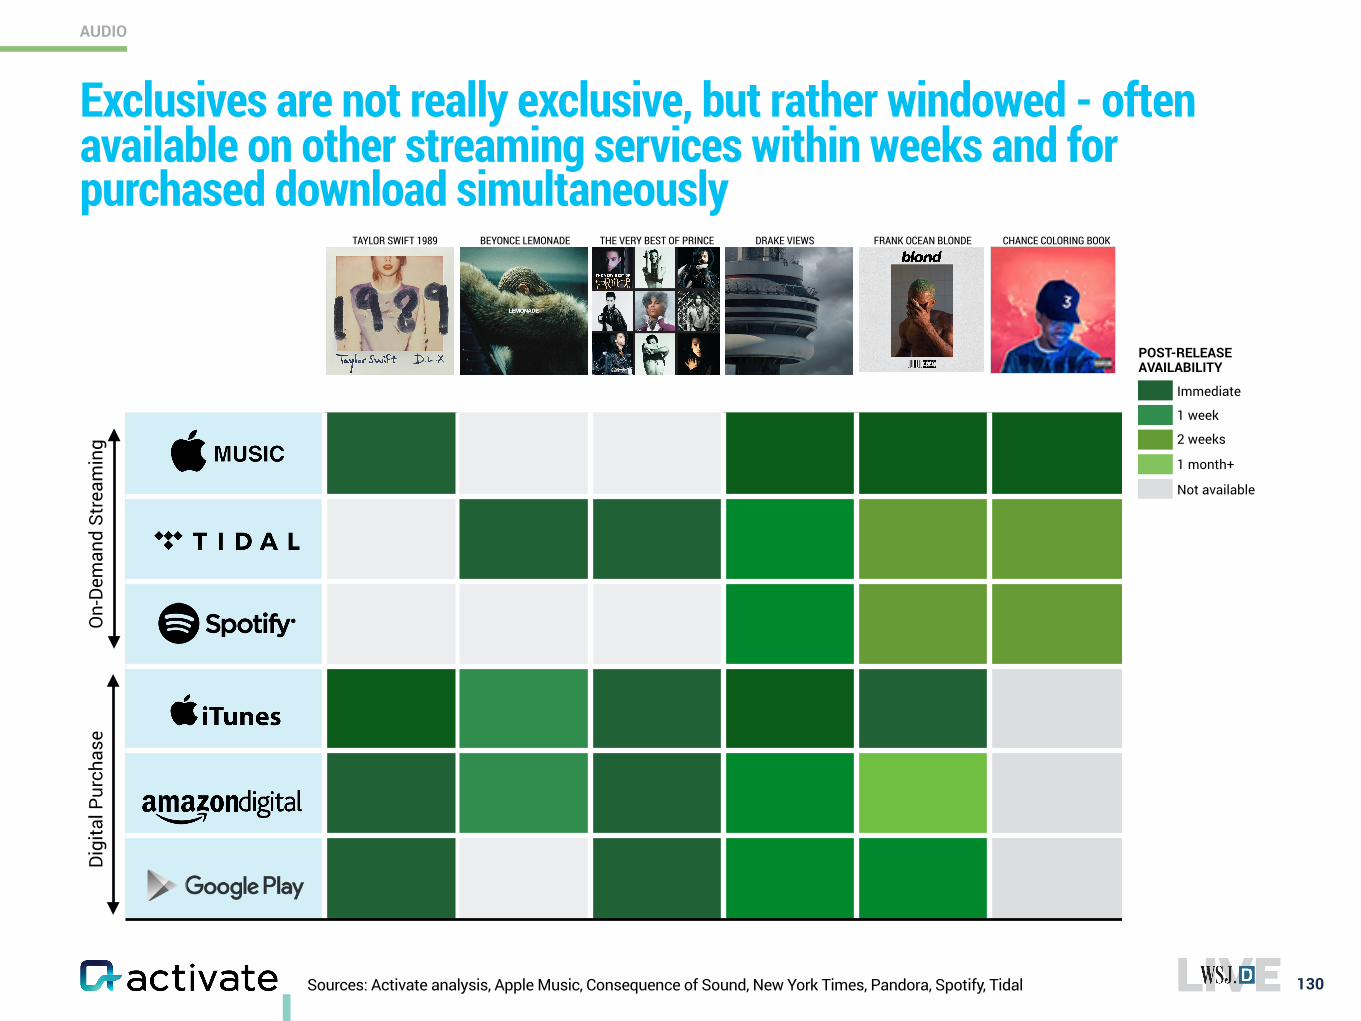
Sources: Activate analysis, Apple Music, Consequence of Sound, New York Times, Pandora, Spotify, Tidal 130
Immediate
1 week
2 weeks
Not available
1 month+
TAYLOR SWIFT 1989 BEYONCE LEMONADE THE VERY BEST OF PRINCE DRAKE VIEWS FRANK OCEAN BLONDE CHANCE COLORING BOOK
Exclusives are not really exclusive, but rather windowed - often available on other streaming services within weeks and for purchased download simultaneously
POST-RELEASE AVAILABILITY
Digi
tal P
urch
ase
On-
Dem
and
Stre
amin
g
AUDIO
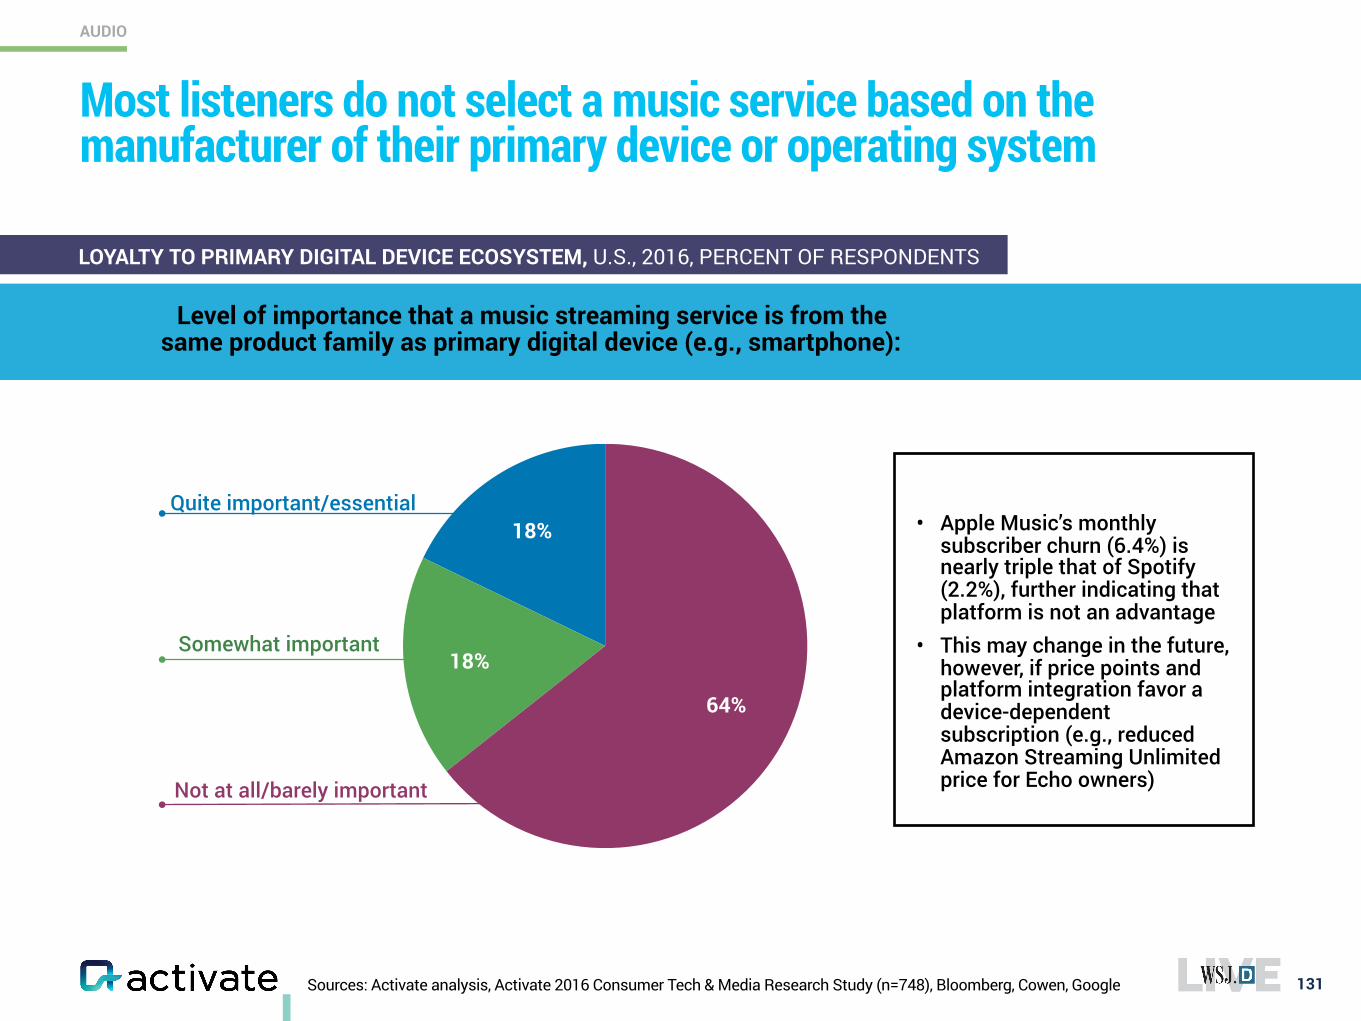
Somewhat important
Sources: Activate analysis, Activate 2016 Consumer Tech & Media Research Study (n=748), Bloomberg, Cowen, Google
Most listeners do not select a music service based on the manufacturer of their primary device or operating system
131
AUDIO
18%
18%
64%
Quite important/essential
Not at all/barely important
LOYALTY TO PRIMARY DIGITAL DEVICE ECOSYSTEM, U.S., 2016, PERCENT OF RESPONDENTS
• Apple Music’s monthly subscriber churn (6.4%) is nearly triple that of Spotify (2.2%), further indicating that platform is not an advantage
• This may change in the future, however, if price points and platform integration favor a device-dependent subscription (e.g., reduced Amazon Streaming Unlimited price for Echo owners)
Level of importance that a music streaming service is from the same product family as primary digital device (e.g., smartphone):
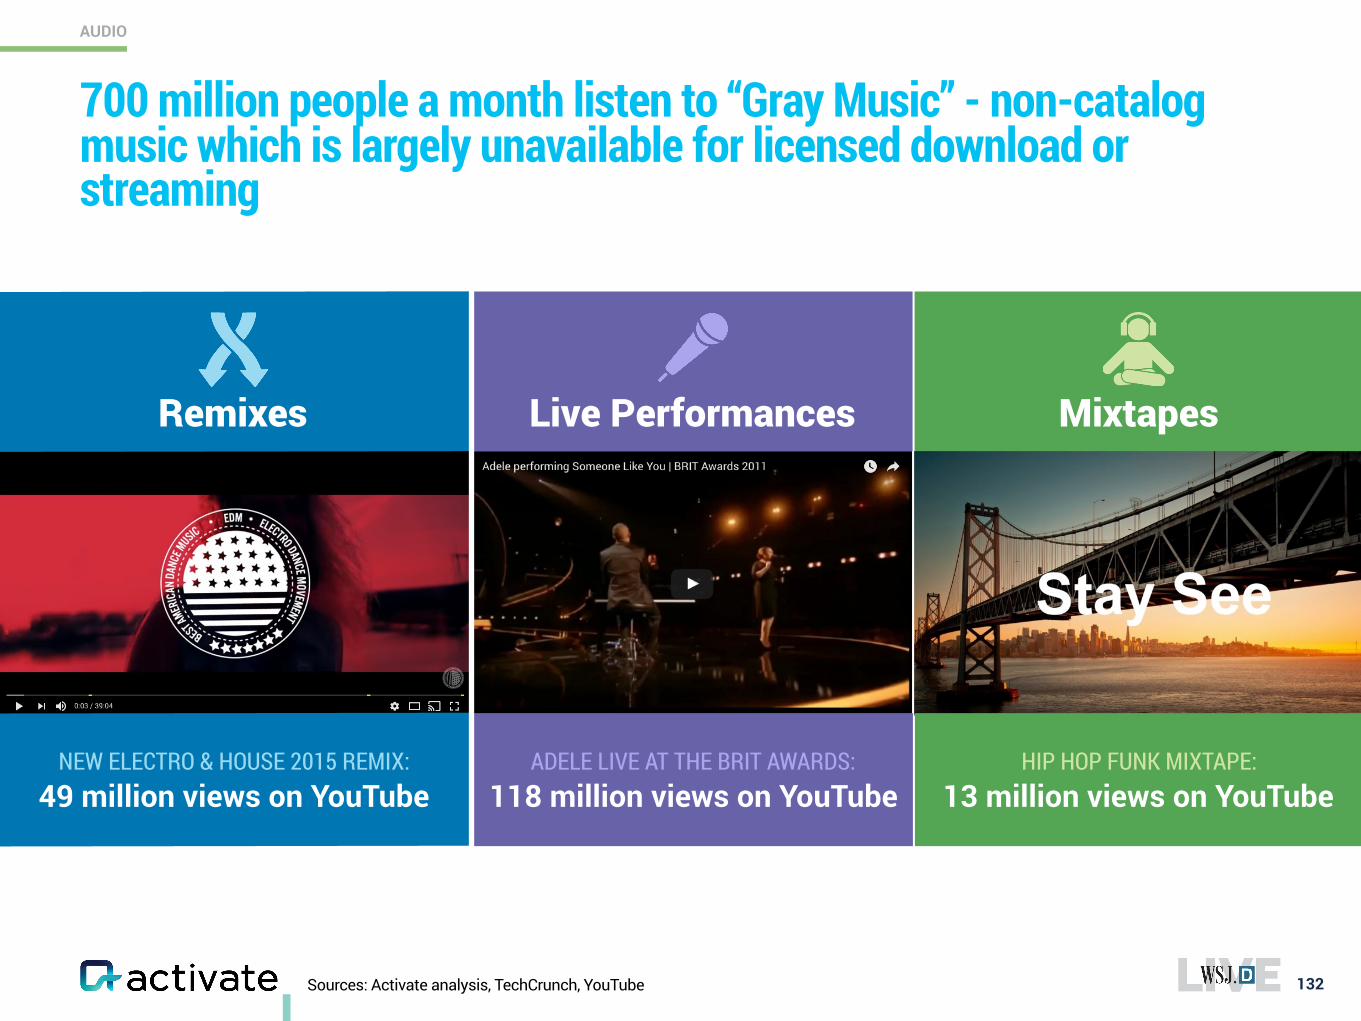
Sources: Activate analysis, TechCrunch, YouTube
700 million people a month listen to “Gray Music” - non-catalog music which is largely unavailable for licensed download or streaming
132
AUDIO
Remixes
NEW ELECTRO & HOUSE 2015 REMIX: 49 million views on YouTube
Mixtapes
HIP HOP FUNK MIXTAPE: 13 million views on YouTube
Live Performances
ADELE LIVE AT THE BRIT AWARDS: 118 million views on YouTube
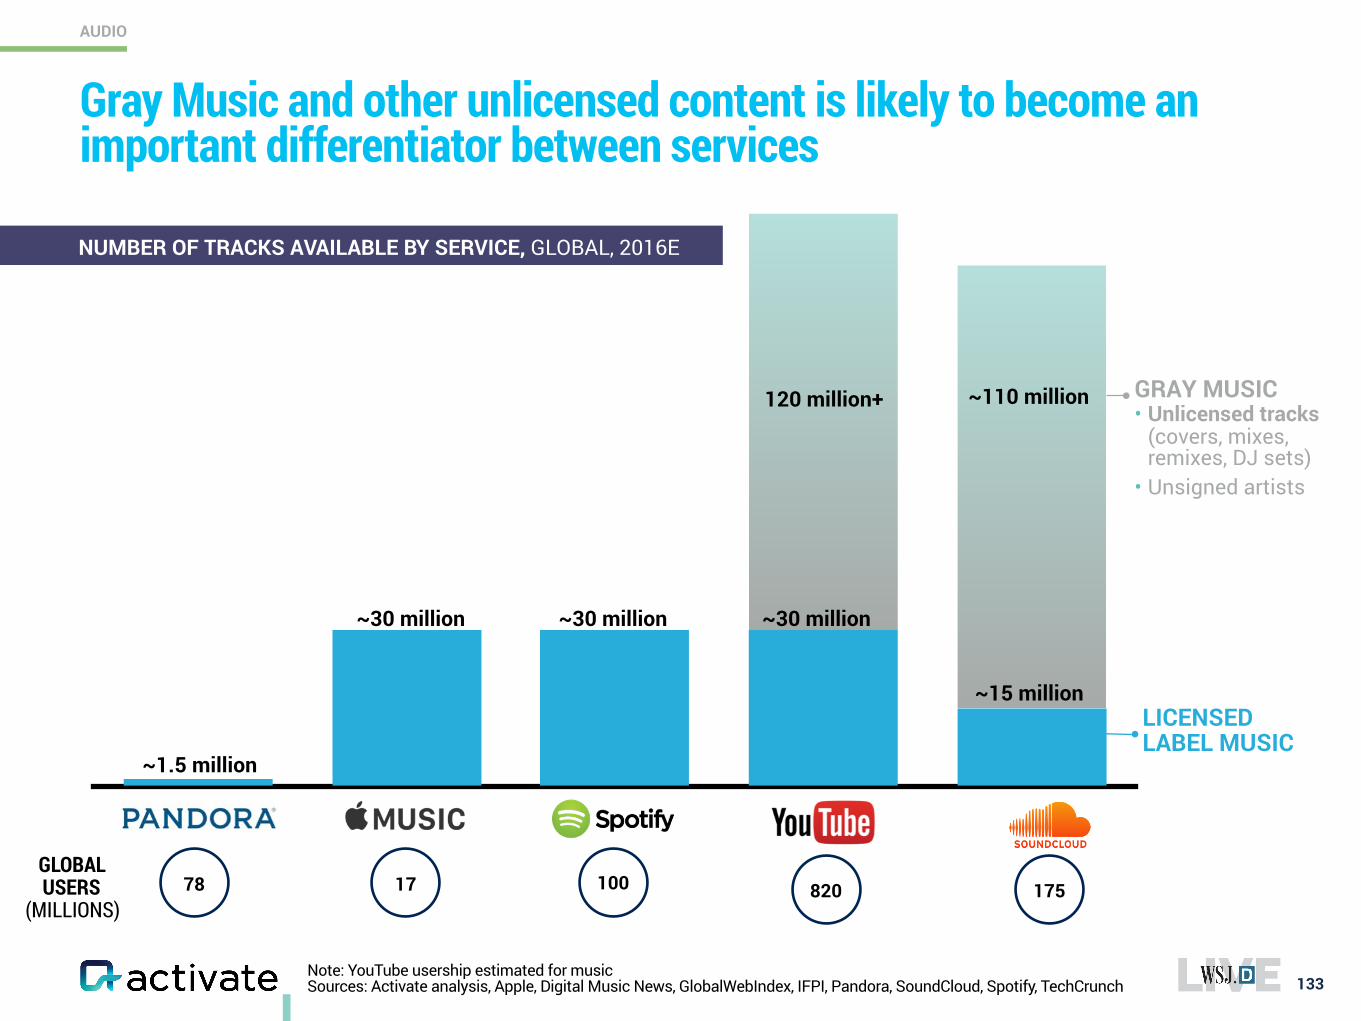
Gray Music and other unlicensed content is likely to become an important differentiator between services
133
AUDIO
Note: YouTube usership estimated for music Sources: Activate analysis, Apple, Digital Music News, GlobalWebIndex, IFPI, Pandora, SoundCloud, Spotify, TechCrunch
~1.5 million
~30 million
~110 million
~30 million
120 million+
LICENSED LABEL MUSIC
~15 million
GLOBAL USERS
(MILLIONS)78 10017 175820
GRAY MUSIC • Unlicensed tracks
(covers, mixes, remixes, DJ sets)
• Unsigned artists
~30 million
NUMBER OF TRACKS AVAILABLE BY SERVICE, GLOBAL, 2016E
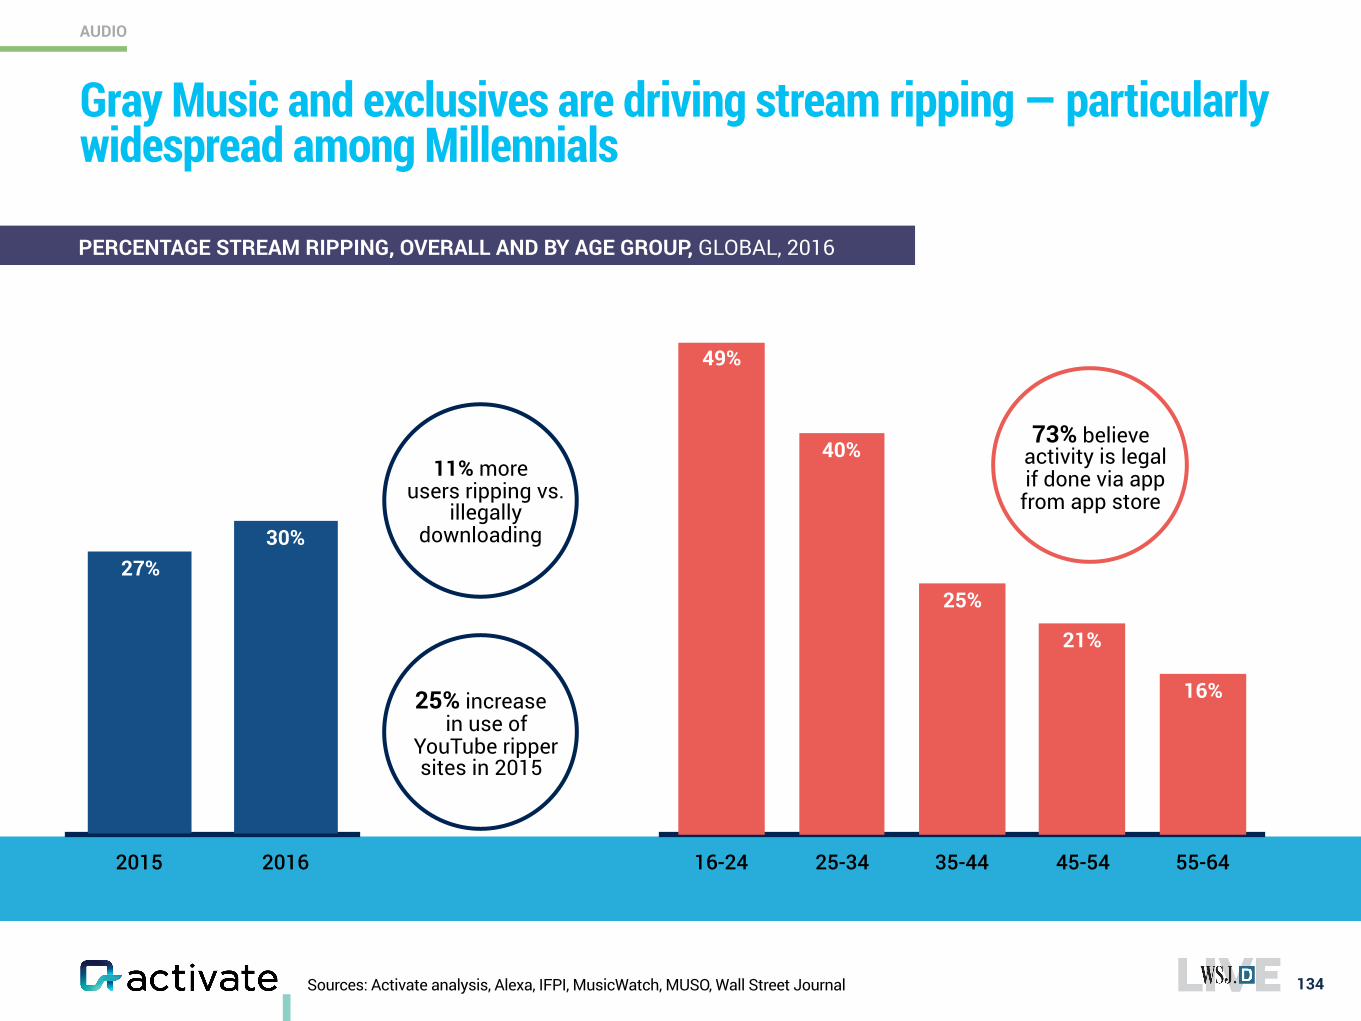
Sources: Activate analysis, Alexa, IFPI, MusicWatch, MUSO, Wall Street Journal 134
Gray Music and exclusives are driving stream ripping — particularly widespread among Millennials
16-24 25-34 35-44 45-54 55-64
16%
21%
25%
40%
49%
25% increase in use of
YouTube ripper sites in 2015
2015 2016
30%27%
11% more users ripping vs.
illegally downloading
73% believe activity is legal if done via app
from app store
PERCENTAGE STREAM RIPPING, OVERALL AND BY AGE GROUP, GLOBAL, 2016
AUDIO
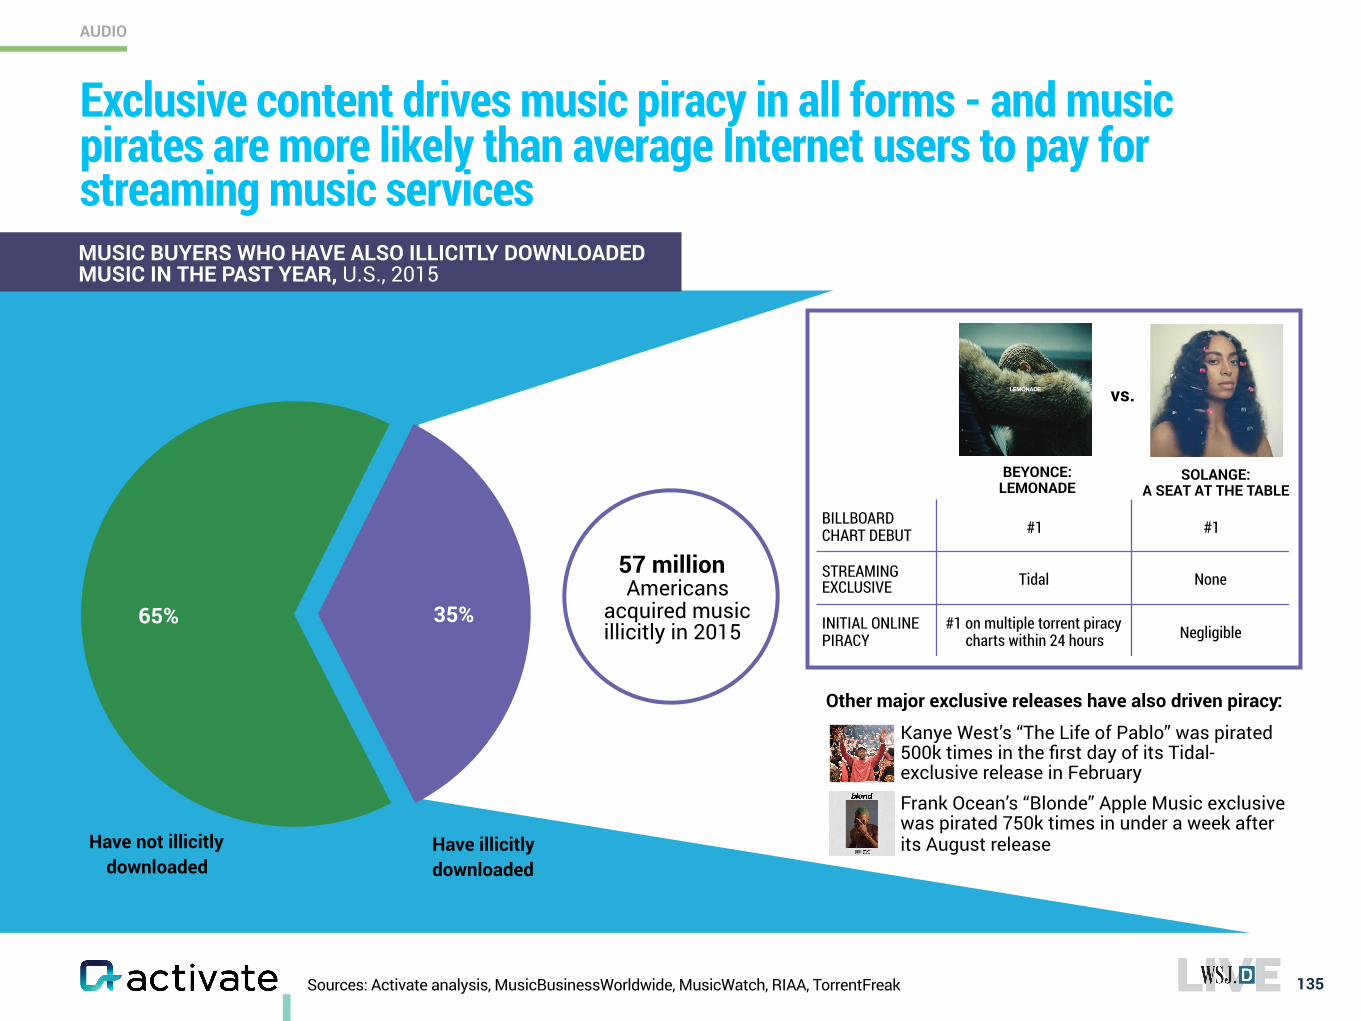
Sources: Activate analysis, MusicBusinessWorldwide, MusicWatch, RIAA, TorrentFreak 135
Exclusive content drives music piracy in all forms - and music pirates are more likely than average Internet users to pay for streaming music services
65% 35%
MUSIC BUYERS WHO HAVE ALSO ILLICITLY DOWNLOADED MUSIC IN THE PAST YEAR, U.S., 2015
57 million Americans
acquired music illicitly in 2015
Other major exclusive releases have also driven piracy:
• Kanye West’s “The Life of Pablo” was pirated 500k times in the first day of its Tidal-exclusive release in February
• Frank Ocean’s “Blonde” Apple Music exclusive was pirated 750k times in under a week after its August release
vs.
BEYONCE: LEMONADE
SOLANGE: A SEAT AT THE TABLE
BILLBOARD CHART DEBUT #1 #1
STREAMING EXCLUSIVE Tidal None
INITIAL ONLINE PIRACY
#1 on multiple torrent piracy charts within 24 hours Negligible
AUDIO
Have not illicitly downloaded
Have illicitly downloaded
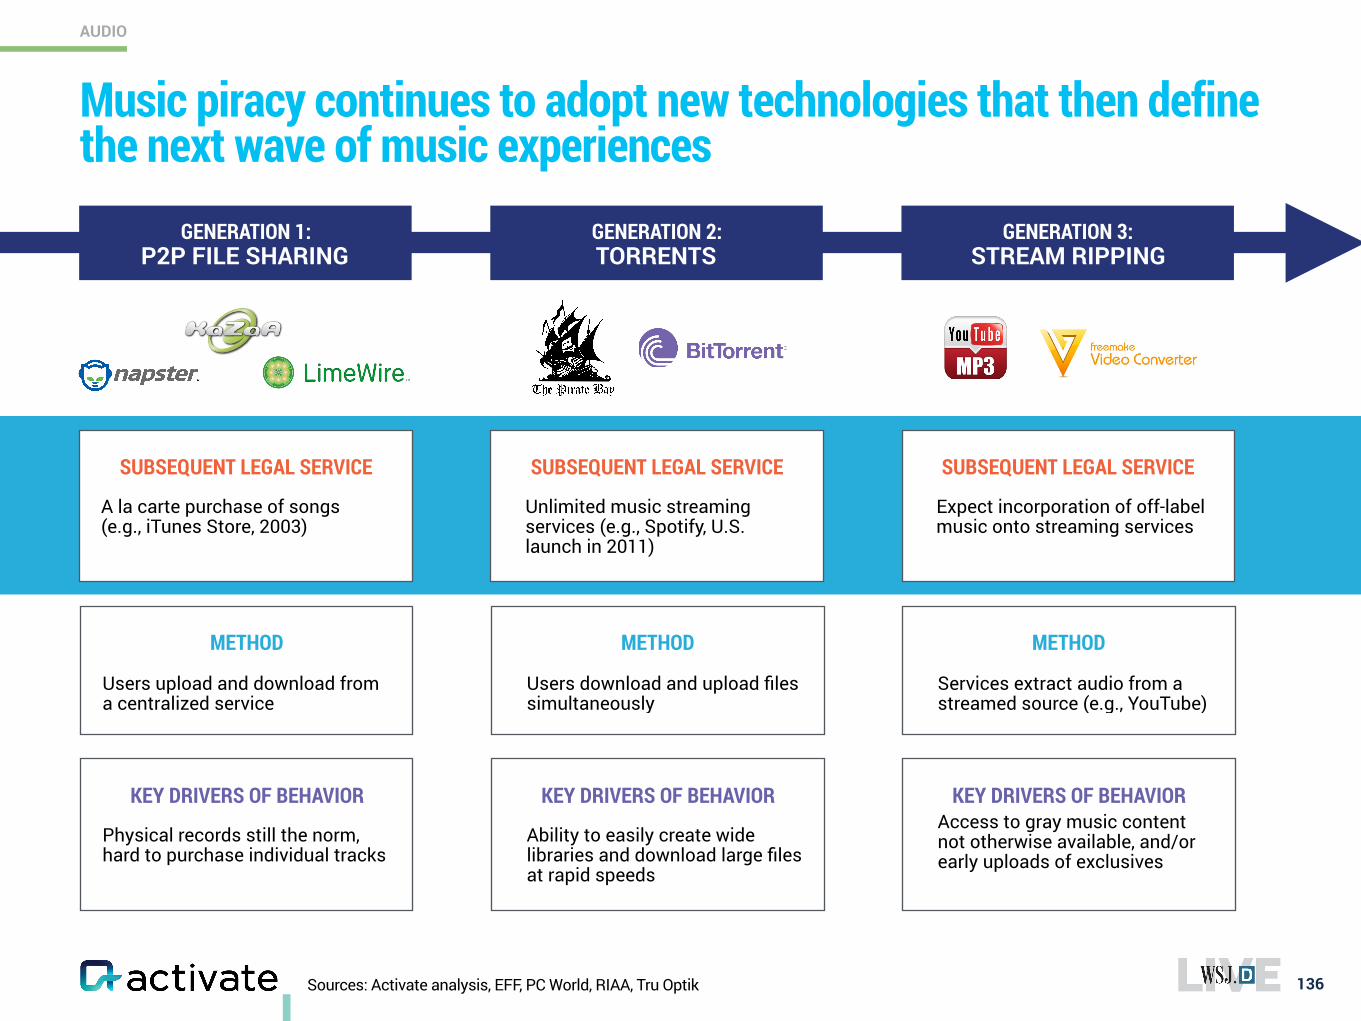
Sources: Activate analysis, EFF, PC World, RIAA, Tru Optik
Music piracy continues to adopt new technologies that then define the next wave of music experiences
136
AUDIO
METHOD
Users upload and download from a centralized service
METHOD
Users download and upload files simultaneously
METHOD
Services extract audio from a streamed source (e.g., YouTube)
KEY DRIVERS OF BEHAVIOR
Physical records still the norm, hard to purchase individual tracks
KEY DRIVERS OF BEHAVIOR
Ability to easily create wide libraries and download large files at rapid speeds
KEY DRIVERS OF BEHAVIOR Access to gray music content not otherwise available, and/or early uploads of exclusives
SUBSEQUENT LEGAL SERVICE
A la carte purchase of songs (e.g., iTunes Store, 2003)
SUBSEQUENT LEGAL SERVICE
Unlimited music streaming services (e.g., Spotify, U.S. launch in 2011)
SUBSEQUENT LEGAL SERVICE
Expect incorporation of off-label music onto streaming services
GENERATION 3:STREAM RIPPING
GENERATION 2:TORRENTS
GENERATION 1:P2P FILE SHARING
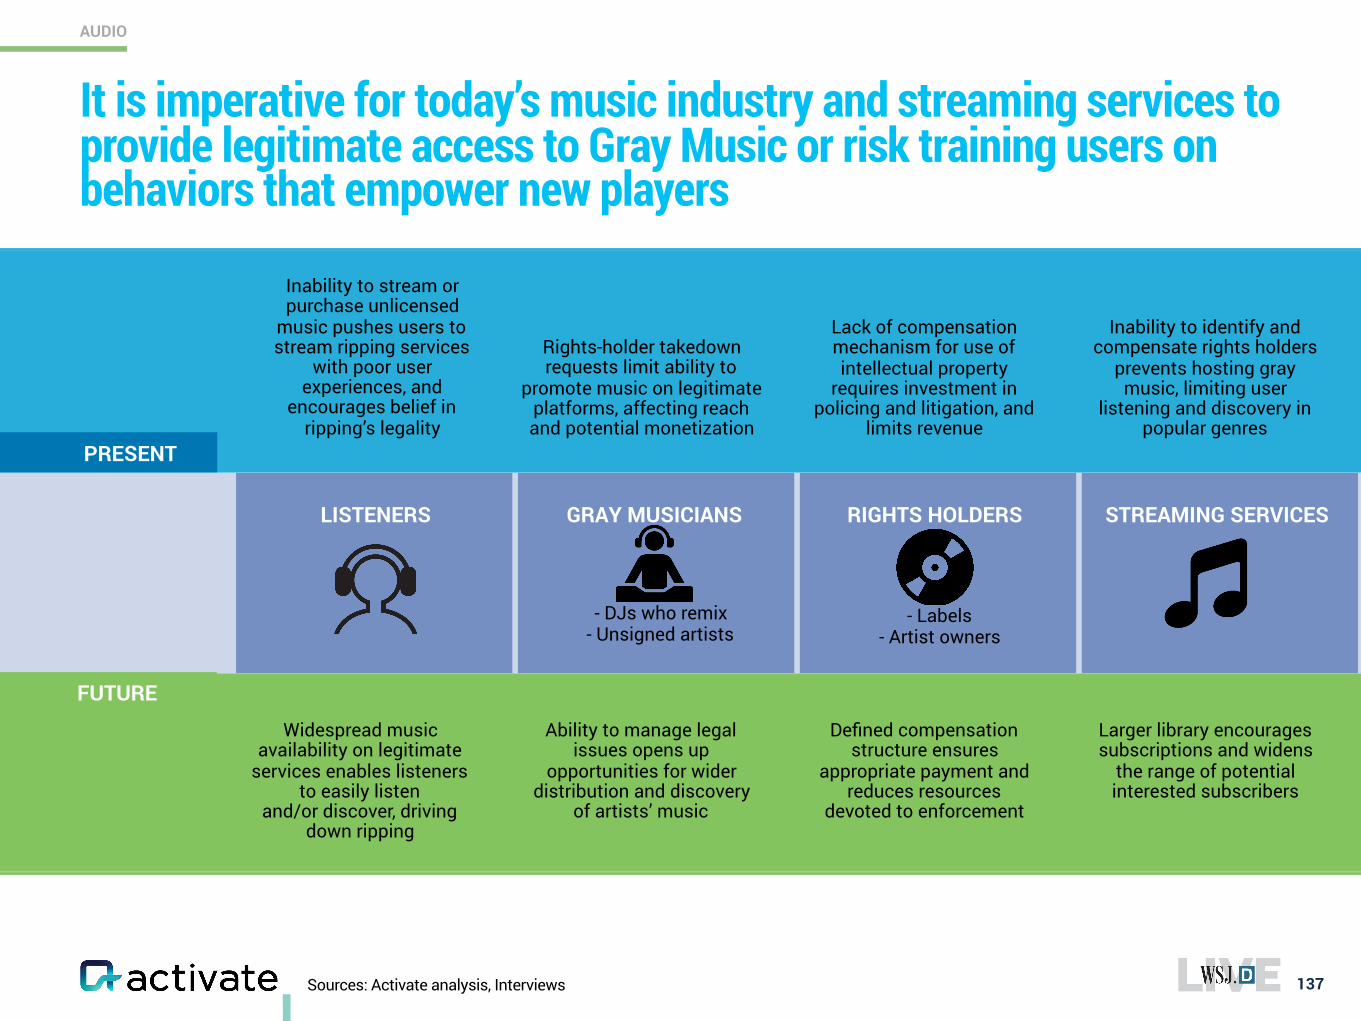
Inability to stream or purchase unlicensed
music pushes users to stream ripping services
with poor user experiences, and
encourages belief in ripping’s legality
Rights-holder takedown requests limit ability to
promote music on legitimate platforms, affecting reach and potential monetization
Lack of compensation mechanism for use of intellectual property
requires investment in policing and litigation, and
limits revenue
Inability to identify and compensate rights holders
prevents hosting gray music, limiting user
listening and discovery in popular genres
PRESENT
Sources: Activate analysis, Interviews
It is imperative for today’s music industry and streaming services to provide legitimate access to Gray Music or risk training users on behaviors that empower new players
137
AUDIO
Widespread music availability on legitimate
services enables listeners to easily listen
and/or discover, driving down ripping
Ability to manage legal issues opens up
opportunities for wider distribution and discovery
of artists’ music
Defined compensation structure ensures
appropriate payment and reduces resources
devoted to enforcement
Larger library encourages subscriptions and widens
the range of potential interested subscribers
FUTURE
GRAY MUSICIANS LISTENERS
- DJs who remix - Unsigned artists
RIGHTS HOLDERS
- Labels - Artist owners
STREAMING SERVICES
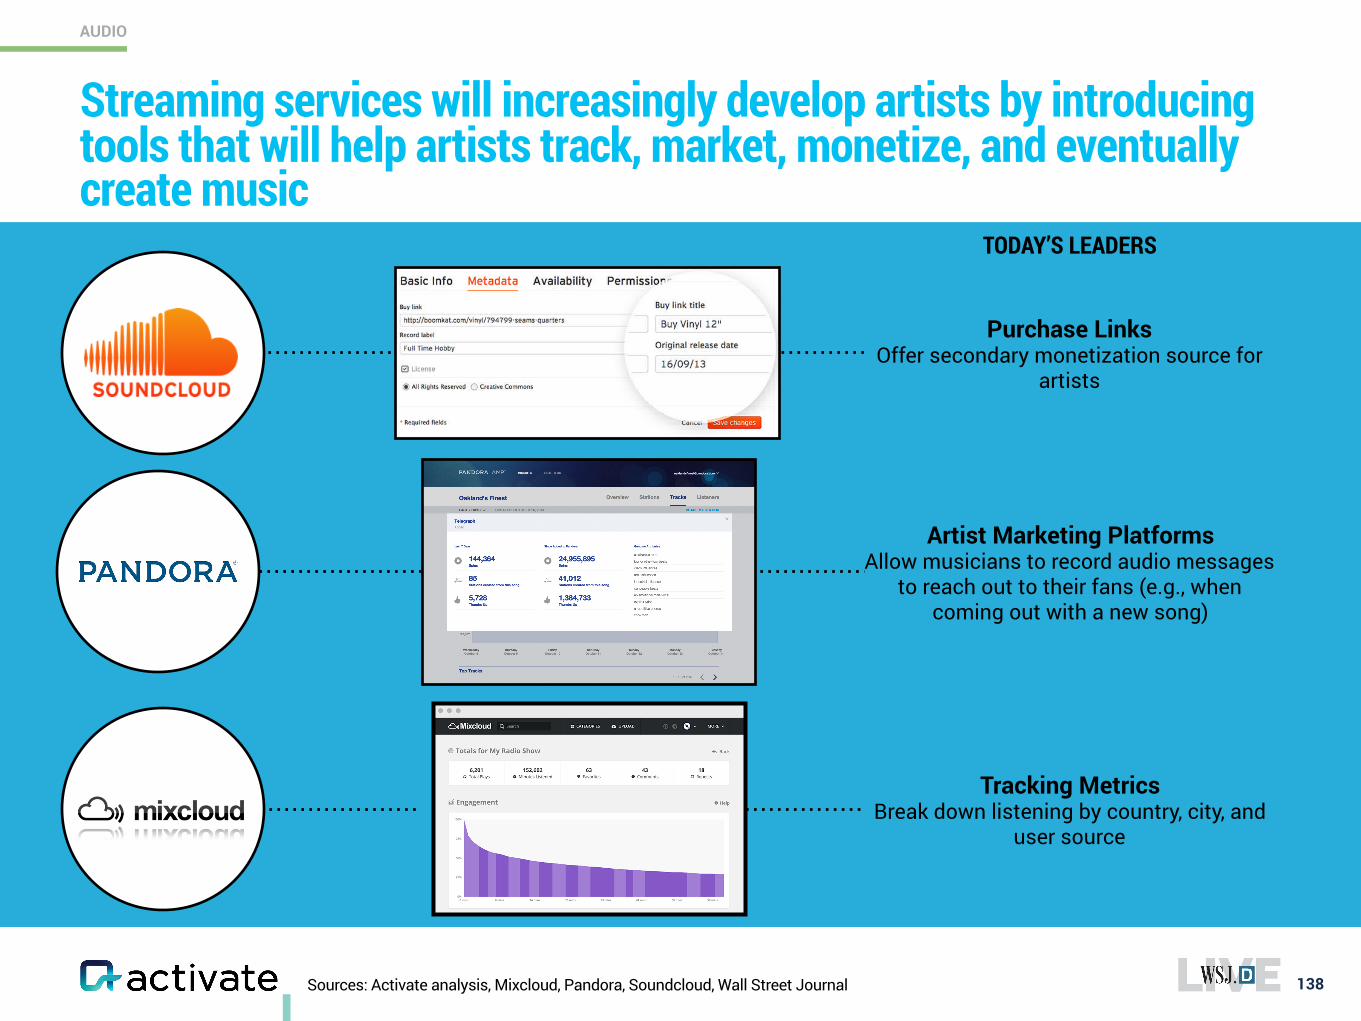
Streaming services will increasingly develop artists by introducing tools that will help artists track, market, monetize, and eventually create music
Sources: Activate analysis, Mixcloud, Pandora, Soundcloud, Wall Street Journal 138
Purchase Links Offer secondary monetization source for
artists
Tracking Metrics Break down listening by country, city, and
user source
Artist Marketing Platforms Allow musicians to record audio messages
to reach out to their fans (e.g., when coming out with a new song)
TODAY’S LEADERS
AUDIO
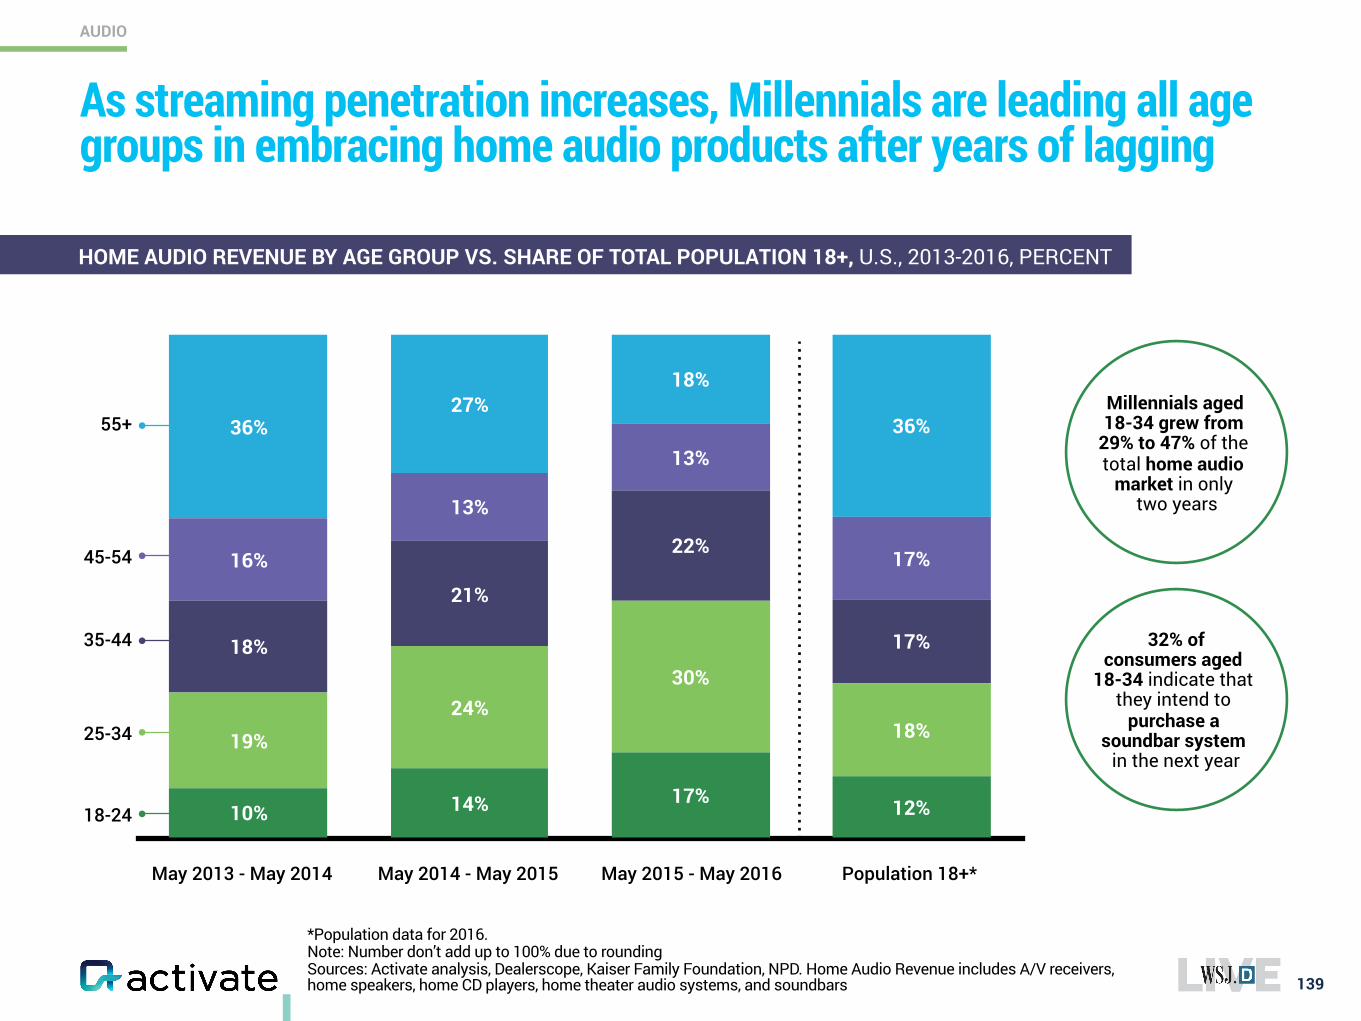
*Population data for 2016. Note: Number don’t add up to 100% due to rounding Sources: Activate analysis, Dealerscope, Kaiser Family Foundation, NPD. Home Audio Revenue includes A/V receivers, home speakers, home CD players, home theater audio systems, and soundbars 139
As streaming penetration increases, Millennials are leading all age groups in embracing home audio products after years of lagging
36%
18%27%
36%
17%
13%
13%
16%
17%
22%
21%
18%
18%
30%24%
19%
12%17%14%10%
May 2013 - May 2014 May 2014 - May 2015 May 2015 - May 2016
55+
45-54
35-44
25-34
18-24
Population 18+*
Millennials aged 18-34 grew from
29% to 47% of the total home audio
market in only two years
32% of consumers aged
18-34 indicate that they intend to
purchase a soundbar system
in the next year
HOME AUDIO REVENUE BY AGE GROUP VS. SHARE OF TOTAL POPULATION 18+, U.S., 2013-2016, PERCENT
AUDIO
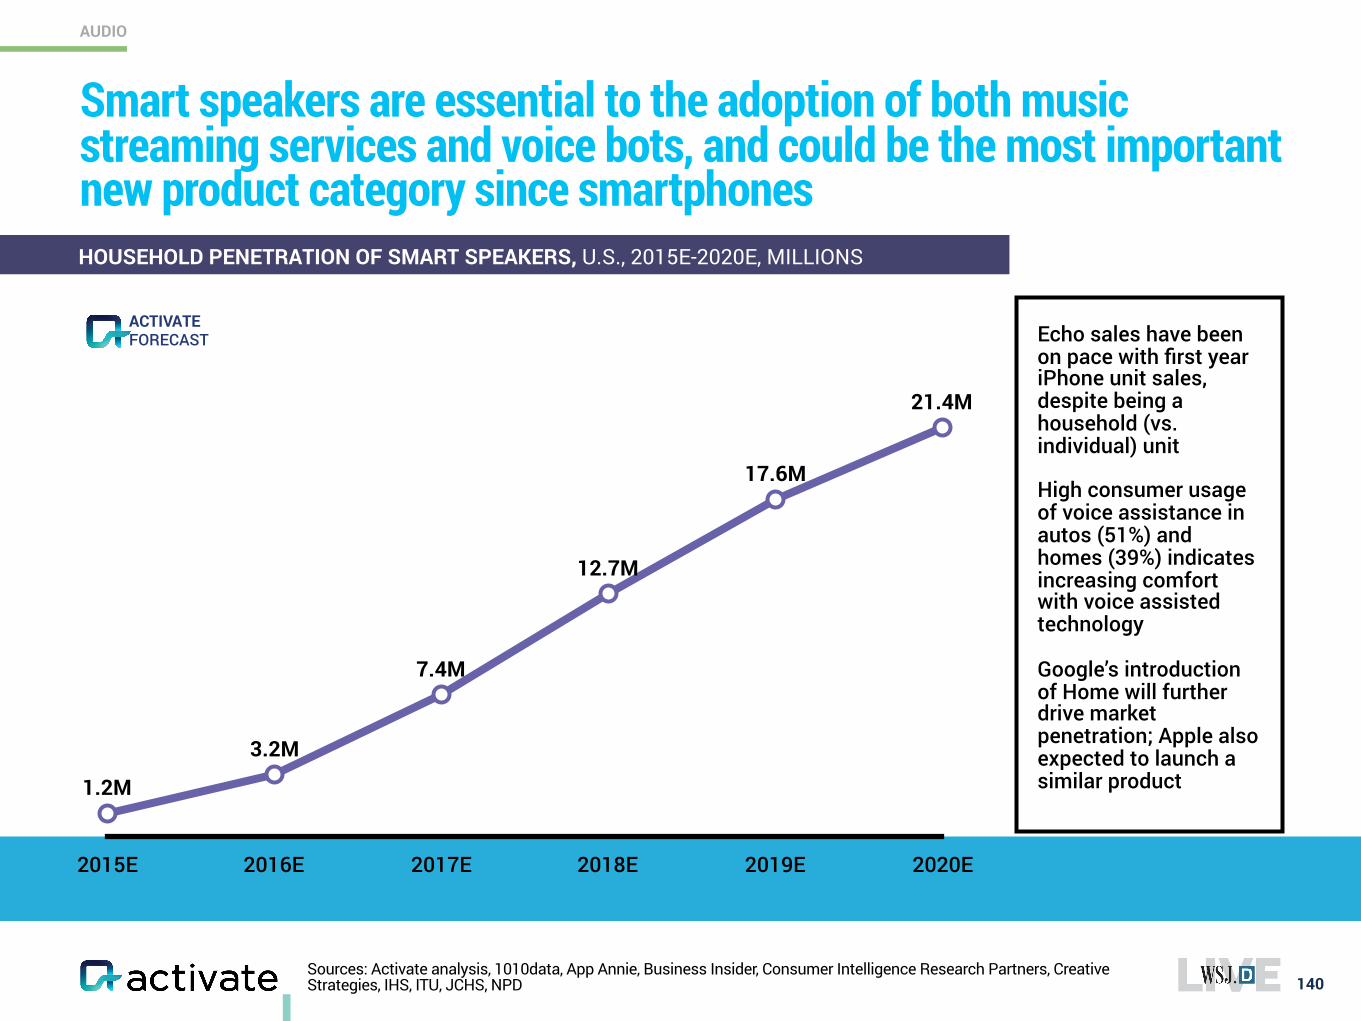
Sources: Activate analysis, 1010data, App Annie, Business Insider, Consumer Intelligence Research Partners, Creative Strategies, IHS, ITU, JCHS, NPD 140
Smart speakers are essential to the adoption of both music streaming services and voice bots, and could be the most important new product category since smartphones
2015E 2016E 2017E 2018E 2019E 2020E
1.2M
3.2M
7.4M
12.7M
17.6M
21.4M
Echo sales have been on pace with first year iPhone unit sales, despite being a household (vs. individual) unit
High consumer usage of voice assistance in autos (51%) and homes (39%) indicates increasing comfort with voice assisted technology
Google’s introduction of Home will further drive market penetration; Apple also expected to launch a similar product
HOUSEHOLD PENETRATION OF SMART SPEAKERS, U.S., 2015E-2020E, MILLIONS
FORECASTACTIVATE
AUDIO
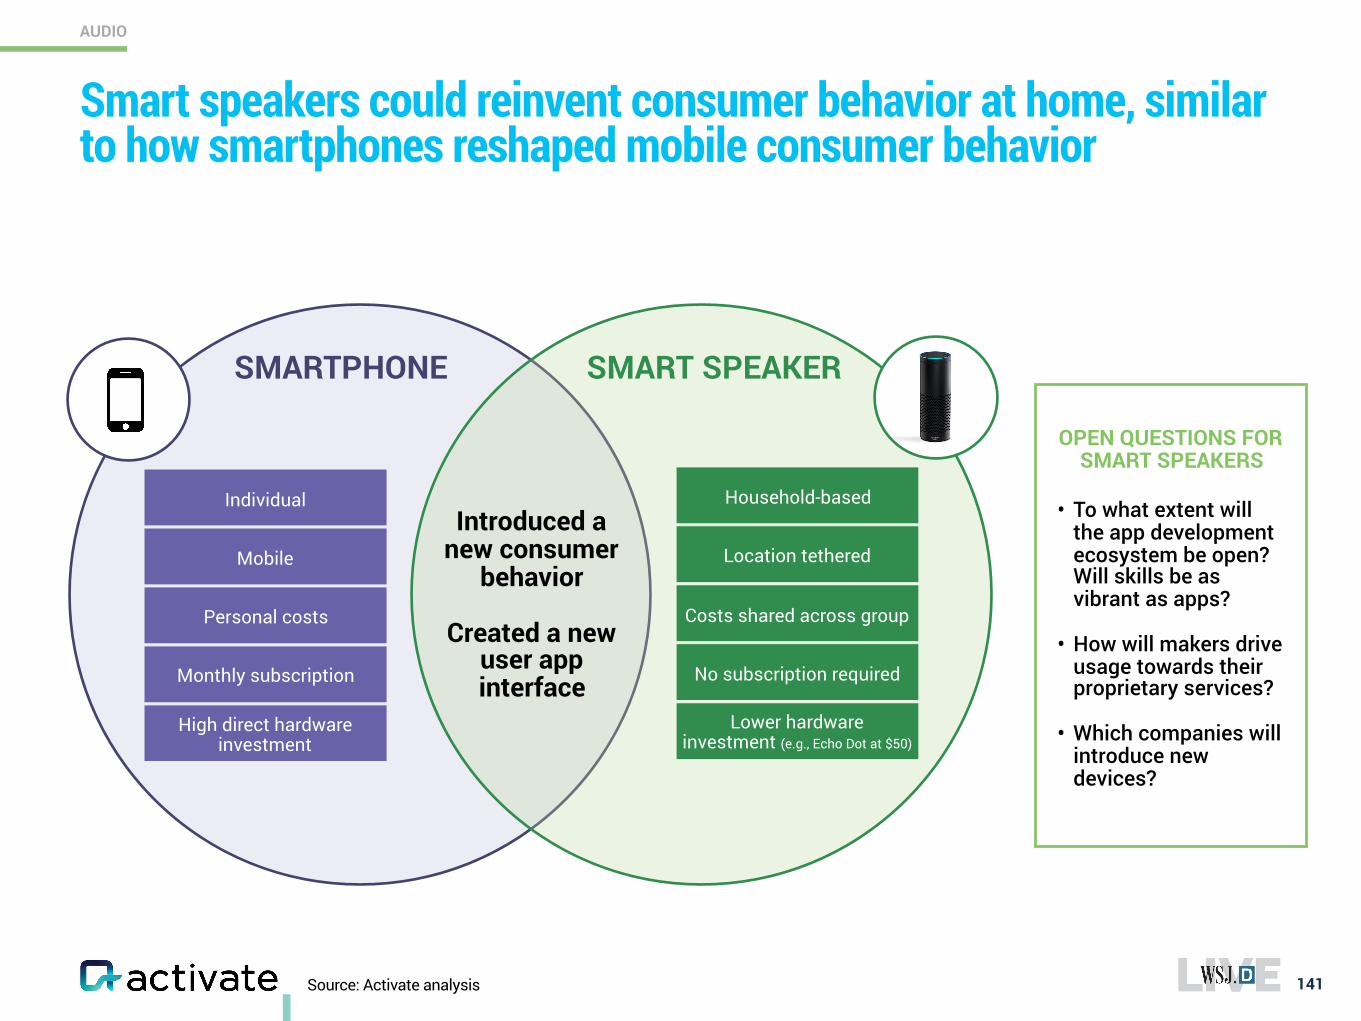
• To what extent will the app development ecosystem be open? Will skills be as vibrant as apps?
• How will makers drive usage towards their proprietary services?
• Which companies will introduce new devices?
Source: Activate analysis
Smart speakers could reinvent consumer behavior at home, similar to how smartphones reshaped mobile consumer behavior
141
AUDIO
SMARTPHONE SMART SPEAKER
Introduced a new consumer
behavior
Created a new user app interface
OPEN QUESTIONS FOR SMART SPEAKERS
Individual
Mobile
Personal costs
Monthly subscription
High direct hardware investment
Household-based
Location tethered
Costs shared across group
No subscription required
Lower hardware investment (e.g., Echo Dot at $50)
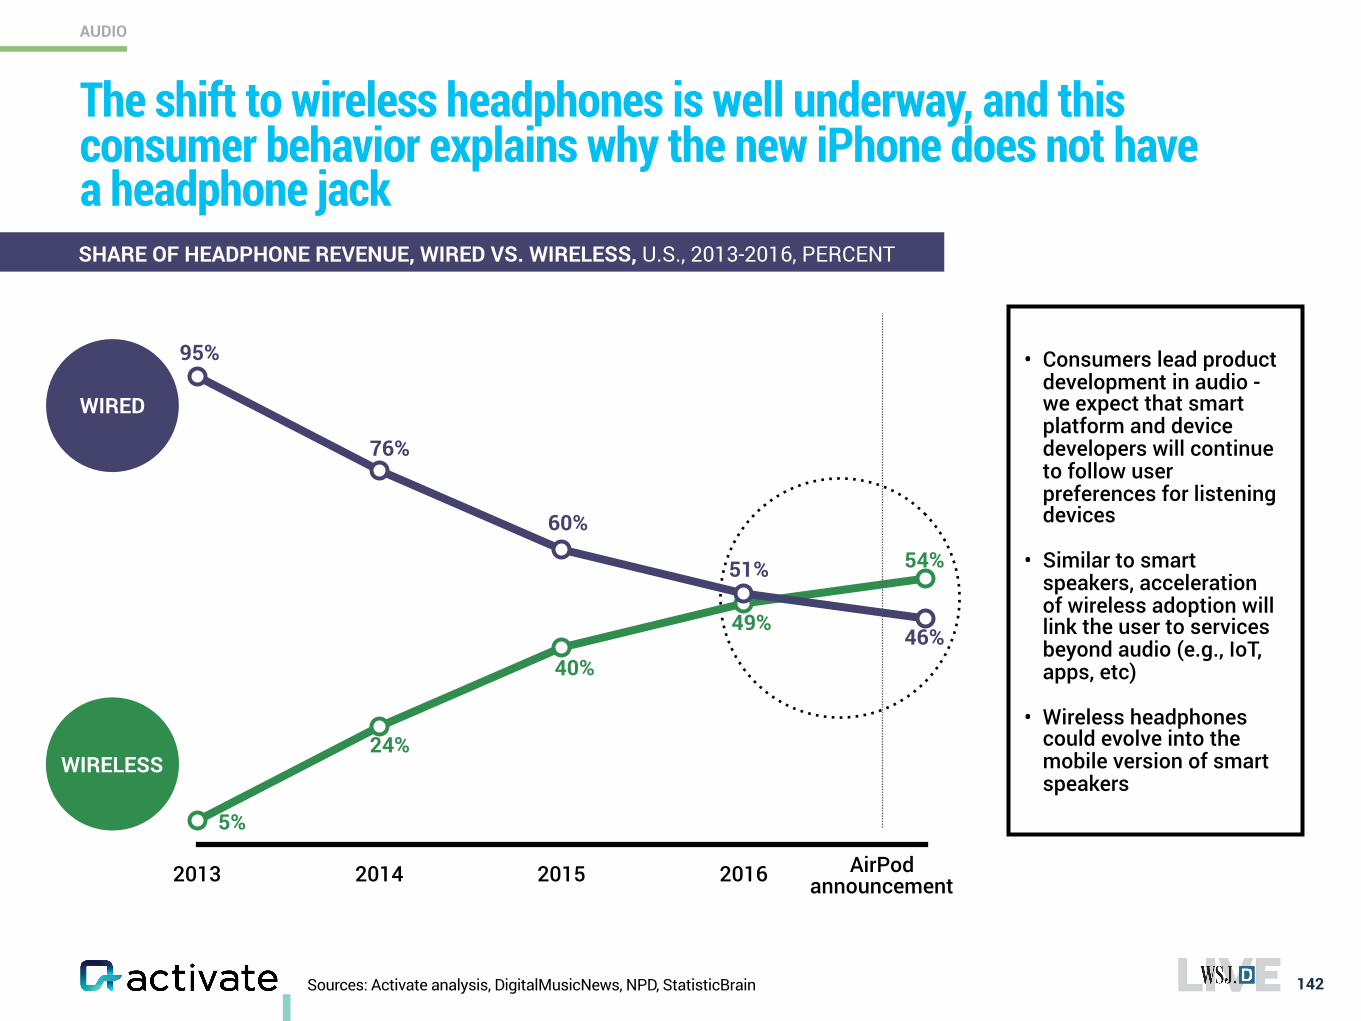
2013 2014 2015 2016
The shift to wireless headphones is well underway, and this consumer behavior explains why the new iPhone does not have a headphone jack
Sources: Activate analysis, DigitalMusicNews, NPD, StatisticBrain 142
AirPod announcement
• Consumers lead product development in audio - we expect that smart platform and device developers will continue to follow user preferences for listening devices
• Similar to smart speakers, acceleration of wireless adoption will link the user to services beyond audio (e.g., IoT, apps, etc)
• Wireless headphones could evolve into the mobile version of smart speakers
WIRED
WIRELESS
95%
76%
60%
51%
46%
54%
49%
40%
24%
5%
SHARE OF HEADPHONE REVENUE, WIRED VS. WIRELESS, U.S., 2013-2016, PERCENT
AUDIO
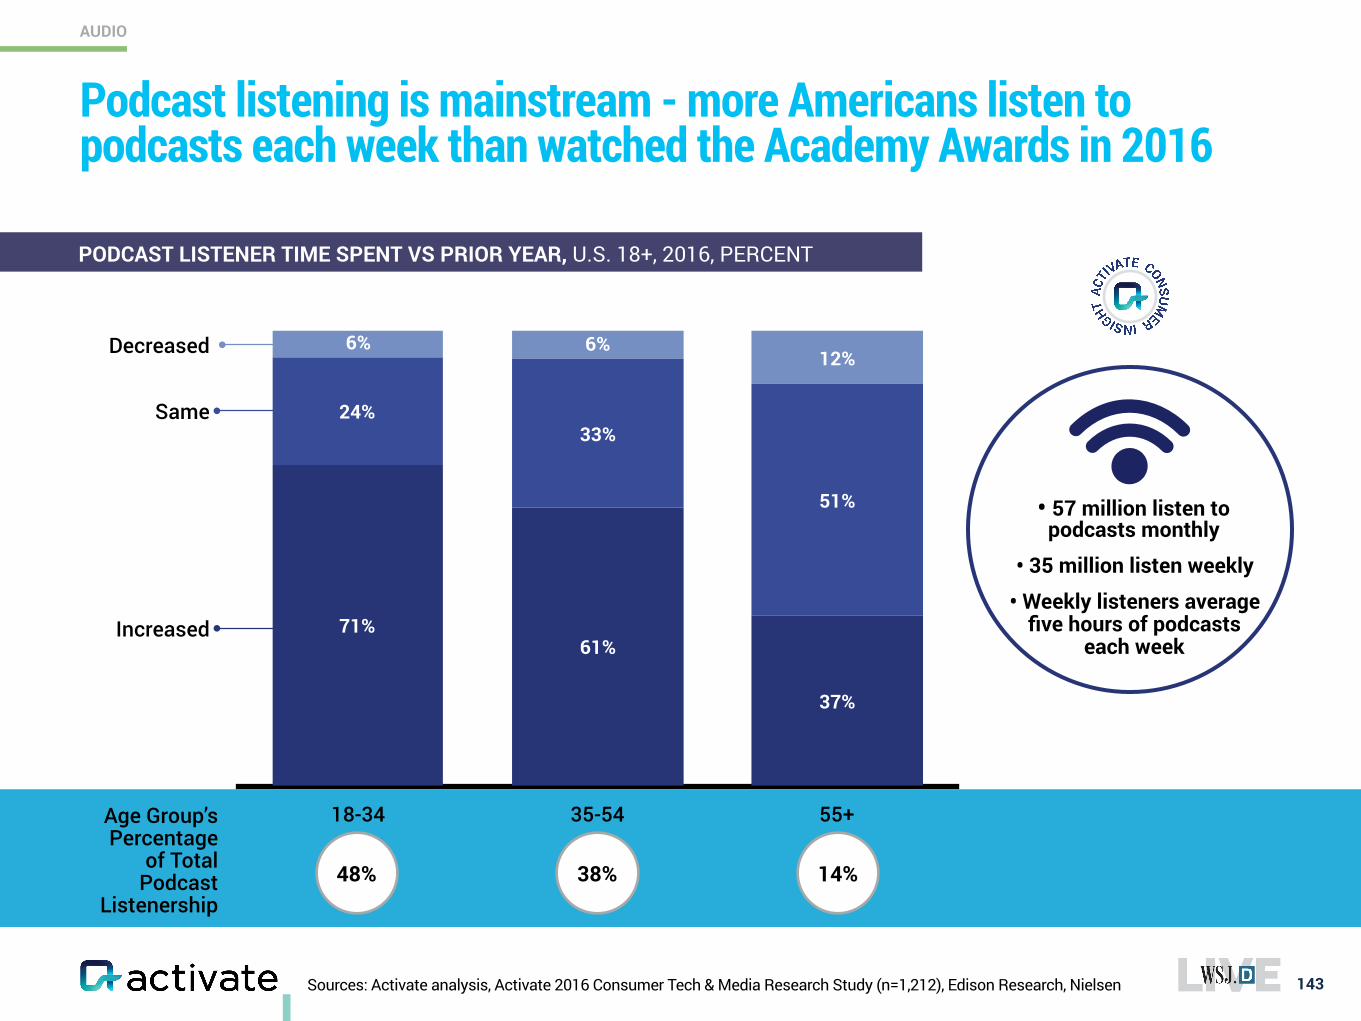
Sources: Activate analysis, Activate 2016 Consumer Tech & Media Research Study (n=1,212), Edison Research, Nielsen 143
Podcast listening is mainstream - more Americans listen to podcasts each week than watched the Academy Awards in 2016
• 57 million listen to podcasts monthly
• 35 million listen weekly
• Weekly listeners average five hours of podcasts
each week
18-34 35-54 55+
12%6%6%
51%
33%24%
37%
61%71%Increased
Same
Decreased
48% 38% 14%
Age Group’s Percentage
of Total Podcast
Listenership
PODCAST LISTENER TIME SPENT VS PRIOR YEAR, U.S. 18+, 2016, PERCENT
AUDIO
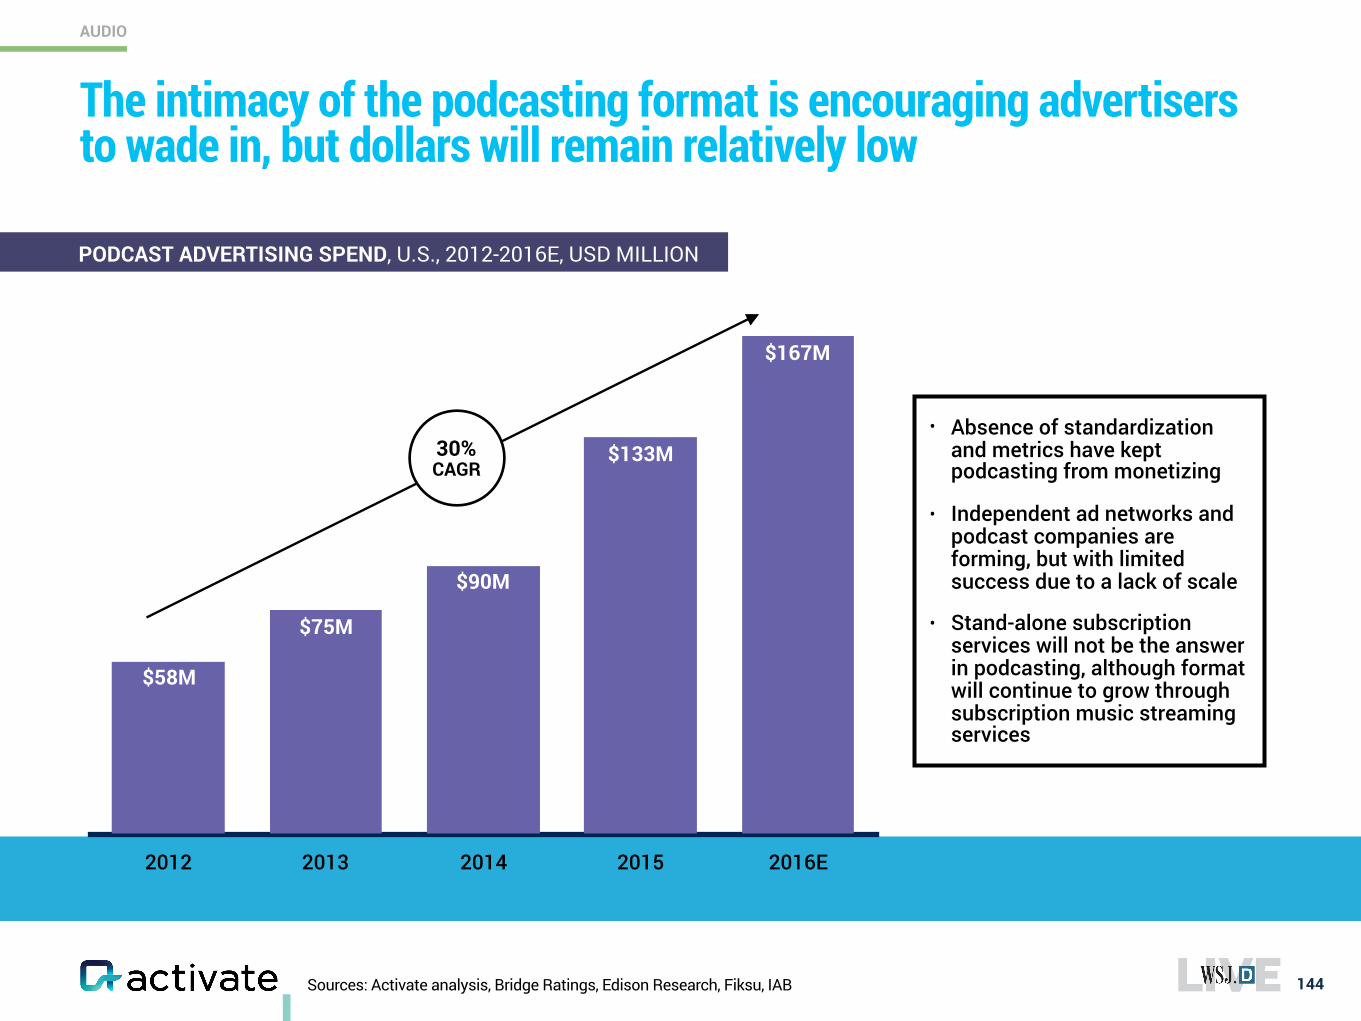
Sources: Activate analysis, Bridge Ratings, Edison Research, Fiksu, IAB 144
The intimacy of the podcasting format is encouraging advertisers to wade in, but dollars will remain relatively low
• Absence of standardization and metrics have kept podcasting from monetizing
• Independent ad networks and podcast companies are forming, but with limited success due to a lack of scale
• Stand-alone subscription services will not be the answer in podcasting, although format will continue to grow through subscription music streaming services
2012 2013 2014 2015 2016E
$167M
$133M
$90M
$75M
$58M
PODCAST ADVERTISING SPEND, U.S., 2012-2016E, USD MILLION
AUDIO
30%CAGR
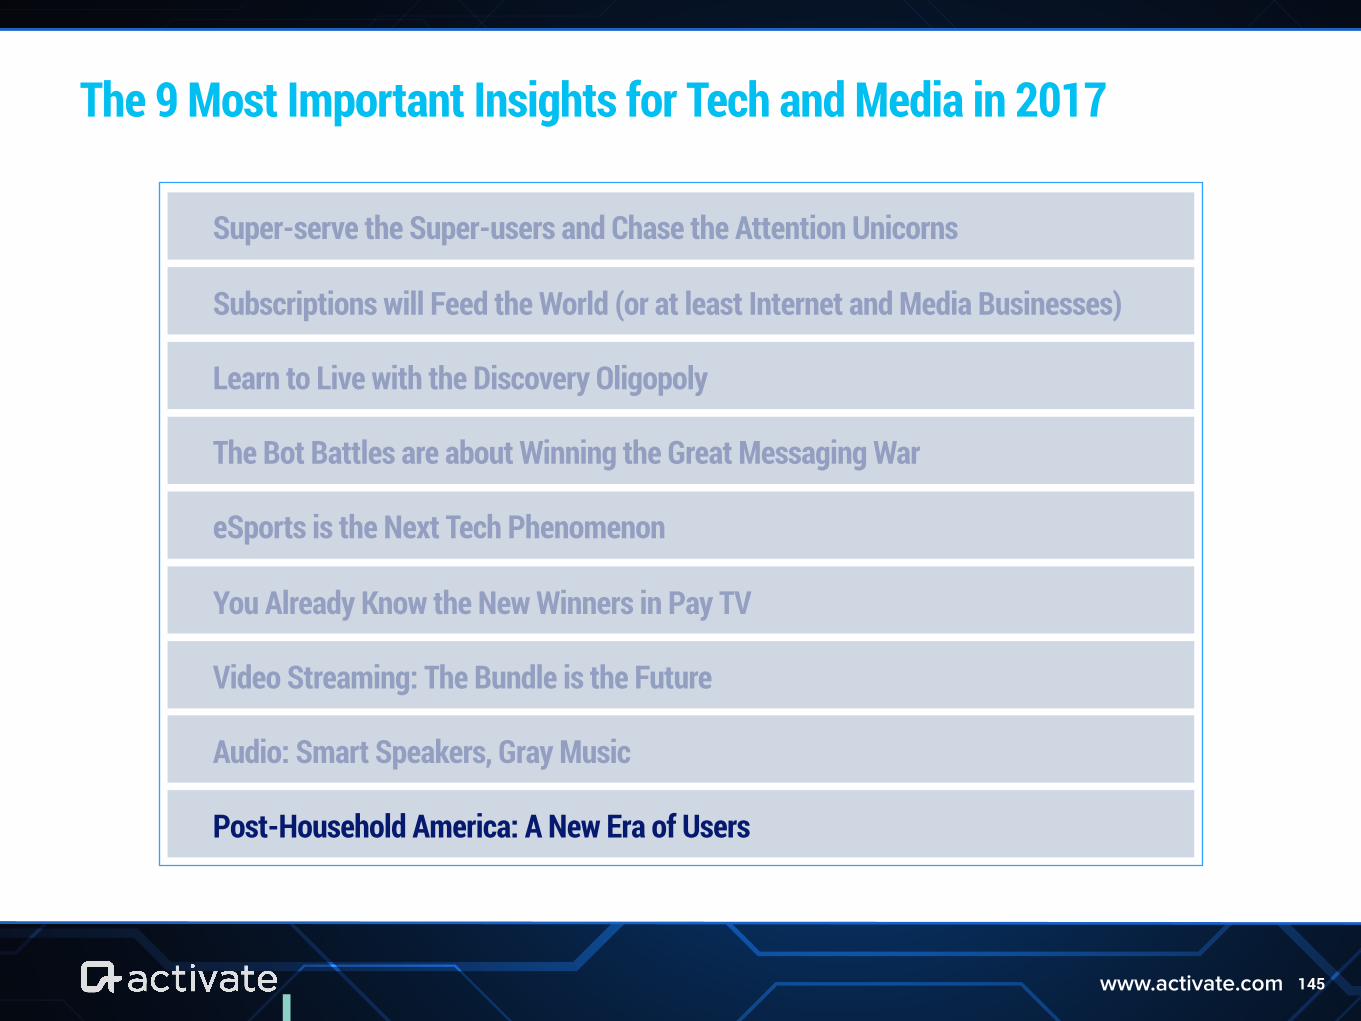
145www.activate.com
The 9 Most Important Insights for Tech and Media in 2017
Super-serve the Super-users and Chase the Attention Unicorns
Subscriptions will Feed the World (or at least Internet and Media Businesses)
Learn to Live with the Discovery Oligopoly
The Bot Battles are about Winning the Great Messaging War
eSports is the Next Tech Phenomenon
You Already Know the New Winners in Pay TV
Video Streaming: The Bundle is the Future
Audio: Smart Speakers, Gray Music
Post-Household America: A New Era of Users
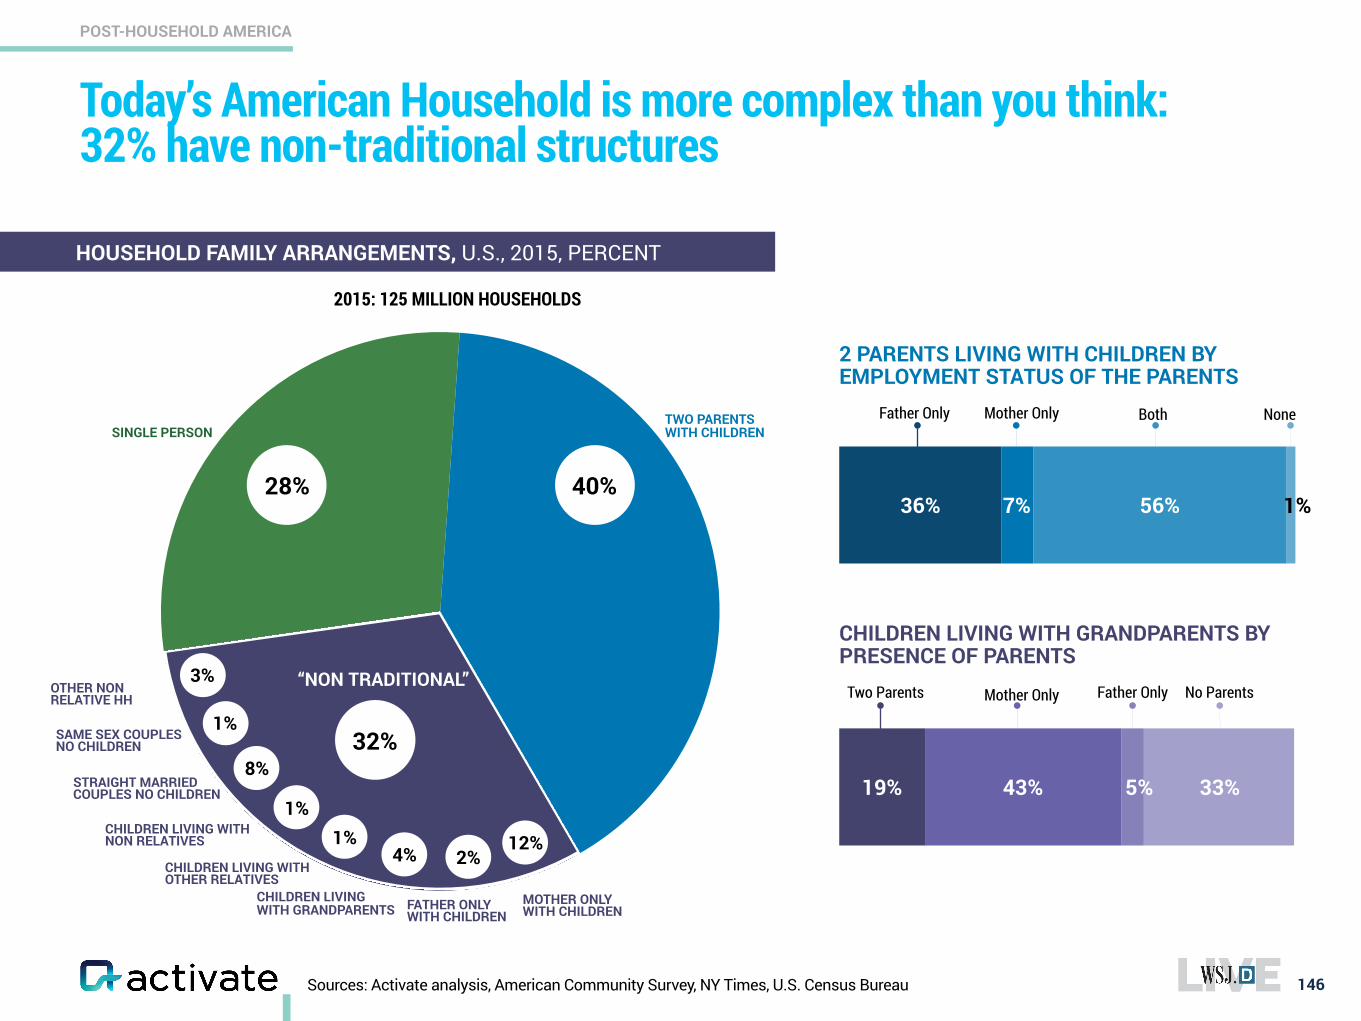
Today’s American Household is more complex than you think: 32% have non-traditional structures
146
POST-HOUSEHOLD AMERICA
HOUSEHOLD FAMILY ARRANGEMENTS, U.S., 2015, PERCENT
TWO PARENTS WITH CHILDREN
CHILDREN LIVING WITH GRANDPARENTS
STRAIGHT MARRIED COUPLES NO CHILDREN
CHILDREN LIVING WITH NON RELATIVES
SAME SEX COUPLES NO CHILDREN
CHILDREN LIVING WITH OTHER RELATIVES
MOTHER ONLY WITH CHILDREN
SINGLE PERSON
FATHER ONLY WITH CHILDREN
OTHER NON RELATIVE HH
40%
12%2%4%
8%
1%
28%
3%
1%1%
2015: 125 MILLION HOUSEHOLDS
2 PARENTS LIVING WITH CHILDREN BY EMPLOYMENT STATUS OF THE PARENTS
Father Only Both None
CHILDREN LIVING WITH GRANDPARENTS BY PRESENCE OF PARENTS
33%5%43%19%
Two Parents
Mother Only Father Only No Parents
36% 7% 56% 1%
Mother Only
32%
“NON TRADITIONAL”
Sources: Activate analysis, American Community Survey, NY Times, U.S. Census Bureau
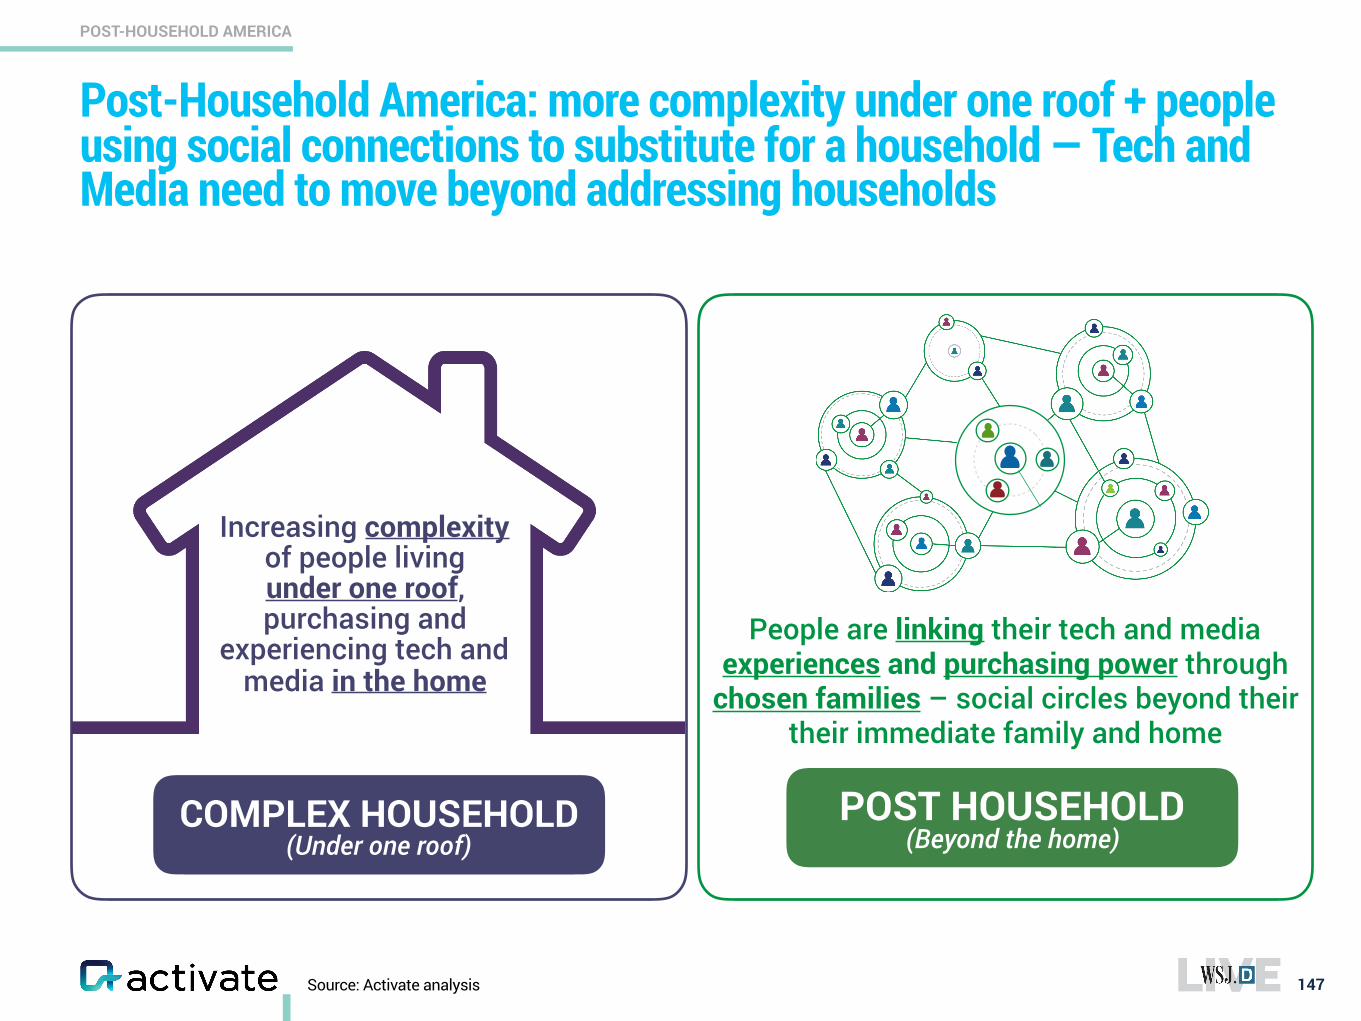
Post-Household America: more complexity under one roof + people using social connections to substitute for a household — Tech and Media need to move beyond addressing households
147
POST-HOUSEHOLD AMERICA
COMPLEX HOUSEHOLD (Under one roof)
Increasing complexity of people living under one roof, purchasing and
experiencing tech and media in the home
People are linking their tech and media experiences and purchasing power through
chosen families – social circles beyond their their immediate family and home
POST HOUSEHOLD (Beyond the home)
Source: Activate analysis
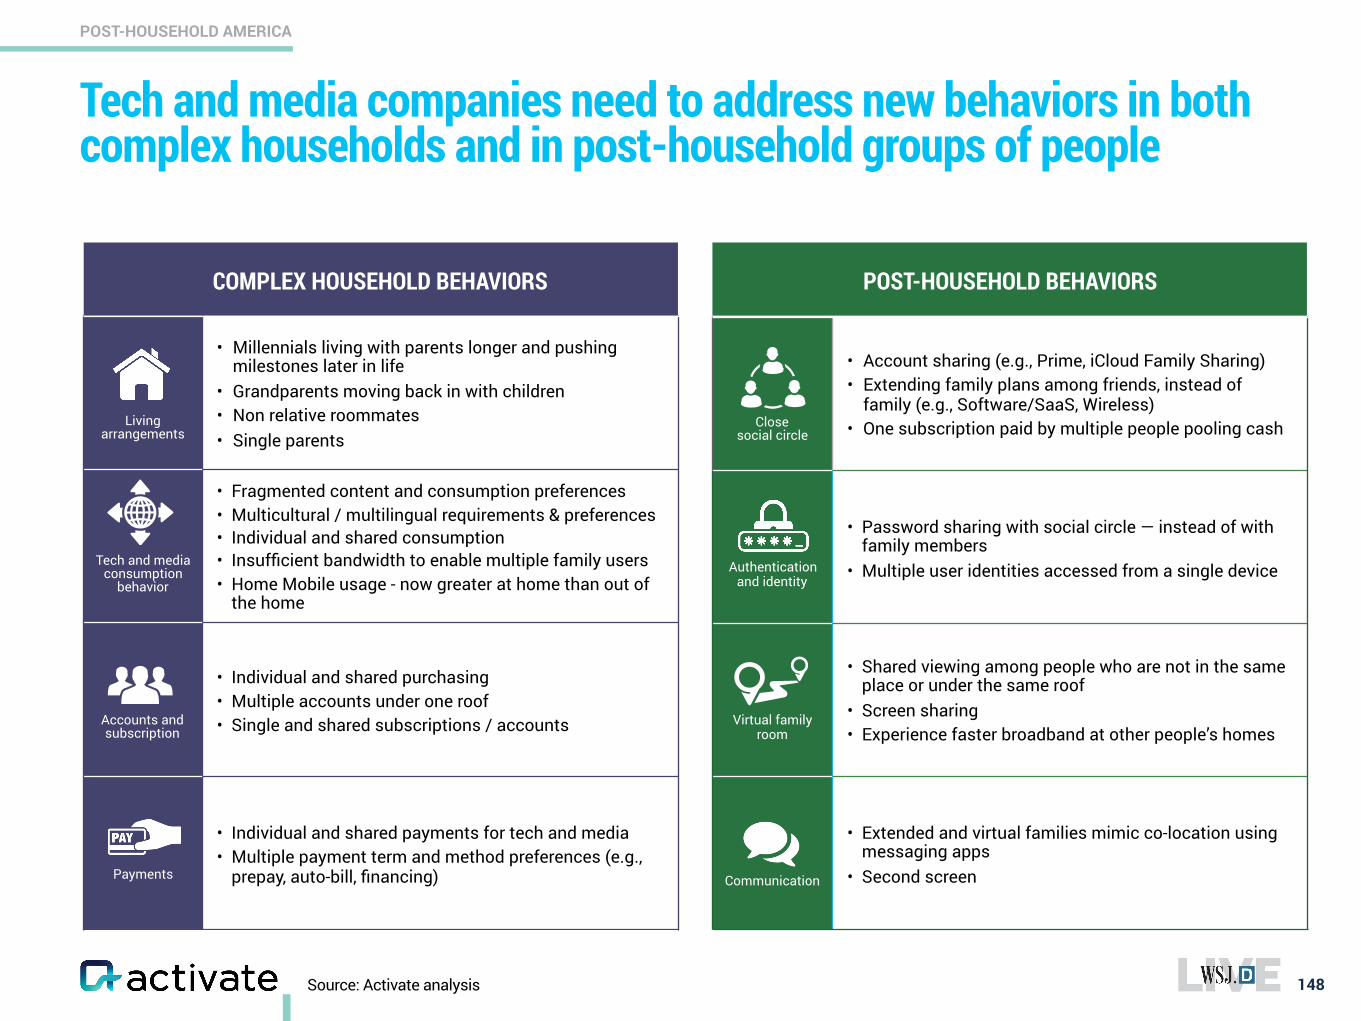
COMPLEX HOUSEHOLD BEHAVIORS POST-HOUSEHOLD BEHAVIORS
Tech and media companies need to address new behaviors in both complex households and in post-household groups of people
148
POST-HOUSEHOLD AMERICA
Close social circle
• Account sharing (e.g., Prime, iCloud Family Sharing) • Extending family plans among friends, instead of
family (e.g., Software/SaaS, Wireless) • One subscription paid by multiple people pooling cash
Authentication and identity
• Password sharing with social circle — instead of with family members
• Multiple user identities accessed from a single device
Virtual family room
• Shared viewing among people who are not in the same place or under the same roof
• Screen sharing • Experience faster broadband at other people’s homes
Communication
• Extended and virtual families mimic co-location using messaging apps
• Second screen
Living arrangements
• Millennials living with parents longer and pushing milestones later in life
• Grandparents moving back in with children • Non relative roommates • Single parents
Tech and media consumption
behavior
• Fragmented content and consumption preferences • Multicultural / multilingual requirements & preferences • Individual and shared consumption • Insufficient bandwidth to enable multiple family users • Home Mobile usage - now greater at home than out of
the home
Accounts and subscription
• Individual and shared purchasing • Multiple accounts under one roof • Single and shared subscriptions / accounts
Payments
• Individual and shared payments for tech and media • Multiple payment term and method preferences (e.g.,
prepay, auto-bill, financing)
Source: Activate analysis
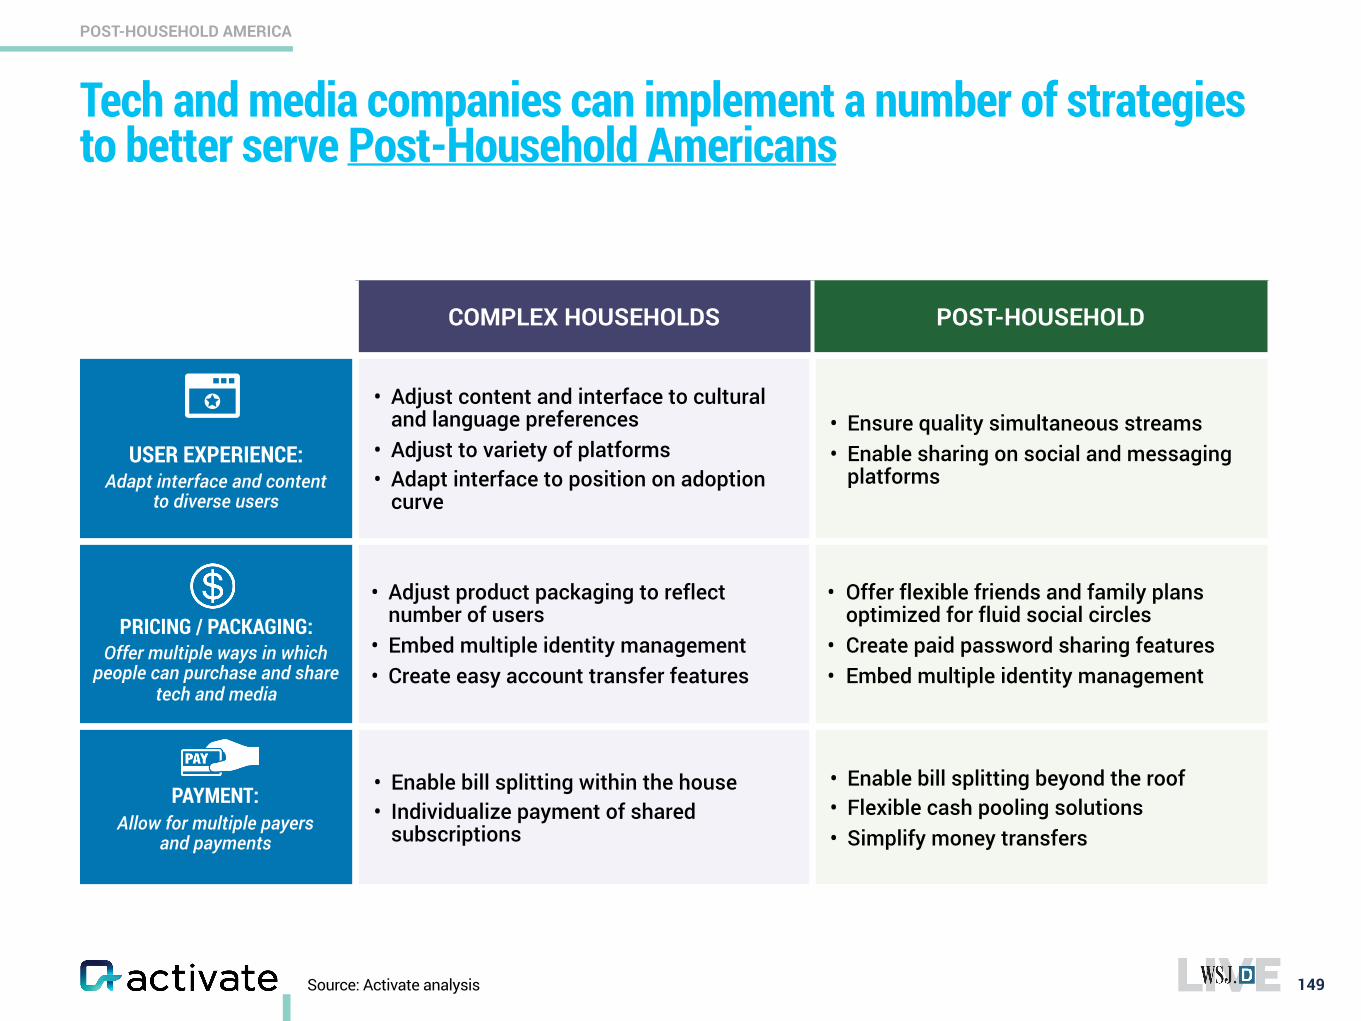
COMPLEX HOUSEHOLDS POST-HOUSEHOLD
USER EXPERIENCE: Adapt interface and content
to diverse users
• Adjust content and interface to cultural and language preferences
• Adjust to variety of platforms • Adapt interface to position on adoption
curve
• Ensure quality simultaneous streams • Enable sharing on social and messaging
platforms
PRICING / PACKAGING: Offer multiple ways in which
people can purchase and share tech and media
• Adjust product packaging to reflect number of users
• Embed multiple identity management • Create easy account transfer features
• Offer flexible friends and family plans optimized for fluid social circles
• Create paid password sharing features • Embed multiple identity management
PAYMENT:
Allow for multiple payers and payments
• Enable bill splitting within the house • Individualize payment of shared
subscriptions
• Enable bill splitting beyond the roof • Flexible cash pooling solutions • Simplify money transfers
Source: Activate analysis
Tech and media companies can implement a number of strategies to better serve Post-Household Americans
149
POST-HOUSEHOLD AMERICA
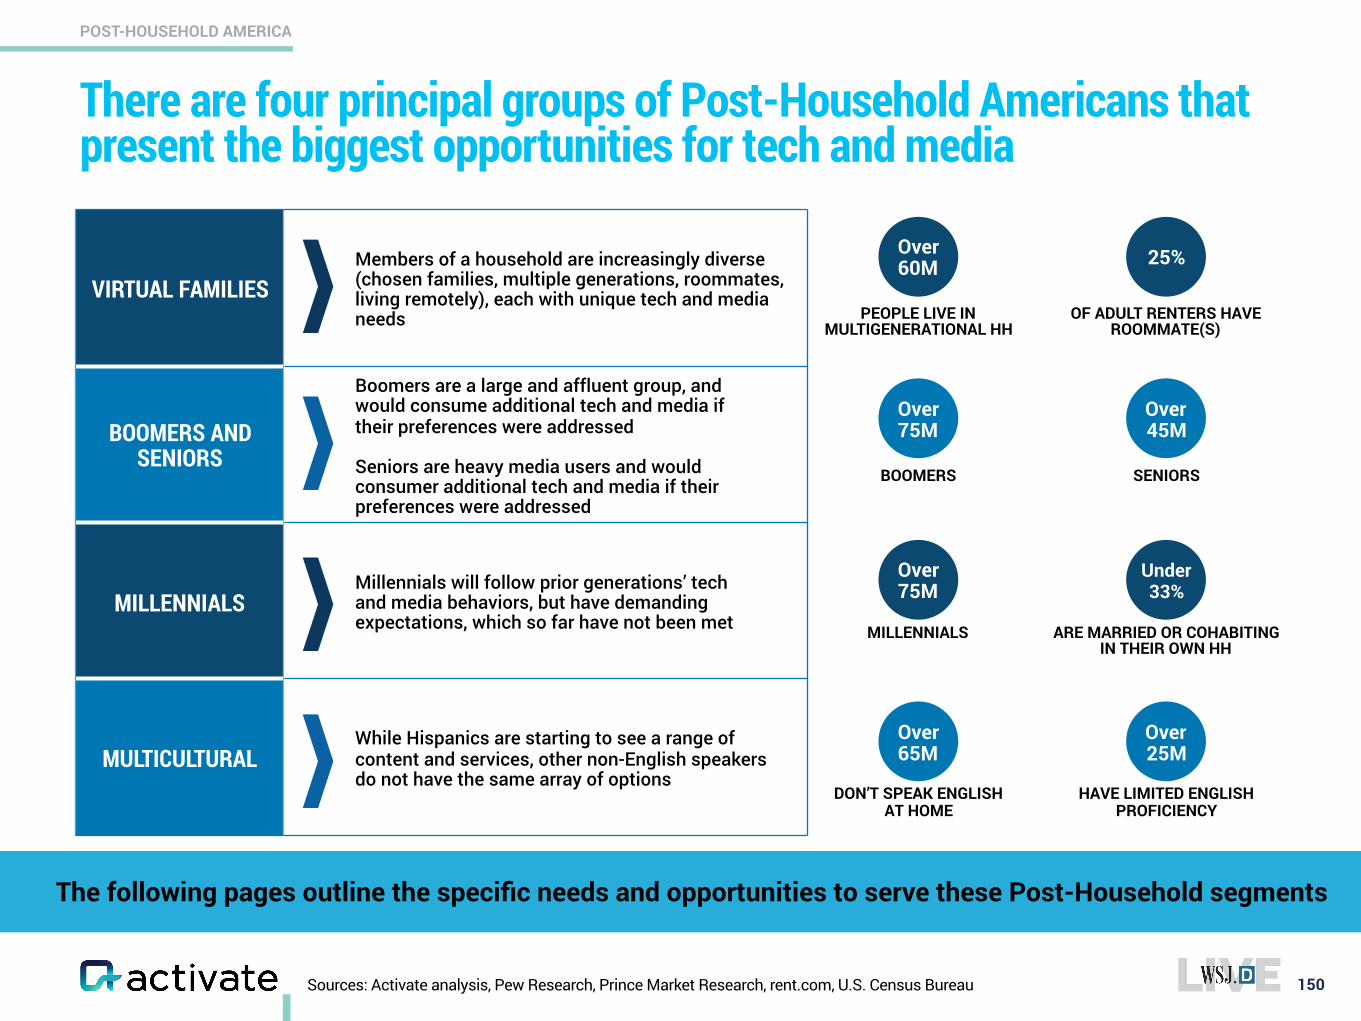
Sources: Activate analysis, Pew Research, Prince Market Research, rent.com, U.S. Census Bureau
There are four principal groups of Post-Household Americans that present the biggest opportunities for tech and media
150
POST-HOUSEHOLD AMERICA
VIRTUAL FAMILIESMembers of a household are increasingly diverse (chosen families, multiple generations, roommates, living remotely), each with unique tech and media needs
BOOMERS AND SENIORS
Boomers are a large and affluent group, and would consume additional tech and media if their preferences were addressed
Seniors are heavy media users and would consumer additional tech and media if their preferences were addressed
MILLENNIALSMillennials will follow prior generations’ tech and media behaviors, but have demanding expectations, which so far have not been met
MULTICULTURALWhile Hispanics are starting to see a range of content and services, other non-English speakers do not have the same array of options
Over 60M
PEOPLE LIVE IN MULTIGENERATIONAL HH
25%
OF ADULT RENTERS HAVE ROOMMATE(S)
Over 75M
BOOMERS
Over 45M
SENIORS
Over 75M
MILLENNIALS
Under 33%
ARE MARRIED OR COHABITING IN THEIR OWN HH
Over 65M
DON’T SPEAK ENGLISH AT HOME
Over 25M
HAVE LIMITED ENGLISH PROFICIENCY
The following pages outline the specific needs and opportunities to serve these Post-Household segments
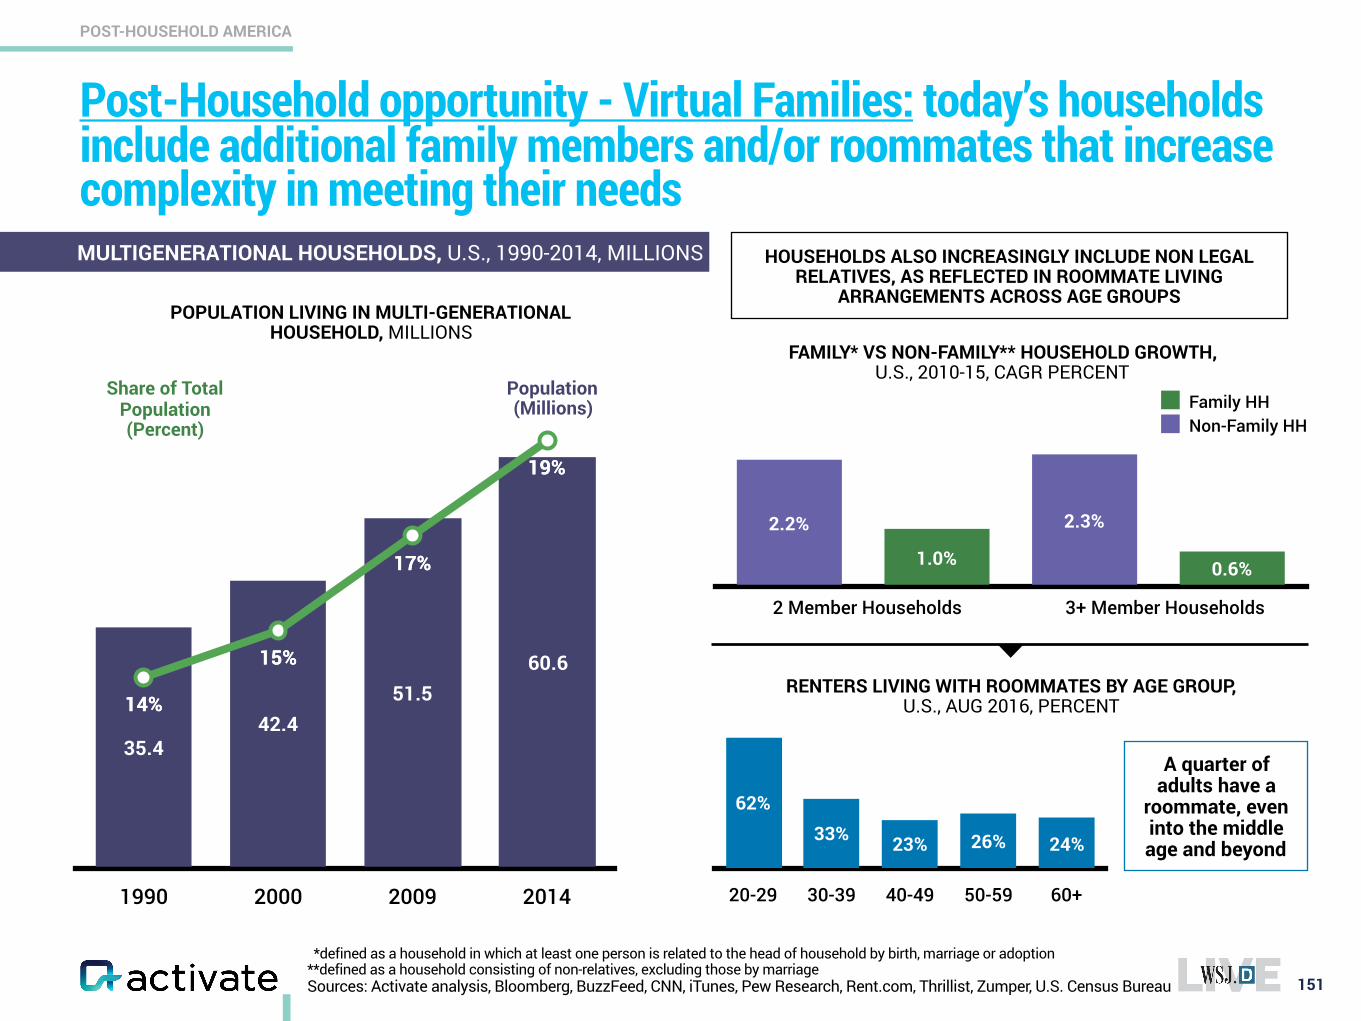
Post-Household opportunity - Virtual Families: today’s households include additional family members and/or roommates that increase complexity in meeting their needs
151
POST-HOUSEHOLD AMERICA
0.6%1.0%
2.3%2.2%
Non-Family HHFamily HH
FAMILY* VS NON-FAMILY** HOUSEHOLD GROWTH, U.S., 2010-15, CAGR PERCENT
2 Member Households 3+ Member Households
HOUSEHOLDS ALSO INCREASINGLY INCLUDE NON LEGAL RELATIVES, AS REFLECTED IN ROOMMATE LIVING
ARRANGEMENTS ACROSS AGE GROUPS
20-29 30-39 40-49 50-59 60+
24%26%23%33%62%
RENTERS LIVING WITH ROOMMATES BY AGE GROUP, U.S., AUG 2016, PERCENT
*defined as a household in which at least one person is related to the head of household by birth, marriage or adoption **defined as a household consisting of non-relatives, excluding those by marriage Sources: Activate analysis, Bloomberg, BuzzFeed, CNN, iTunes, Pew Research, Rent.com, Thrillist, Zumper, U.S. Census Bureau
1990 2000 2009 2014
60.651.5
42.435.4
19%
17%
15%
14%14%
15%
17%
19%
Share of Total Population (Percent)
Population (Millions)
POPULATION LIVING IN MULTI-GENERATIONAL HOUSEHOLD, MILLIONS
MULTIGENERATIONAL HOUSEHOLDS, U.S., 1990-2014, MILLIONS
A quarter of adults have a
roommate, even into the middle age and beyond
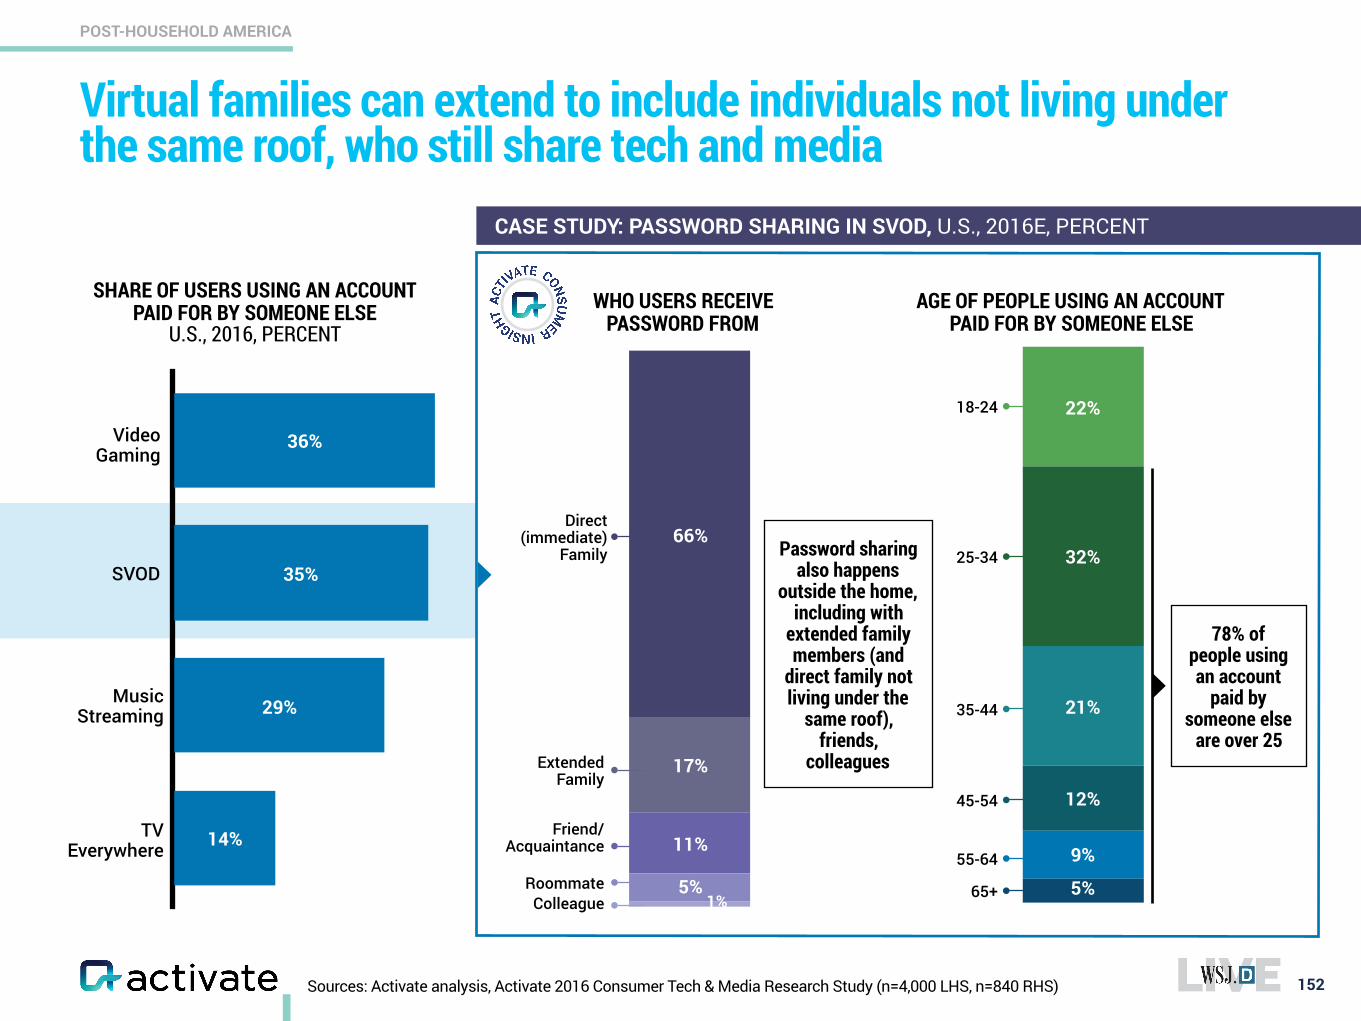
Virtual families can extend to include individuals not living under the same roof, who still share tech and media
152
POST-HOUSEHOLD AMERICA
Sources: Activate analysis, Activate 2016 Consumer Tech & Media Research Study (n=4,000 LHS, n=840 RHS)
14%
29%
35%
36%
SVOD
Video Gaming
Music Streaming
TV Everywhere
66%
17%
11%
5%
Direct (immediate)
Family
WHO USERS RECEIVE PASSWORD FROM
Extended Family
Friend/ Acquaintance
RoommateColleague
22%
32%
21%
12%
9%
5%
AGE OF PEOPLE USING AN ACCOUNT PAID FOR BY SOMEONE ELSE
18-24
25-34
35-44
45-54
55-64
65+
SHARE OF USERS USING AN ACCOUNT PAID FOR BY SOMEONE ELSE
U.S., 2016, PERCENT
1%
Password sharing also happens
outside the home, including with
extended family members (and
direct family not living under the
same roof), friends,
colleagues
78% of people using an account
paid by someone else
are over 25
CASE STUDY: PASSWORD SHARING IN SVOD, U.S., 2016E, PERCENT
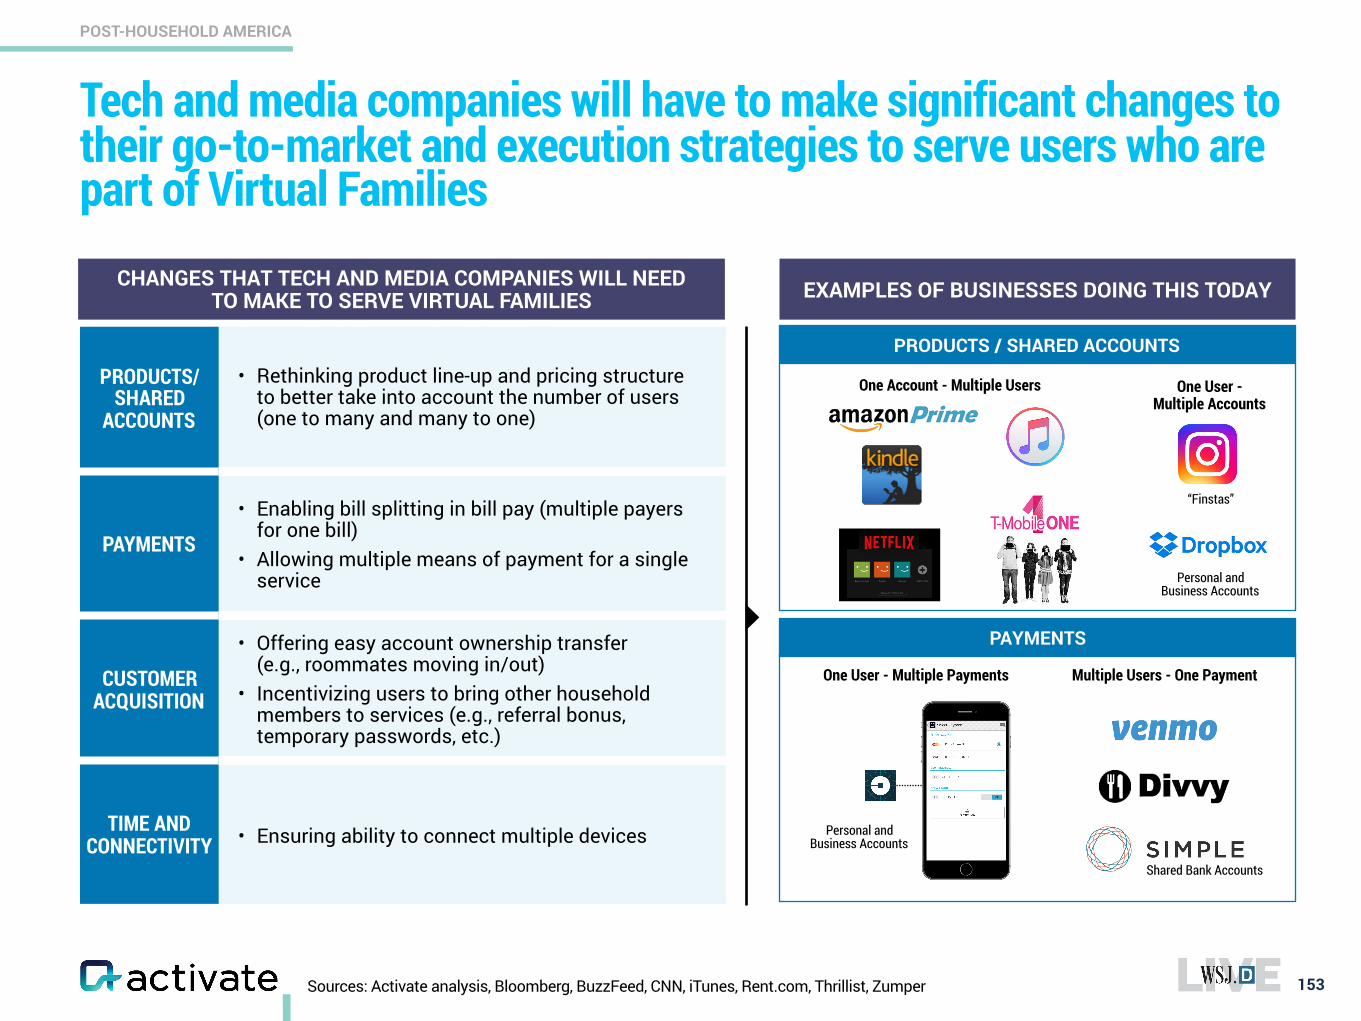
Tech and media companies will have to make significant changes to their go-to-market and execution strategies to serve users who are part of Virtual Families
153
POST-HOUSEHOLD AMERICA
PRODUCTS/ SHARED
ACCOUNTS
• Rethinking product line-up and pricing structure to better take into account the number of users (one to many and many to one)
PAYMENTS
• Enabling bill splitting in bill pay (multiple payers for one bill)
• Allowing multiple means of payment for a single service
CUSTOMER ACQUISITION
• Offering easy account ownership transfer (e.g., roommates moving in/out)
• Incentivizing users to bring other household members to services (e.g., referral bonus, temporary passwords, etc.)
TIME AND CONNECTIVITY • Ensuring ability to connect multiple devices
PRODUCTS / SHARED ACCOUNTS
PAYMENTS
One User - Multiple Accounts
One Account - Multiple Users
Shared Bank Accounts
“Finstas”
One User - Multiple Payments Multiple Users - One Payment
Personal and Business Accounts
Personal and Business Accounts
EXAMPLES OF BUSINESSES DOING THIS TODAYCHANGES THAT TECH AND MEDIA COMPANIES WILL NEED TO MAKE TO SERVE VIRTUAL FAMILIES
Sources: Activate analysis, Bloomberg, BuzzFeed, CNN, iTunes, Rent.com, Thrillist, Zumper
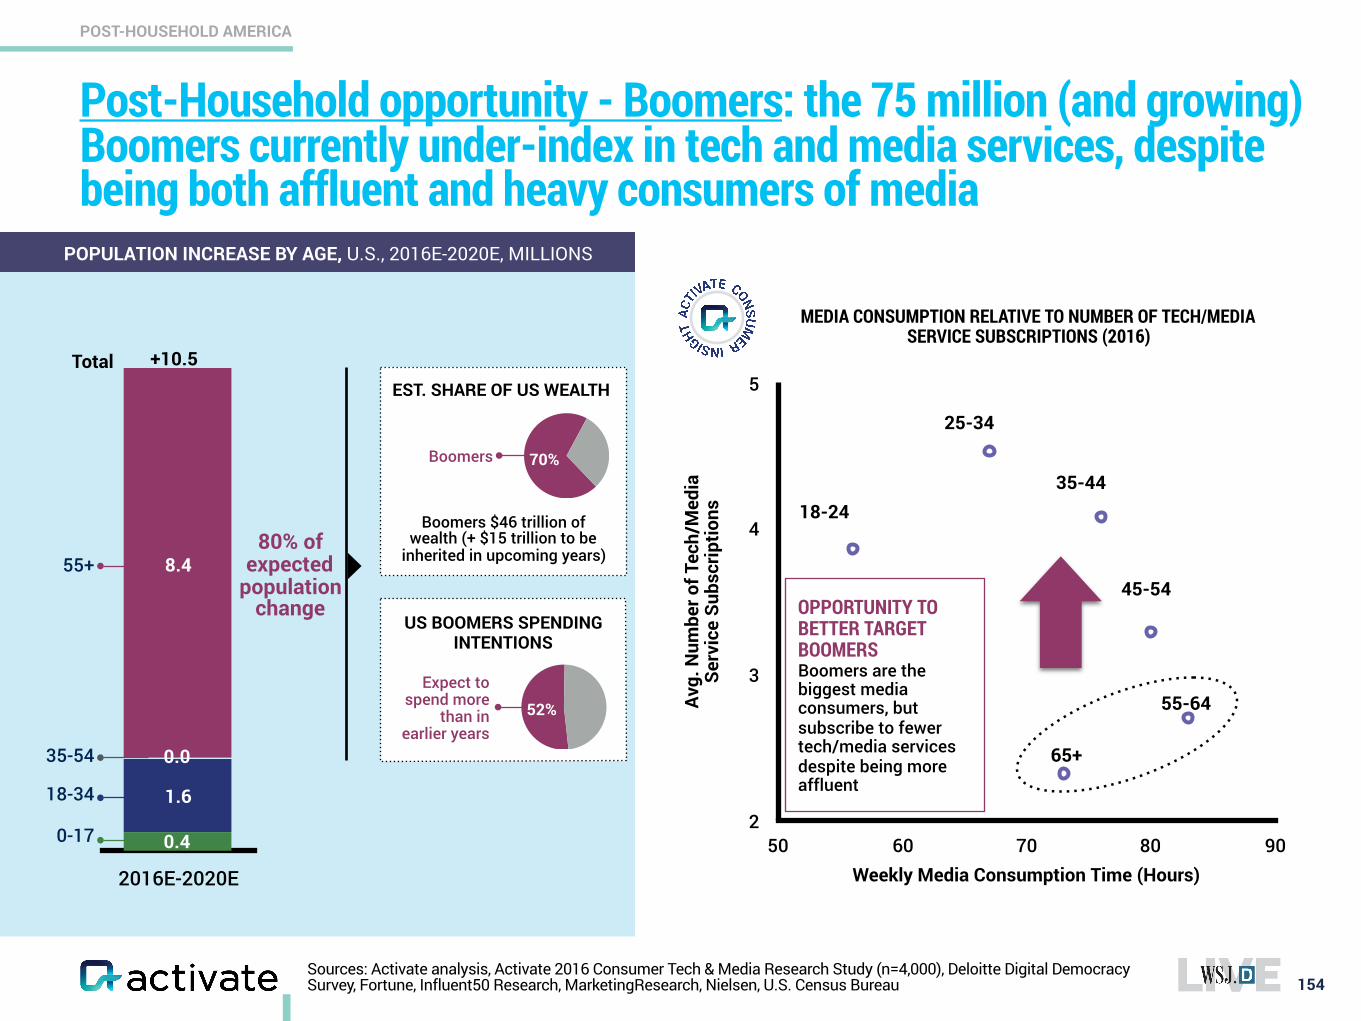
2
3
4
5
50 60 70 80 90
Sources: Activate analysis, Activate 2016 Consumer Tech & Media Research Study (n=4,000), Deloitte Digital Democracy Survey, Fortune, Influent50 Research, MarketingResearch, Nielsen, U.S. Census Bureau
Post-Household opportunity - Boomers: the 75 million (and growing) Boomers currently under-index in tech and media services, despite being both affluent and heavy consumers of media
154
POST-HOUSEHOLD AMERICA
0-17
18-34
35-54
55+
Total +10.5
80% of expected
population change
Weekly Media Consumption Time (Hours)
Avg.
Num
ber o
f Tec
h/M
edia
Se
rvic
e Su
bscr
iptio
ns 18-24
25-34
35-44
45-54
55-64
65+
POPULATION INCREASE BY AGE, U.S., 2016E-2020E, MILLIONS
MEDIA CONSUMPTION RELATIVE TO NUMBER OF TECH/MEDIA SERVICE SUBSCRIPTIONS (2016)
OPPORTUNITY TO BETTER TARGET BOOMERS Boomers are the biggest media consumers, but subscribe to fewer tech/media services despite being more affluent
Boomers $46 trillion of wealth (+ $15 trillion to be
inherited in upcoming years)
EST. SHARE OF US WEALTH
Boomers 70%
US BOOMERS SPENDING INTENTIONS
Expect to spend more
than in earlier years
52%
2016E-2020E
8.4
0.0
1.6
0.4
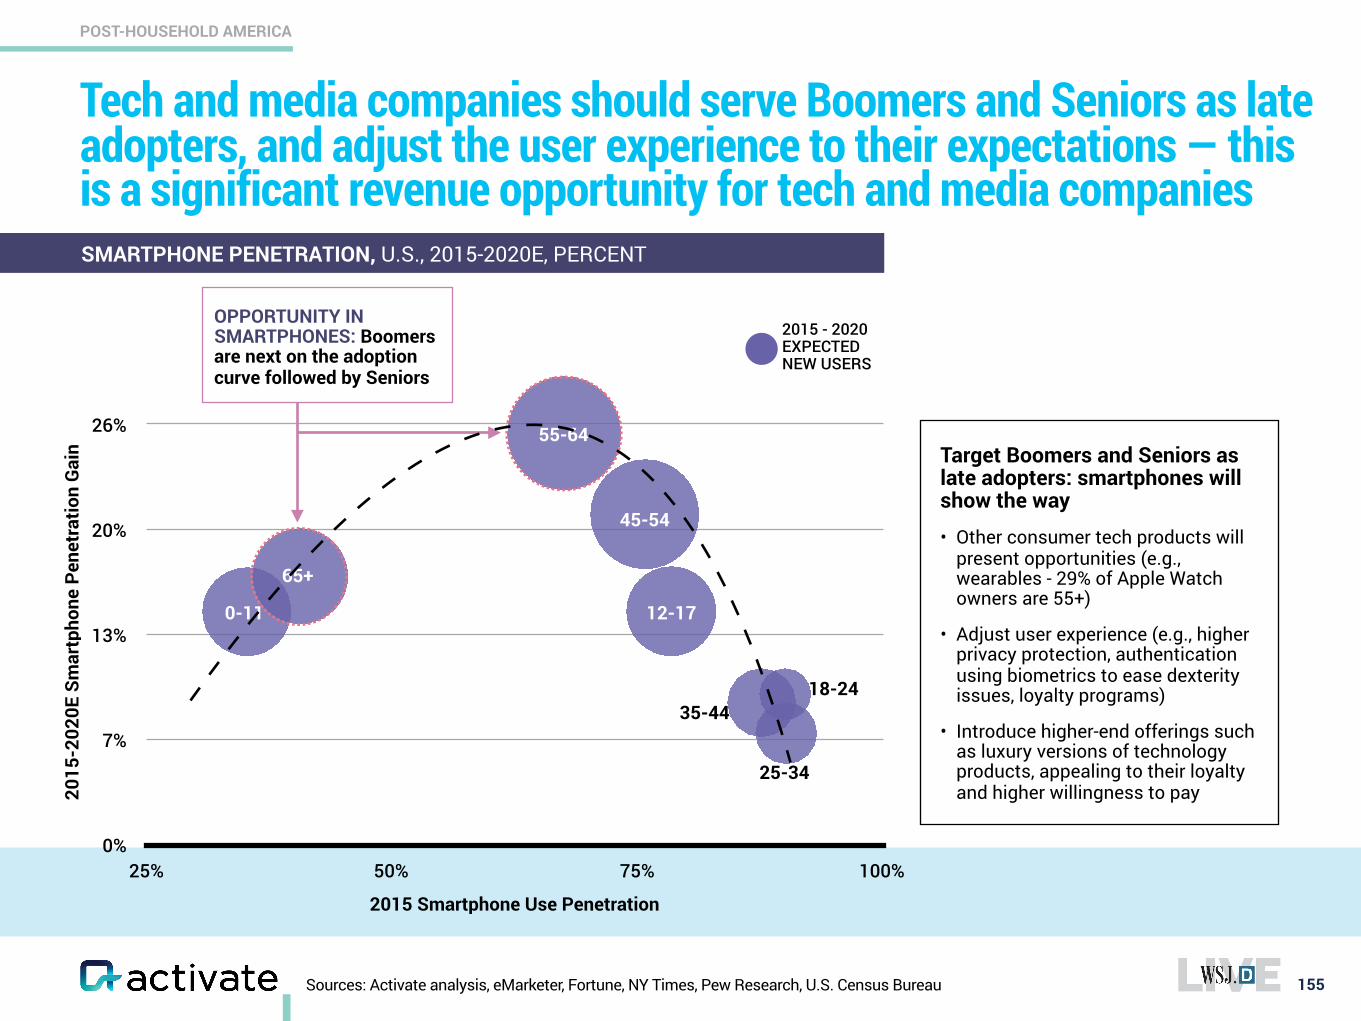
Tech and media companies should serve Boomers and Seniors as late adopters, and adjust the user experience to their expectations — this is a significant revenue opportunity for tech and media companies
155
POST-HOUSEHOLD AMERICA
Target Boomers and Seniors as late adopters: smartphones will show the way
• Other consumer tech products will present opportunities (e.g., wearables - 29% of Apple Watch owners are 55+)
• Adjust user experience (e.g., higher privacy protection, authentication using biometrics to ease dexterity issues, loyalty programs)
• Introduce higher-end offerings such as luxury versions of technology products, appealing to their loyalty and higher willingness to pay
0%
7%
13%
20%
26%
25% 50% 75% 100%
2015 Smartphone Use Penetration
2015
-202
0E S
mar
tpho
ne P
enet
ratio
n G
ain
55-64
45-54
65+
0-11 12-17
18-24
25-34
35-44
2015 - 2020 EXPECTED NEW USERS
OPPORTUNITY IN SMARTPHONES: Boomers are next on the adoption curve followed by Seniors
Sources: Activate analysis, eMarketer, Fortune, NY Times, Pew Research, U.S. Census Bureau
SMARTPHONE PENETRATION, U.S., 2015-2020E, PERCENT
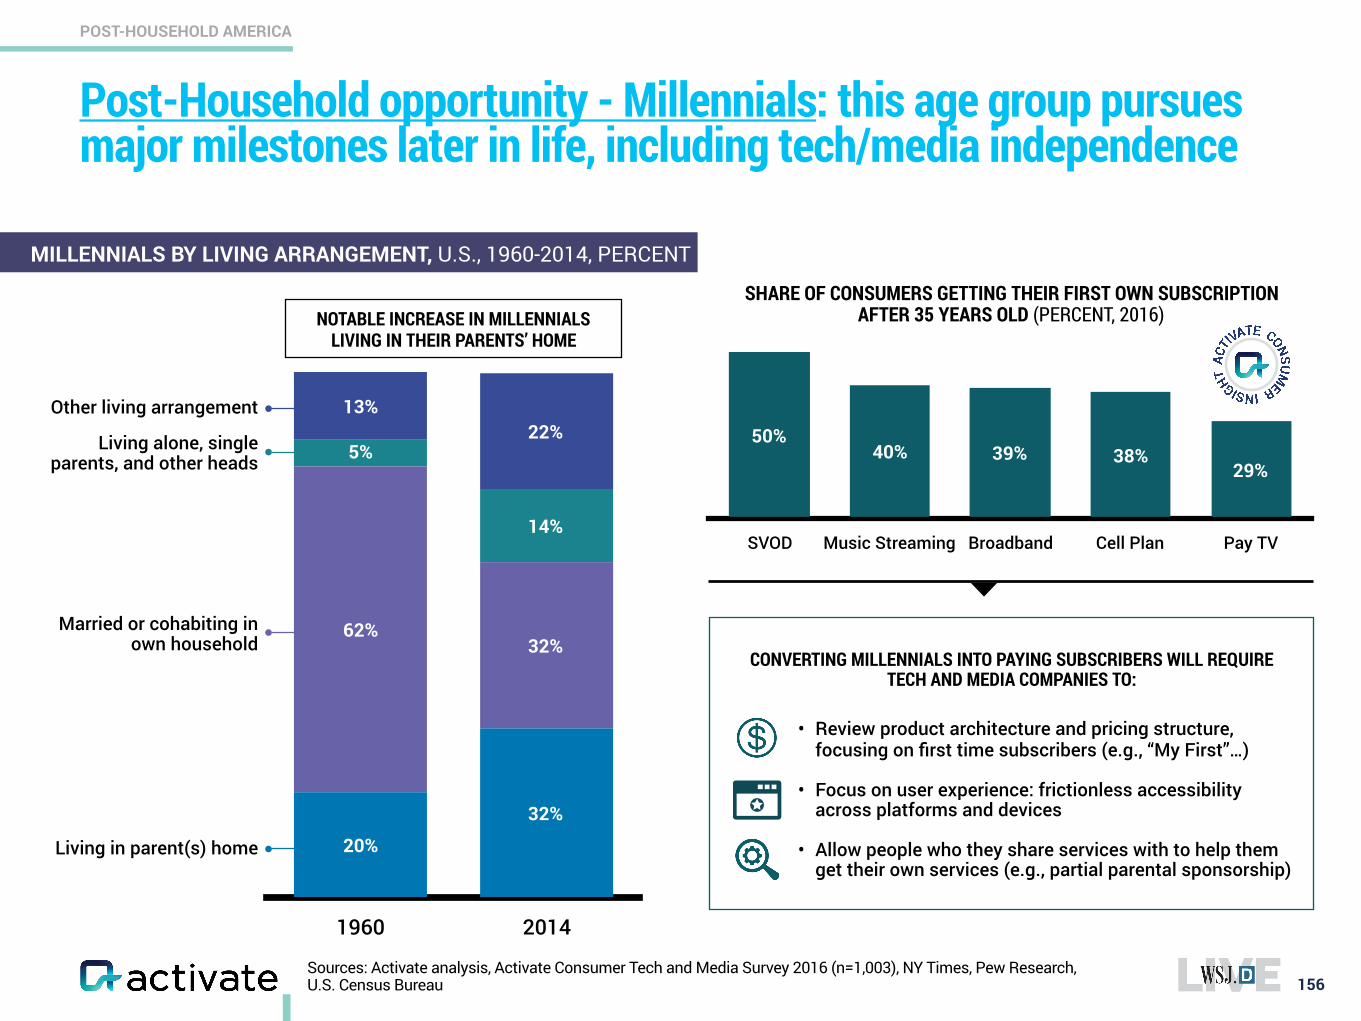
CONVERTING MILLENNIALS INTO PAYING SUBSCRIBERS WILL REQUIRE TECH AND MEDIA COMPANIES TO:
• Review product architecture and pricing structure, focusing on first time subscribers (e.g., “My First”…)
• Focus on user experience: frictionless accessibility across platforms and devices
• Allow people who they share services with to help them get their own services (e.g., partial parental sponsorship)
Post-Household opportunity - Millennials: this age group pursues major milestones later in life, including tech/media independence
156
POST-HOUSEHOLD AMERICA
1960 2014
22%13%
14%
5%
32%62%
32%
20%
MILLENNIALS BY LIVING ARRANGEMENT, U.S., 1960-2014, PERCENT
Other living arrangement
Living alone, single parents, and other heads
Married or cohabiting in own household
Living in parent(s) home
SVOD Music Streaming Broadband Cell Plan Pay TV
29%38%39%40%
50%
SHARE OF CONSUMERS GETTING THEIR FIRST OWN SUBSCRIPTION AFTER 35 YEARS OLD (PERCENT, 2016)
Sources: Activate analysis, Activate Consumer Tech and Media Survey 2016 (n=1,003), NY Times, Pew Research, U.S. Census Bureau
NOTABLE INCREASE IN MILLENNIALS LIVING IN THEIR PARENTS’ HOME
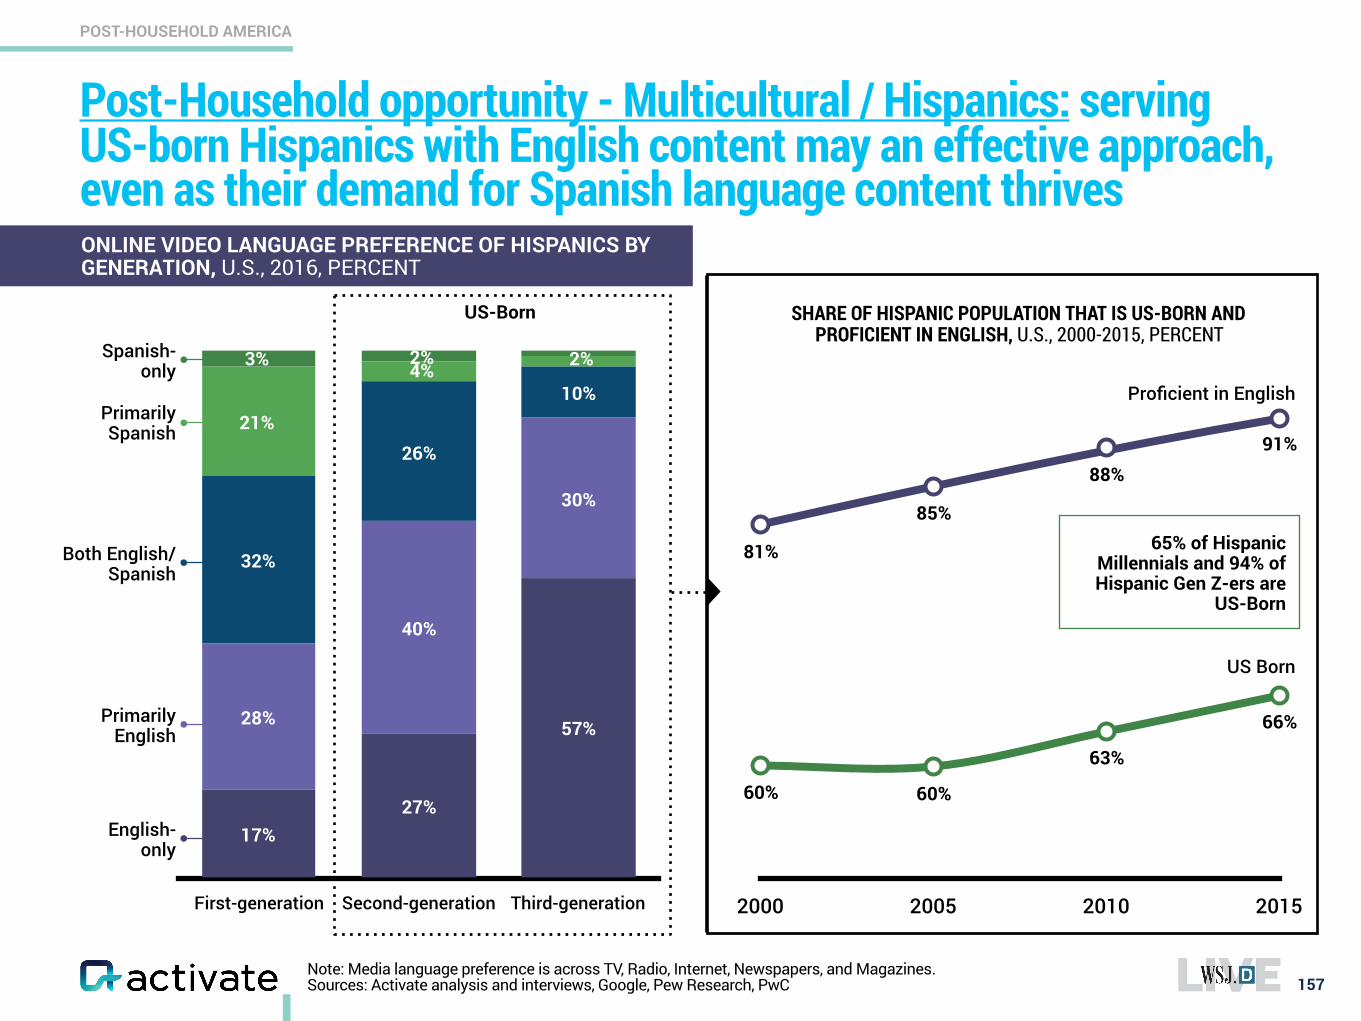
Note: Media language preference is across TV, Radio, Internet, Newspapers, and Magazines. Sources: Activate analysis and interviews, Google, Pew Research, PwC
Post-Household opportunity - Multicultural / Hispanics: serving US-born Hispanics with English content may an effective approach, even as their demand for Spanish language content thrives
157
POST-HOUSEHOLD AMERICA
SHARE OF HISPANIC POPULATION THAT IS US-BORN AND PROFICIENT IN ENGLISH, U.S., 2000-2015, PERCENT
2000 2005 2010 2015
81%
85%
88%91%
60% 60%
63%
66%
ONLINE VIDEO LANGUAGE PREFERENCE OF HISPANICS BY GENERATION, U.S., 2016, PERCENT
First-generation Second-generation Third-generation
10%
26%
32%
30%
40%
28% 57%
27%17%English-
only
Primarily English
Both English/Spanish
Primarily Spanish
Spanish-only
US-Born
65% of Hispanic Millennials and 94% of Hispanic Gen Z-ers are
US-Born
21%
4% 2%2%3%
US Born
Proficient in English
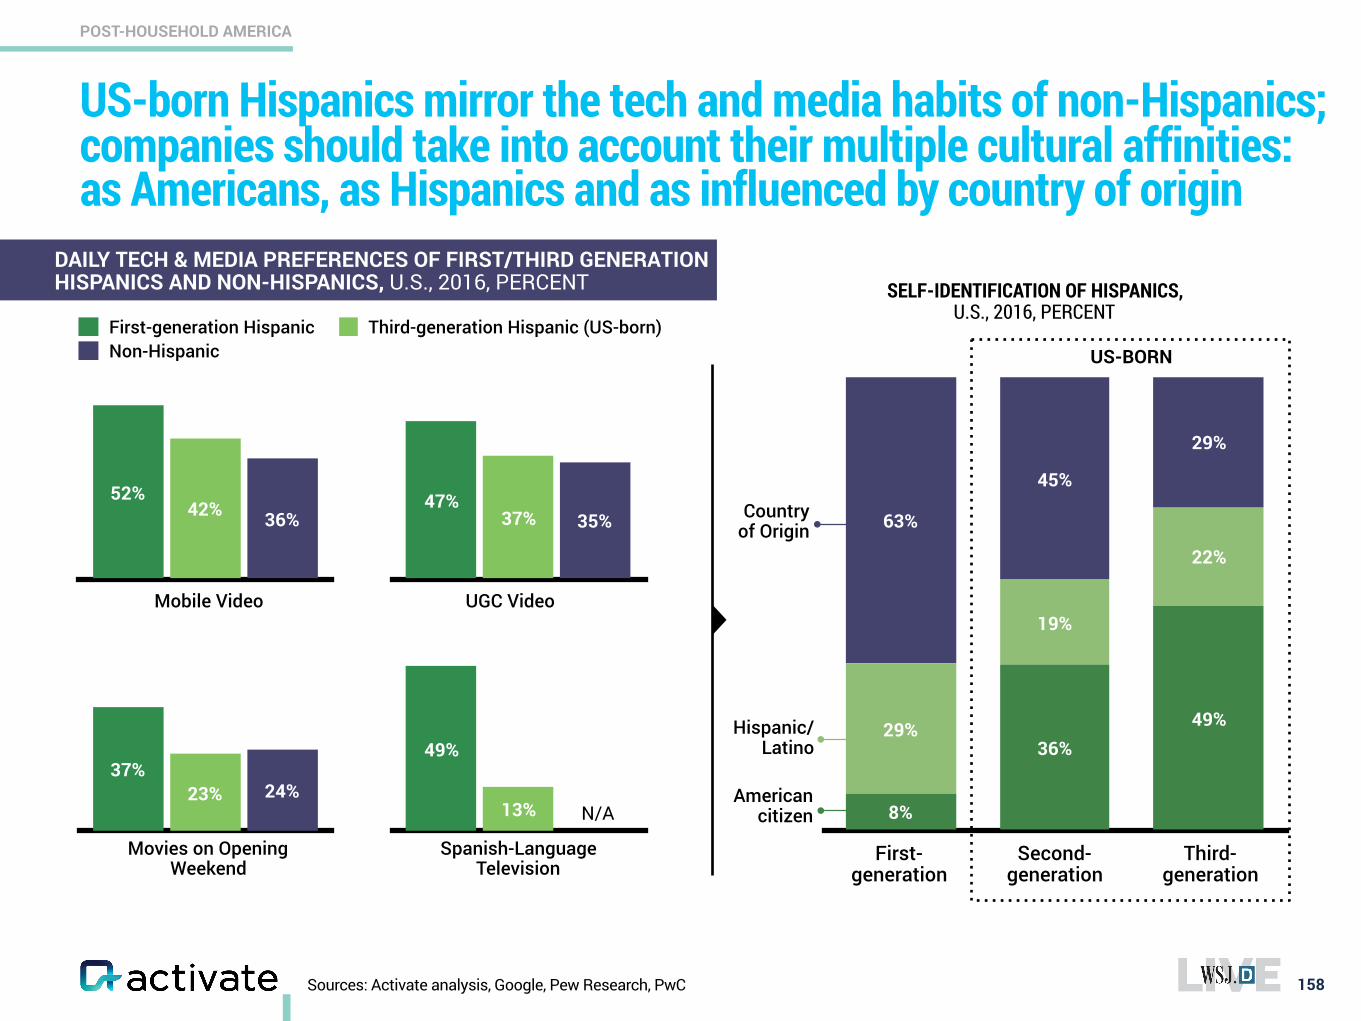
24%23%37%
13%
49%
Sources: Activate analysis, Google, Pew Research, PwC
US-born Hispanics mirror the tech and media habits of non-Hispanics; companies should take into account their multiple cultural affinities: as Americans, as Hispanics and as influenced by country of origin
158
POST-HOUSEHOLD AMERICA
DAILY TECH & MEDIA PREFERENCES OF FIRST/THIRD GENERATION HISPANICS AND NON-HISPANICS, U.S., 2016, PERCENT
Mobile Video UGC Video
Movies on Opening Weekend
Spanish-Language Television
29%
45%
63%
22%
19%
29% 49%36%
8%American
citizen
Hispanic/Latino
Country of Origin
US-BORN
36%42%52%
First-generation Hispanic Third-generation Hispanic (US-born)Non-Hispanic
35%37%47%
N/A
SELF-IDENTIFICATION OF HISPANICS, U.S., 2016, PERCENT
First-generation
Second-generation
Third-generation
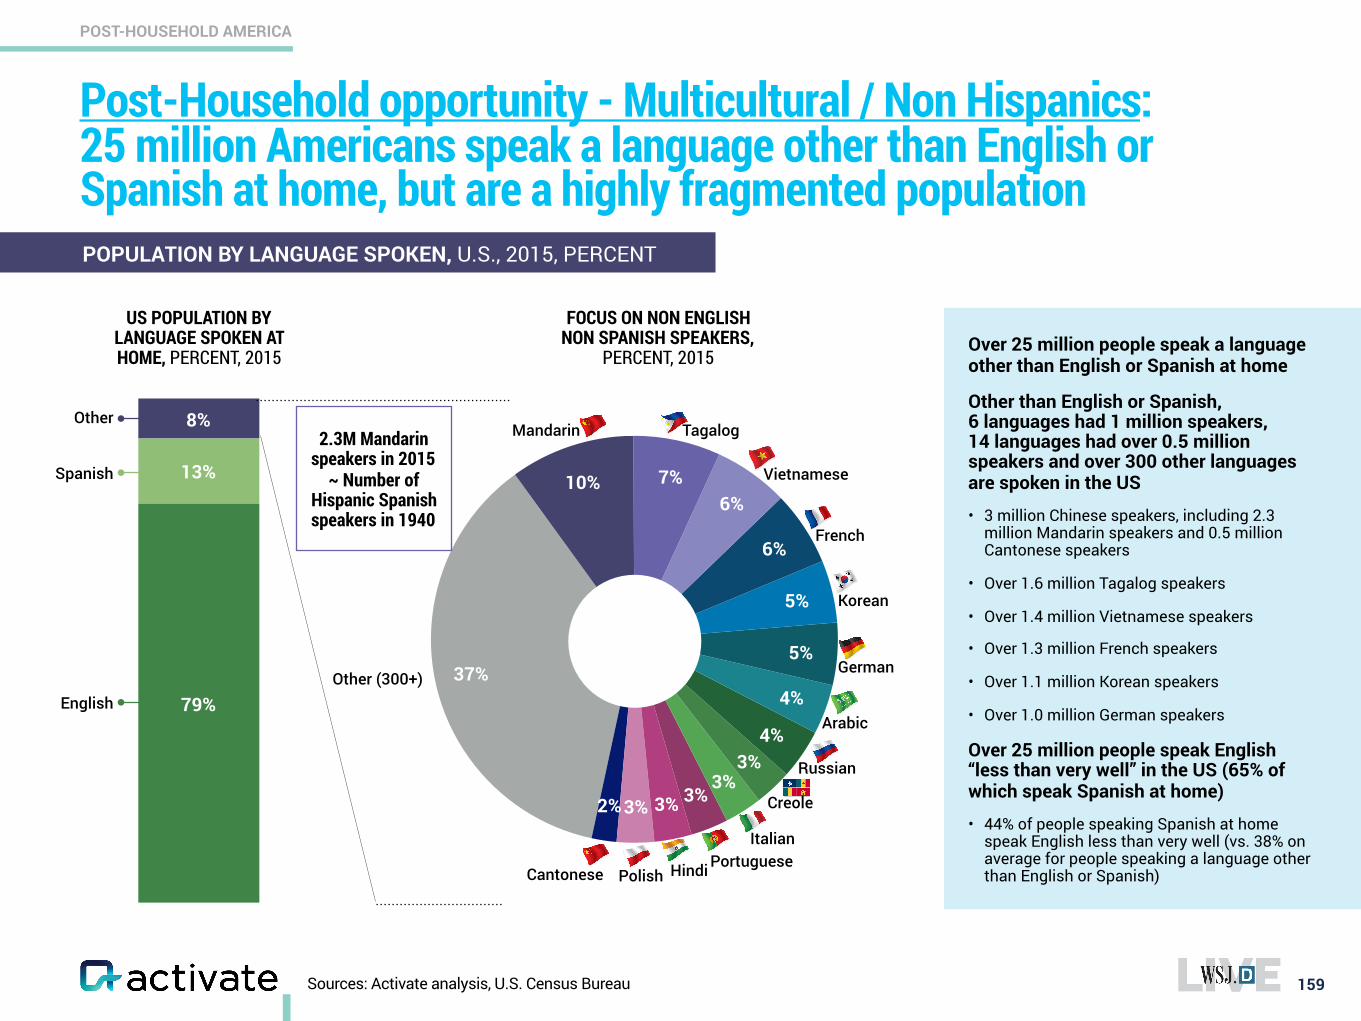
37%
2%3% 3% 3%3%
3%4%
4%
5%
5%
6%
6%7%10%
Sources: Activate analysis, U.S. Census Bureau
Post-Household opportunity - Multicultural / Non Hispanics: 25 million Americans speak a language other than English or Spanish at home, but are a highly fragmented population
159
POST-HOUSEHOLD AMERICA
8%
13%
79%English
Spanish
OtherMandarin Tagalog
Vietnamese
French
Korean
German
Arabic
Other (300+)
Creole
US POPULATION BY LANGUAGE SPOKEN AT HOME, PERCENT, 2015
POPULATION BY LANGUAGE SPOKEN, U.S., 2015, PERCENT
FOCUS ON NON ENGLISH NON SPANISH SPEAKERS,
PERCENT, 2015
Russian
Italian
PolishPortugueseHindiCantonese
Over 25 million people speak a language other than English or Spanish at home
Other than English or Spanish,6 languages had 1 million speakers, 14 languages had over 0.5 million speakers and over 300 other languages are spoken in the US
• 3 million Chinese speakers, including 2.3 million Mandarin speakers and 0.5 million Cantonese speakers
• Over 1.6 million Tagalog speakers
• Over 1.4 million Vietnamese speakers
• Over 1.3 million French speakers
• Over 1.1 million Korean speakers
• Over 1.0 million German speakers
Over 25 million people speak English “less than very well” in the US (65% of which speak Spanish at home)
• 44% of people speaking Spanish at home speak English less than very well (vs. 38% on average for people speaking a language other than English or Spanish)
2.3M Mandarin speakers in 2015
~ Number of Hispanic Spanish speakers in 1940
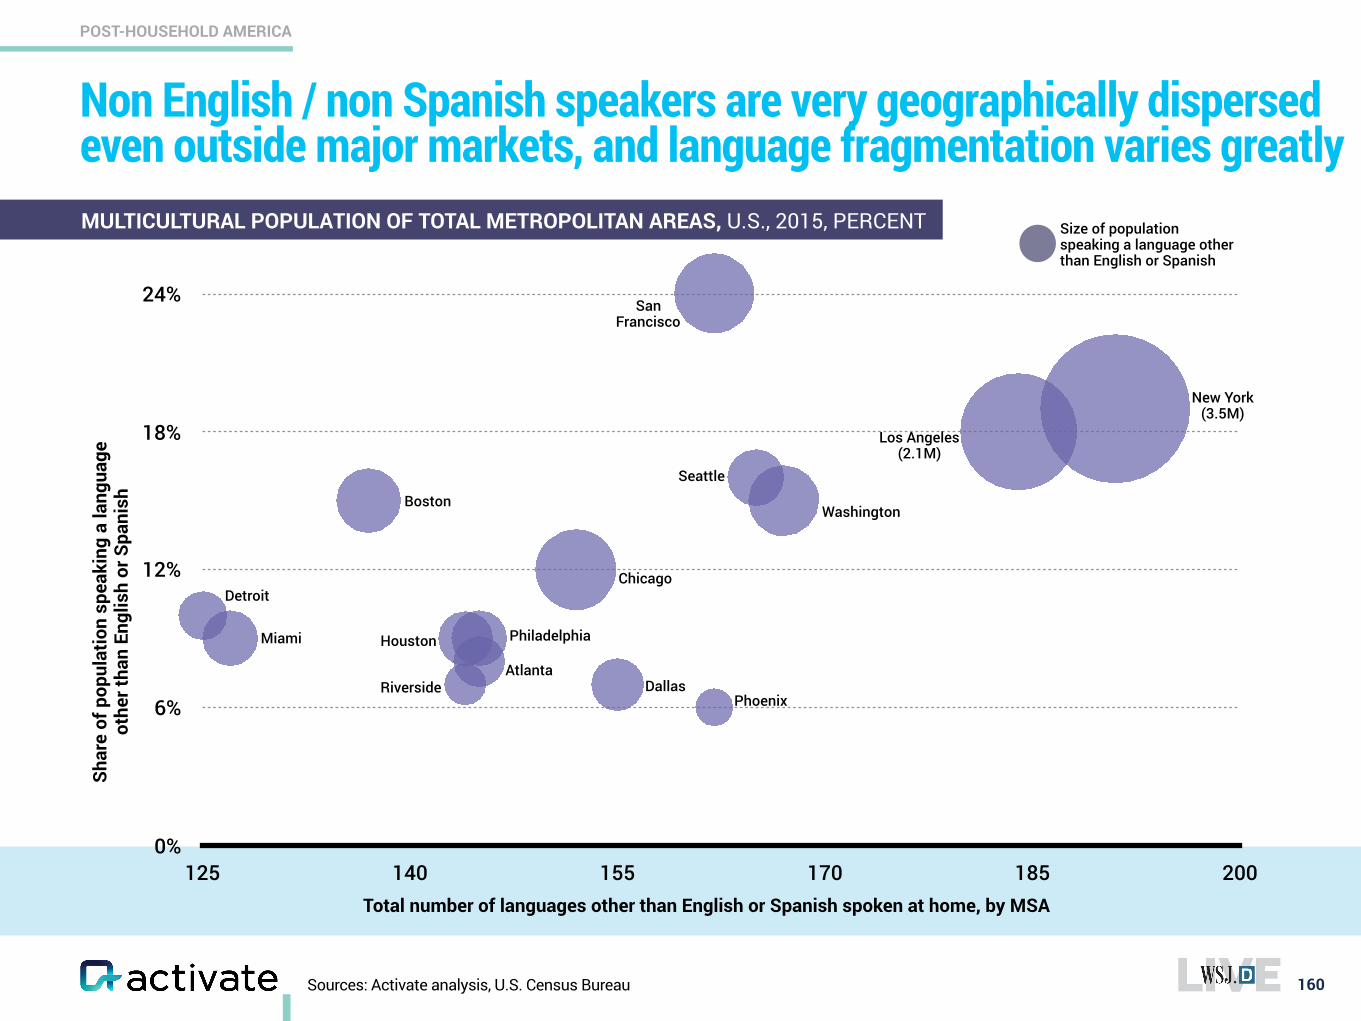
Non English / non Spanish speakers are very geographically dispersed even outside major markets, and language fragmentation varies greatly
160
POST-HOUSEHOLD AMERICA
0%
6%
12%
18%
24%
125 140 155 170 185 200
Shar
e of
pop
ulat
ion
spea
king
a la
ngua
ge
othe
r tha
n En
glis
h or
Spa
nish
Total number of languages other than English or Spanish spoken at home, by MSA
New York (3.5M)
Los Angeles (2.1M)
Miami
Detroit
Philadelphia
Atlanta
Boston
San Francisco
Riverside
Houston
Dallas
Chicago
Seattle
Washington
Phoenix
Size of population speaking a language other than English or Spanish
MULTICULTURAL POPULATION OF TOTAL METROPOLITAN AREAS, U.S., 2015, PERCENT
Sources: Activate analysis, U.S. Census Bureau
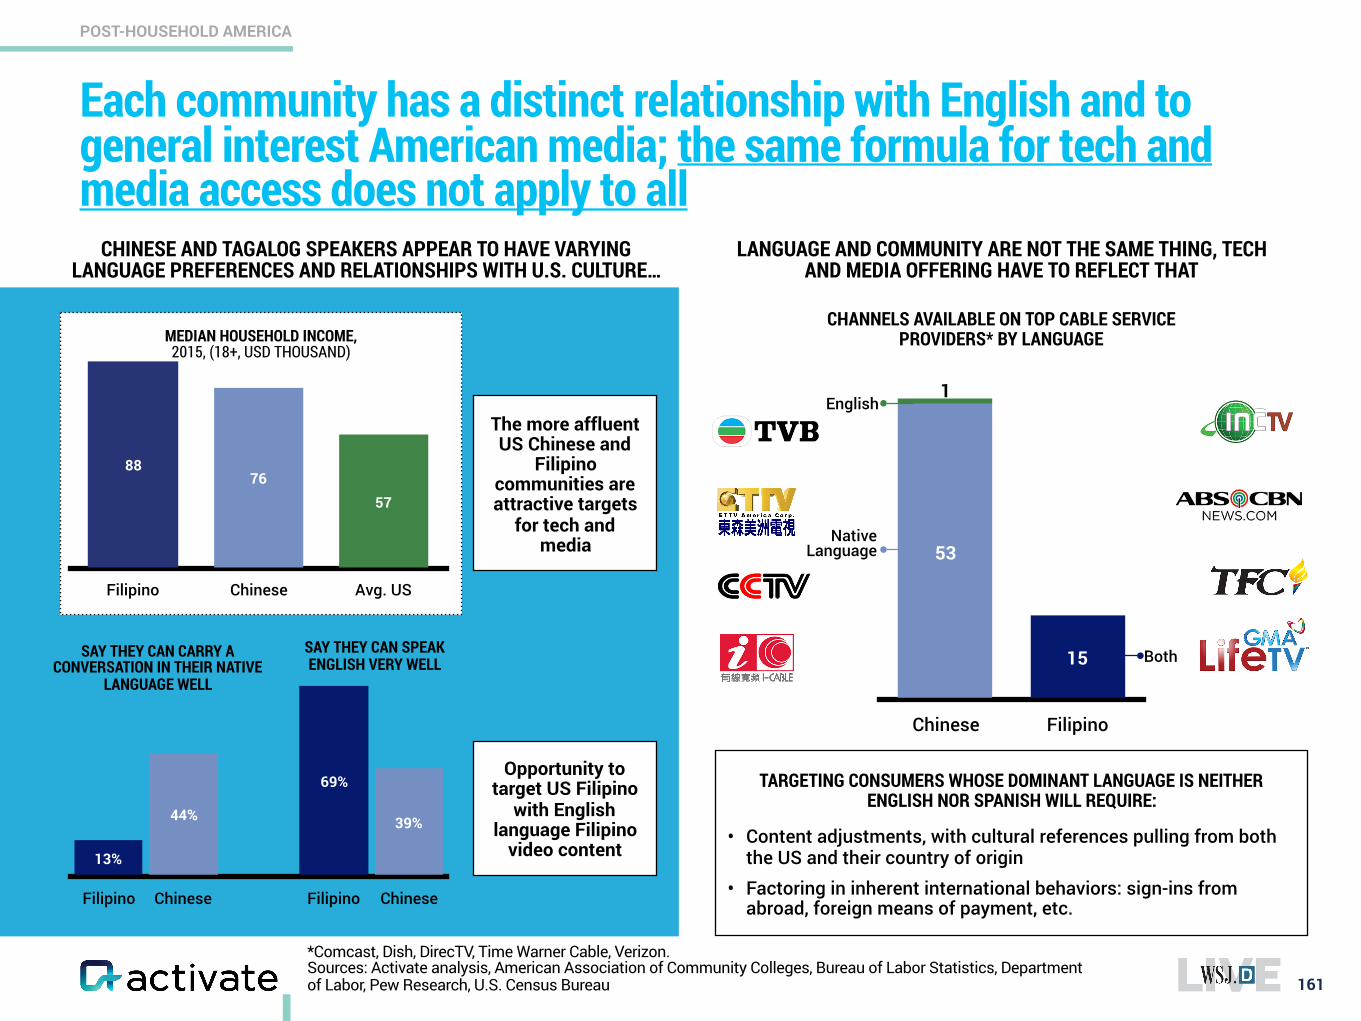
*Comcast, Dish, DirecTV, Time Warner Cable, Verizon. Sources: Activate analysis, American Association of Community Colleges, Bureau of Labor Statistics, Department of Labor, Pew Research, U.S. Census Bureau
Each community has a distinct relationship with English and to general interest American media; the same formula for tech and media access does not apply to all
161
POST-HOUSEHOLD AMERICA
Filipino Chinese Avg. US
5776
88
MEDIAN HOUSEHOLD INCOME, 2015, (18+, USD THOUSAND)
Chinese Filipino
1
15
53Native
Language
English
Both
CHANNELS AVAILABLE ON TOP CABLE SERVICE PROVIDERS* BY LANGUAGE
CHINESE AND TAGALOG SPEAKERS APPEAR TO HAVE VARYING LANGUAGE PREFERENCES AND RELATIONSHIPS WITH U.S. CULTURE…
TARGETING CONSUMERS WHOSE DOMINANT LANGUAGE IS NEITHER ENGLISH NOR SPANISH WILL REQUIRE:
• Content adjustments, with cultural references pulling from both the US and their country of origin
• Factoring in inherent international behaviors: sign-ins from abroad, foreign means of payment, etc.
LANGUAGE AND COMMUNITY ARE NOT THE SAME THING, TECH AND MEDIA OFFERING HAVE TO REFLECT THAT
Filipino Chinese Filipino Chinese
39%44%
69%
13%
SAY THEY CAN CARRY A CONVERSATION IN THEIR NATIVE
LANGUAGE WELL
SAY THEY CAN SPEAK ENGLISH VERY WELL
The more affluent US Chinese and
Filipino communities are attractive targets
for tech and media
Opportunity to target US Filipino
with English language Filipino
video content
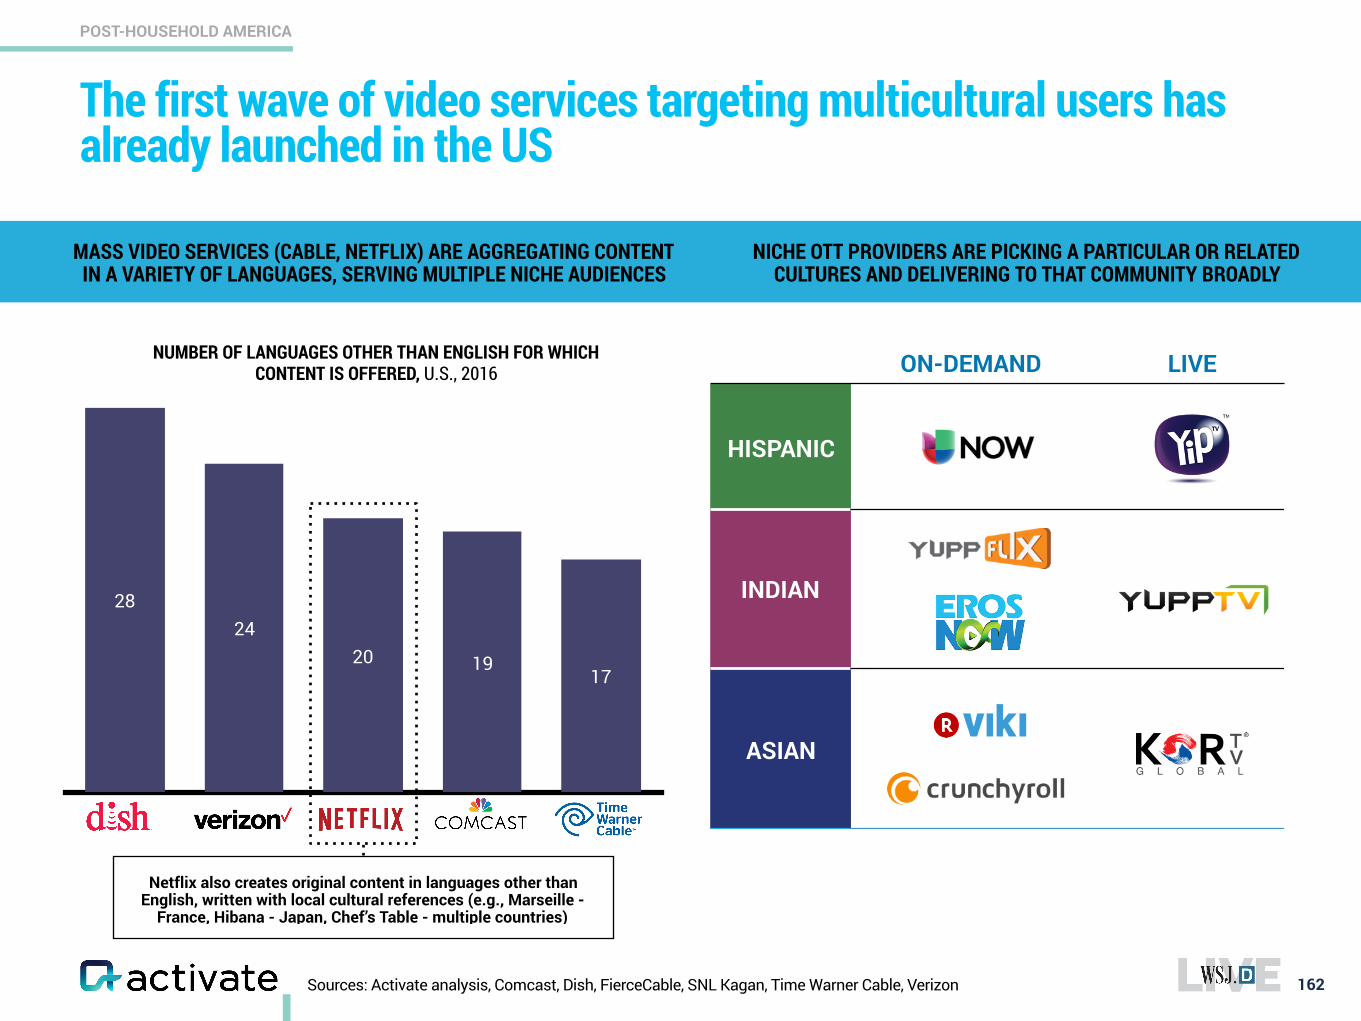
Sources: Activate analysis, Comcast, Dish, FierceCable, SNL Kagan, Time Warner Cable, Verizon
The first wave of video services targeting multicultural users has already launched in the US
162
POST-HOUSEHOLD AMERICA
NICHE OTT PROVIDERS ARE PICKING A PARTICULAR OR RELATED CULTURES AND DELIVERING TO THAT COMMUNITY BROADLY
MASS VIDEO SERVICES (CABLE, NETFLIX) ARE AGGREGATING CONTENT IN A VARIETY OF LANGUAGES, SERVING MULTIPLE NICHE AUDIENCES
HISPANIC
INDIAN
ASIAN
ON-DEMAND LIVE
171920
2428
NUMBER OF LANGUAGES OTHER THAN ENGLISH FOR WHICH CONTENT IS OFFERED, U.S., 2016
Netflix also creates original content in languages other than English, written with local cultural references (e.g., Marseille -
France, Hibana - Japan, Chef’s Table - multiple countries)
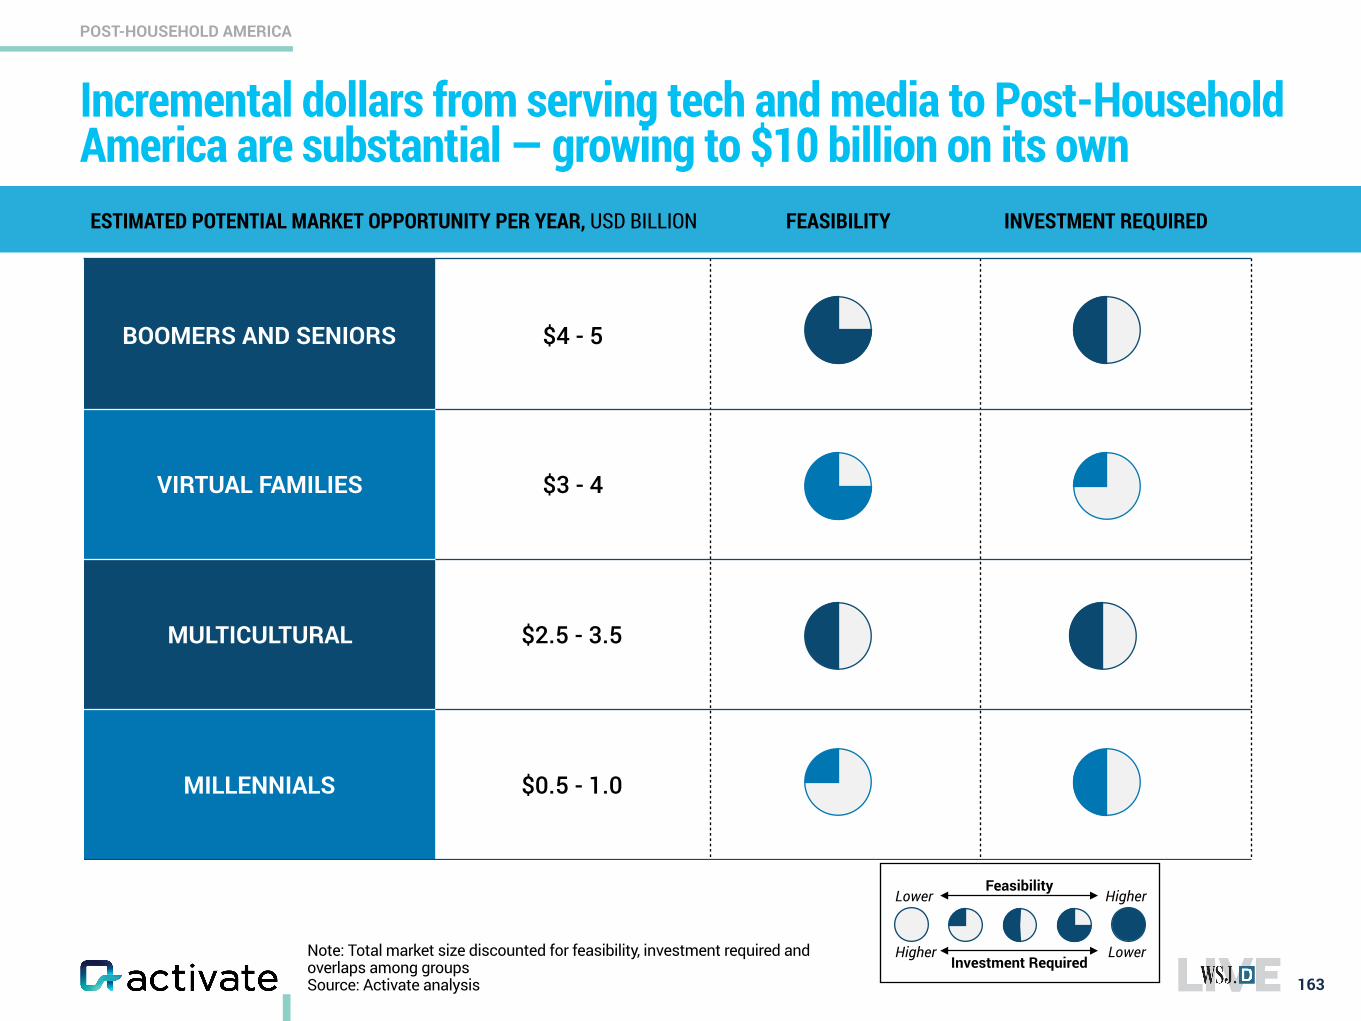
BOOMERS AND SENIORS $4 - 5
VIRTUAL FAMILIES $3 - 4
MULTICULTURAL $2.5 - 3.5
MILLENNIALS $0.5 - 1.0
Incremental dollars from serving tech and media to Post-Household America are substantial — growing to $10 billion on its own
163
POST-HOUSEHOLD AMERICA
Note: Total market size discounted for feasibility, investment required and overlaps among groups Source: Activate analysis
ESTIMATED POTENTIAL MARKET OPPORTUNITY PER YEAR, USD BILLION FEASIBILITY INVESTMENT REQUIRED
Lower HigherFeasibility
Higher LowerInvestment Required
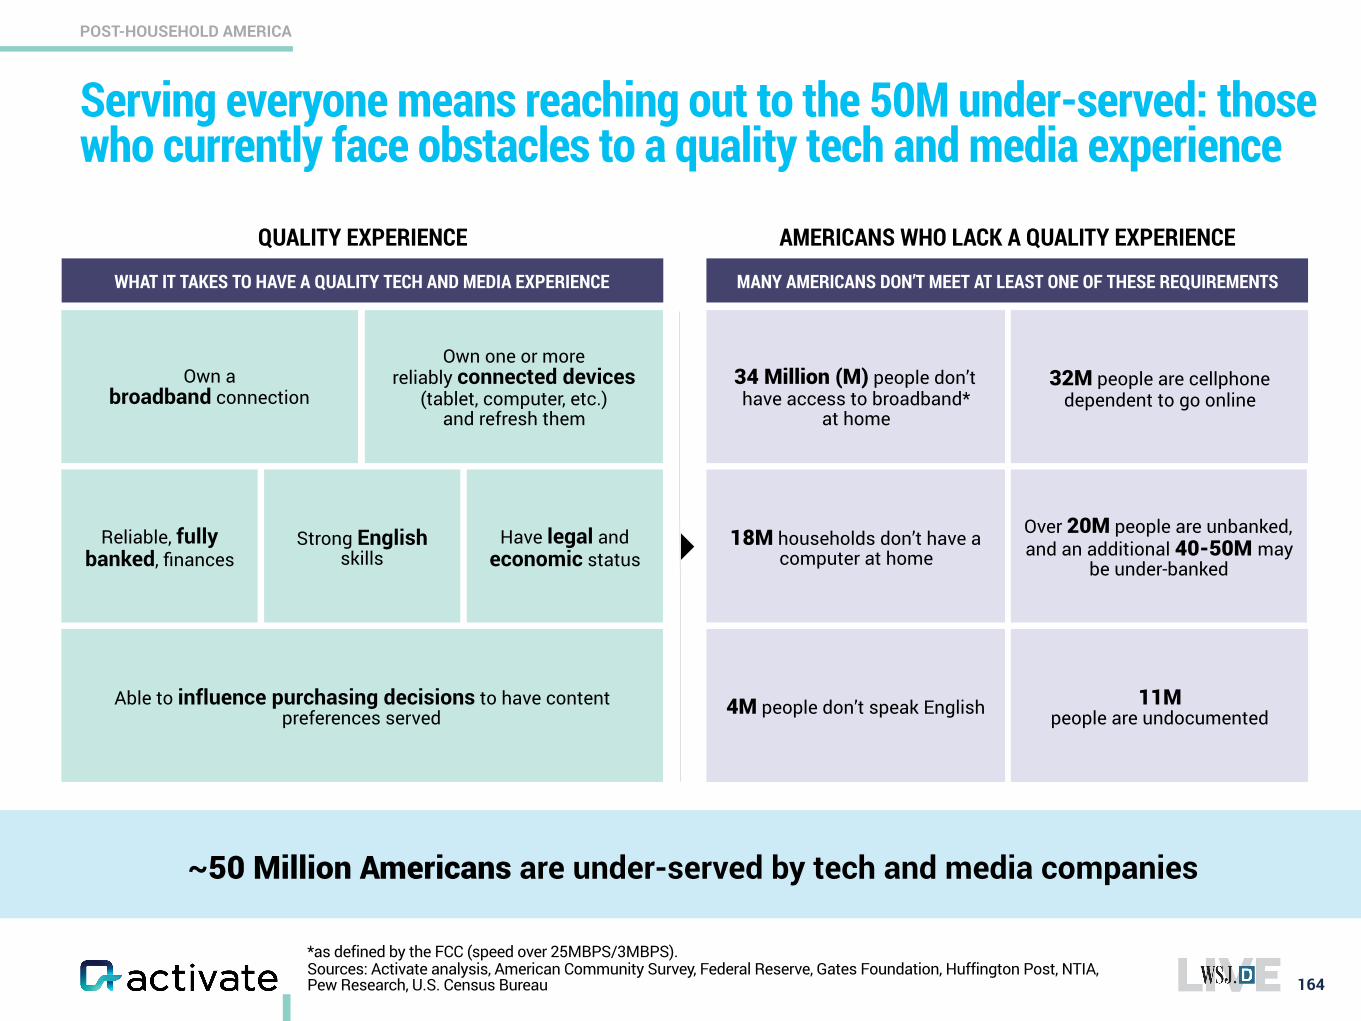
*as defined by the FCC (speed over 25MBPS/3MBPS). Sources: Activate analysis, American Community Survey, Federal Reserve, Gates Foundation, Huffington Post, NTIA, Pew Research, U.S. Census Bureau
Serving everyone means reaching out to the 50M under-served: those who currently face obstacles to a quality tech and media experience
164
POST-HOUSEHOLD AMERICA
WHAT IT TAKES TO HAVE A QUALITY TECH AND MEDIA EXPERIENCE MANY AMERICANS DON’T MEET AT LEAST ONE OF THESE REQUIREMENTS
~50 Million Americans are under-served by tech and media companies
Own a broadband connection
Own one or more reliably connected devices
(tablet, computer, etc.) and refresh them
Reliable, fully banked, finances
Strong English skills
Have legal and economic status
Able to influence purchasing decisions to have content preferences served
34 Million (M) people don’t have access to broadband*
at home
32M people are cellphone dependent to go online
18M households don’t have a computer at home
Over 20M people are unbanked, and an additional 40-50M may
be under-banked
4M people don’t speak English 11M people are undocumented
QUALITY EXPERIENCE AMERICANS WHO LACK A QUALITY EXPERIENCE
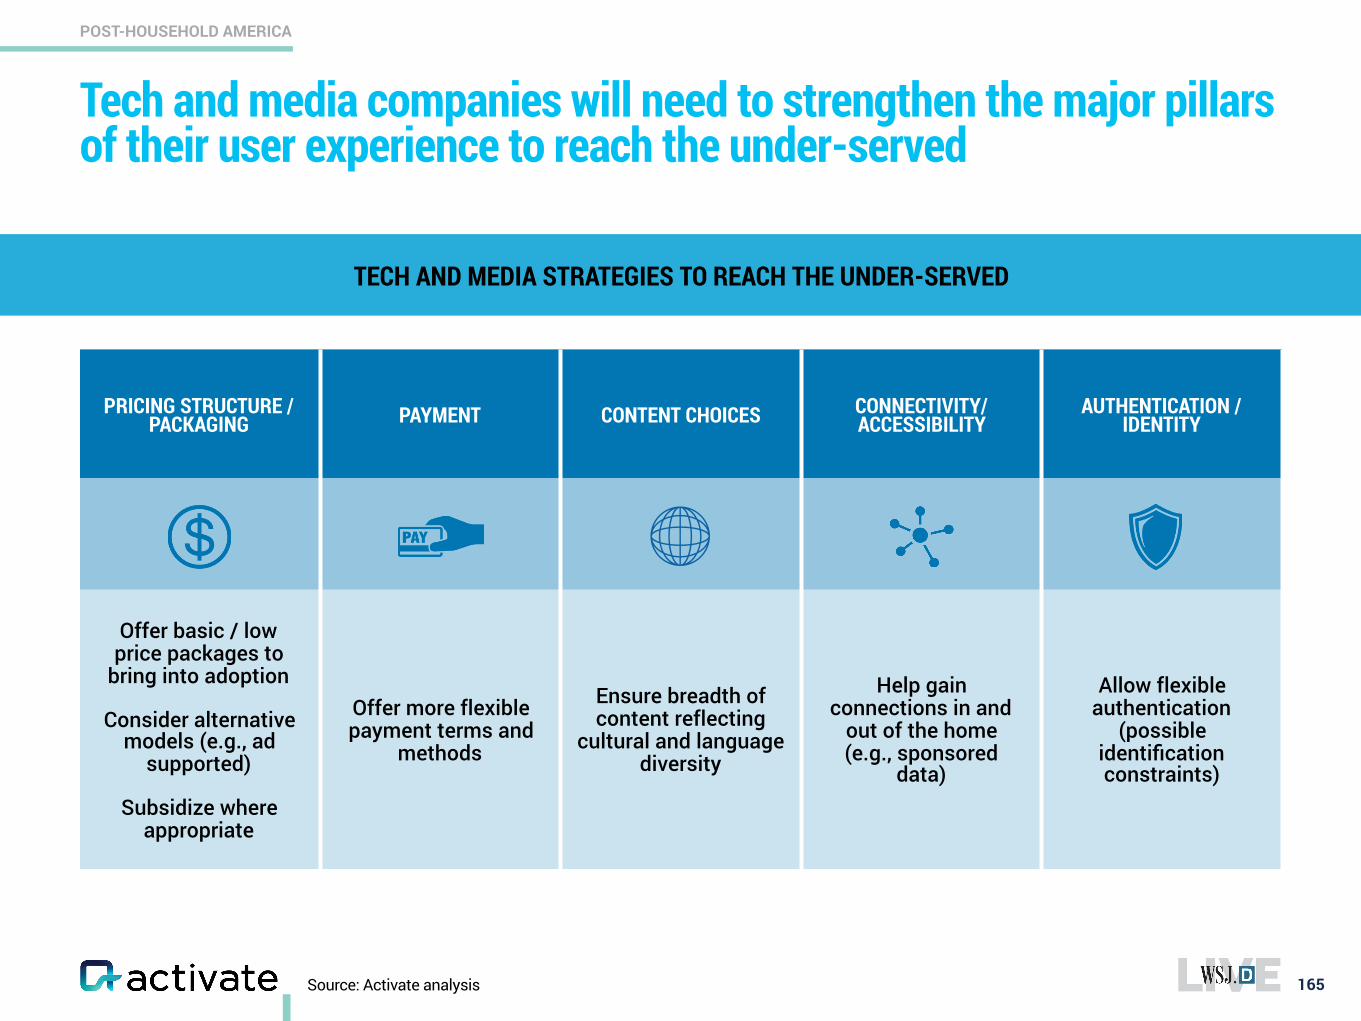
PRICING STRUCTURE / PACKAGING PAYMENT CONTENT CHOICES CONNECTIVITY/
ACCESSIBILITYAUTHENTICATION /
IDENTITY
Offer basic / low price packages to
bring into adoption
Consider alternative models (e.g., ad
supported)
Subsidize where appropriate
Offer more flexible payment terms and
methods
Ensure breadth of content reflecting
cultural and language diversity
Help gain connections in and
out of the home (e.g., sponsored
data)
Allow flexible authentication
(possible identification constraints)
Source: Activate analysis
Tech and media companies will need to strengthen the major pillars of their user experience to reach the under-served
165
POST-HOUSEHOLD AMERICA
TECH AND MEDIA STRATEGIES TO REACH THE UNDER-SERVED
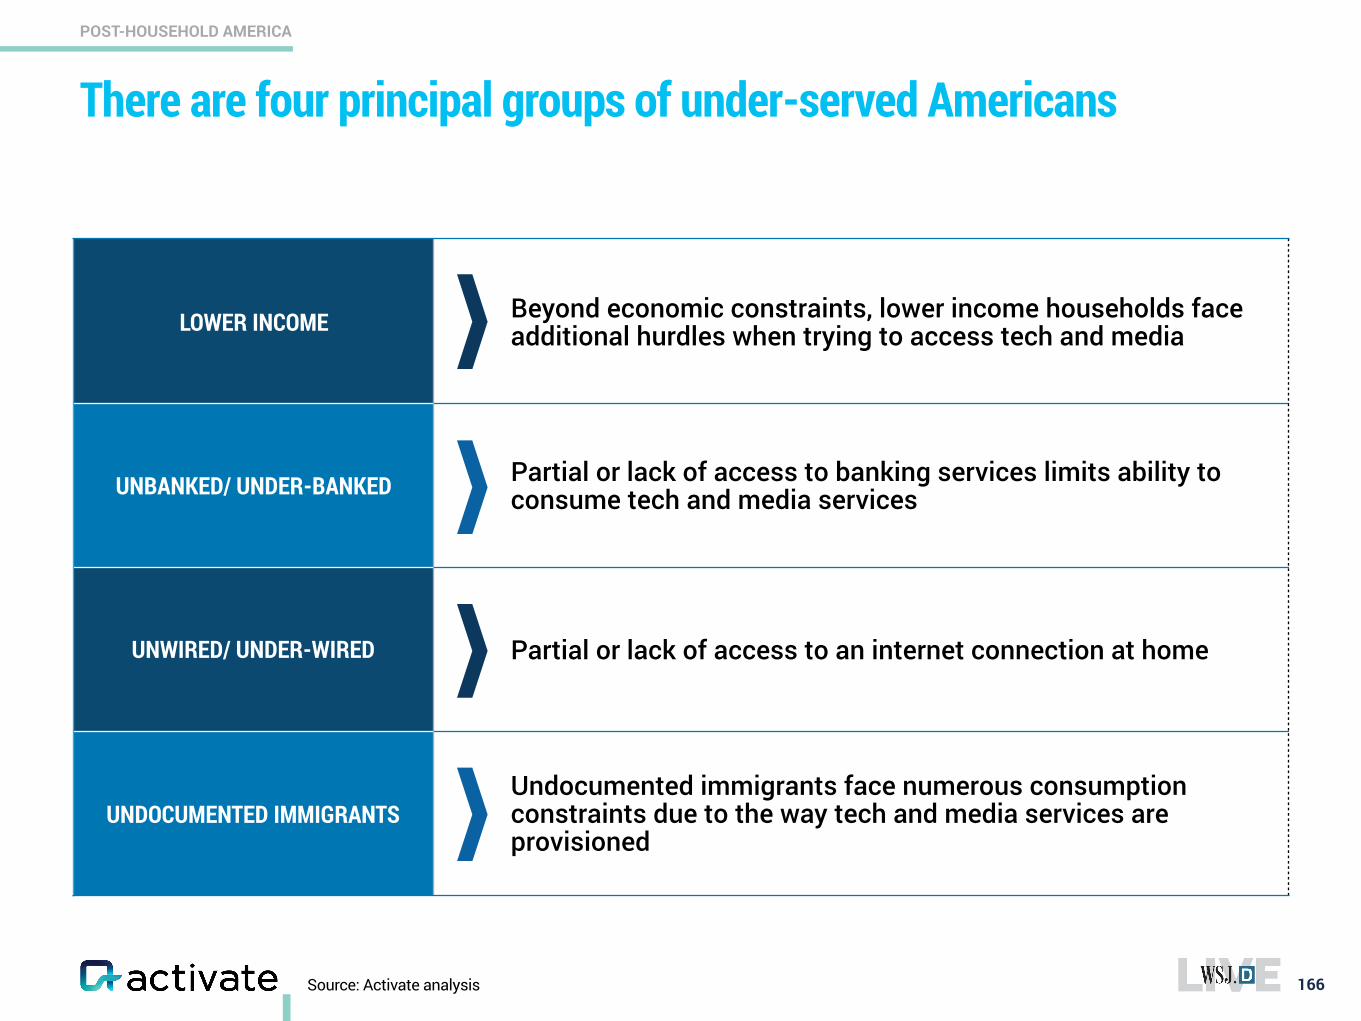
LOWER INCOME Beyond economic constraints, lower income households face additional hurdles when trying to access tech and media
UNBANKED/ UNDER-BANKED Partial or lack of access to banking services limits ability to consume tech and media services
UNWIRED/ UNDER-WIRED Partial or lack of access to an internet connection at home
UNDOCUMENTED IMMIGRANTSUndocumented immigrants face numerous consumption constraints due to the way tech and media services are provisioned
There are four principal groups of under-served Americans
166
POST-HOUSEHOLD AMERICA
Source: Activate analysis
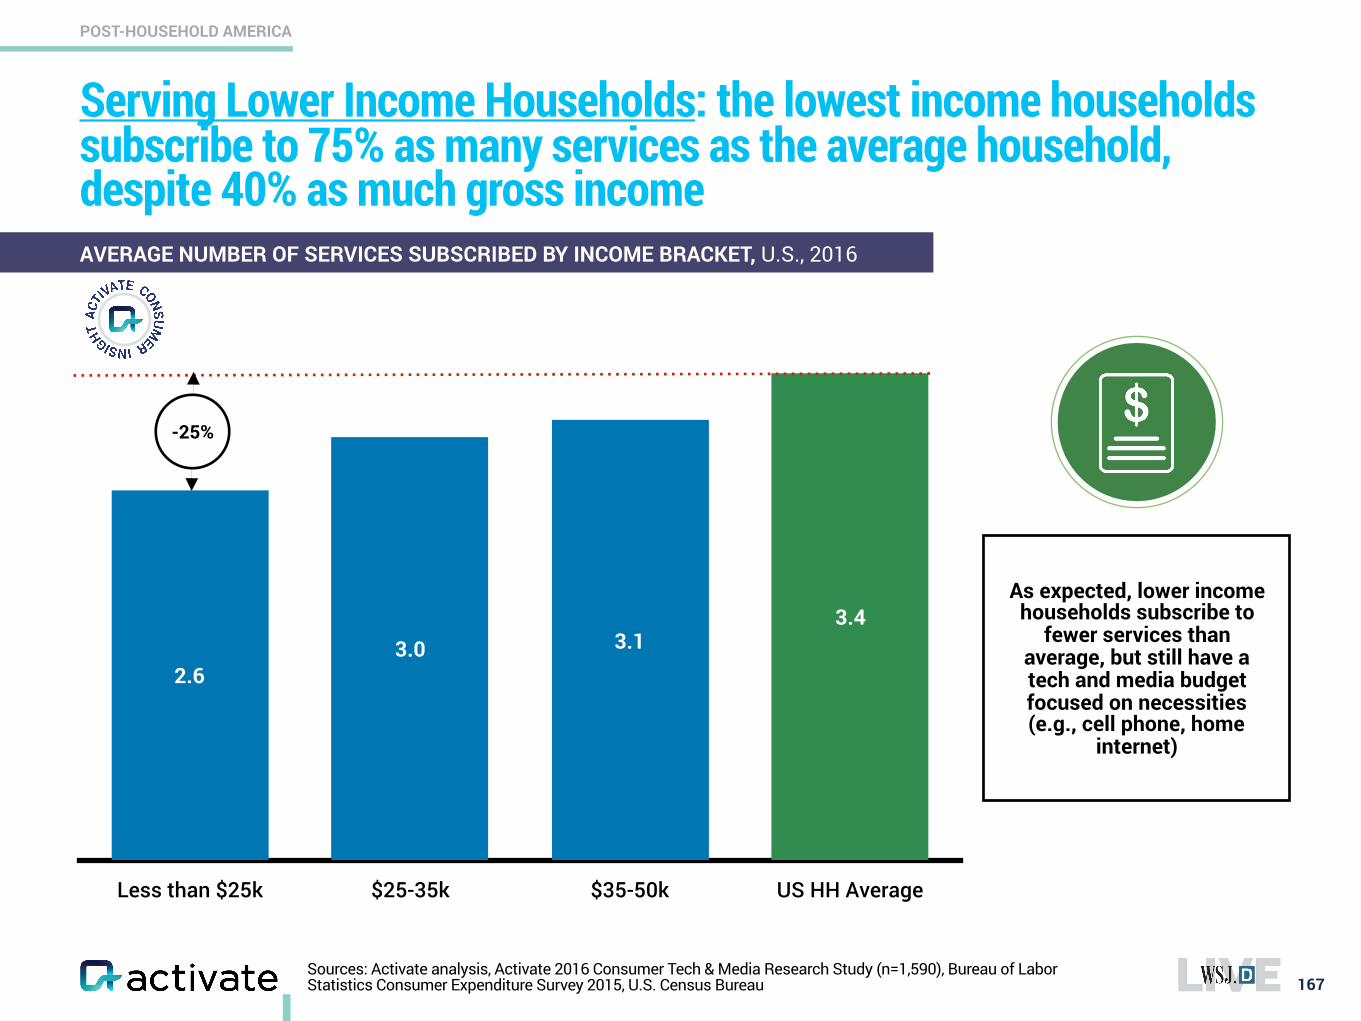
Less than $25k $25-35k $35-50k US HH Average
3.43.13.0
2.6
Serving Lower Income Households: the lowest income households subscribe to 75% as many services as the average household, despite 40% as much gross income
167
POST-HOUSEHOLD AMERICA
Sources: Activate analysis, Activate 2016 Consumer Tech & Media Research Study (n=1,590), Bureau of Labor Statistics Consumer Expenditure Survey 2015, U.S. Census Bureau
AVERAGE NUMBER OF SERVICES SUBSCRIBED BY INCOME BRACKET, U.S., 2016
As expected, lower income households subscribe to
fewer services than average, but still have a tech and media budget focused on necessities (e.g., cell phone, home
internet)
-25%
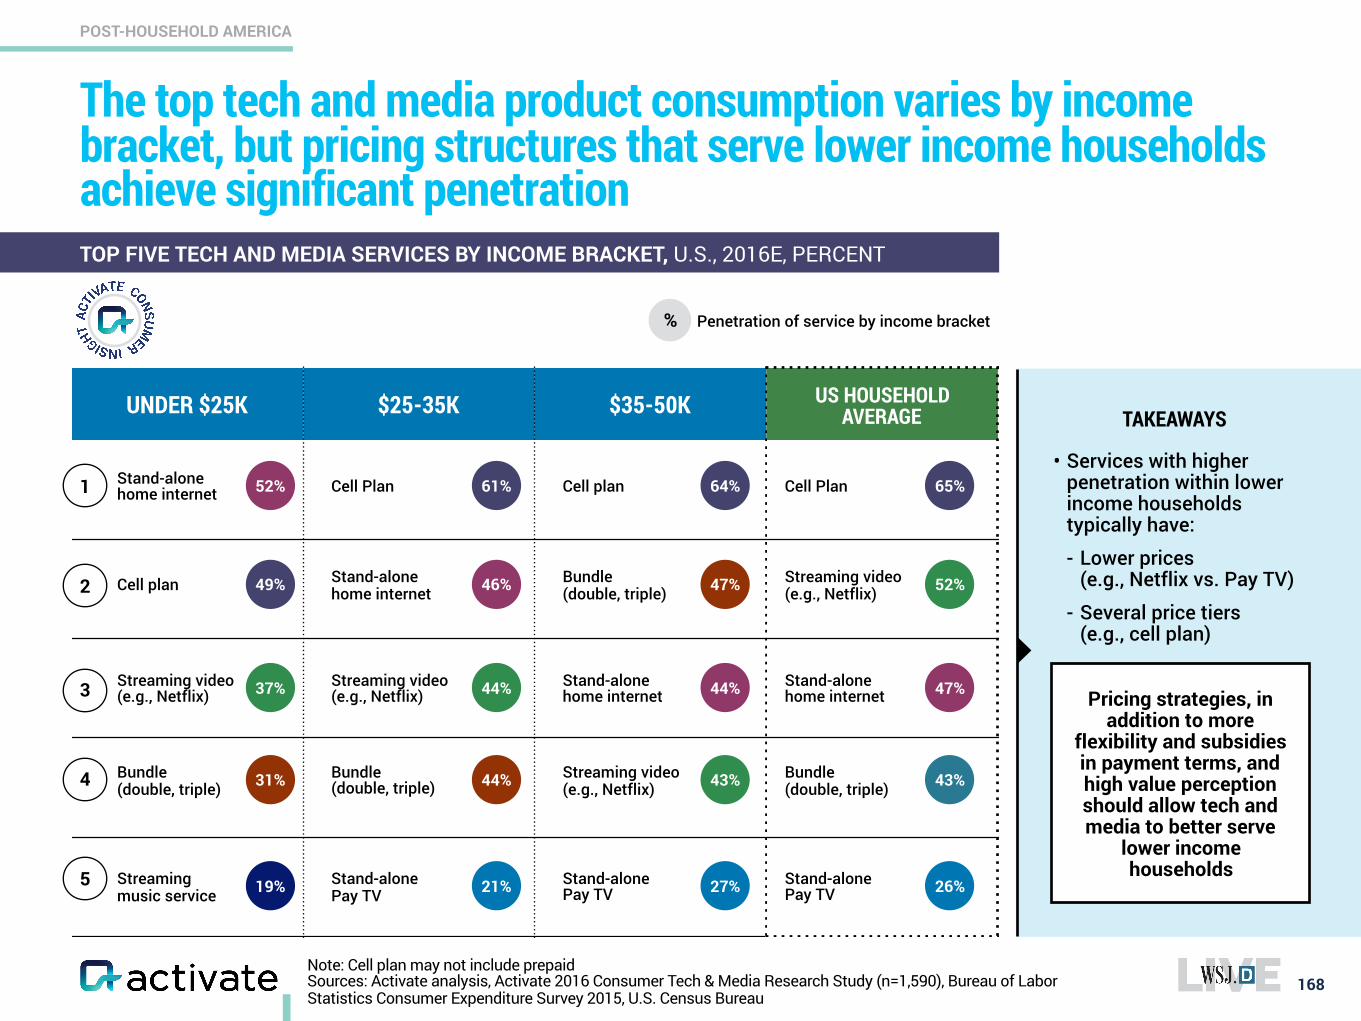
UNDER $25K $25-35K $35-50K US HOUSEHOLD AVERAGE
The top tech and media product consumption varies by income bracket, but pricing structures that serve lower income households achieve significant penetration
168
POST-HOUSEHOLD AMERICA
Cell plan
52%
49%
37%
31%
Cell Plan 61%
46%
44%
44%
64%
47%
43%
44%
Cell plan• Services with higher
penetration within lower income households typically have:
- Lower prices(e.g., Netflix vs. Pay TV)
- Several price tiers (e.g., cell plan)
Cell Plan 65%
52%
47%
43%
Stand-alone home internet
Bundle (double, triple)
Stand-alone home internet
Bundle (double, triple)
Stand-alone home internet
Bundle (double, triple)
Bundle (double, triple)
Stand-alone home internet Pricing strategies, in
addition to more flexibility and subsidies in payment terms, and high value perception should allow tech and media to better serve
lower income households
Note: Cell plan may not include prepaid Sources: Activate analysis, Activate 2016 Consumer Tech & Media Research Study (n=1,590), Bureau of Labor Statistics Consumer Expenditure Survey 2015, U.S. Census Bureau
TOP FIVE TECH AND MEDIA SERVICES BY INCOME BRACKET, U.S., 2016E, PERCENT
Penetration of service by income bracket
Streaming video (e.g., Netflix)
Streaming video (e.g., Netflix)
Streaming video (e.g., Netflix)
Streaming music service 19% Stand-alone
Pay TV 21% Stand-alone Pay TV 27% Stand-alone
Pay TV
TAKEAWAYS
%
Streaming video (e.g., Netflix)
26%
1
2
3
4
5
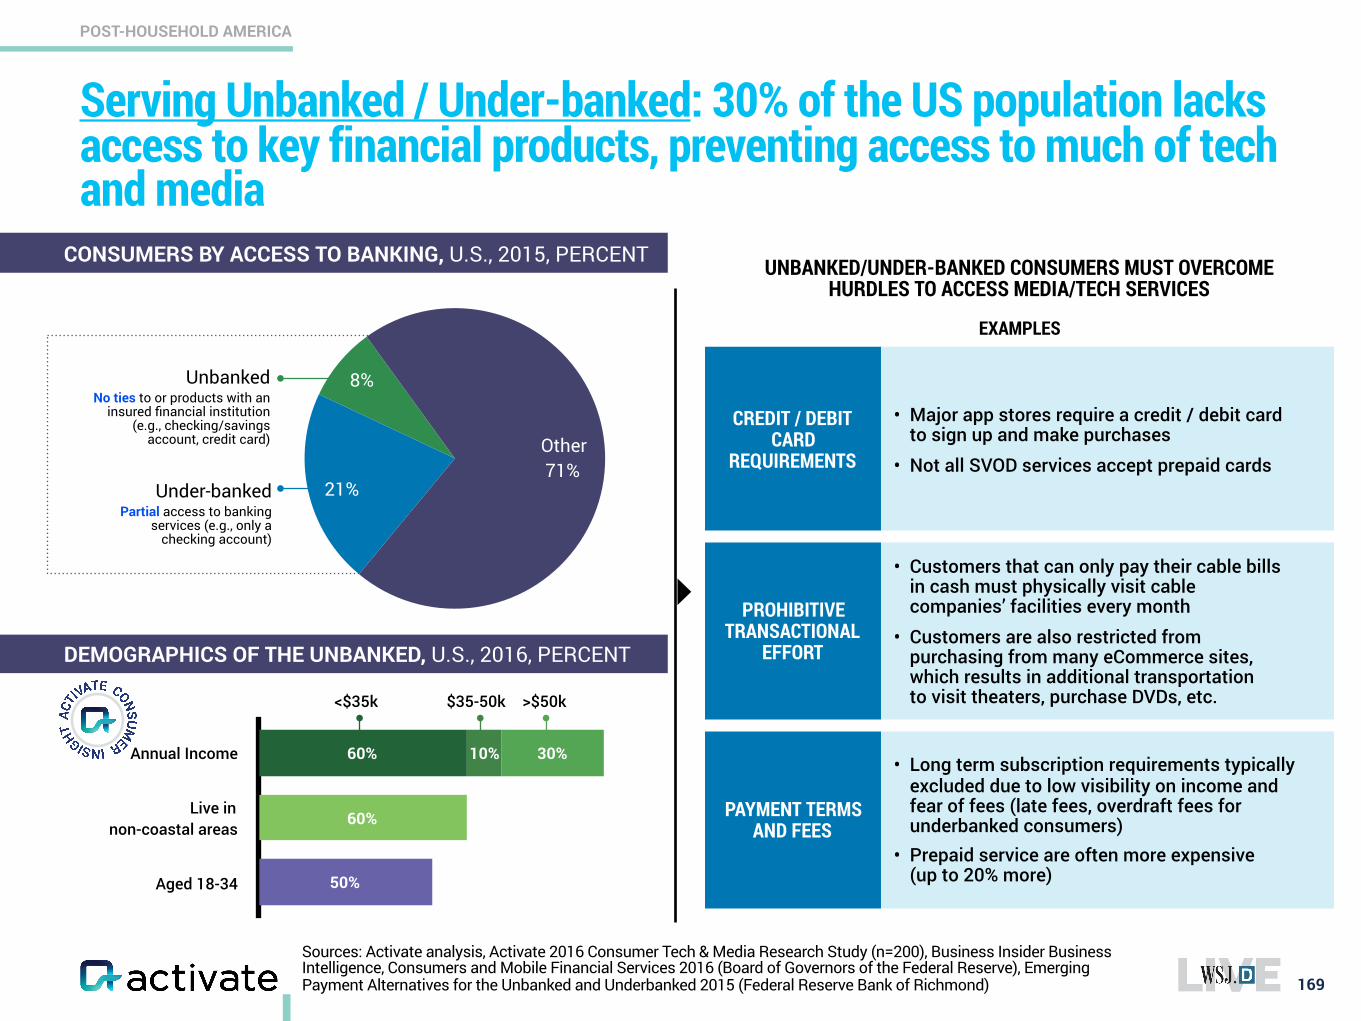
Serving Unbanked / Under-banked: 30% of the US population lacks access to key financial products, preventing access to much of tech and media
169
POST-HOUSEHOLD AMERICA
21%
8%
71%
Unbanked
No ties to or products with an insured financial institution
(e.g., checking/savings account, credit card)
Under-banked
Partial access to banking services (e.g., only a
checking account)
Other
CONSUMERS BY ACCESS TO BANKING, U.S., 2015, PERCENT
DEMOGRAPHICS OF THE UNBANKED, U.S., 2016, PERCENT
EXAMPLES
CREDIT / DEBIT CARD
REQUIREMENTS
• Major app stores require a credit / debit card to sign up and make purchases
• Not all SVOD services accept prepaid cards
PROHIBITIVE TRANSACTIONAL
EFFORT
• Customers that can only pay their cable bills in cash must physically visit cable companies’ facilities every month
• Customers are also restricted from purchasing from many eCommerce sites, which results in additional transportation to visit theaters, purchase DVDs, etc.
PAYMENT TERMS AND FEES
• Long term subscription requirements typically excluded due to low visibility on income and fear of fees (late fees, overdraft fees for underbanked consumers)
• Prepaid service are often more expensive (up to 20% more)
UNBANKED/UNDER-BANKED CONSUMERS MUST OVERCOME HURDLES TO ACCESS MEDIA/TECH SERVICES
Sources: Activate analysis, Activate 2016 Consumer Tech & Media Research Study (n=200), Business Insider Business Intelligence, Consumers and Mobile Financial Services 2016 (Board of Governors of the Federal Reserve), Emerging Payment Alternatives for the Unbanked and Underbanked 2015 (Federal Reserve Bank of Richmond)
<$35k $35-50k >$50k
Annual Income
Live in non-coastal areas
Aged 18-34
30%
50%
60%
10%60%
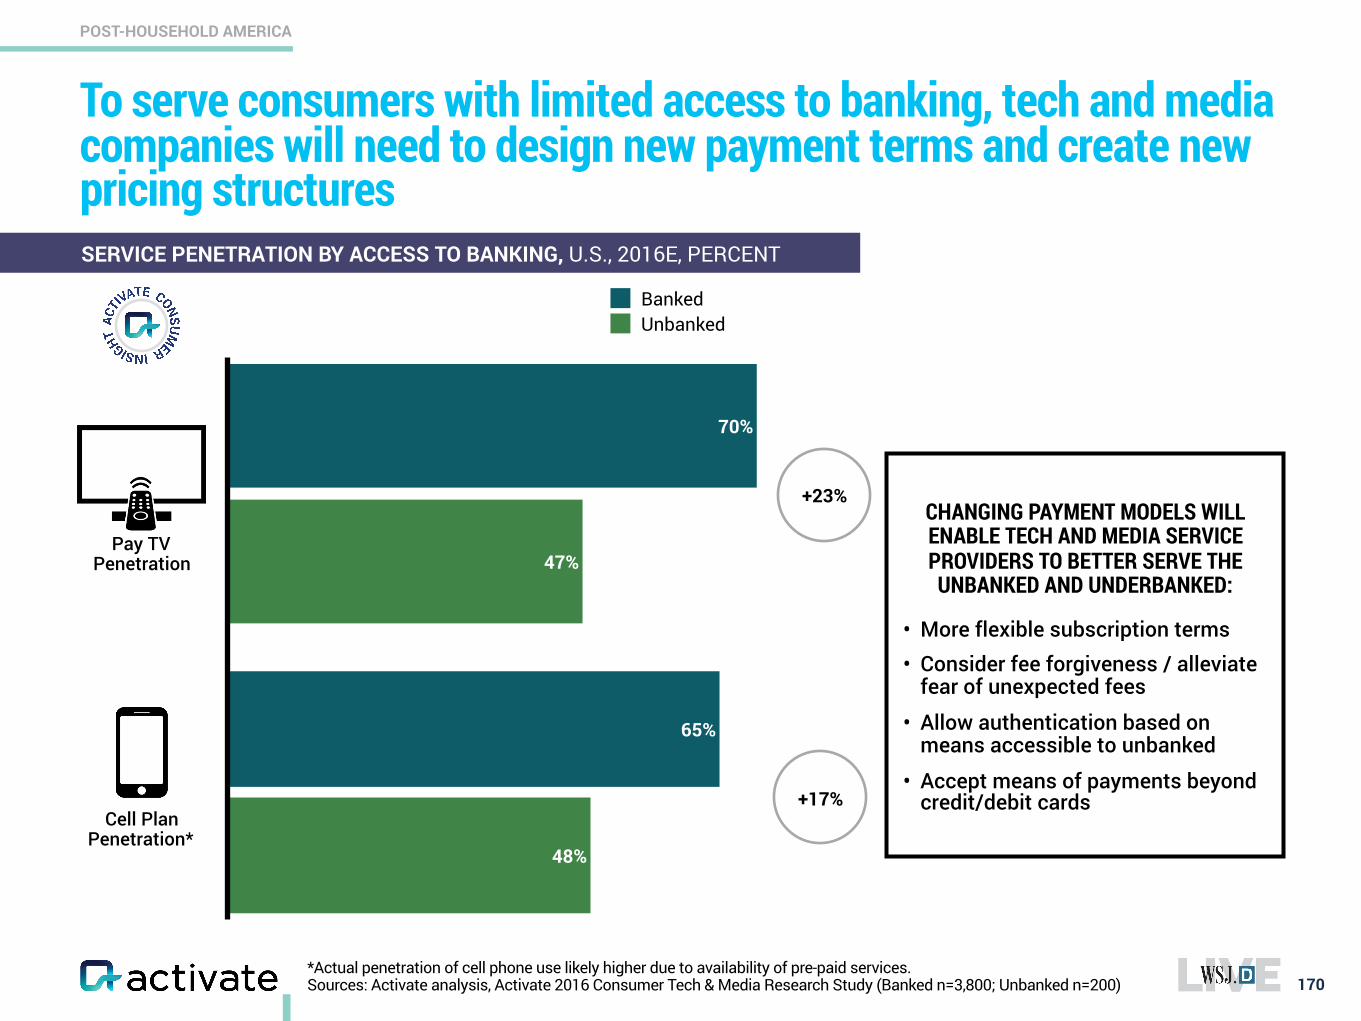
To serve consumers with limited access to banking, tech and media companies will need to design new payment terms and create new pricing structures
170
POST-HOUSEHOLD AMERICA
Pay TV Penetration
Cell Plan Penetration*
SERVICE PENETRATION BY ACCESS TO BANKING, U.S., 2016E, PERCENT
*Actual penetration of cell phone use likely higher due to availability of pre-paid services. Sources: Activate analysis, Activate 2016 Consumer Tech & Media Research Study (Banked n=3,800; Unbanked n=200)
CHANGING PAYMENT MODELS WILL ENABLE TECH AND MEDIA SERVICE PROVIDERS TO BETTER SERVE THE UNBANKED AND UNDERBANKED:
• More flexible subscription terms • Consider fee forgiveness / alleviate
fear of unexpected fees
• Allow authentication based on means accessible to unbanked
• Accept means of payments beyond credit/debit cards
47%
70%
BankedUnbanked
+23%
+17%
48%
65%
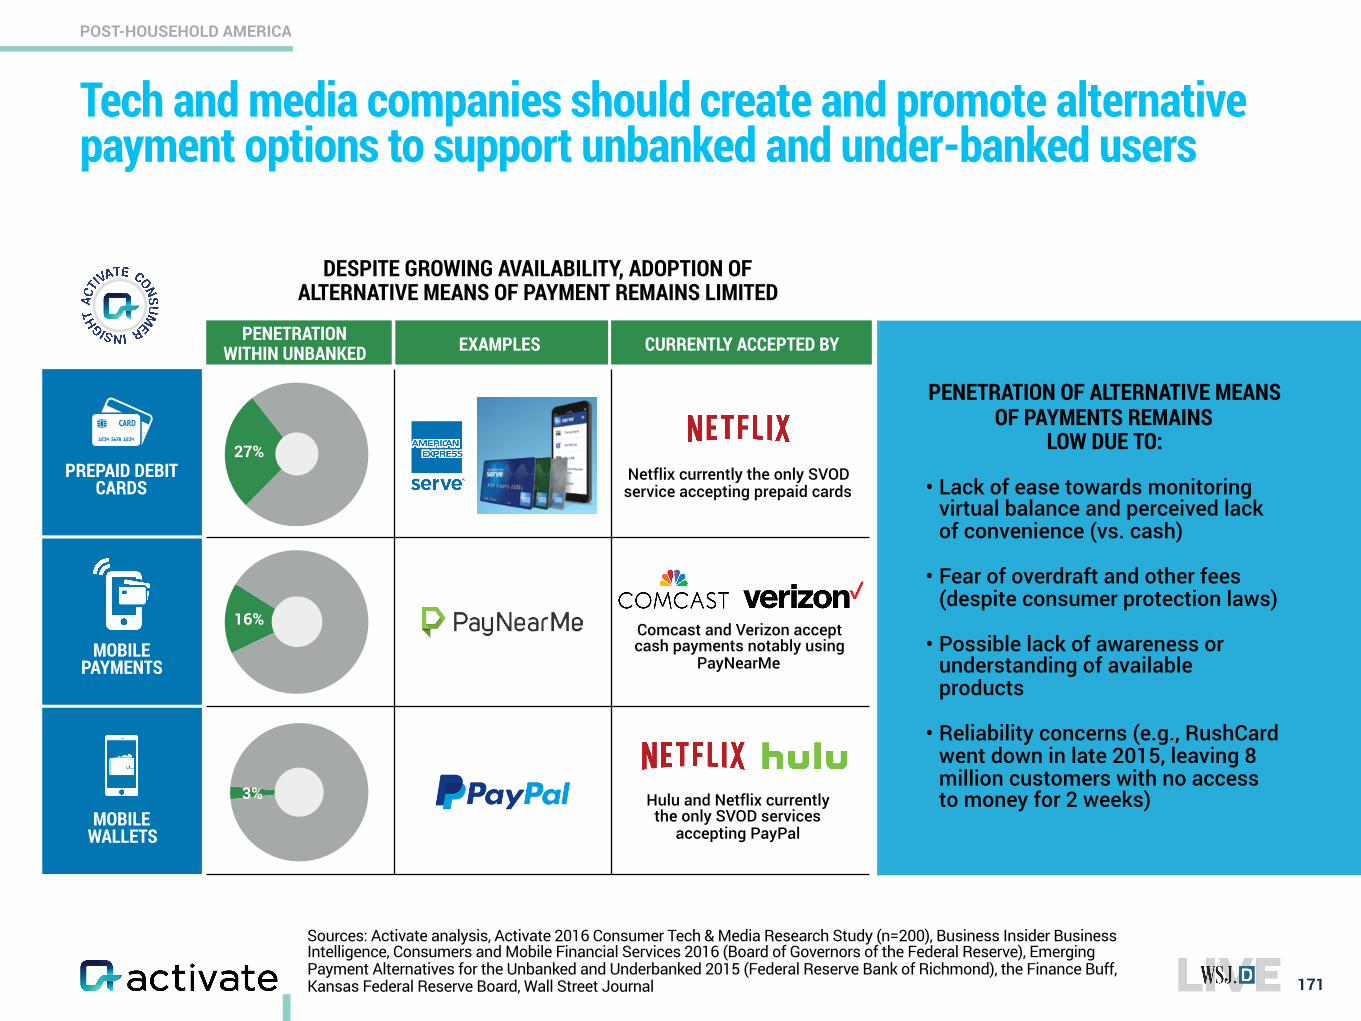
Tech and media companies should create and promote alternative payment options to support unbanked and under-banked users
171
POST-HOUSEHOLD AMERICA
DESPITE GROWING AVAILABILITY, ADOPTION OF ALTERNATIVE MEANS OF PAYMENT REMAINS LIMITED
PENETRATION WITHIN UNBANKED EXAMPLES CURRENTLY ACCEPTED BY
Netflix currently the only SVOD service accepting prepaid cards
Comcast and Verizon accept cash payments notably using
PayNearMe
Hulu and Netflix currently the only SVOD services
accepting PayPal
PENETRATION OF ALTERNATIVE MEANS OF PAYMENTS REMAINS
LOW DUE TO:
• Lack of ease towards monitoring virtual balance and perceived lack of convenience (vs. cash)
• Fear of overdraft and other fees (despite consumer protection laws)
• Possible lack of awareness or understanding of available products
• Reliability concerns (e.g., RushCard went down in late 2015, leaving 8 million customers with no access to money for 2 weeks)
Sources: Activate analysis, Activate 2016 Consumer Tech & Media Research Study (n=200), Business Insider Business Intelligence, Consumers and Mobile Financial Services 2016 (Board of Governors of the Federal Reserve), Emerging Payment Alternatives for the Unbanked and Underbanked 2015 (Federal Reserve Bank of Richmond), the Finance Buff, Kansas Federal Reserve Board, Wall Street Journal
PREPAID DEBIT CARDS
MOBILE PAYMENTS
MOBILE WALLETS
27%
16%
3%
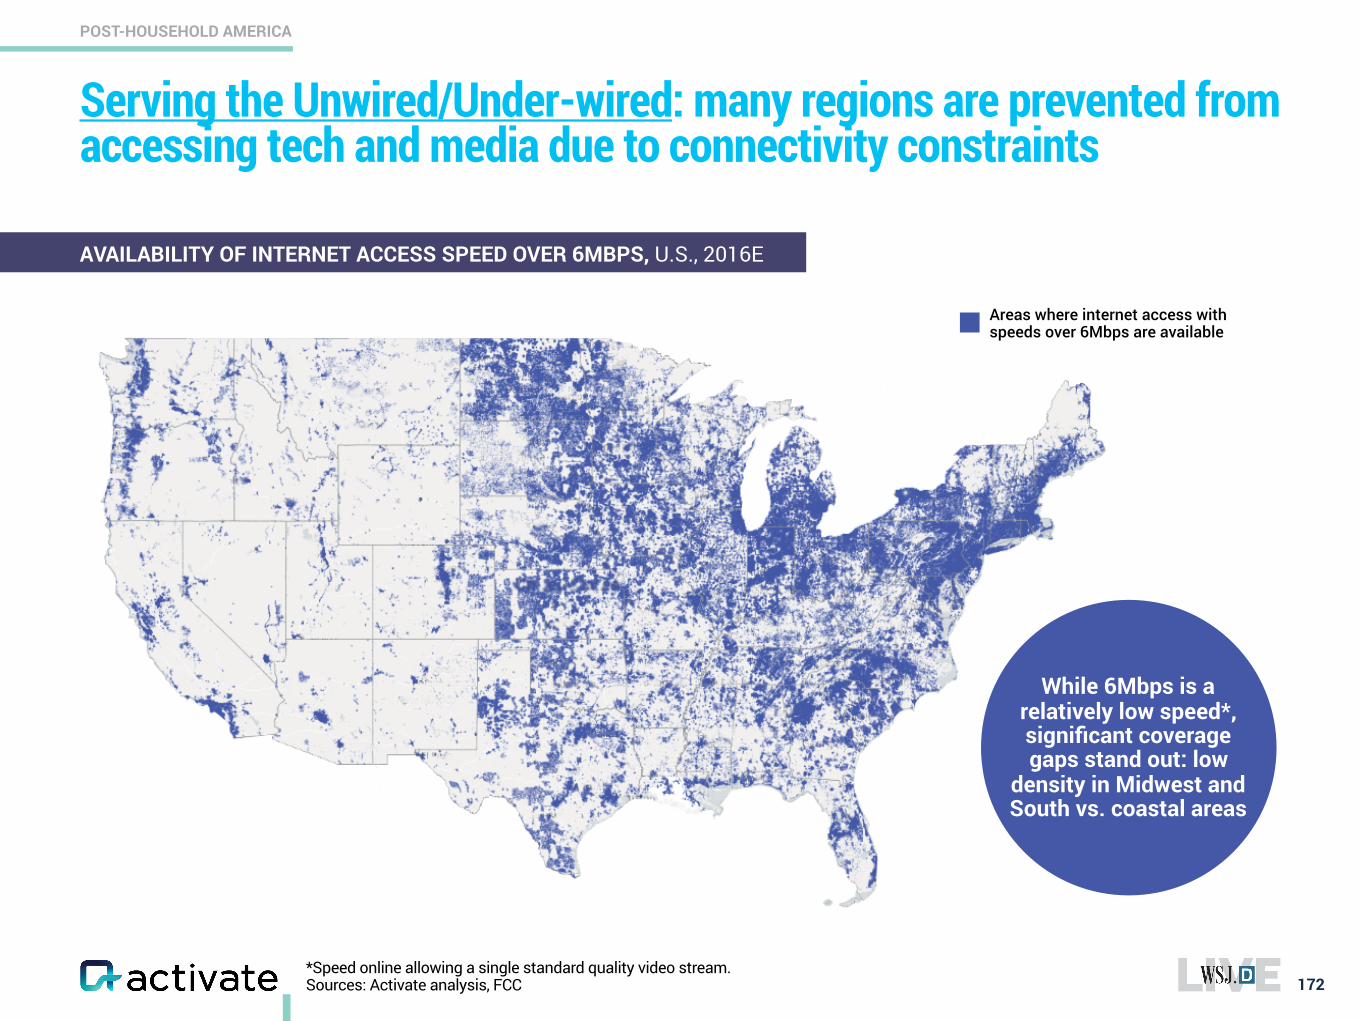
*Speed online allowing a single standard quality video stream. Sources: Activate analysis, FCC
Serving the Unwired/Under-wired: many regions are prevented from accessing tech and media due to connectivity constraints
172
POST-HOUSEHOLD AMERICA
Areas where internet access with speeds over 6Mbps are available
AVAILABILITY OF INTERNET ACCESS SPEED OVER 6MBPS, U.S., 2016E
While 6Mbps is a relatively low speed*, significant coverage gaps stand out: low
density in Midwest and South vs. coastal areas
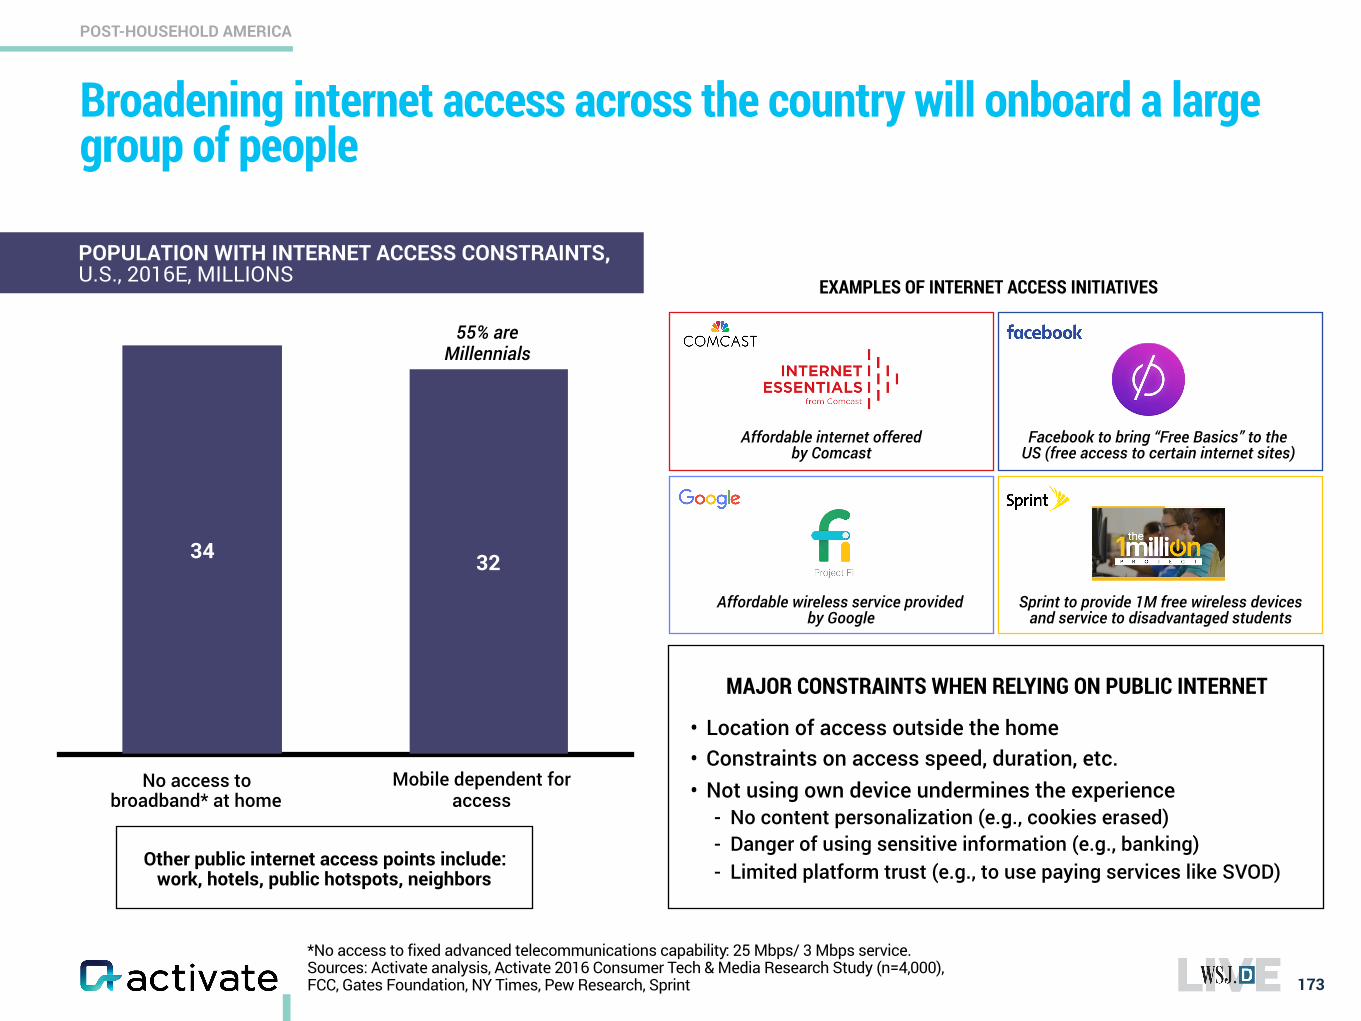
*No access to fixed advanced telecommunications capability: 25 Mbps/ 3 Mbps service. Sources: Activate analysis, Activate 2016 Consumer Tech & Media Research Study (n=4,000), FCC, Gates Foundation, NY Times, Pew Research, Sprint
Broadening internet access across the country will onboard a large group of people
173
POST-HOUSEHOLD AMERICA
EXAMPLES OF INTERNET ACCESS INITIATIVES
No access to broadband* at home
Mobile dependent for access
Other public internet access points include: work, hotels, public hotspots, neighbors
MAJOR CONSTRAINTS WHEN RELYING ON PUBLIC INTERNET
• Location of access outside the home • Constraints on access speed, duration, etc. • Not using own device undermines the experience
- No content personalization (e.g., cookies erased) - Danger of using sensitive information (e.g., banking) - Limited platform trust (e.g., to use paying services like SVOD)
Sprint to provide 1M free wireless devices and service to disadvantaged students
Facebook to bring “Free Basics” to the US (free access to certain internet sites)
Affordable internet offered by Comcast
POPULATION WITH INTERNET ACCESS CONSTRAINTS, U.S., 2016E, MILLIONS
Affordable wireless service provided by Google
3234
55% are Millennials
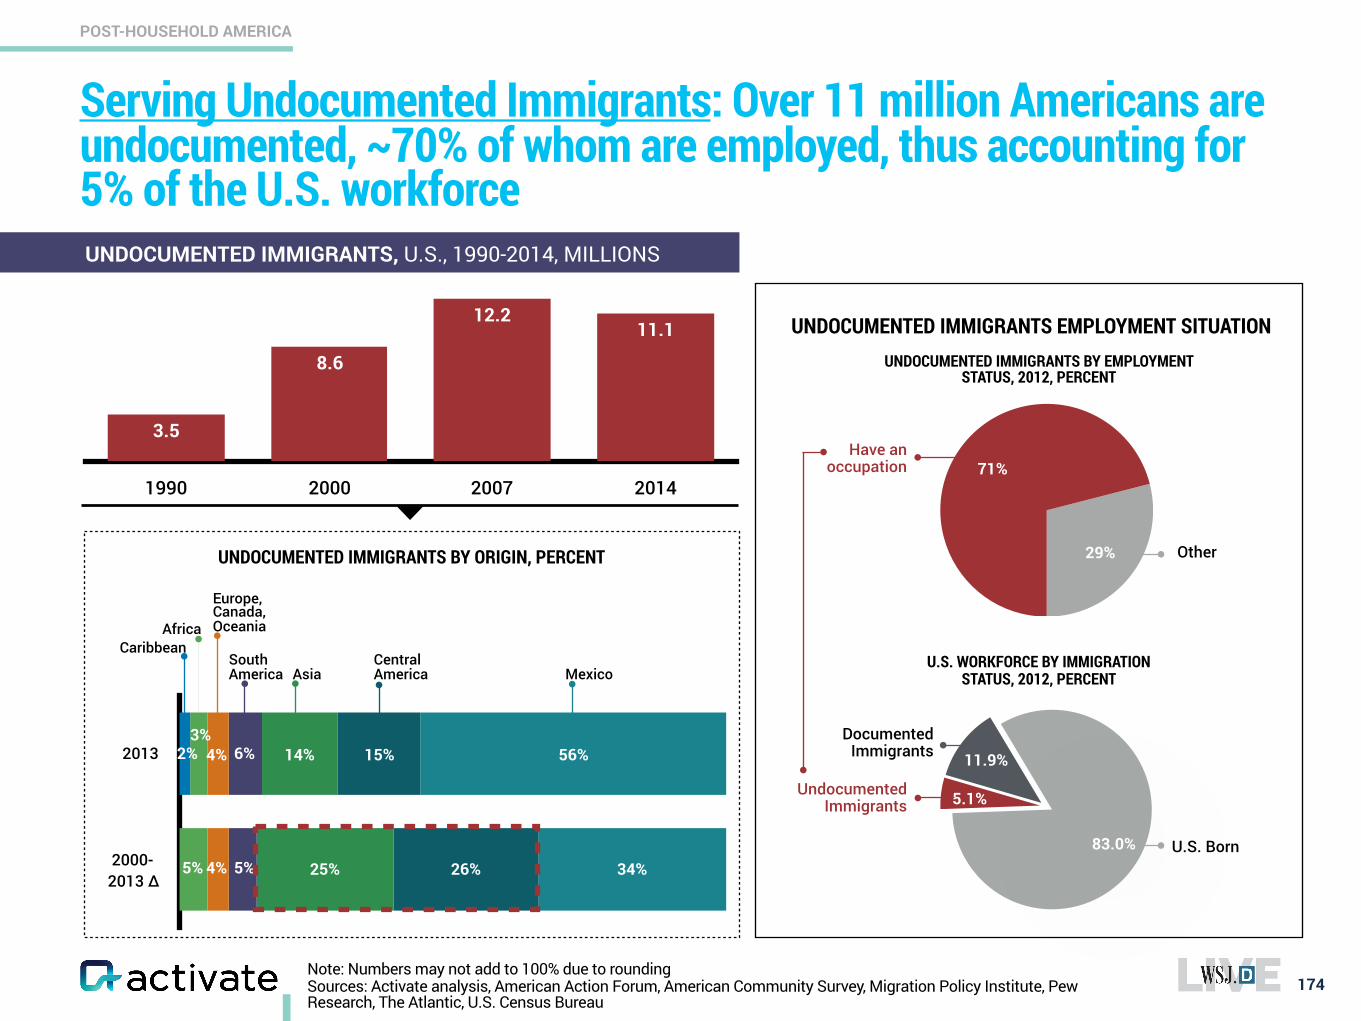
Note: Numbers may not add to 100% due to rounding Sources: Activate analysis, American Action Forum, American Community Survey, Migration Policy Institute, Pew Research, The Atlantic, U.S. Census Bureau
Serving Undocumented Immigrants: Over 11 million Americans are undocumented, ~70% of whom are employed, thus accounting for 5% of the U.S. workforce
174
POST-HOUSEHOLD AMERICA
Mexico
UNDOCUMENTED IMMIGRANTS BY ORIGIN, PERCENT
Central AmericaAsia
South America
Europe, Canada, OceaniaAfrica
Caribbean
1990 2000 2007 2014
11.112.2
8.6
3.5
UNDOCUMENTED IMMIGRANTS, U.S., 1990-2014, MILLIONS
2013
2000-2013 Δ
34%
56%
26%
15%
25%
14%6%4%3%
2%
5%4%5%
UNDOCUMENTED IMMIGRANTS EMPLOYMENT SITUATION
Have an occupation
UNDOCUMENTED IMMIGRANTS BY EMPLOYMENT STATUS, 2012, PERCENT
Other
83.0%
11.9%
5.1%Undocumented Immigrants
Documented Immigrants
U.S. Born
U.S. WORKFORCE BY IMMIGRATION STATUS, 2012, PERCENT
29%
71%
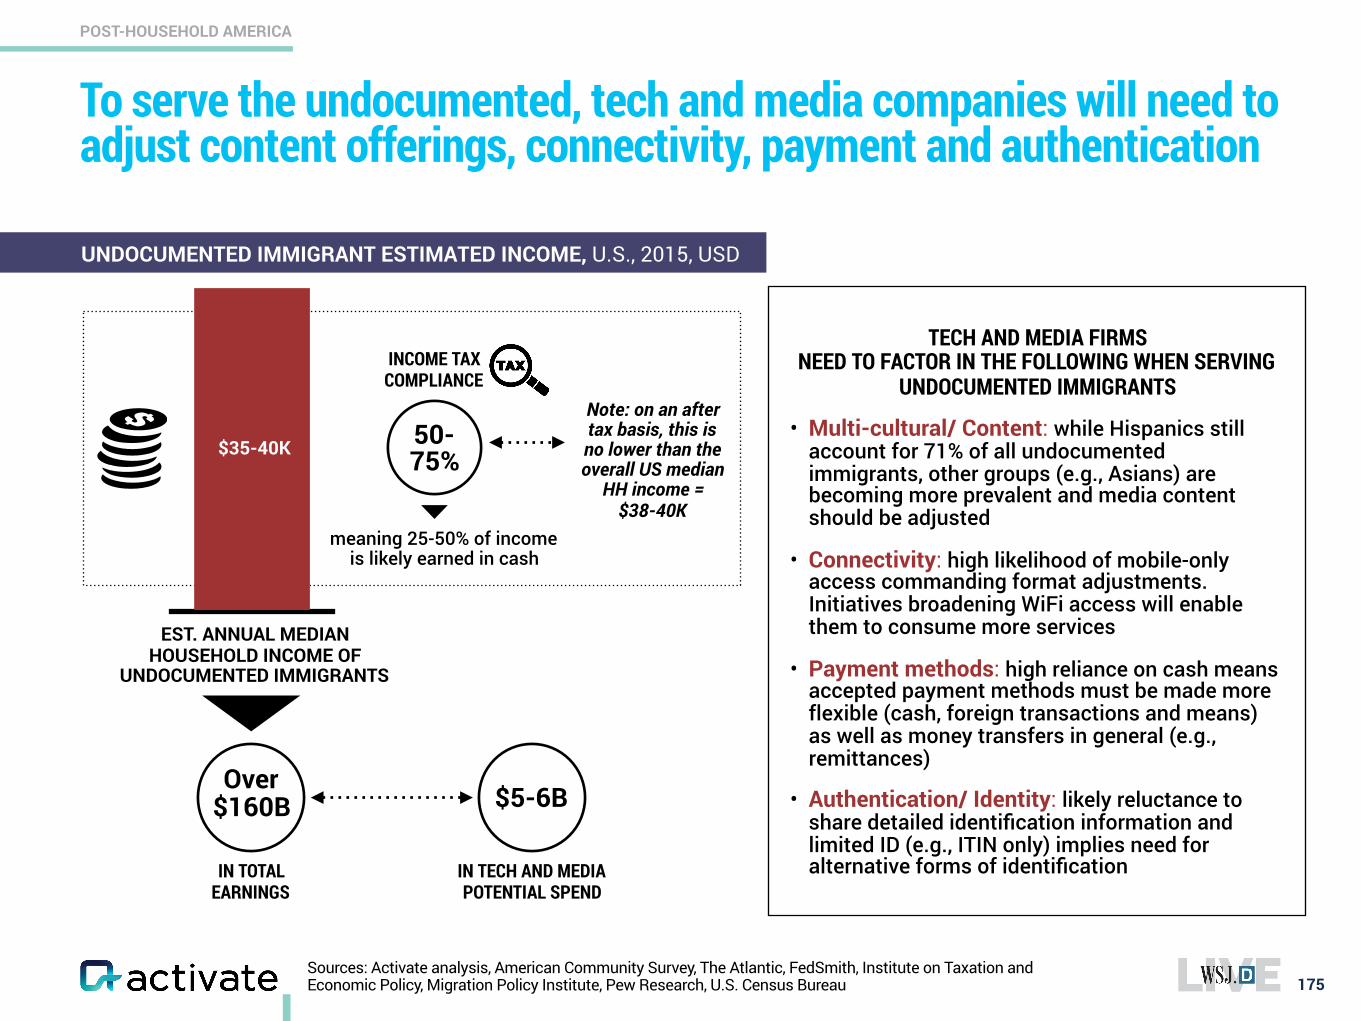
To serve the undocumented, tech and media companies will need to adjust content offerings, connectivity, payment and authentication
175
POST-HOUSEHOLD AMERICA
TECH AND MEDIA FIRMS NEED TO FACTOR IN THE FOLLOWING WHEN SERVING
UNDOCUMENTED IMMIGRANTS
• Multi-cultural/ Content: while Hispanics still account for 71% of all undocumented immigrants, other groups (e.g., Asians) are becoming more prevalent and media content should be adjusted
• Connectivity: high likelihood of mobile-only access commanding format adjustments. Initiatives broadening WiFi access will enable them to consume more services
• Payment methods: high reliance on cash means accepted payment methods must be made more flexible (cash, foreign transactions and means) as well as money transfers in general (e.g., remittances)
• Authentication/ Identity: likely reluctance to share detailed identification information and limited ID (e.g., ITIN only) implies need for alternative forms of identification
EST. ANNUAL MEDIAN HOUSEHOLD INCOME OF
UNDOCUMENTED IMMIGRANTS
INCOME TAX COMPLIANCE
$35-40K
meaning 25-50% of income is likely earned in cash
50-75%
Sources: Activate analysis, American Community Survey, The Atlantic, FedSmith, Institute on Taxation and Economic Policy, Migration Policy Institute, Pew Research, U.S. Census Bureau
Note: on an after tax basis, this is no lower than the overall US median
HH income = $38-40K
Over $160B
IN TOTAL EARNINGS
$5-6B
IN TECH AND MEDIA POTENTIAL SPEND
UNDOCUMENTED IMMIGRANT ESTIMATED INCOME, U.S., 2015, USD
176www.activate.com
CREATED BY Michael J. Wolf Michele Anderson William Bird Anil Dash Michelle Forrest Seref Turkmenoglu Anthony Aguila Sri Narasimhan Samuel Studnia Ellis Bowen David Howard Christopher Meyer Samuel Adams Lauren Libby Rohun Reddy Denise Shea
NEW YORK 156 Fifth Avenue, Penthouse 1 New York, NY 10010 212 316 4444
SAN FRANCISCO 2 Bryant Street, Suite 100 San Francisco, CA 94105 415 385 3725
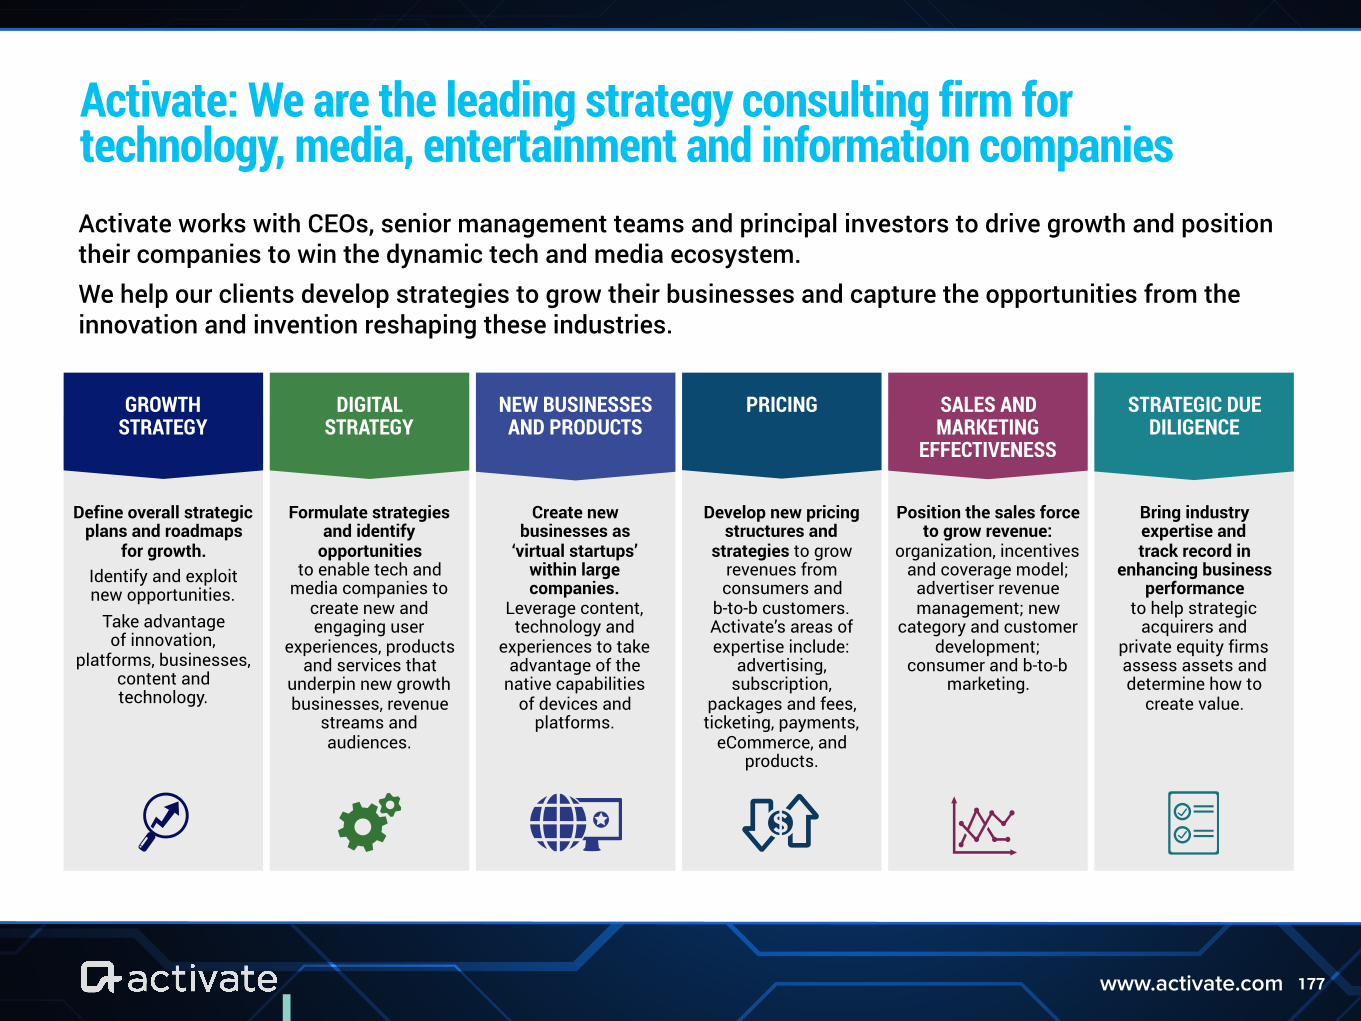
177www.activate.com
Activate: We are the leading strategy consulting firm for technology, media, entertainment and information companies
Create new businesses as
‘virtual startups’ within large companies.
Leverage content, technology and
experiences to take advantage of the
native capabilities of devices and
platforms.
NEW BUSINESSES AND PRODUCTS
Formulate strategies and identify
opportunities to enable tech and
media companies to create new and engaging user
experiences, products and services that
underpin new growth businesses, revenue
streams and audiences.
DIGITAL STRATEGY
Define overall strategic plans and roadmaps
for growth. Identify and exploit new opportunities.
Take advantage of innovation,
platforms, businesses, content and technology.
GROWTH STRATEGY
Develop new pricing structures and
strategies to grow revenues from consumers and
b-to-b customers. Activate’s areas of expertise include:
advertising, subscription,
packages and fees, ticketing, payments,
eCommerce, and products.
PRICING
Position the sales force to grow revenue:
organization, incentives and coverage model;
advertiser revenue management; new
category and customer development;
consumer and b-to-b marketing.
SALES AND MARKETING
EFFECTIVENESS
Bring industry expertise and track record in
enhancing business performance
to help strategic acquirers and
private equity firms assess assets and determine how to
create value.
STRATEGIC DUE DILIGENCE
Activate works with CEOs, senior management teams and principal investors to drive growth and position their companies to win the dynamic tech and media ecosystem. We help our clients develop strategies to grow their businesses and capture the opportunities from the innovation and invention reshaping these industries.